Embed Size (px)
Citation preview
UNC Institute for the Environment 1 Introduction
T h e U n i v e r s i t y o f N o r t h C a r o l i n a a t C h a p e l H i l l T h e I n s t i t u t e f o r t h e E n v i r o n m e n t
Incorporating Climate Change into Hazard Mitigation:
An assessment of the Eno-Haw Multijurisdictional Hazard Mitigation Plan
Authors: Rachel Canty, Rachel Crump, Daphne De Leener, Hansen French, Vineet Gopinathan, Alli Haufler, Joanna Matanga, Danielle McLaughlin, Jake Middlebrooks, Kyla Spain, Lauren Speare Advisor: Sierra Woodruff

UNC Institute for the Environment 1 Introduction
TableofContents
INTRODUCTION 1 Purpose and Vision 3 Scope 3 Report Overview 3
HAZARD ASSESSMENT 5 Coastal Storms 7 Winter Weather 9 Extreme Heat 11 Drought 13 Wildfires 14 Tornadoes 15 Thunderstorms/Lightning 16 Hail 18 Flood 19 Dam/Levee Failure 21 Landslides 22
STRATEGIES 23 Improve stormwater management systems: 23 Educate public and supply outreach services: 24 Improve energy security and efficiency: 25 Improve hazard preparedness and response: 26 Update vulnerable facilities, assess infrastructure and address land use codes: 27 Conserve water: 28 Improve alert systems: 28 Enhance and manage vegetation and green areas, with emphasis on implementing green infrastructure: 29 Monitor and address potential disease outbreaks: 29
NEXT STEPS 31
GLOSSARY 32
ABBREVIATIONS 34
WORKS CITED 35
APPENDIX A 41

UNC Institute for the Environment 1 Introduction
INTRODUCTION Climate change is a phenomenon describing, “changes in average weather conditions that persist over multiple decades or longer” (US Global Change Research Program). The most recent National Climate Assessment underlines the immediacy of global climate change; many communities in the United States are already feeling the impacts of climate change. Communities are reporting earlier spring onset, more nuisance flooding, heavier downpours, longer droughts, and more heat waves to name a few (Walsh et al., 2014). Over the last century, Earth’s average temperature has risen 1.5°F. Globally, the atmosphere and oceans have warmed, the amounts of snow and ice have diminished, and sea level has risen. Not only was 2015 the warmest year on record, but also nine of the ten hottest years have occurred since the turn of the century (Ingram et al., 2013; NOAA, 2015). The IPCC concludes that it is undisputable that the global climate is warming. While climate change is frequently discussed as a global issue, many of the impacts will be felt locally. In response, many local governments are beginning to prepare for the impacts of climate change. A 2011 survey of ICLEI members globally found that nearly 40% of the 468 local respondents have conducted or was in the process of conducting a vulnerability or risk assessment to climate change impacts. Of the U.S. respondents (156), the authors found that 27% were in the vulnerability analysis or planning phases (Carmin et al., 2012). Today more than 40 local governments in the U.S. have prepared stand-alone plans to address the impacts of climate change and many more have integrated climate change into comprehensive, sustainability, and hazard mitigation plans. Considering the potential for climate change to increase the frequency and magnitude of natural hazards, states, regions, counties, and municipalities should re-evaluate existing hazard mitigation plans accordingly. In their most recent guide for hazard mitigation planning, the Federal Emergency Management Agency (FEMA) encourages communities to consider climate change in hazard mitigation. The Eno-Haw Regional Hazard Mitigation Plan extensively discusses natural hazards in the region and proposes multiple mitigation strategies. Current mitigation strategies address the following natural hazards: wildfires, drought, tornadoes, thunderstorms, lightning, hail, flood, dam/levee failure, landslides, coastal storms, earthquakes and winter weather.

UNC Institute for the Environment Introduction 2
An Introduction to Climate Change
While natural causes can contribute to climate change, there is widespread scientific consensus that current warming is due to anthropogenic causes, namely the emission of greenhouse gases. Greenhouse gases act like a blanket around Earth, trapping energy in the atmosphere and causing it to warm. This phenomenon is called the greenhouse effect, a process in which greenhouse gases absorb and re-emit infrared radiation from the earth's surface, causing the earth to warm. This is a natural phenomenon and necessary to support life on Earth. However, the buildup of greenhouse gases can change Earth's climate and result in dangerous effects to human health and welfare. Greenhouse gases include carbon dioxide, methane, water vapor, and nitrous oxide. Human activities such as fossil fuel burning and urbanization are major sources of carbon dioxide. Methane, a gas that is twice as potent as carbon dioxide, is released during the decomposition of waste in landfills, as well as agricultural practices. Nitrous oxide is released during soil cultivation practices.
Figure 1. Graphic explaining the greenhouse effect (Marian Koshland Science Museum, 2016)
Due to the long residence time of greenhouse gases in the atmosphere, even if emissions dropped to zero today, we are committed to decades of warming. Rising temperatures are accompanied by changing weather and climate. Higher temperatures also lead to rising sea levels worldwide and the loss of sea ice in the Arctic. Increases in severe weather due to rising temperatures include more intense hurricanes, a longer hurricane season and changing precipitation patterns that cause floods and droughts to increase in frequency and intensity. These changes in severe weather represent increased threats to human health, security, and welfare both globally and here in the United States.
UNC Institute for the Environment Introduction 3
The Eno-Haw Multijurisdictional Hazard Mitigation Plan assesses the future extent and impact of these hazards based on historical data. While climate change was listed as a hazard in the plan, the effects of climate change on natural hazards has not been incorporated.
Purpose and Vision Considering the omission of climate change from the current natural hazard mitigation plan, the purpose of this study is three-fold:
1) Identify the impacts of climate change on natural hazards locally; 2) Assess the ability of current natural hazard mitigation strategies to address
changes in natural hazards; and 3) Propose both novel and innovative adaptation actions to account for the long-
term impacts of climate change.
Vision Statement “The vision of this project is to aid the Eno-Haw Hazard Mitigation Planning Team in
constructing comprehensive strategies to respond to climate change’s impact on natural hazards.”
Scope The scope of this project is restricted to the Eno-Haw geographic region, including Alamance, Durham, and Orange County, in order to supplement the current Eno-Haw Regional Hazard Mitigation Plan. Furthermore, the research presented in this document is limited to climate change analysis corresponding to the natural hazards already identified by the Eno-Haw Hazard Mitigation Planning Team. No original research was conducted for this project rather we collate existing research. This study proposes mitigation strategies but does not provide in-depth analysis of potential funding sources or implementation procedures.
Report Overview We begin by analyzing the impacts of climate change on local natural hazards and consequent effects on the Eno-Haw community. We reviewed the existing Eno-Haw Regional Hazard Mitigation plan in order to identify hazards most important for the area. We then conducted online research using reliable sources such as the national climate assessment, National Oceanic and Atmospheric Administration, and the Environmental Protection Agency, as well as peer reviewed literature in order to assess how climate change will change the frequency, intensity, and extent of these hazards in the Eno-Haw region.

UNC Institute for the Environment Introduction 4
After assessing how hazards may be affected by climate change, we conducted a capability assessment. This consisted of researching the current natural hazard mitigation strategies included in the Eno-Haw Regional Hazard Mitigation plan in order to identify opportunities for improvement and avoid redundancy. This assessment provided an overview of existing strategies for our own benefit when developing strategies; consequently, they are not presented in this report. Strategies were developed by identifying patterns and themes in natural hazard mitigation goals. Specific actions were proposed based on the climate change research presented in this report, an analysis of existing climate change adaptation and natural hazard mitigation plans from other regions, and the current capability and status of Eno-Haw’s mitigation strategies. The first section of this report details the effect that climate change will have on the frequency, magnitude and impact for each of the local natural hazards specified by the Eno-Haw Regional Hazard Mitigation Plan. We then present strategies to address these projected changes in natural hazards and outline specific actions. Further description of adaptation strategies and actions is also provided in tabular format in Appendix A. Finally, we conclude with next steps.

UNC Institute for the Environment 5 Hazard Assessment
HAZARD ASSESSMENT Rather than considering climate change as a separate hazard, we consider climate change as a threat intensifier that may affect the frequency, magnitude, and impact of hazards in the future. We identify “frequency” as the occurrence of each hazard over time, “magnitude” as the size or extent of the hazard, and “impact” as the effect the hazard has on the community. For each of the hazards identified in the Eno-Haw Multijurisdictional Hazard Mitigation Plan, we review the current research on how they may be affected by climate change. We provide details on natural hazards and their mechanisms. With this information, we then assess how climate change may affect the frequency, magnitude, and impact of each hazard. By conducting this assessment we seek to provide clarification on the potential effects of climate change, so that plans may be developed or revised to better suit future weather and climate conditions. While we drew on the best available science, it should be noted that there is considerable uncertainty in how climate change will affect hazards locally and that this is an active area of research. Uncertainty arises from multiple sources including the intrinsic variability of climate, future greenhouse gas emissions, and complexity of hazard formation (See “Limitations” Table). Consequently, this report should be read as potential risks not reliable predictions. This section also seeks to provide background information that might give context to how the strategies proposed later in this document may mitigate the future effects of climate change.

UNC Institute for the Environment Hazard Assessment 6
Limitations
● Scientific knowledge on climate change has advanced significantly over recent
decades. There is a better understanding of hazard mechanisms and patterns, improved technology to model current trends and make future projections, and an overall more thorough explanation for why climate change is happening and how it’s expected to affect the future. Despite this progress, there are still limitations (Knutti, 2008). These limitations stem from 1) natural variability of climate systems, 2) difficulty in predicting future greenhouse gas emissions, and 3) imperfections in replicating and scaling climate models.
● 1. Natural variability of climate systems ○ Currently, future projections depend on existing data and recorded
trends in weather patterns. Because some natural hazards, such as droughts and intense hurricanes, occur rarely, there is limited data to support modeling.
○ There are many mechanisms involved in natural hazards and it’s often unclear which are most important for hazard formation and intensity. It’s also challenging to predict how or to what extent these mechanisms will be affected climate change (Ylhäisi et al., 2014).
○ On top of this, advancements in scientific knowledge and technology expose more complexity, which results in more complex models often making results more difficult to interpret (Ylhäisi et al., 2014; Knutti, 2008).
● 2. Difficulty in predicting future greenhouse gas emissions ○ Climate systems interact with both biological and social systems. ○ Future greenhouse gas emissions depend on anthropogenic actions and
policy that are difficult to predict. The IPCC has approached this uncertainty by creating multiple potential scenarios of greenhouse gas emissions.
● 3. Imperfections in replicating and scaling climate models ○ There is uncertainty in the initial conditions, parameters, and specific
processes of climate, which makes creating reliable climate models difficult (Knutti, 2008).
○ Secondly, there is variability in translating global models to a local level for decision-making (a process called downscaling). This limits interpretation because some global averages may not reflect local conditions (Berkhout et al., 2013).
● Understanding the consequences of climate change for hazards is an ongoing area of research.

UNC Institute for the Environment Hazard Assessment 7
Coastal Storms Frequency: Indeterminate Magnitude: Increase Impact: Medium/High Coastal storms, which include both tropical storms and hurricanes, pose a significant threat to the economic, environmental and societal well being of North Carolina. Nationally, Cape Hatteras ranks second in hurricane-impacted locations. In an average decade, North Carolina experiences 3 tropical storms, 3 hurricanes and is negatively impacted by 18 additional coastal storms that do not make landfall. Despite its inland location, the Eno-Haw region has been adversely affected by coastal storms. Hurricane Floyd (1999) caused $4.5 billion in economic losses across the state and resulted in disaster declarations in every county in North Carolina. The potential for climate change to increase the intensity of coastal storms necessitates a re-examination of future coastal storm impacts and mitigation strategies. Research suggests that climate change will increase the intensity of coastal storms, but it is unclear if the frequency of storms will change. The formation and magnitude of coastal storms is dependent upon five variables: sea surface temperature (SST), wind shear, atmospheric moisture, temperature gradient, and steering flow (Eastin 2008). Though climate change may influence each of these variables, SST in particular is projected to increase and be the most important factor in determining coastal storm intensity (Eastin, 2008). Specifically, the Atlantic Basin has seen an increase in storm intensity (Emmanuel, 2005). The number of Category 4 and Category 5 hurricanes has increased relative to weaker storms (Figure 2) (Webster et al., 2005). Although the degree to which climate change will affect the remaining variables is ambiguous, research presents the general consensus that there will be an increase in intensity but an indeterminate effect on frequency (Emmanuel, 2005).

UNC Institute for the Environment Hazard Assessment 8
Figure 2. Intensity of hurricanes according to the Saffir-Simpson scale (Categories 1 to 5) between 1970 and 2004. (A) The total number of storms in each category. The bold curve is the maximum hurricane wind speed observed globally. The dashed lines show the average 1970 - 2004. (B) Percent of total
number of hurricanes in each category class (Webster et al., 2005). Currently, hurricanes are the most expensive natural catastrophe in the United States and their economic burden is expected to increase over the next 50 years (Figure 3). Most noticeably, through extensive flooding and high-speed winds, these storms cause direct damage to building infrastructure, personal health and transportation networks. Such extensive flooding can introduce sewage-related pathogens, nutrient pollution, animal waste and other hazardous materials through flooding of sewage and stormwater systems. Storm aftermath may additionally lead to mental stress and decline in mental health (NOAA, 2015).
Figure 3. Predicted economic cost from coastal storm damage in the years 2030 and 2050 (Kinniburgh, 2015).

UNC Institute for the Environment Hazard Assessment 9
Considering the historical damage from coastal storms, an increase in storm intensity will inevitably exacerbate these deleterious effects - a fact emphasized by a recent study of natural disasters in the southeastern United States (Kinniburgh, 2015). Some research studies directly indicate a link between increased socioeconomic impacts from future coastal storms and climate change. Regardless, both coastal and inland communities will require greater preparation to avoid storm consequences (Eastin, 2008).
Winter Weather Frequency: Increase Magnitude: Increase Impact: Medium Winter weather, which is defined as storms producing snow, sleet, or wintry precipitation, is considered one of the most difficult forms of weather to forecast in North Carolina because of its variability, irregularity, and large spatial distribution (NC State University, C). Climate change alters atmospheric patterns and is projected to increase both the magnitude and frequency of winter weather locally. Winter weather develops from various and complex meteorological patterns, which help to explain its inconsistency. In general, it is a result of large (synoptic) and small (meso) scale atmospheric patterns (NC State University, A). The atmospheric patterns that primarily contribute to winter weather in the eastern part of the United States include cold air damming and jet streams. Cold air damming describes air trapping; in North Carolina specifically, the Appalachian Mountains trap cold air up against them. Cold air density helps to keep cold air close to Earth’s surface and warmer air right above it (Figure 4). When cold air damming coincides with storm systems, wintry precipitation occurs.
Figure 4. Cold Air Damming in North Carolina (NC State University, A)

UNC Institute for the Environment Hazard Assessment 10
More relevant to climate change are jet streams. Jet streams, which are narrow bands of wind that exist in the upper atmosphere, separate cold from warm air masses during the winter and are a primary mechanism behind winter weather in the Eastern United States. In North Carolina, when jet streams are oriented east-west, winter is fairly mild. However, when the jet stream points north-south or when the base of its trough is south of North Carolina, the state experiences very cold temperatures (NC State University, A).
Figure 5. Jet Stream Pattern in the United States (NC State University, B) Historically, there are have been six to twelve winter weather events (snow, sleet, and freezing rain) per year in the Piedmont area of North Carolina (Fuhrmann and Konrad). However, recent research on the polar vortex explains why intense snowstorms (such as the eastern coast storm of February 2016 or the Washington D.C. storm in February 2010) have become more frequent. The polar vortex is a wind pattern that circles the Arctic and flows around the Earth from west to east. It typically bottles cold air in the North Pole; but, when the polar vortex weakens, this cold air pours into Canada and the United States. Similarly, it pushes the jet stream much further south which, as mentioned previously, brings frigid temperatures to North Carolina. If the jet stream pushes back on the polar vortex’s cold air, moisture falls out of the air as heavy snow, which explains recent snowstorms and winter weather events in North Carolina. Changes in climate may cause the polar vortex to continue to weaken, ultimately increasing the frequency of winter weather events. Because of global temperature changes, Arctic sea ice is melting during the summer and causing the Arctic Ocean to warm. The Arctic Ocean then radiates heat back into the atmosphere during winter, which disrupts and weakens the polar vortex. Although the amount of Arctic summer

UNC Institute for the Environment Hazard Assessment 11
sea ice varies from year to year, it has diminished substantially since 2007 and is expected to continue to deplete. This implies the polar vortex will continue to weaken and frigid outbreaks will occur more frequently in North Carolina and the United States as a whole. This may contradict the expected pattern of “global warming,” but it supports peculiar environmental changes that have resulted from global climate change (Fischetti, 2016). A higher frequency of winter weather events poses a threat to public safety and economic stability. Currently, North Carolina does not have adequate equipment to keep all roads safe. As a result, 70% of all winter weather accidents are due to vehicle accidents from poor visibility and black ice (NC State University, B). The nation averages more than 800 annual deaths from vehicle accidents during winter precipitation. This rate is more than the combined national total of deaths from all other natural hazards (tornadoes, lightning, floods, wind, and heat) (Coin, 2015). Another concern is ice accumulation, particularly on trees and power lines. The weight of the ice leads these objects to fall, causing injuries and power outages (NC State University, B). In January of 2016, 70,000 Duke Energy customers were put out of power in the North Carolina triangle area as a result of a winter storm that hit the east coast (Campbell, 2016). Power outages negatively impact the economy and also are a public health threat. Buildings cannot be heated during power outages and there is a higher risk for carbon monoxide poisoning. Lastly, if winter weather and cold temperatures increase intensely, the risk for wind chill, hypothermia, and frostbite will rise (NC State University, B). Because winter weather events have historically been rare in North Carolina, our state does not have the training, machinery, and know-how to combat their impacts. However, with the threat of climate change and projected increases in frequency and magnitude of winter weather events, North Carolina should work to educate the public and prepare for the possibility of future winter weather impacts.
Extreme Heat Frequency: Increase Magnitude: Increase Impact: Medium/High An extreme heat event is defined as when daily temperatures exceed 95°F. On average, North Carolina experiences approximately seven extreme heat days per year (Kinniburgh, 2015). As a major consequence of global climate change, this number is expected to increase dramatically in the near future and North Carolina is projected to

UNC Institute for the Environment Hazard Assessment 12
be significantly impacted. Some conservative estimates project the number of extreme heat days in North Carolina to increase to between 10 and 30 days by mid century, while others project an increase by as much as 39 days (The Climate Reality Project, 2014; Kinniburgh, 2015). Figure 6 shows the EPA projections for extreme heat days in the southeastern United States as compared to historical data (EPA, 2014). The southeastern United States is expected to experience the greatest increase in extreme heat events than any other area in the United States (Ingram et al., 2013). While the exact number of extreme heat days varies by projection, it is likely that North Carolina will experience more extreme heat days in the future.
Figure 6. Projected Change in the number of hot days from the EPA. This graph shows a comparison of historical data (1971-2000) and projected data (2041-2070) under a scenario with high greenhouse gas
emissions (EPA, 2014). As the number of extreme heat days increases, hot days are also projected to be even hotter. The intensity of extreme heat events are likely to increase by 4.5°F to 9°F by the 2080s; the range of increase varies depending on the greenhouse gas emission scenario used (Ingram et al., 2013). The increase in heat intensity is primarily driven by global climate change. The dual effect of increasing intensity and frequency of extreme heat events will impact North Carolina most severely through illness and death (Climate Nexus, 2014). The projected increase in hot days is likely to increase the number of heat related deaths in North Carolina by 500 each year by 2020-2039 (Kinniburgh, 2015). Additionally, an increase in hot days will increase the formation of air pollutants, crop yields, number of hospital visits, and energy costs. For example, in North Carolina during the summer of 2007, extreme heat caused major blackouts, as the water used to cool Duke Energy’s Riverbend and G.G. Allen coal plants on the Catawba River was too hot to discharge (Davis and Clemmer, 2014); because the water was too warm to use for cooling, the whole plant had to be shutdown to avoid overheating and damaging equipment. Increasing atmospheric temperatures can lead to the formation of harmful

UNC Institute for the Environment Hazard Assessment 13
air pollutants, such as ground level ozone, which will result in an increase in emergency room and hospital visits for those with respiratory problems (Carter, 2013). While North Carolina does have an asthma program initiative, most of the resources provided focus on indoor air quality rather than outdoor air quality and pollutants. (NC DHHS, 2014). Additionally, increased temperatures create more favorable environments for bacteria proliferation involved in foodborne incidences (NOAA, 2015). With these threats in mind, it is important for North Carolina to prepare for future extreme heat events.
Drought Frequency: Increase Magnitude: Increase Impact: Medium/High Drought is defined as a period with abnormally low rainfall and a resulting shortage of water. Increasing local temperatures and more frequent and intense heat waves may cause droughts to occur more frequently. Drought conditions create positive feedback loops: during a drought there is less moisture in the air, resulting in less cloud cover, allowing earth’s surface to warm rapidly and decrease likelihood for precipitation. Therefore drought conditions alone increase likelihood of continuing drought. Drought frequency has increased by 12-14% in the region since 1970 and is projected to rise with increasing extreme heat events (NRDC). The 2002 drought cost agricultural industries in the region nearly $400 million and impacted over 4,000 jobs (Ingram et al., 2013). Crops that are able to survive drought events are likely to be weakened and more vulnerable to pests, further reducing agricultural yields (NOAA, 2015). The drought in 2007 affected over half of the public water systems in the area, impacting more than 5,000,000 people (NCSL, 2008). Events like this are expected to increase in likelihood and intensity due to climate change. This increase in drought frequency will limit the region’s ability to meet water demands in a sustainable manner and will lead to unsustainable groundwater pumping patterns (Band, 2009). According to National Resources Defense Council, approximately 56% of North Carolina’s counties face increased risk of drought and water shortages by mid-century as a result of climate change (NRDC). The effect of climate change on the region’s water sources is substantial and any increase in drought severity will put a strain on an already stressed water supply system (Uzochukwu, 2012). Drought conditions reduce the flushing of contaminants out of a system causing increases of water contamination, which may necessitate more water treatment (NOAA, 2015). A prolonged reduction in precipitation contributes to increased fine and coarse particulate matter, which gets into

UNC Institute for the Environment Hazard Assessment 14
the air and decreases air quality; this is expected to cause increased frequency in asthma attacks and other respiratory problems (NOAA, 2015).
Wildfires Frequency: Increase Magnitude: Increase Impact: Low
Wildfires are large, destructive fires that spread quickly over an affected area. On a global level, temperature rather than precipitation is the primary driver of wildfires (Pechony, 2010). Due to increases in temperature and decreases in precipitation as a result of climate change and decades of fire suppression, fires are more likely to burn more often, longer, and in a less controlled manner (Pechony, 2010). Wildfire frequency, duration, and extent are projected to increase particularly in areas where fires have been suppressed historically (Dunbar, 2010; Yongqiang, 2010). Areas that are most vulnerable to wildfire are those that contain accumulated fuel sources, like dead biomass and detritus, from fire suppression activities (Yongqian, 2010). Drier and warmer weather, a result of climate change, will likely increase the observed intensity, frequency and extent of wildfires by creating more dead, dry biomass that contributes to fuel accumulation. Forested areas across the eastern coast of the United States face a growing risk potential as temperature and drought increase (Dunbar, 2010). Areas with previously low wildfire risk have become more at risk with climate change; agricultural areas, for example, are at increased risk during post-harvest seasons when harvest waste accumulates in fields and becomes susceptible to biomass burning (Dunbar, 2010). Forests also experience seasonal risk increases and decreases that vary with the amount of fuel that accumulates on the forest floor. The impact of wildfires is closely related to human settlement patterns. As human populations continue to grow and spread, fire-dependent ecosystems are becoming more inhabited by humans. The interactions are particularly detrimental to both parties at the wildland-urban interface, the region where forest transition to human development (Dunbar, 2010). The Eno-Haw region already has a relatively high intermix of urban and wildland areas and further human expansion into forested wildland areas increases risks to residents. Wildfires damage not only property and land but have detrimental effects on air quality in both local and regional areas.

UNC Institute for the Environment Hazard Assessment 15
Tornadoes Frequency: Indeterminate Magnitude: Increase Impact: Low Tornadoes occur when masses of warm moist air and cool dry air interact to create atmospheric instability; this gives rise to wind shear, causing horizontal rotating air masses. Tornadoes originate from thunderstorms. Components of tornado formation, such as increasing atmospheric moisture and decreasing wind shear, may be affected by climate change, however the mechanisms of tornado formation have not yet been conclusively demonstrated to be affected by climate change (Kahn, 2014). Frequency and intensity of tornadoes during ‘tornado days’ is, however, projected to increase (Diffenbaugh, 2013). ‘Tornado days’ are days with high convective available potential energy and strong low-level wind shear in which tornado formation potential increases (Diffenbaugh, 2013). The number of tornado days is not likely to increase with climate change; yet the intensity of tornado days will likely increase, resulting in more intense storms with increased tornado density and formation (Kahn, 2014). Tornadoes are ranked based on damage done to human life and property; because future tornadoes are projected to be more intense, they are more likely to cause direct harm to humans (Kahn, 2014). The spatial range of tornadoes it not projected to change drastically due to climate change; areas that are currently susceptible are likely to see an increase in frequency and density on tornado days (Kahn, 2014). However, as thunderstorm extent increases, tornado days in more expansive areas are more likely to increase (Diffenbaugh, 2013).
Figure 7. Eastern United States average number of tornadoes by state from 1991-2010 (NOAA, 2010).

UNC Institute for the Environment Hazard Assessment 16
Currently North Carolina experiences approximately 30 tornadoes each year (NOAA, 2010). Figure 7 highlights that while tornadoes might not be an extremely high priority hazard, they are still a concern for the citizens of the state and must be taken seriously.
Thunderstorms/Lightning Thunderstorms Frequency: Indeterminate Magnitude: Increase Impact: Medium Lightning Frequency: Increase Magnitude: Indeterminate Impact: Medium Thunderstorms, which are characterized by high winds, heavy rainfall, lightning, and hail, are a result of the intersection of numerous environmental factors, many of which will potentially be altered as the climate continues to change in years to come. Two of the largest contributing factors for thunderstorms are storm updrafts and wind shear. Increases in either of these elements can cause an increase in storm longevity and power (Trapp et al., 2007). Research conducted by NOAA found that climate change will lead to more frequent environmental conditions that contribute to thunderstorms (2013). These climate models show that the number of days in which severe thunderstorm conditions are present (NDSEV) will increase over the next century, especially during the summer. This projection is carried out in inland cities as well, including a projected 100% increase in NDSEV in Atlanta in summer months over the next century (Trapp et al., 2007). There is some controversy over this projected increase with others suggesting that there will be no rise in the frequency of thunderstorms in years to come (Price, 2008). Thunderstorms primarily cause significant economic damage; they are responsible for 45% of all weather-related insured property losses in the nation. From 2002-2004, such storms caused $2.1 billion in property losses, 108 deaths and 1,463 injuries. Compared to tropical cyclones, thunderstorms cause less property loss but substantially higher fatalities and injuries (Trapp et al., 2007). Despite the inconclusive evidence on thunderstorm frequency, climate change could cause an increase in lightning (Price, 2008). It’s projected that lightning will increase in

UNC Institute for the Environment Hazard Assessment 17
frequency as a result of higher global temperatures from climate change: for every degree of global warming there is an estimated 10% increase in lightning frequency (Figure 8). Research suggests that the number of cloud-to-ground lightning flashes will grow nationally by 50% over the next century (Lee, 2014). There is no sure explanation for how clouds become charged and how lightning is formed. In general, it’s hypothesized that particles in the clouds, such as air, cloud droplets, precipitation and ice particles, collide until an electrical charge develops. The smaller ice particles tend to become positively charged and rise via convection currents. The larger ice particles become negatively charged and sink due to gravity. This separation of charges creates an electrical field. In order to discharge the electrical field, lightning strikes between the charged cloud and earth (Ball, 2012). With warmer climates, there is increased evaporation and higher surface temperatures. This leads to an unstable atmosphere, more intense thunderstorms, and more frequent lightning (Price and Rind, 1994). Thunderstorms stimulate more water vapor in the atmosphere and ultimately more storms and lightning. Similarly, lightning deposits greenhouse gases in the atmosphere, causing more frequent lightning and intense thunderstorms (Price, 2008). Increased frequency in lightning threatens human health, economies, and environments. Behind flash and river floods, lightning is the third greatest weather-related cause of death. Over 100 people are killed annually in the United States by lightning (Price and Rind, 1994). In particular, North Carolina is third in the nation for the highest lightning casualties and in the top ten for lightning injuries (Curran et al., 2000).

UNC Institute for the Environment Hazard Assessment 18
Figure 8. Experiment displaying temperature change and lightning change for global cooling (a 2% decrease in the solar constant) and global warming (a 2x increase in CO2 concentrations) (Price and
Rind, 1994). On top of human health risks, lightning is economically unfavorable. Annually, 93% of lightning damage reports range from $500 to $500,000 (Curran et al., 2000). Electrical power companies lose millions of dollars from repairing power lines from electrical surges. Additionally, increased lightning events threaten air and spacecraft travel and can lead to higher rates of forest fires (Price and Rind, 1994).
Hail Frequency: Indeterminate Magnitude: Indeterminate Impact: Medium/Low Hail formation occurs when thunderstorm updrafts are strong enough to bring water droplets above freezing level. These freezing droplets form hailstones, which can grow with more freezing water, until it becomes too heavy for updraft to carry and falls to the ground. A number of conditions are considered favorable for hail formation, including:

UNC Institute for the Environment Hazard Assessment 19
low moisture levels, atmospheric instability, wind shear, and rising temperatures (Niall and Walsh 2005). It is unclear how climate change will affect these mechanisms. Researchers in Australia found that climate change will decrease hail incidence (Niall and Walsh, 2005), however, there is also evidence to suggest that hailstorm damage will increase in the future as temperature increases (Botzen et al., 2010). These differences demonstrate the difficulties for climate change research in making reliable projections of small-scale severe weather phenomena like hailstorms.
Flood Frequency: Increase Magnitude: Increase Impact: High Current research shows that the changing climate is causing the periods of most intense precipitation to increase. Heavy precipitation events have already become more frequent and intense, the amount of rain falling during heavy downpours in the Southeast has increased by 27% (Walsh et al., 2014). The graphic below shows that the number of heavy downpours in North Carolina has increased from 1950 until 2020. Bringing this data into our specific region, Durham is among the cities that have experienced the greatest increase in the number of heavy downpours (129%) (Climate Central, 2015)
Figure 9. Number of Heavy Downpours in North Carolina (Climate Central, 2015).

UNC Institute for the Environment Hazard Assessment 20
These trends are projected to increase in the future. Figure 10 shows that, for North America, the amount of precipitation on the wettest day may increase by about 20-30% under current greenhouse gas emissions rates. There has been some scientific debate as to how climate change increases heavy downpours, but the consensus is that it involves the increase in temperature of the atmosphere. As the atmosphere warms its capacity to hold more water increases (Walsh et al., 2014; Kunkel et al., 2013). Climate change may also affect meteorological systems such as El Nino and La Nina that affect seasonal rainfall, however, research on this topic is inconclusive and ongoing. Additionally, increased intensity of coastal storms may increase large precipitation events that also contribute to the likelihood and intensity of flooding.
Figure 10. This figure shows the simulated changes in the average amount of precipitation falling on the
wettest day of the year for 2070-2099 compared to 1971-2000 under the scenario that assumes continued emissions increases (Walsh et al., 2014).
The increased intensity of the most severe precipitation events in North Carolina and the Eno-Haw region will likely lead to an increase in the frequency and intensity of flooding (Walsh et al., 2014). The Eno-Haw region is characterized by silt and clay, soil textures that have low permeability. Extended dry periods associated with Climate Change will lead to drier and more compacted soil profiles, and a lower rate of rainfall absorption, or infiltration capacity (UCAR, 2010). Abnormally heavy downpours may exceed infiltration capacity and increase runoff. Compared to normal amounts of rainfall, periods of extreme heavy downpours are more likely to cause flooding and flash flooding. A flash flood is a flood caused by heavy or excessive rainfall in a short period of time, generally less than 6 hours. Flash floods are associated with greater damage

UNC Institute for the Environment Hazard Assessment 21
because of the raging torrents that flow through riverbeds, streets, etc. (National Weather Service, 2010). Increased intensity of heavy rainfall events may increase flood levels and expand the floodplain putting more residential and commercial buildings at risk. More intense and frequent flooding may lead to more damage to personal property and infrastructure. In addition, flooding poses a threat to personal health and safety. Recent research in North Carolina found a link between heavy rainfall events and visits to the emergency department for gastrointestinal illness (Hartley, 2016). Following high rainfall events (greater than 2 inches), there was a significant increase in the number of visits to the emergency department (in some counties this increase was around 300%). These results suggest that heavy rainfall and flooding may increase waterborne disease transmission. While flooding can also wash away existing sites, the collection of stagnant or slow-moving water can also increase transmission in vector-borne diseases (Ahern et al., 2005).
Dam/Levee Failure Frequency: Indeterminate Magnitude: Indeterminate Impact: Medium There are no occurrence intervals calculated for dam and levee failures, therefore, it is difficult to project the future likelihood of an event with the consideration of climate change. Dam failures most often occur from the disintegration of structural materials. Climate change projections suggest that there will be an escalation of heavier rainfalls. Reservoirs may endure sudden significant increases in water level. An embankment dam, constructed from compacting several layers of natural earth materials, may be more susceptible to the impacts of climate change, such as erosion from fluctuating water levels. Contrastingly, extended hot periods from a warmer climate may increase the vulnerability of fabrics at risk of cracking from heat-induced expansion (Atkins, 2013). For these reasons, the vulnerability of dams should be continuously evaluated based on their structural integrity. Reservoir volumes may also be affected by perturbations in the hydrologic cycle. Heavy rainfall in short periods that causes flooding can also increase the circulation of sediments, which then accumulate in reservoirs (Makar, 2015). Increased sedimentation equals lost water capacity in the reservoir and reduces its functionality. Sediment moves at the fastest rate during floods and a river may displace as much sediment in one extremely violent storm as it does in several average years (McCully,

UNC Institute for the Environment Hazard Assessment 22
1996). A reservoir with decreased capacity can cause a deviation in the waters normal flow, which may result in increased flooding in alternative areas. The expected time period of a dam’s use may be shortened, causing extra stress on other water catchment systems. Additional dams and reservoirs may become necessary.
Landslides Frequency: Indeterminate Magnitude: Indeterminate Impact: Low Landslides can refer to wide variety of land movements including: rock falls, failures of slopes, and debris flows (USGS, 2016). The primary cause for the majority of landfalls is the influence of gravity on slopes that have become too to steep. Erosion due to rivers and other bodies of water and excessive rainfall resulting in the weakening and increased weight of slopes have also been shown to contribute to landslides (USGS, 2016). The literature suggests strong theoretical basis for a link between climate change and landslide activity. Climate change has been linked to heavier downpours, which might contribute to increases in the magnitude and frequency of landslides. One of the key factors of landslide incidence that may be affected by climate change is slope stability. Changes in slope stability would arise from fluctuations in the amount of water present within the soil, which is affected by precipitation and the ability of water to drain through the soil (Crozier, 2010). These factors are in turn related to the evapotranspiration rates of the vegetation present in the region. Evapotranspiration is the total amount of evaporation and transpiration that takes place in the environment (NCSU, 2013). Fluctuations in the rate of evaporation could change the amount of water that plants remove from the soil resulting in decreases in the water content of the soil making the area more susceptible to landslides in the event of a large rainfall event. Climate change has been linked to changes in the rates of evaporation in plants, which are influenced by temperature, humidity, and soil type (NCSU, 2013). The United States Geologic Survey has indicated that landslides, as a hazard, are most important for the western counties of North Carolina (USGS, 2013). This means on that the Eno-Haw Region, as a whole, is not a great risk to severe damage from landslides. The areas that are of most risk in the regions are those that have the steepest slope and accumulate the most rainfall through the course of a year.

UNC Institute for the Environment 23 Strategies
STRATEGIES Over 44 municipalities and counties in the United States have developed stand-alone climate change adaptation plans. Multiple local governments, including Baltimore, Miami Dade County, and Boston, have also integrated climate change adaptation into hazard mitigation plans. We reviewed the strategies and actions proposed in these plans and identified those that may be applicable to the Eno-Haw region. We propose nine strategies such as water conservation, energy security and efficiency, and green infrastructure. For each strategy, we identified specific actions that could be integrated into community hazard mitigation action plans. While the strategies themselves are not new ideas, the actions proposed have not yet been implemented across all of the Eno-Haw Region. Certain actions will be more applicable to different jurisdictions within the Eno-Haw Region. In Appendix A, we provide a table that includes a description of each action, strategy, the hazards it is intended to address, cost, co-benefits, and expected time frame for its completion. The actions provided are intended to build on existing actions proposed in the hazard mitigation plan and community action plans. In addition, we considered other community planning that may have adaptation value such as comprehensive and drought response plans.
Improve stormwater management systems: Stormwater management systems play a key role in protecting the health of the public. Stormwater systems can be overwhelmed due to coastal storms, thunderstorms, and heavy downpours, which can result in flooding. Floodwaters may cause toxic metals as well as disease-causing organisms to be released into natural water supplies. The following strategies seek to assess the current systems vulnerabilities and address them to reduce risk of flood events.
1. Increase frequency of storm drain cleaning to allow maximum functionality. 2. Improve stormwater management by encouraging local governments to restore
natural flood protection (wetlands) and reduce impermeable surfaces. 3. Ensure that all pipes are equipped with backflow valves and especially all fuel
pipes are equipped with automatic shut-off valves. 4. All counties should follow Durham's stormwater system retrofit idea: identify
locations for cost-effective retrofit or improvements to the stormwater conveyance system that will improve the quality of stormwater runoff and/or reduce the potential for downstream flooding.

UNC Institute for the Environment Strategies 24
Educate public and supply outreach services: Plans and strategies are only as effective as the means of communicating them to the public and officials. This education can come in different forms, including raising general awareness and providing community residents with information on hazard preparedness. Miami-Dade County has made efforts to implement education materials on climate change, the environment, and sustainability in public schools. For example, they have worked with local children’s museums and foundations to create and fund educational exhibits on climate change, green technologies, and green cities. For the Eno-Haw, the following actions can help ensure that information and plans are properly conveyed to citizens.
1. Develop educational materials about limiting exposure to extreme heat to be distributed among all community members.
2. Work with the region’s children’s museums and foundations to create and fund educational exhibits on climate change, green technologies, clean cities, etc. For example, consider partnerships with the Morehead Planetarium.
3. Provide energy efficiency education. Create educational campaign to promote Energy Star® qualified roofing products targeted at roofers, builders, and architects. Educate and provide resources and information about utility rebate programs.
4. Encourage homeowners and businesses to purchase flood insurance 5. Educate citizens about safety during flood conditions, including the dangers of
driving on flooded roads. 6. Provide an online forum in order to provide information about savings related to
reduced water use, fire management techniques such as removal of hazard fuels, and air quality issues. (Widely distribute Code Red air quality information to outdoor events)
7. Publicize information about the special needs registry and how residents with special needs can register themselves.
8. Devise and coordinate a countywide system to effectively communicate emergency information to the community. Increase public awareness of extreme weather event resources (e.g., creating an emergency food supply, community evacuation procedures, etc.).
9. Identify and develop educational materials that can be incorporated into Public Schools’ curriculum on climate change, the environment, and sustainability.

UNC Institute for the Environment Strategies 25
Improve energy security and efficiency: Energy security and efficiency are crucial to the safety and well being of communities especially in emergency situations. Energy supply and distribution is affected by nearly hazard including extreme heat, drought, winter weather, and thunderstorms. There are a number of strategies to create a more resilient energy system and limit the impact of power outages. For example, Baltimore has installed back up solar powered streetlights and signals along major roads to lessen potential accidents during power loss. By following the actions below, cities and counties can be more prepared to deal with hazardous situations.
1. Continue to work towards installing backup generators, including solar-powered generators, especially at critical facilities (hospital, gas stations, pharmacies) or operational centers. Ensure generators are above future flood elevations.
2. Install back up solar powered streetlights and signals, especially along major throughways.
3. Work with Duke Energy to replace electric wires with more durable cable and replace poles that don't pass inspection.
4. Work with Duke Energy and encourage implementing combined heat and power cogeneration plant (CHP).
5. Create defensible space around essential infrastructure, communication towers, power lines, wastewater treatment, water, emergency response facilities, and key transportation corridors (per Hazard Mitigation Plan).
6. Work with utilities and regulators to develop a cost-effective system upgrade plan to address climate risks.
7. Create a contest for residents to win energy and water efficiency upgrades and cool roofs.
8. Encourage green building standards and energy efficiency in schools, homes, and public buildings. Study strategies to limit heating and cooling loss through building exterior.
9. Work with utilities and regulators to establish performance metrics for climate risk response.
10. Help households and businesses conserve energy through free energy audits and consultations; develop a protocol for monitoring electricity use.
11. Encourage white roofs, focusing on buses, homes, and companies. 12. Elevate electrical, mechanical, safety systems and install waterproof conduits. 13. Establish the requirement that new construction builders bury utilities during the
construction phase. 14. Investigate off-grid, on-site renewable energy systems, generators, and
technologies for critical facilities to ensure redundancy of energy systems (M).

UNC Institute for the Environment Strategies 26
15. Develop smart grid technologies that will be able to provide real-time data on damages to Emergency Services Staff in the event of a large-scale weather event.
16. Expand energy conservation and sustainability training for employees. 17. Develop a comprehensive maintenance and training program for city employees
at facilities with backup generators to ensure proper placement, hook-up and function during hazard events.
Improve hazard preparedness and response: This section focuses on addressing the greatest hazard risks in the Eno-Haw and preparing in order to have the most efficient, safe, and organized reaction to such events. Hazard preparedness is necessary for the direct safety of citizens and officials in the occurrence of a natural hazard and will also reduce the need for restoration after disaster strikes, saving money, time, and lives.
1. Map drought risks and water availability via climate change scenarios; review existing watershed management plans.
2. Develop and improve water supply and drought management plans (i.e. increasing recharge into groundwater basin, improving recharge, reducing groundwater use)
3. Continue to maintain and/or establish agreements with local fire agencies for emergency response to increased wildfire.
4. Coordinate heat-related resources, donations, and volunteers during extreme events or heat waves.
5. Ensure completeness and availability of identified emergency supplies (water, food) and resources; including, but not limited to items such as water main repair parts, generators, pumps, sandbags, road clearing, medical, and communication. Identify/catalogue current supply; procure additional items/services to ensure preparedness in the event of a climate event.
6. Identify distribution points and identify alternative routes and modes of transport for life-essential goods and services.
7. Ensure all water and wastewater-pumping stations have off-grid power. 8. Developing back up phone systems and Voice over internet protocols for
hospitals, so that nurses can better communicate with residents during floods 9. Train staff to better remove ice and prepare roads for winter weather. 10. Consider investing in better and more equipment to handle winter weather on
public roads (CNG-fueled vehicles and snowplows, for instance) 11. Create a severe weather ordinance to allow homeless shelters to expand the
number of people they can hold during extreme weather events

UNC Institute for the Environment Strategies 27
12. Increase food safety and security by designating sites for community gardens and farmers’ markets and expanding USDA capacity for food inspection.
13. Encourage businesses to develop relocation plan if buildings are temporarily unusable due to flooding.
14. Work with residents to create a home emergency kit that ensures that all residents have the resources they need to survive in the event of a temporary road closure. A particular focus should be paid to elders and other more vulnerable segments of the population.
Update vulnerable facilities, assess infrastructure and address land use codes: This section focuses on identifying and protecting vulnerable facilities, as well assessing the stability and structural integrity of infrastructure. Changing and improving infrastructure of the Eno-Haw region will decrease vulnerability to damage in the event of a natural hazard.
1. Maintenance of hazardous limbs and trees to mitigate potential infrastructure damage.
2. Revamp public emergency shelters with new technology, backup power, cooling capabilities, etc.
3. Require new paved lots that are greater than 1 acre to increase permeability by 15% compared to previous standards or conditions.
4. Consider land use policies to prevent new construction in expanded floodplain such as Transferable Development Rights or a vulnerable area overlay that. Land in this area would be subject to additional building codes and usage regulation to protect the property from flooding.
5. Determine benefits of Alamance County enrolling in FEMA's Community Rating System program
6. Identify ways to flood-proof existing communications infrastructure (particularly those involving the use of copper wiring). Place emphasis on infrastructure that is known to be old.
7. Every five years review flooding ordinances and building codes to ensure that the two are in agreement.
8. Encourage critical emergency service providers to assess whether infrastructure is at risk of damage from future natural hazards.

UNC Institute for the Environment Strategies 28
Conserve water: Conserving water allows the region to use the existing water supply more efficiently. Benefits of conserving water include: decreasing contamination and risk of disease, lessening impacts of drought, reducing energy use, and saving money. The following strategies can be implemented in order to conserve water:
1. Revise and create Water Conservation Plan Guidelines and Landscape Manuals, respectively, to explicitly incorporate and promote recycled water and onsite water reuse systems, potentially using incentives in the project design and review process. Develop gray water and rainwater harvesting ordinances.
2. Require new development projects to demonstrate projected water use. 3. Work with local water utilities to develop a leak notification program to inform
customers whenever a spike in consumption meets requirements for a potential leak. Install automated meter reading so consumers can track water usage. Increase water prices to reflect true costs.
4. Develop/require high water efficiency product standards for fixtures installed in new developments exceeding a certain size threshold.
5. Onsite Water Reuse Incentive – Create an “Onsite Water Reuse Incentive Fund” to provide rebates for onsite water reuse. The fund will specifically target retrofitting existing residences and businesses to maximize onsite water collection and reuse, thus decreasing reliance on imported water sources and helping to lower monthly utility costs.
6. Restore natural areas that provide groundwater recharge.
Improve alert systems: Alerting the public in the event of emergencies is an important in reducing the number of injuries and fatalities that arise from the impacts of hazards. Alerts provide citizens with potential life-saving information quickly. While some impacts, for example air quality, may not have disastrous results, alerts concerning these hazards can still reduce hospital visits. Ways to improve the alert systems:
1. Use media outlets to increase awareness of risk associated with extreme heat. Target at-risk populations, outdoor workers and those who exercise outdoors.
2. Continue/Create standardized alerts and early warning system for emergencies throughout the year, for example air quality alerts provide smoke-free areas and public transportation to these areas. To alert the populations of the air quality risks during extreme heat events, the health department may integrate EPA’s pre-existing air quality alert program (EnviroFlash).

UNC Institute for the Environment Strategies 29
3. Establish a Reverse 911 (Durham has already incorporated this) automated callback system in the community to notify residents of evacuation routes or other information in the event of an emergency or disaster.
Enhance and manage vegetation and green areas, with emphasis on implementing green infrastructure: The Eno-Haw region is vulnerable to the impacts of drought, flooding, and other hazards that may harm agricultural and recreational areas. Vegetation provides a natural defense for hazards that may damage soils and watersheds by maintaining soils’ location and recycling nutrients and water. In addition, vegetation can act as a defense for infrastructure and human development in areas that are vulnerable to hazards. The following adaptation strategies will address ways in which the impact of hazards and climate change on these susceptible areas may be mitigated. Encouraging “green” adaptations to buildings and land space will also have long-term benefits such as reducing cost of heating and lighting buildings and reducing greenhouse emissions.
1. Use and investigate challenges to using controlled burns under climate-altered future, using ecologically sound thinking. Analyze and implement forest management techniques such as prescribed burning.
2. Manage forest density for reduced susceptibility to wildfires. This includes developing a strategy to reduce biomass fuel in the wildfire-urban interface. Remove biomass in sustainable and ecologically sound manner.
3. Increase conservation efforts to preserve ecosystems and wildlife habitat, which will promote biodiversity and natural flood control (ex: restoring wetlands).
4. Retrofitting commercial and industrial buildings with green infrastructure (green roofs, swales, cisterns, permeable pavements) that capture stormwater for reuse or allow natural filtration, which mitigates flooding and promotes water conservation. This could be accomplished by adopting Low Impact Development (LID) standards.
Monitor and address potential disease outbreaks: Extreme weather events such as droughts and extreme heat will have numerous impacts on the quality and cleanliness of local food and water supplies that may increase disease outbreaks. Therefore, it is essential to identify potential areas of vectors for disease, such as areas of stagnant water where mosquitoes can breed or bacteria can grow to unsafe levels. Anticipating these outbreaks will greatly reduce the potential for disease and increased hospitalization. Actions to address these concerns include the following:

UNC Institute for the Environment Strategies 30
1. Anticipate the arrival of new disease vectors and associated diseases and
identify alternative methods to control or eradicate those vectors: develop early detection and warning systems.
2. Identify areas at risk for stagnant water, which may be at risk to vector borne diseases by mosquitoes.
3. Expand and implement ongoing water quality monitoring for areas at risk for pollution and contamination, which may result in unsafe levels of bacteria.

UNC Institute for the Environment 31 Next Steps
NEXT STEPS While this report identifies how hazards in the Eno-Haw region may change due to climate change and recommends potential adaptation strategies, it has a number of limitations. First, the development of this report did not include any public engagement. Local officials that will be responsible for implementing the proposed strategies also did not participate. Second, the assessment of how hazards may change on climate change was solely based on a review of existing literature. It did not include any downscaled modeling. The research presented is limited to climate change analysis corresponding to the natural hazards already identified by the Eno-Haw Hazard Mitigation Planning Team, not all natural hazards. This process also did not include a place based vulnerability assessment to identify areas that may be particularly affected by changing hazards. Finally, this study does not provide in-depth analysis of potential funding sources or implementation procedures for the strategies proposed. In light of these limitations, we recommend that the Eno-Haw Hazard Mitigation Planning Team: ● Work with partners to conduct more detailed, place based vulnerability
assessment ● Establish a process to stay abreast of scientific developments on climate change
and incorporate new information into future plans ● Develop metrics to measure climate threats and resilience to track over time ● Develop a set of metrics to measure progress and potential success in climate
resilience efforts and prepare for increased on existing programs and compile into a common database available to all city government agencies and departments.
It is also important to note that this report focuses exclusively on how emergency services can respond to climate change, but climate change will also affect other departments and agencies. For example, the mission of public health, water, parks and recreation, and public works departments may all be affected. We encourage the communities in the Eno-Haw region to build off this report to consider the broader implications for government operations and take adaptive actions.

UNC Institute for the Environment 32 Glossary
GLOSSARY Atmospheric Moisture: the concentration of water in the atmosphere Climate Change: a change in weather conditions and patterns over a long period of time (decades to millions of years). Community Rating System: Encourages floodplain management activities that adhere to or exceed the National Flood Insurance Program. Convection Currents: The motion of air that results when the air is heated. Embankment Dam: An artificial dam created from natural resources. There are two types: earth-filled and rock-filled. Energy Star: A program developed by EPA that seeks to promotes energy efficiency to help businesses become more conscious of climate change and save money. Floodplain: The area adjacent to a body of water (typically river or stream) that experiences flooding during periods of high discharge. Global Warming: an increase in temperature of Earth’s atmosphere; commonly attributed to increased quantity of greenhouse gases; often used synonymously with climate change Greenhouse Gas: gas particles in the Earth’s atmosphere that absorb and re-emit infrared radiation; naturally occurring but has been made more abundant by anthropogenic action; examples include nitrous oxide, carbon dioxide, and methane Horticulture: The discipline of agriculture that deals with the growing of plants Jet Streams: narrow bands of wind that exist in the upper atmosphere; separate cold from warm air masses; influential mechanism for winter weather Low Impact Development: A stormwater management approach that is based on capturing and managing stormwater on-site through reduction in impervious surfaces and other green approaches.

UNC Institute for the Environment Glossary 33
Polar Vortex: wind pattern that circle the Arctic and flows around the Earth from west to east Sea Surface Temperature (SST): the mean surface temperature of marine water masses recorded from satellites Sedimentation: The processes by which particles suspended in water settle on the ground. Steer Flow: the predicted storm path based off of various pressure systems over water and land Storm updraft: An upward movement of air Temperature Gradient: the difference in temperature between the lower and upper atmosphere Tornado Days: Days with high convective available potential energy and strong low-level wind shear (conditions that are favorable for the formation of tornadoes). Transferable Development Rights: A voluntary program that allows landowners to sell their land to developers, who then use this ownership to justify increasing the density of development in another location. Watershed: an area or ridge of land that separates waters flowing to different rivers, basins, or seas. (Ex: the mouth of a bay). Wildland-Urban Interface: Region between unoccupied plots of land and human development Wind Shear: the difference in wind speed and direction between the lower and upper atmosphere Wind Vector: A representation of the direction that an air mass is blowing; part of a diagram known as the Wind Triangle. Wind Triangle: A diagram used to plan navigation route of aircraft. The Wind Triangle contains three separate vectors corresponding to the air speed and direction of an aircraft in air, the direction of the wind, and the speed and direction of an aircraft and speed of an aircraft above the ground.

UNC Institute for the Environment 34 Abbreviations
ABBREVIATIONS AGL: Above Ground Level CHP: Combined Heat and Power CNG: Compressed Natural Gas ICLEI: International Council for Local Environmental Initiatives IPCC: Intergovernmental Panel on Climate Change LID: Low Impact Development NCAR: National Centers for Atmospheric Research NCEP: National Centers for Environmental Prediction NDSEV: Number of Days with Severe Thunderstorm Environments NOAA: National Oceanic and Atmospheric Administration

UNC Institute for the Environment Works Cited 35
WORKS CITED AccuWeather. (2010). La Nina Vs. El Nino. Retrieved March 31, 2016, from http://www.accuweather.com/en/weather-news/la-nina/38971 Ahern, M., R. S. Kovats, P. Wilkinson, R. Few, and F. Matthies. (2005) "Global Health Impacts of Floods: Epidemiologic Evidence." Epidemiologic Reviews 27, no. 1: 36-46.
Alamance County, Durham County, and Orange County. Eno-Haw Regional Hazard Mitigation Plan. (2015). Retrieved March 03, 2016, from http://www.orangecountync.gov/Section_4___Risk_Assessment.pdf Atkins. (2013). Impact of Climate Change on Dams and Reservoirs: Final guidance report.https://www.gov.uk/government/uploads/system/uploads/attachment_data/file/399993/RFI7086_DG09_Guidance_Final.pdf Ball, P. (2012). The mystery of what causes lightning. Retrieved March 2, 2016, from http://www.bbc.com/future/story/20120926-what-causes-lightening Band LE, Salvesen D (2009) Climate Change Committee Report. Institute for the Environment, University of North Carolina at Chapel Hill. http://www.ie.unc.edu/PDF/Climate_Change_ Report.pdf Berkhout, Frans, Bart van den Hurk, Janette Bessembinder, Joop de Boer, Bram Bregman, and Michiel van Drunen. (2013). “Framing Climate Uncertainty: Socio-Economic and Climate Scenarios in Vulnerability and Adaptation Assessments.” Regional Environmental Change, August. doi:10.1007/s10113-013-0519-2. Botzen, W. J., Bouwer, L. M., & van den Bergh, J. C. (2010). Climate change and hailstorm damage: Empirical evidence and implications for agriculture and insurance. Resource and Energy Economics, 32(3), 341–362. Retrieved from http://www.sciencedirect.com/science/article/pii/S0928765509000517 Brooks, H. E. (2013). Severe thunderstorms and climate change. Atmospheric Research, 123, 129–138. Retrieved from http://www.sciencedirect.com/science/article/pii/S0169809512000968 Campbell, C. (2016). Major power outages as sleet, freezing rain continue. Retrieved March 22, 2016, from http://www.newsobserver.com/news/weather/article56024325.html Carmin, JoAnn, Nikhil Nadkarni, and Christopher Rhie. 2012. Progress and Challenges in Urban Climate Adaptation Planning: Results of a Global Survey. Cambridge, MA: MIT.

UNC Institute for the Environment Works Cited 36
Carter, Lynne M., et al. (2013). Southeast and the Caribbean. Retrieved February 27, 2016 from http://www.globalchange.gov/sites/globalchange/files/NCAJan11-2013-publicreviewdraft-chap17-southeast.pdf Climate Central. (2015). Across U.S., Heaviest Downpours On The Rise. Retrieved from http://www.climatecentral.org/news/across-us-heaviest-downpours-on-the-rise- 18989. Climate Nexus. (2014). Southeast and Caribbean. Retrieved March 10, 2016, from http://climatenexus.org/learn/regional-impacts/southeast-and-caribbean Climate Reality Project, 2014. What does Climate Change mean for North Carolina. The Climate Reality Project, Climate Reality Project Fact Sheet North Carolina Impacts and Solutions. Retrieved February 27, 2016 Coin, G. (2015). Study: 800 die each year in US in winter driving crashes. Retrieved March 22, 2016, from http://www.syracuse.com/weather/index.ssf/2015/03/traffic_deaths_snow_sleet_upstate_new_york_united_states.html Crozier, M. J. (2010). Deciphering the effect of climate change on landslide activity: A review. Geomorphology, 124(3-4), 260-267. Retrieved March 3, 2016, from http://www.sciencedirect.com/science/article/pii/S0169555X10001881 Curran, E. B., Holle, R. L., & López, R. E. (2000). Lightning Casualties and Damages in the United States from 1959 to 1994. American Meteorological Society Journals Online, 13(19), 3448-3464. Retrieved February 16, 2016, from http://journals.ametsoc.org/doi/full/10.1175/1520-0442(2000)0132.0.CO;2#s3 Davis, Michelle & Steve Clemmer. (2014). Power Failure, How Climate Change Puts Our Electricity at Risk— and What We Can Do. Union of Concerned Scientists. Retrieved from http://www.ucsusa.org/sites/default/files/legacy/assets/documents/Power-Failure-How-Climate-Change-Puts-Our-Electricity-at-Risk-and-What-We-Can-Do.pdf Diffenbaugh, N., Scherer, M., & Trapp, R. (2013). Robust increases in severe thunderstorm environments in response to greenhouse forcing. Retrieved February 16, 2016, from http://www.pnas.org/content/110/41/16361.full.pdf Dittrich, R., Wreford, A., & Moran, D. (2016). A survey of decision-making approaches for climate change adaptation: Are robust methods the way forward? Ecological Economics, 122, 79-89. doi:10.1016/j.ecolecon.2015.12.006 Dunbar, B. (2010). Wildfires: A Symptom of Climate Change. Retrieved February 25, 2016, from http://www.nasa.gov/topics/earth/features/wildfires.html

UNC Institute for the Environment Works Cited 37
Eastin, M. (2008). An Assessment of Past and Future North Carolina Climate: Impacts of Tropical Cyclones and Tornadoes. State Senate of North Carolina, 1–29. Retrieved from https://clas-pages.uncc.edu/matt-eastin/files/2012/11/NC-Climate-Change-Assessment.pdf Emmanuel, K. (2005). Increasing Destructiveness of Tropical Cyclones over the past 30 Years. Nature, 436, 686–688. Retrieved from http://www.nature.com/nature/journal/v436/n7051/pdf/nature03906.pdf EPA. (2014). Southeast. Retrieved March 10, 2016, from http://www3.epa.gov/climatechange/impacts/southeast.html Extreme Weather. (2015). Retrieved February 08, 2016, from http://climatenexus.org/learn/extreme-weather Fischetti, M. (2016). What Is This Polar Vortex That Is Freezing the U.S.? Retrieved March 2, 2016, from http://blogs.scientificamerican.com/observations/what-is-this-polar-vortex-that-is-freezing-the-u-s/ Fuhrmann, C., & Konrad, C. E., II. (n.d.). Annual Winter Storm Frequencies. Retrieved February 23, 2016, from http://climate.ncsu.edu/climate/winter/climate_annualfreq.html Hartley, J. (2016). Spatial and temporal patterns of gastrointestinal illness and their relationship with precipitation across the state of North Carolina. University of North Carolina. Illinois Department of Public Health. (n.d.). Division of Communications. “After the Flood.” Retrieved from http://www.idph.state.il.us/public/books/flood.htm Ingram, K., K. Dow, L. Carter, J. Anderson, eds. (2013). Climate of the Southeast United States: Variability, change, impacts, and vulnerability. Washington DC: Island Press. Retrieved February 23, 2016 Kahn, B. (2014). Tornado Outbreaks Could Have a Climate Change Assist. Retrieved February 16, 2016, from http://www.climatecentral.org/news/climate-change-tornado-outbreaks-17861 Kinniburgh, F. (2015). Come Heat and High Water: Climate Risk in the Southeastern U.S. and Texas. Retrieved from http://riskybusiness.org/site/assets/uploads/2015/09/Climate-Risk-in-Southeast-and-Texas.pdf Knutti, R. (2008). Should we believe model predictions of future climate change? Retrieved April 18, 2016, from http://rsta.royalsocietypublishing.org/content/366/1885/4647

UNC Institute for the Environment Works Cited 38
Kunkel, K. E., Pielke Jr., R. A., & Shannon, S. A. (1999). Temporal fluctuations in weather and climate extremes that cause economic and human health impacts: A review. Bulletin of the American Meteorological Society, 80(6), 1077–1098. Retrieved from http://search.proquest.com/docview/232625894?pq-origsite=gscholar Kunkel, K. E.,, Thomas, R. K., Brooks, H., Kossin, J., Lawrimore, J. H., Arndt, D., Bosart, L., Chagnon, D., Cutter, S. L., Doesken, N., Kerry, E., Groisman, P. Y., Katz, R. W., Knuston, T., O’Brien, J., Paciorek, C. J., Peterson, T. C., Redmond, K., Robinson, D., Trapp, J., Vose, R., Weaver, S., Wehner, M., Wolter, K., and Wuebbles, D. 2013: Monitoring and understanding changes in extreme storm statistics: State of knowledge. Bull. Amer. Meteor. Soc., 94, 499–514. Lee, J. J. (2014, November 15). Climate Change May Spark More Lightning Strikes, Igniting Wildfires. Retrieved March 22, 2016, from http://news.nationalgeographic.com/news/2014/11/141113-climate-change-lightning-atmosphere-science/ Makar, Paula. (2015). Reclamation: Managing water in the west. Investigation of Climate Change Impact on Reservoir Capacity and Water Supply Reliability. http://www.usbr.gov/research/projects/detail.cfm?id=8990 Marian Koshland Science Museum. 2016 . Climate Processes. Retrieved April 19, 2016. McCully, Patrick. (1996). Sedimentation problems with dams. Silenced Rivers: The Ecology and Politics of Large Dams. International Rivers. https://www.internationalrivers.org/sedimentation-problems-with-dams National Aeronautic Space Administration (NASA). (2016). Global Climate Change: Effects. Retrieved April 19, 2016, from http://climate.nasa.gov National Aeronautic Space Administration (NASA). (n.d.). How does hail form? Precipitation Education. Retrieved from http://pmm.nasa.gov/education/content/how-does-hail-form National Conference of State Legislatures (NCSL). (2008). North Carolina Assessing the Costs of Climate Change. Retrieved February 23, 2016, from http://www.ncsl.org/print/environ/ClimateChangeNC.pdf National Oceanic and Atmospheric Administration (NOAA). (2010). Tornadoes and Climate Change. Retrieved March 08, 2016, from http://www.c2es.org/science-impacts/extreme-weather/tornadoes National Oceanic and Atmospheric Administration, Council of State and Territorial Epidemiologists, Carolinas Integrated Sciences Assessment, & North Carolina State Hazard Mitigation (NOAA). (2015). North Carolina Climate and Health Profile. Retrieved from http://epi.publichealth.nc.gov/oee/climate/ClimateAndHealthProfile.pdf

UNC Institute for the Environment Works Cited 39
National Resources Defense Council (NRDC). (n.d.). Climate Change Health Threats in North Carolina. Retrieved February 23, 2016, from http://www.nrdc.org/health/climate/nc.asp National Weather Service Weather Forecast Office. (2010, June 17). Retrieved March 10, 2016, from http://www.srh.noaa.gov/mrx/hydro/flooddef.php NC Department of Health and Human Services (NC DHHS). (2014). Asthma Program Initiatives. Retrieved April 14, 2016, from http://www.asthma.ncdhhs.gov/initiatives.htm NC State University. (2013, August 9). Evapotranspiration | Climate Education Modules for K-12. Retrieved March 03, 2016, from https://climate.ncsu.edu/edu/k12/.evapo NC State University A. Favorable Patterns for NC Winter Weather. (n.d.). Retrieved February 23, 2016, from http://climate.ncsu.edu/climate/winter_wx/Patterns.php NC State University B. Impacts of Winter Weather. (n.d.). Retrieved February 23, 2016, from http://climate.ncsu.edu/climate/winter_wx/Impacts.php NC State University C. What is Winter Weather in North Carolina? (n.d.). Retrieved February 23, 2016, from http://climate.ncsu.edu/climate/winter_wx/Introduction.php Niall, S., & Walsh, K. (2005). The impact of climate change on hailstorms in southeastern Australia. International Journal of Climatology, 25(14), 1933–1952. Retrieved from http://onlinelibrary.wiley.com/doi/10.1002/joc.1233/abstract Pechony, O., & Shindell, D. (2010). Driving forces of global wildfires over the past millennium and the forthcoming century. Retrieved February 23, 2016, from http://www.pnas.org/content/107/45/19167 Price, C. (2016, February 16). Thunderstorms, Lightning, and Climate Change. Lecture presented at 29th International Conference on Lightning Protection 2008 in Sweden, Uppsala. Price, C., & Rind, D. (1994). Possible implications of global climate change on global lightning distributions and frequencies. Journal of Geophysical Research, 99(D5), 10,823-10,831. Retrieved February 18, 2016, from Possible implications of global climate change on global lightning distributions and frequencies, Price and Rind, 1994. Trapp, R. J., Diffenbaugh, N. S., Brooks, H. E., Baldwin, M. E., Robinson, E. D., & Pal, J. S. (2007). Changes in severe thunderstorm environment frequency during the 21st century caused by anthropogenically enhanced global radiative forcing. Proceedings of the National Academy of Sciences, 104(50), 19719–19723. Retrieved from http://www.pnas.org/content/104/50/19719.full.pdf&title=Severe%20thunderstorms%20comprise%20an%20extreme%20class%20of%20deep

UNC Institute for the Environment Works Cited 40
University Corporation for Atmospheric Research (UCAR). (2010). Flash Flood Science. Flash Flood Early Warning System Reference Guide. http://www.meted.ucar.edu/communities/hazwarnsys/ffewsrg/FF_EWS.Chap.2.pdf USDA. (n.d.). Change in Average Summer (June - August) Precipitation [Digital image]. Retrieved March 5, 2016, from http://climate.ncsu.edu/pinemap/index.php?tool=summer_precip USGS. Landslides 101. (2016, January 14). Retrieved March 03, 2016, from http://landslides.usgs.gov/learn/ls101.php USGS. North Carolina. (2013, December 18). Retrieved March 03, 2016, from http://landslides.usgs.gov/research/inventory/northcarolina/ Uzochukwu, A.G. (2012). The Impact of Global Warming on North Carolina. Forum on Public Policy. Retrieved February 08, 2016, from http://forumonpublicpolicy.com/vol2012.no1/archive/uzochukwu.pdf Walsh, J., D. Wuebbles, K. Hayhoe, J. Kossin, K. Kunkel, G. Stephens, P. Thorne, R. Vose, M. Wehner, J. Willis, D. Anderson, S. Doney, R. Feely, P. Hennon, V. Kharin, T. Knutson, F. Landerer, T. Lenton, J. Kennedy, and R. Somerville. (2014). Ch. 2: Our Changing Climate. Climate Change Impacts in the United States: The Third National Climate Assessment, J. M. Melillo, Terese (T.C.) Richmond, and G. W. Yohe, Eds., U.S. Global Change Research Program, 19-67. doi:10.7930/J0KW5CXT. Webster, P. J., Holland, G. J., Curry, J. A., & Change, H. R. (2005). Changes in Tropical Cyclone Number, Duration, and Intensity in a Warming Environment. Science, 309(5742), 1844–1846. Retrieved from http://science.sciencemag.org/content/309/5742/1844.full Ylhäisi, Jussi S., Luca Garrè, Joseph Daron, and Jouni Räisänen. 2014. “Quantifying Sources of Climate Uncertainty to Inform Risk Analysis for Climate Change Decision-Making.” Local Environment, January, 1–25. doi:10.1080/13549839.2013.874987. Yongqiang, L., Stanturf, J., & Goodrick, S. (2010). Trends in global wildfire potential in a changing climate. Retrieved February 23, 2016, from http://www.sciencedirect.com/science/article/pii/S0378112709006148

UNC Institute for the Environment Appendix A: Strategies Table 41
APPENDIX A This table includes all specific strategies proposed in the report. For each strategy we include a brief description, source, cost, timeframe, and co-benefits. The hazard column refers to the main natural hazard(s) that the strategy addresses. “All” indicates general hazard mitigation. The source refers to what city’s mitigation or adaptation plan we used to develop the strategy and may be a resource for further developing that strategy. The cost column uses dollar signs to symbolize the expected price of the strategy: $ = 0 to 100,000; $$ = 100,000 to 250,000; $$$ = >250,000. Timeframe categories were established based on estimations for implementations. There are three timeframe categories: <2 years, 2-5 years, and >5 years. Improve Stormwater Management Systems Description Hazard Source Cost Timeframe
Increase frequency of storm drain cleaning to allow maximum functionality. Flooding Denver $ <2 years
Improve stormwater management by encouraging local governments to restore natural flood protection (wetlands) and reduce impermeable surfaces.
Flooding Fresno County $$ 2-5 years
Ensure that all pipes are equipped with backflow valves and especially all fuel pipes are equipped with automatic shut-off valves.
Flooding ASFPM $$ 2-5 years
All counties should follow Durham's stormwater system retrofit idea: identify locations for cost-effective retrofit or improvements to the stormwater conveyance system that will improve the quality of stormwater runoff and/or reduce the potential for downstream flooding.
Flooding Durham $$ >5 years
Educate Public and Supply Outreach Services Description Hazard Source Cost Timeframe
Develop educational materials about limiting exposure to extreme heat to be distributed among all community members.
Heat Albany, Chester $ <2 years
Work with the region’s children’s museums and foundations to create and fund educational exhibits on climate change, green technologies, clean cities, etc. For example, consider partnerships with the Morehead Planetarium.
All Miami-Dade County $$ 2-5 years
Provide energy efficiency education. Create educational campaign to promote Energy Star® qualified roofing products targeted at roofers, builders, and architects. Educate and provide resources and information about utility rebate programs.
All Denver $$ 2-5 years
Encourage homeowners and businesses to purchase flood insurance. Flooding Waveland $ 2-5 years
Educate citizens about safety during flood conditions, including the dangers of driving on flooded roads.
Flooding Durham $ 2-5 years
Provide an online forum in order to provide information about reduced water use, fire management techniques such as removal of hazard fuels, and air quality issues. (Widely distribute Code Red air quality information to outdoor events).
All Baltimore, CSKT $ <2 years
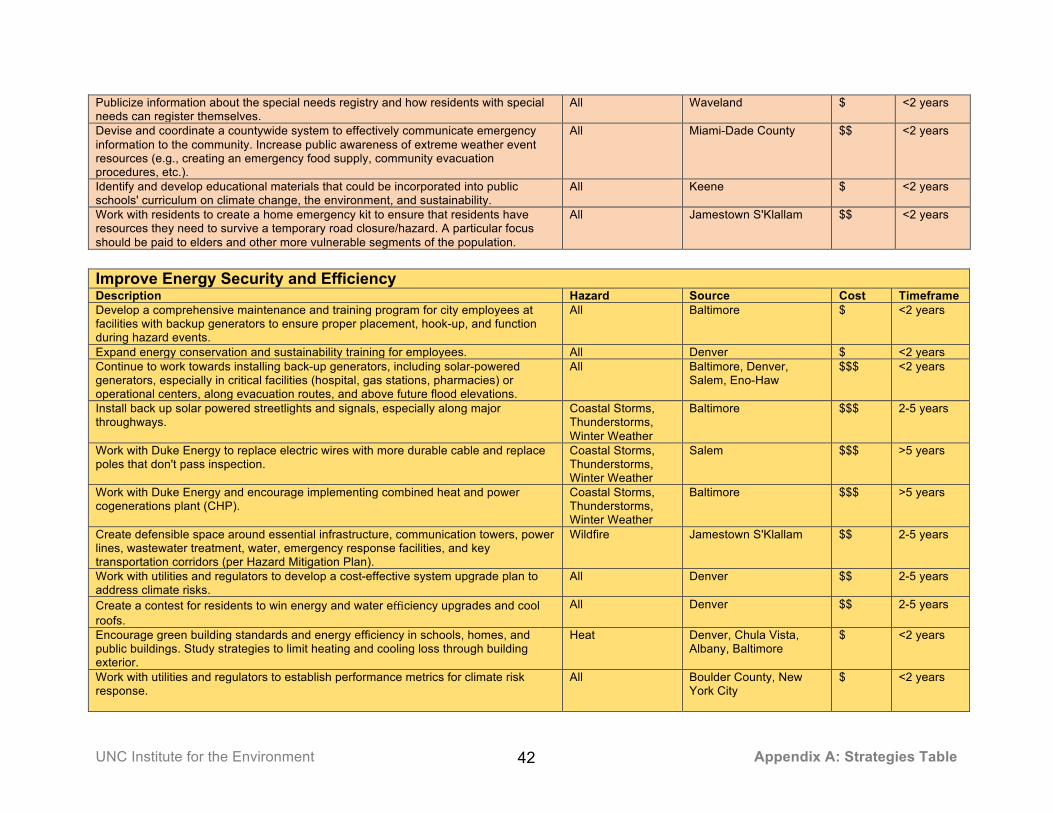
UNC Institute for the Environment Appendix A: Strategies Table 42
Publicize information about the special needs registry and how residents with special needs can register themselves.
All Waveland $ <2 years
Devise and coordinate a countywide system to effectively communicate emergency information to the community. Increase public awareness of extreme weather event resources (e.g., creating an emergency food supply, community evacuation procedures, etc.).
All Miami-Dade County $$ <2 years
Identify and develop educational materials that could be incorporated into public schools' curriculum on climate change, the environment, and sustainability.
All Keene $ <2 years
Work with residents to create a home emergency kit to ensure that residents have resources they need to survive a temporary road closure/hazard. A particular focus should be paid to elders and other more vulnerable segments of the population.
All Jamestown S'Klallam $$ <2 years
Improve Energy Security and Efficiency Description Hazard Source Cost Timeframe Develop a comprehensive maintenance and training program for city employees at facilities with backup generators to ensure proper placement, hook-up, and function during hazard events.
All Baltimore $ <2 years
Expand energy conservation and sustainability training for employees. All Denver $ <2 years Continue to work towards installing back-up generators, including solar-powered generators, especially in critical facilities (hospital, gas stations, pharmacies) or operational centers, along evacuation routes, and above future flood elevations.
All Baltimore, Denver, Salem, Eno-Haw
$$$ <2 years
Install back up solar powered streetlights and signals, especially along major throughways.
Coastal Storms, Thunderstorms, Winter Weather
Baltimore $$$ 2-5 years
Work with Duke Energy to replace electric wires with more durable cable and replace poles that don't pass inspection.
Coastal Storms, Thunderstorms, Winter Weather
Salem $$$ >5 years
Work with Duke Energy and encourage implementing combined heat and power cogenerations plant (CHP).
Coastal Storms, Thunderstorms, Winter Weather
Baltimore $$$ >5 years
Create defensible space around essential infrastructure, communication towers, power lines, wastewater treatment, water, emergency response facilities, and key transportation corridors (per Hazard Mitigation Plan).
Wildfire Jamestown S'Klallam $$ 2-5 years
Work with utilities and regulators to develop a cost-effective system upgrade plan to address climate risks.
All Denver $$ 2-5 years
Create a contest for residents to win energy and water efficiency upgrades and cool roofs.
All Denver $$ 2-5 years
Encourage green building standards and energy efficiency in schools, homes, and public buildings. Study strategies to limit heating and cooling loss through building exterior.
Heat Denver, Chula Vista, Albany, Baltimore
$ <2 years
Work with utilities and regulators to establish performance metrics for climate risk response.
All Boulder County, New York City
$ <2 years

UNC Institute for the Environment Appendix A: Strategies Table 43
Help households and businesses conserve energy through free energy audits and consultations; develop a protocol for monitoring electricity use.
All Laguna Woods, Missoula $ <2 years
Encourage white roofs, focusing on buses, homes, and companies. Heat Albany, Chester $ <2 years Elevate electrical, mechanical, safety systems and install waterproof conduits. Flooding, coastal
storms, thunderstorm
New York City $$ <2 years
Establish the requirement that new construction builders bury utilities during the construction phase.
All Salem $$ <2 years
Investigate off-grid, on-site renewable energy systems, generators, and technologies for critical facilities to ensure redundancy of energy systems (M).
All Swinomish, Baltimore, Marquette
$ <2 years
Develop smart grid technologies that will be able to provide real-time data on damages to Emergency Services Staff in the event of a large-scale weather events.
Flooding Baltimore $$$ >5 years
Improve Hazard Preparedness and Response Description Hazard Source Cost Timeframe
Train staff to better remove ice and prepare roads for winter weather. Winter weather Baltimore $ <2 years
Map drought risks and water availability via climate change scenarios; review existing watershed management plans.
Drought Baltimore $ <2 years
Develop and improve water supply and drought management plans. (i.e. increasing recharge into groundwater basin, improving recharge, reducing groundwater use).
Drought Fresno County, Denver, CSKT, San Luis, Obispo
$ <2 years
Continue to maintain and/or establish agreements with local fire agencies for emergency response to increased wildfire incidents, which may occur as the result of climate change.
Wildfire Santa Cruz No cost <2 years
Coordinate heat-related resources, donations, and volunteers during extreme events or heat waves.
Heat Denver $ <2 years
Ensure completeness and availability of identified emergency supplies (water, food) and resources; including, but not limited to items such as water main repair parts, generators, pumps, sandbags, road clearing, medical, and communication. Identify/catalogue current supply; procure additional items/services to ensure preparedness in the event of a climate event.
All Lewes, Santa Cruz, Miami Dade County
$$ 2-5 years
Review scientific literature for any significant changes in predicted precipitation amounts and frequency of thunderstorms. Apply these findings to future storm water mitigation projects and plans.
Flooding, Thunderstorms
Boulder County/Albany $ 2-5 years
Identify distribution points and identify alternative routes and modes of transport for life-essential goods and services.
All Keene, Baltimore, Dane County
$ <2 years
Ensure all water and wastewater-pumping stations have off-grid power. All Baltimore $ <2 years
Developing back up phone systems and Voice over internet protocols for hospitals, so that healthcare providers can better communicate with residents during floods.
Flooding Baltimore $ 2-5 years

UNC Institute for the Environment Appendix A: Strategies Table 44
Consider investing in better and more equipment to handle winter weather on public roads (CNG-fueled vehicles and snowplows, for instance).
Winter Weather Dane County $$$ 2-5 years
Create a severe weather ordinance to allow homeless shelters to expand the number of people they can hold during extreme weather events.
All Denver $ <2 years
Increase food safety and security by designating sites for community gardens and farmers’ markets and expanding USDA capacity for food inspection.
Heat Denver, Fresno County $ <2 years
Encourage businesses to develop relocation plan if buildings are temporarily unusable due to flooding.
Flooding Jamestown S'Klallam $ 2-5 years
Update vulnerable facilities, assess infrastructure and address land use codes Description Hazard Source Cost Timeframe
Maintenance of hazardous limbs and trees to mitigate potential infrastructure damage. Coastal Storms, Thunderstorms, Winter Weather
Baltimore, Denver $ <2 years
Revamp public emergency shelters with new technology, backup power, cooling capabilities, etc.
Coastal Storms, Thunderstorms, Winter Weather
Boston $$$ 2-5 years
Require new paved lots that are greater than 1 acre to increase permeability by 15% compared to previous standards or conditions.
Flooding Denver $ <2 years
Consider adopting Transferable Development Rights to promote development in appropriate areas (out of flood zones). Create a vulnerable area overlay that includes temporal and spatial planning requirements to show changes in flooding. Land in this area would be subject to additional building codes and usage regulation to protect the property from flooding.
Flooding, Coastal Storms
Missoula, Albany $ <2 years
Determine benefits of Alamance county enrolling in FEMA's Community Rating System program.
Flooding Albany, Anne Arundel $ <2 years
Identify ways to flood-proof existing communications infrastructure (particularly those involving the use of copper wiring). Place emphasis on infrastructure that is known to be old.
Flooding Baltimore $ <2 years
Every five years review flooding ordinances and building codes to ensure that the two are in agreement.
Flooding Somerset $ >5 years
Retrofitting commercial and industrial buildings with green infrastructure (green roofs, swales, cisterns, permeable pavements) that capture stormwater for reuse or allow natural filtration, which mitigates flooding and promotes water conservation. This could be accomplished by adopting Low Impact Development (LID) standards.
Flooding, Heat Albany $$$ >5 years
Encourage critical emergency service providers to assess whether infrastructure is at risk of damage from future natural hazards.
All Denver $ <2 years

UNC Institute for the Environment Appendix A: Strategies Table 45
Conserve Water Description Hazard Source Cost Time
frame Revise and create Water Conservation Plan Guidelines and Landscape Manuals, respectively, to explicitly incorporate and promote recycled water and onsite water reuse systems, potentially using incentives into the project design and review process. Develop a gray water and rainwater-harvesting ordinance.
Drought Chula Vista, Denver, Keene, Marquette, Oakland, San Luis Obispo, Swinomish, Fresno County, Jamestown S'Klallam
$ <2 years
Require new development projects to demonstrate projected water use. Drought Albany, Denver $$ 2-5 years
Work with local water utilities to develop a leak notification program to inform customers whenever a spike in consumption meets requirements for a potential leak. Install automated meter reading so consumers can track water usage. Increase water prices to reflect true costs.
Drought Denver, Fresno County, San Luis Obispo
$$ 2-5 years
Develop/require high water efficiency product standards for fixtures installed in new developments exceeding a certain size threshold.
Drought Denver, Fresno County $ 2-5 years
Onsite Water Reuse Incentive – Create an “Onsite Water Reuse Incentive Fund” to provide rebates for onsite water reuse. The fund will specifically target retrofitting existing residences and businesses to maximize onsite water collection and reuse, thus decreasing reliance on imported water sources and helping to lower monthly utility costs.
Drought Chula Vista, Swinomish $$$ >5 years
Restore natural areas that provide groundwater recharge. Drought, Flooding Fresno County $$ <2 years Improve Alert Systems Description Hazard Source Cost Time
frame Use media outlets to increase awareness of risk associated with extreme heat. Target at-risk populations, outdoor workers and those who exercise outdoors.
Heat Albany, Chester, Chula Vista, Denver
$ <2 years
Continue/Create standardized alerts and early warning system for emergencies throughout the year. For example, air quality alerts provide smoke-free areas. To alert the populations of the air quality risks during extreme heat events, the health department may integrate EPA’s pre-existing air quality alert program (EnviroFlash).
All Baltimore $$ <2 years
Establish a Reverse 911 (Durham has already incorporated this) automated callback system in the community to notify residents of evacuation routes or other information in the event of an emergency or disaster.
All Keene, Waveland $ <2 years

UNC Institute for the Environment Appendix A: Strategies Table 46
Enhance and manage vegetation and green areas, with emphasis on implementing green infrastructure Description Hazard Source Cost Time
frame Use and investigate challenges to using controlled burns under climate-altered future, using ecologically sound thinking. Analyze and implement forest management techniques such as prescribed burning.
Wildfires Boulder County, Denver, Fresno County
$ <2 years
Manage forest density for reduced susceptibility to wildfires. This includes developing a strategy to reduce biomass fuel in the wildfire-urban interface. Remove biomass in sustainable and ecologically sound manner.
Wildfires Jamestown S'Klallam, Marquette, Missoula, Oakland, Santa Cruz
$$ <2 years
Increase conservation efforts to preserve ecosystems and wildlife habitat, which will promote biodiversity and natural flood control (ex: restoring wetlands).
Flooding Fresno County, Dane County, Albany County
$ >5 years
Monitor and address potential disease outbreaks Description Hazard Source Cost Time
frame Anticipate the arrival of new disease vectors and associated diseases and identify alternative methods to control or eradicate those vectors: develop early detection and warning systems.
Drought, Heat, Flooding
Keene, Fresno County $$ 2-5 years
Identify areas at risk for stagnant water, which may be at risk to vector born diseases by mosquitoes.
Drought, Heat, Flooding
Denver $ <2 years
Expand and implement ongoing water quality monitoring for areas at risk for pollution and contamination, which may result in unsafe levels of bacteria.
Drought, Heat, Flooding
Fairbanks $$ <2 years