Embed Size (px)
Citation preview
In their simplest form, steels are alloys of Iron (Fe) and
Carbon (C). The Fe-C phase diagram is a fairly complex
one, but we will only consider the steel part of the diagram,
up to around 7% Carbon.
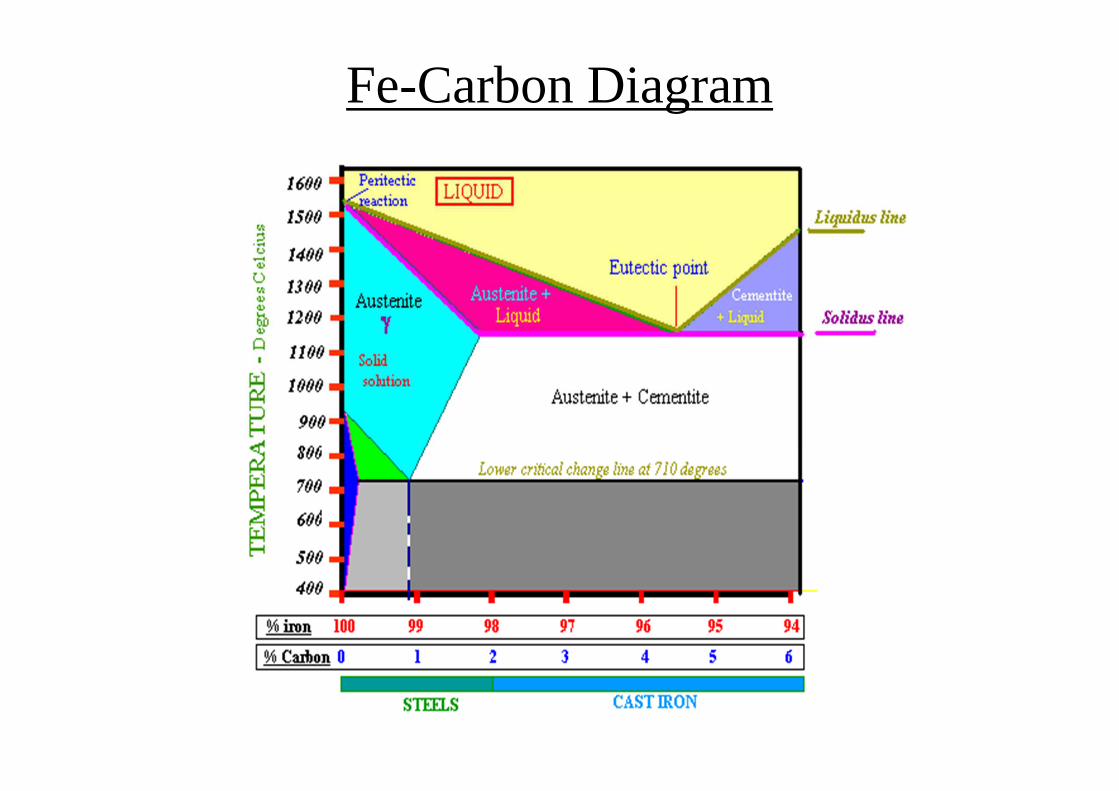
Fe-Carbon Diagram
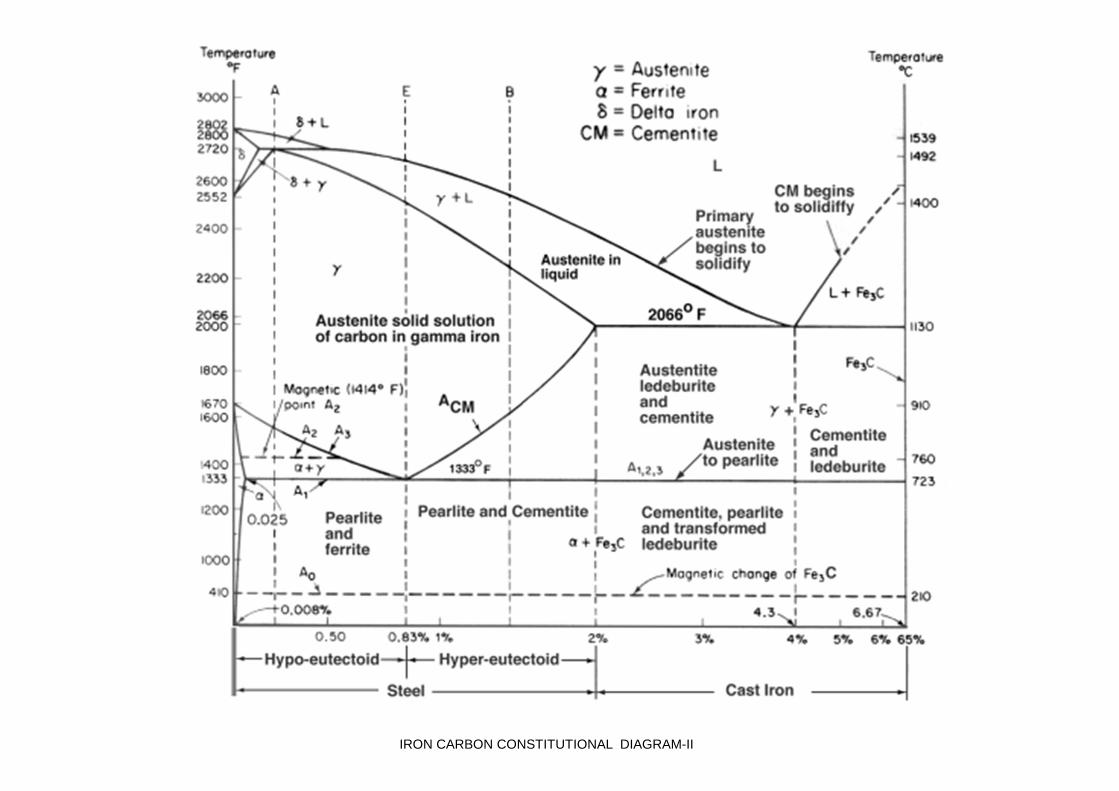
IRON CARBON CONSTITUTIONAL DIAGRAM-II
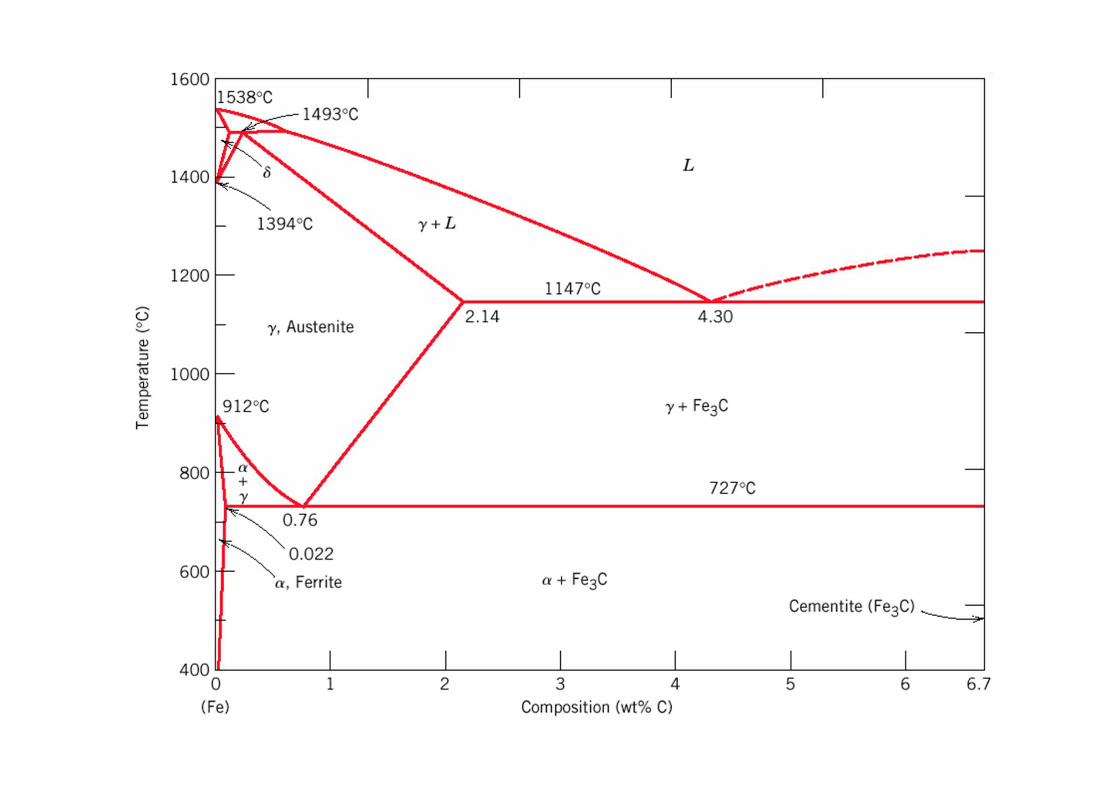
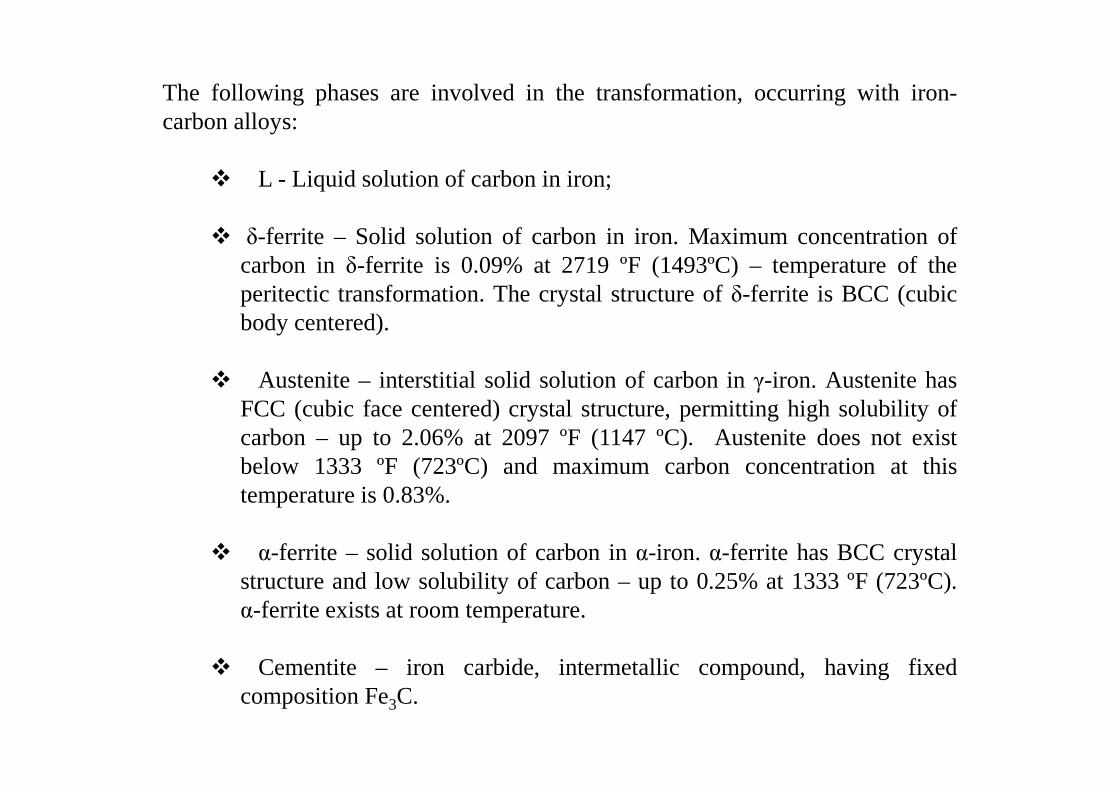
The following phases are involved in the transformation, occurring with iron-carbon alloys:
� L - Liquid solution of carbon in iron;
� δ-ferrite – Solid solution of carbon in iron. Maximum concentration ofcarbon inδ-ferrite is 0.09% at 2719 ºF (1493ºC) – temperature of theperitectic transformation. The crystal structure ofδ-ferrite is BCC (cubicbody centered).
� Austenite – interstitial solid solution of carbon inγ-iron. Austenite hasFCC (cubic face centered) crystal structure, permitting high solubility ofcarbon – up to 2.06% at 2097 ºF (1147 ºC). Austenite does not existbelow 1333 ºF (723ºC) and maximum carbon concentration at thistemperature is 0.83%.
� α-ferrite – solid solution of carbon inα-iron. α-ferrite has BCC crystalstructure and low solubility of carbon – up to 0.25% at 1333 ºF (723ºC).α-ferrite exists at room temperature.
� Cementite – iron carbide, intermetallic compound, having fixedcomposition Fe3C.
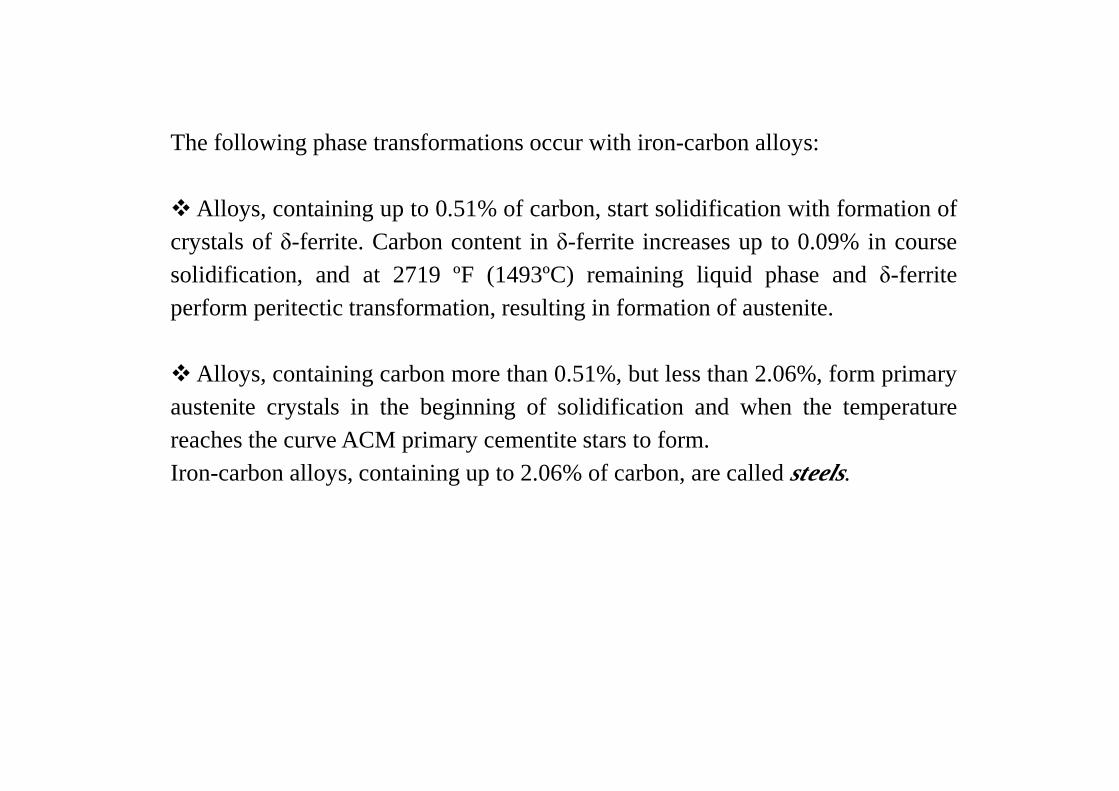
The following phase transformations occur with iron-carbon alloys:
� Alloys, containing up to 0.51% of carbon, start solidification with formationofcrystals ofδ-ferrite. Carbon content inδ-ferrite increases up to 0.09% in coursesolidification, and at 2719 ºF (1493ºC) remaining liquid phase andδ-ferriteperform peritectic transformation, resulting in formation of austenite.
� Alloys, containing carbon more than 0.51%, but less than 2.06%, form primaryaustenite crystals in the beginning of solidification and when the temperaturereaches the curve ACM primary cementite stars to form.Iron-carbon alloys, containing up to 2.06% of carbon, are calledsteels.
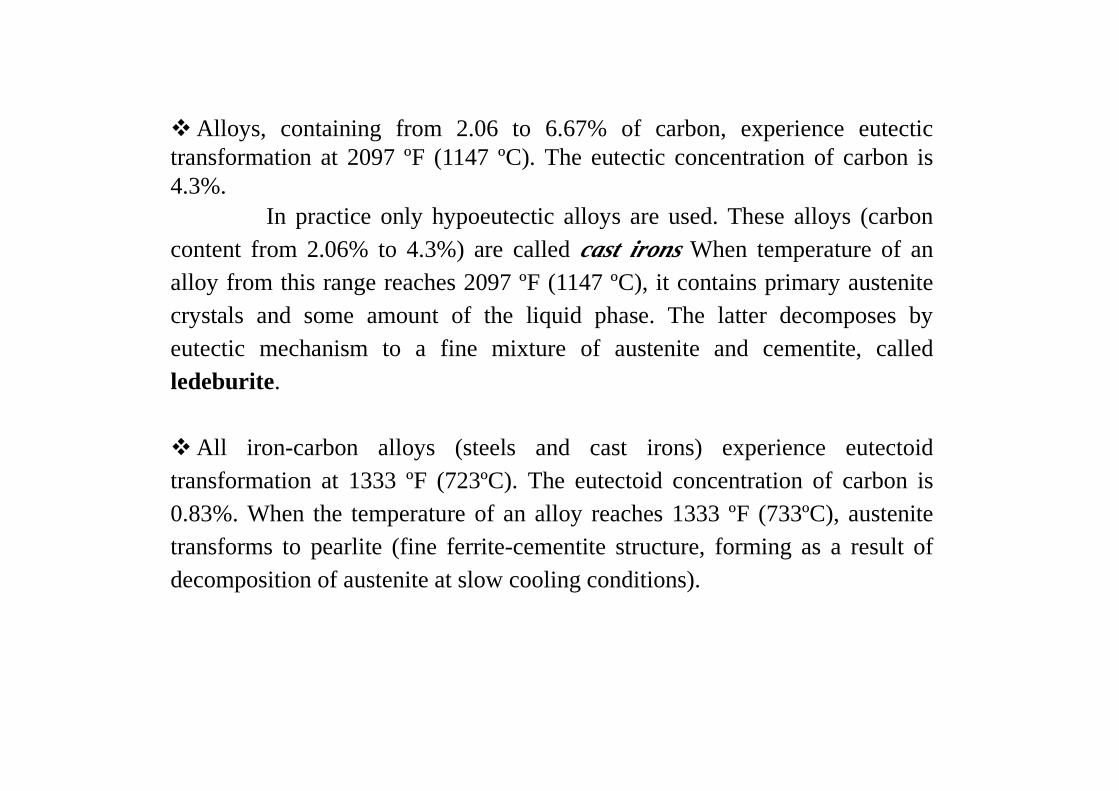
� Alloys, containing from 2.06 to 6.67% of carbon, experience eutectictransformation at 2097 ºF (1147 ºC). The eutectic concentration of carbon is4.3%.
In practice only hypoeutectic alloys are used. These alloys (carboncontent from 2.06% to 4.3%) are calledcast irons When temperature of analloy from this range reaches 2097 ºF (1147 ºC), it contains primary austenitecrystals and some amount of the liquid phase. The latter decomposes byeutectic mechanism to a fine mixture of austenite and cementite, calledledeburite.
� All iron-carbon alloys (steels and cast irons) experience eutectoidtransformation at 1333 ºF (723ºC). The eutectoid concentration of carbon is0.83%. When the temperature of an alloy reaches 1333 ºF (733ºC), austenitetransforms to pearlite (fine ferrite-cementite structure, forming as a result ofdecomposition of austenite at slow cooling conditions).
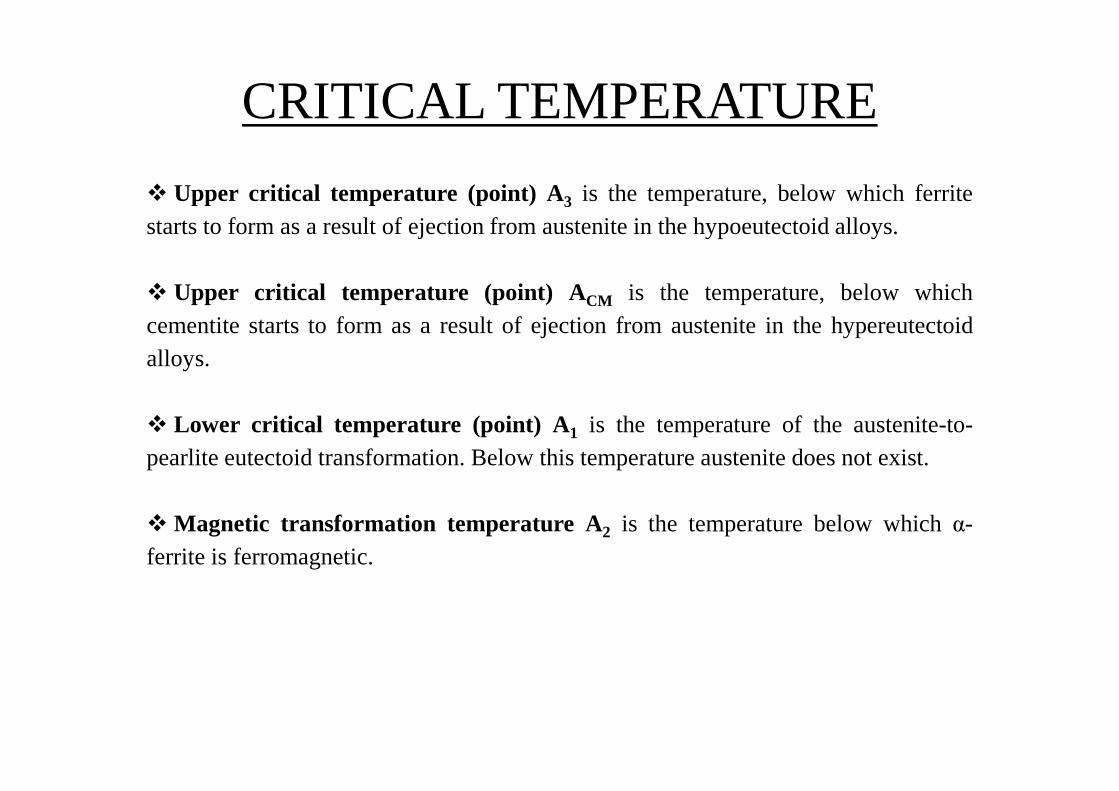
� Upper critical temperature (point) A3 is the temperature, below which ferritestarts to form as a result of ejection from austenite in the hypoeutectoid alloys.
� Upper critical temperature (point) ACM is the temperature, below whichcementite starts to form as a result of ejection from austenite in the hypereutectoidalloys.
� Lower critical temperature (point) A1 is the temperature of the austenite-to-pearlite eutectoid transformation. Below this temperature austenite does notexist.
� Magnetic transformation temperature A2 is the temperature below whichα-ferrite is ferromagnetic.
CRITICAL TEMPERATURE
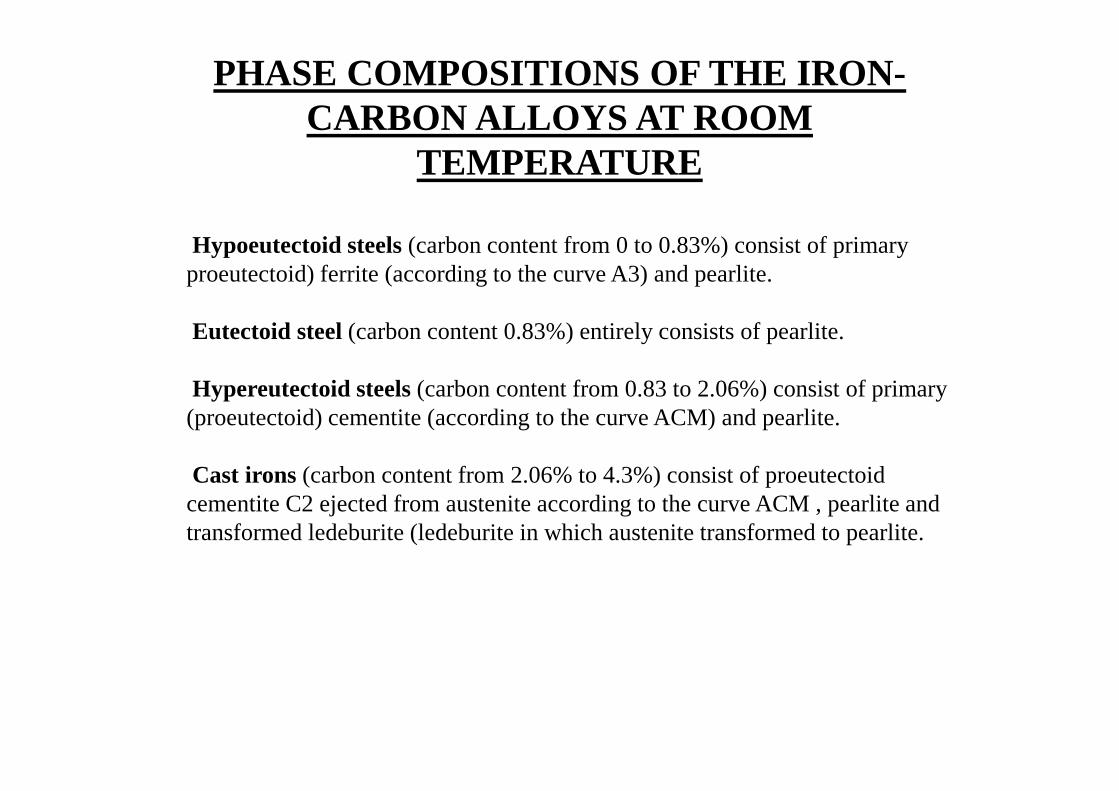
Hypoeutectoid steels (carbon content from 0 to 0.83%) consist of primary proeutectoid) ferrite (according to the curve A3) and pearlite.
Eutectoid steel (carbon content 0.83%) entirely consists of pearlite.
Hypereutectoid steels (carbon content from 0.83 to 2.06%) consist of primary (proeutectoid) cementite (according to the curve ACM) and pearlite.
Cast irons (carbon content from 2.06% to 4.3%) consist of proeutectoid cementite C2 ejected from austenite according to the curve ACM , pearlite and transformed ledeburite (ledeburite in which austenite transformed to pearlite.
PHASE COMPOSITIONS OF THE IRON-CARBON ALLOYS AT ROOM
TEMPERATURE
PHASES OF IRON
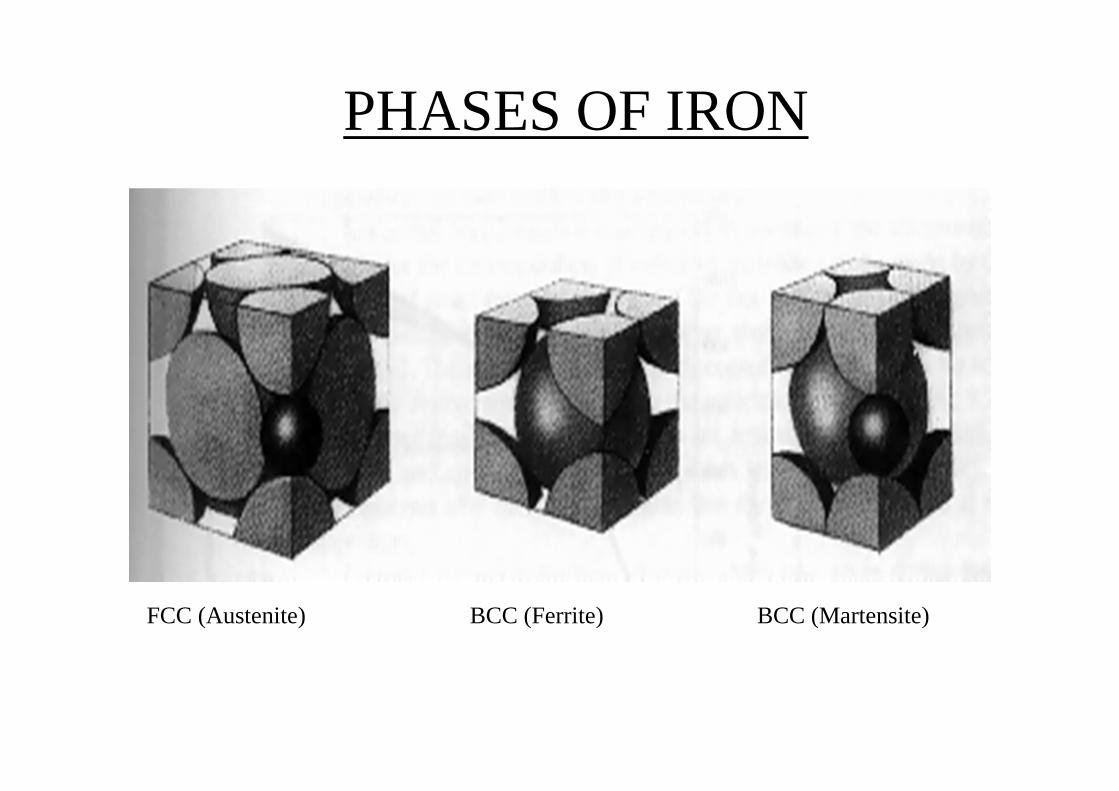
FCC (Austenite) BCC (Ferrite) BCC (Martensite)
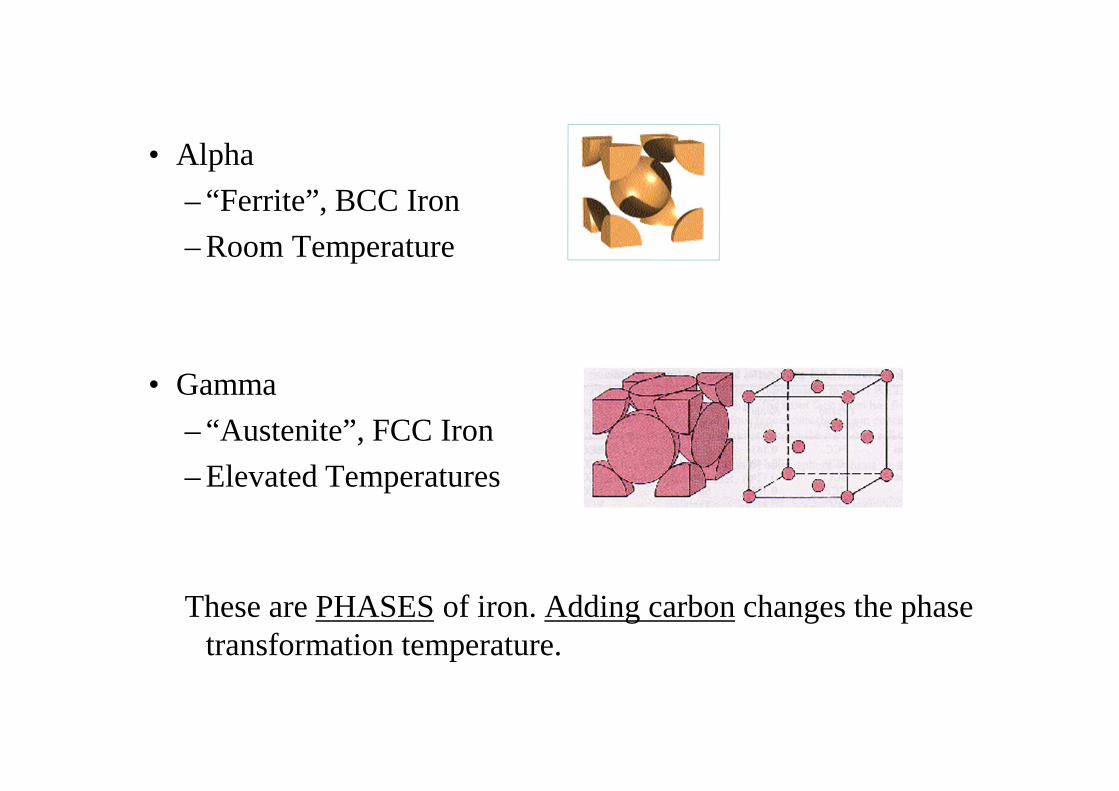
• Alpha
– “Ferrite”, BCC Iron
– Room Temperature
• Gamma
– “Austenite”, FCC Iron
– Elevated Temperatures
These are PHASES of iron. Adding carbon changes the phase transformation temperature.
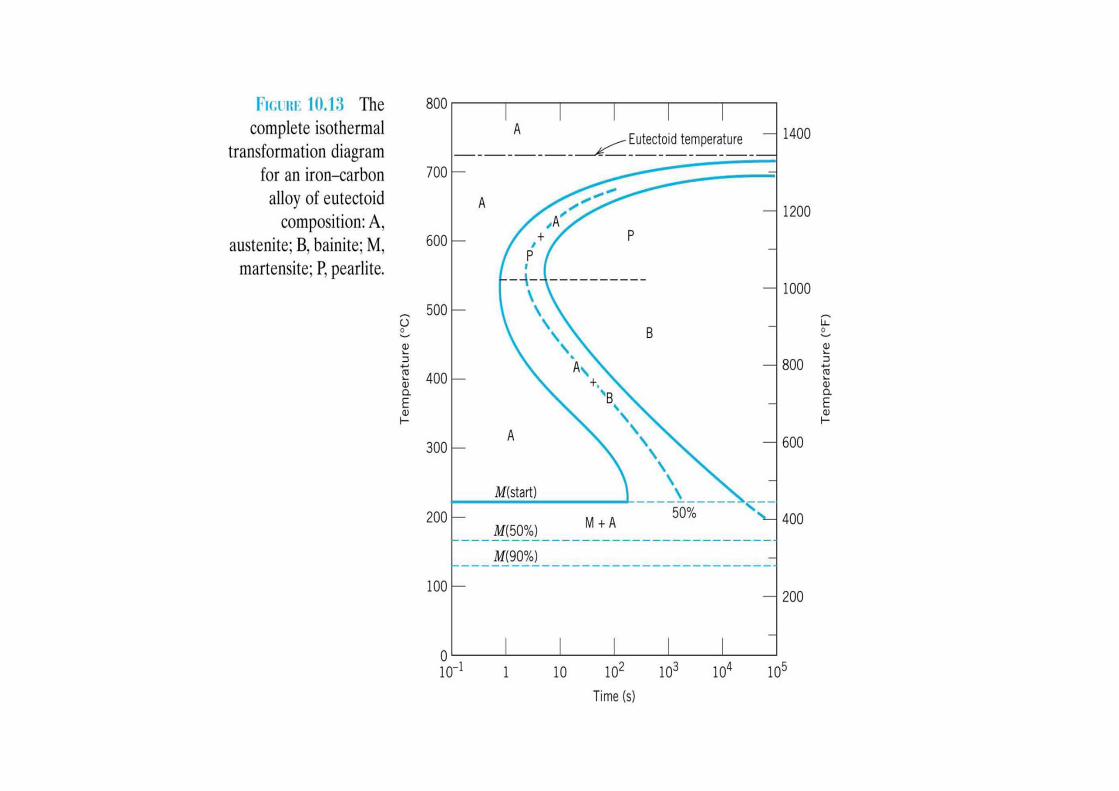
T (Time) T(Temperature) T(Transformation) diagram is a plot of temperatureversus the logarithm of time for a steel alloy of definite composition. It is used todetermine when transformations begin and end for an isothermal (constanttemperature) heat treatment of a previously austenitized alloy. When austenite iscooled slowly to a temperature below LCT (Lower Critical Temperature),thestructure that is formed is Pearlite. As the cooling rate increases,the pearlitetransformation temperature gets lower. The microstructure of the material issignificantly altered as the cooling rate increases. By heating and cooling a seriesof samples, the history of the austenite transformation may be recorded. TTTdiagram indicates when a specific transformation starts and ends and it alsoshows what percentage of transformation of austenite at a particular temperatureis achieved.
TTT DIAGRAM
TTT DIAGRAM
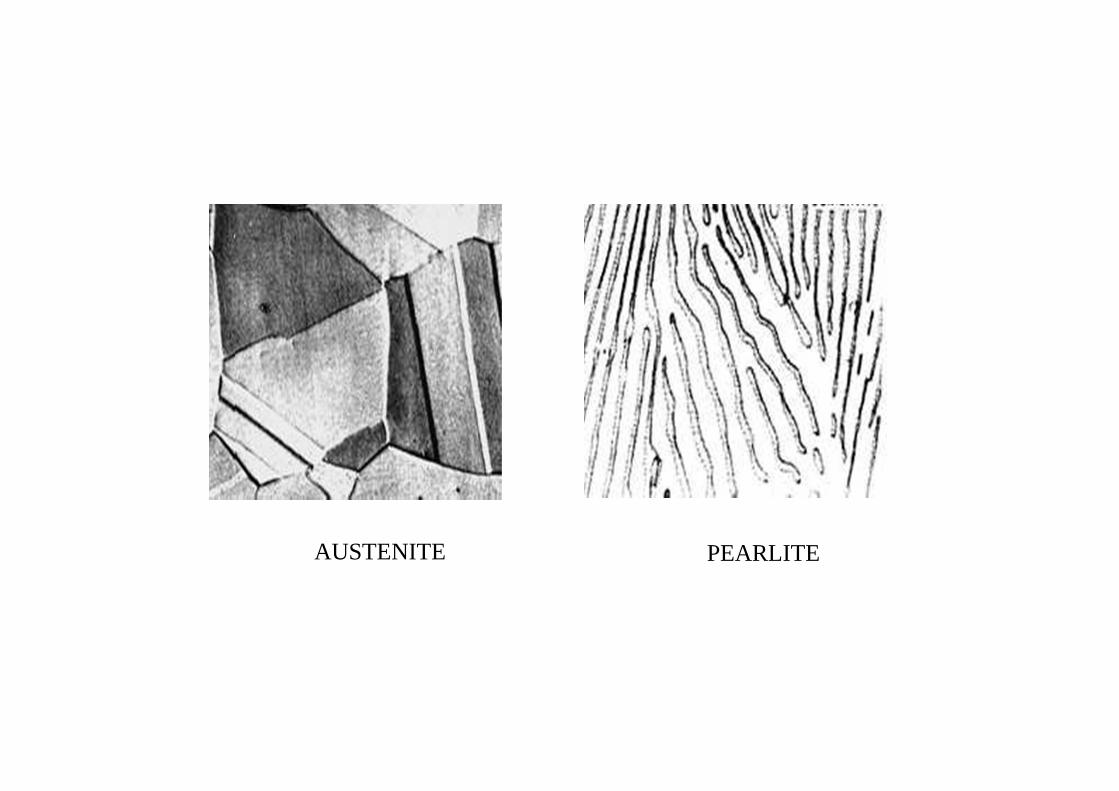
AUSTENITE PEARLITE
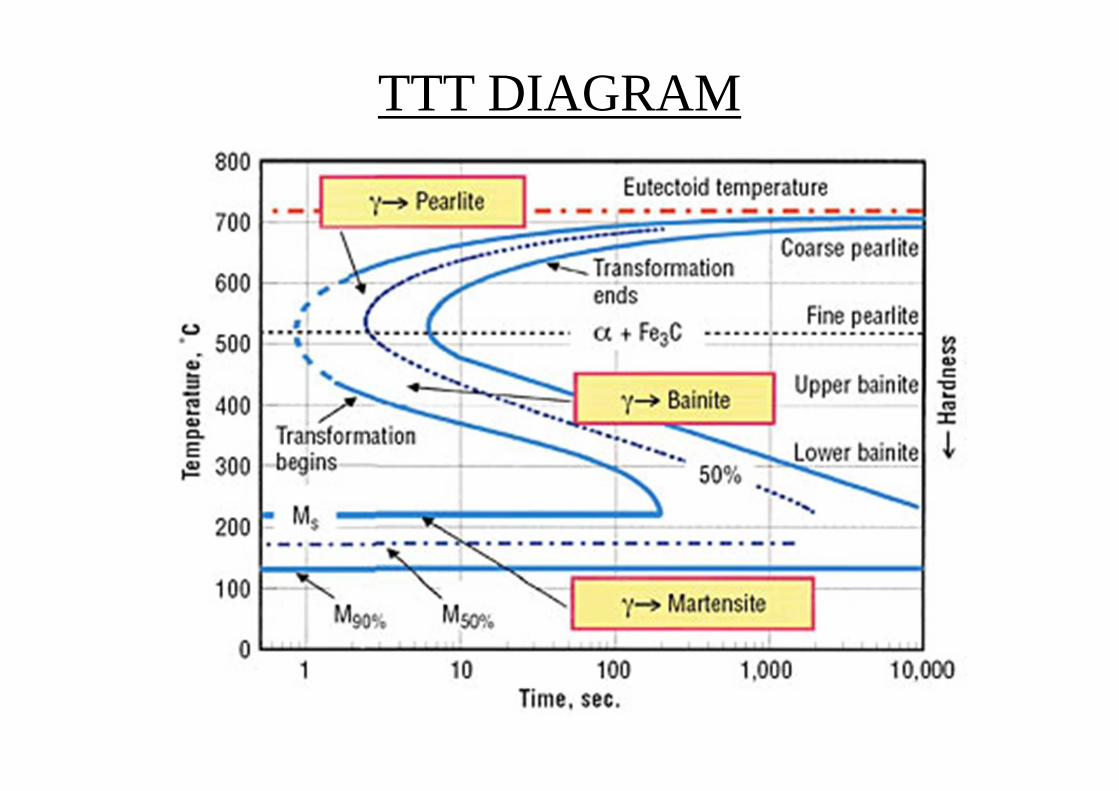
Austenite is stable at temperatures above LCT but unstable below LCT. Left curve
indicates the start of a transformation and right curve represents the finish of a
transformation. The area between the two curves indicates the transformation of
austenite to different types of crystal structures. (Austenite to pearlite, austenite to
martensite, austenite to bainite transformation.) Isothermal Transform Diagram
shows thatγ to transformation (a) is rapid! at speed of sound; (b) the percentage of
transformation depends on Temperature only:
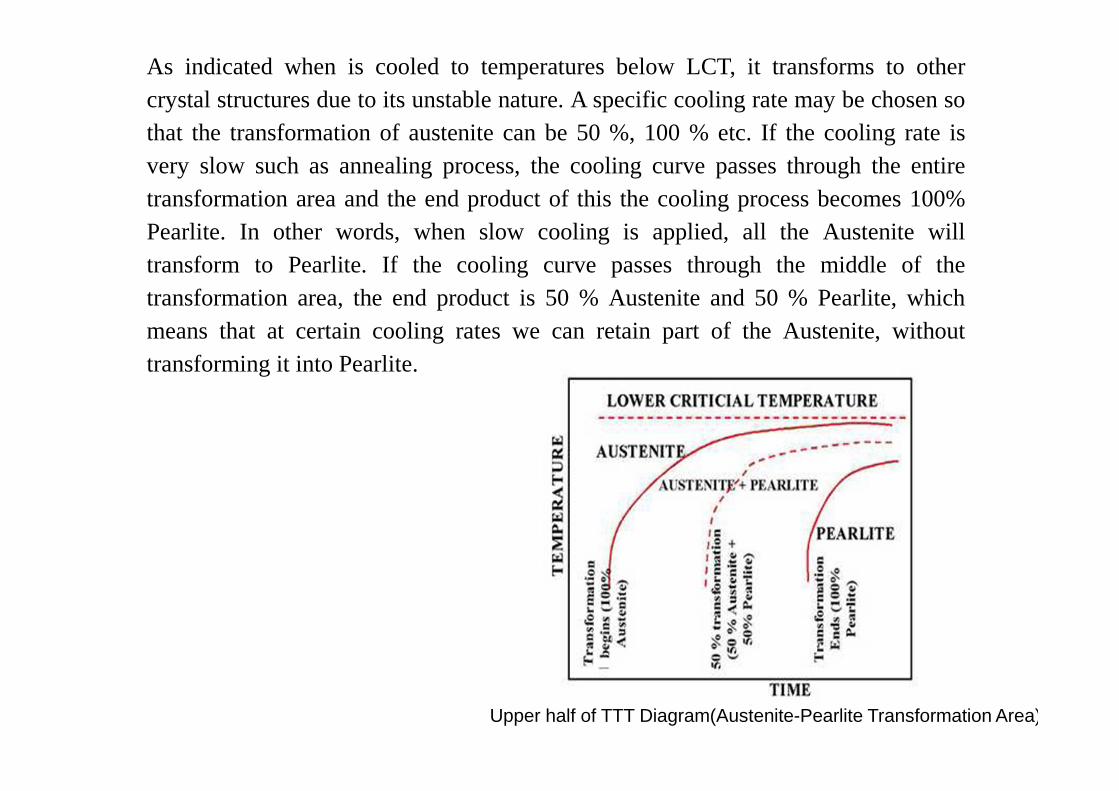
As indicated when is cooled to temperatures below LCT, it transforms to othercrystal structures due to its unstable nature. A specific cooling rate may be chosen sothat the transformation of austenite can be 50 %, 100 % etc. If the cooling rate isvery slow such as annealing process, the cooling curve passes through the entiretransformation area and the end product of this the cooling process becomes 100%Pearlite. In other words, when slow cooling is applied, all the Austenite willtransform to Pearlite. If the cooling curve passes through the middle of thetransformation area, the end product is 50 % Austenite and 50 % Pearlite, whichmeans that at certain cooling rates we can retain part of the Austenite,withouttransforming it into Pearlite.
Upper half of TTT Diagram(Austenite-Pearlite Transformation Area)
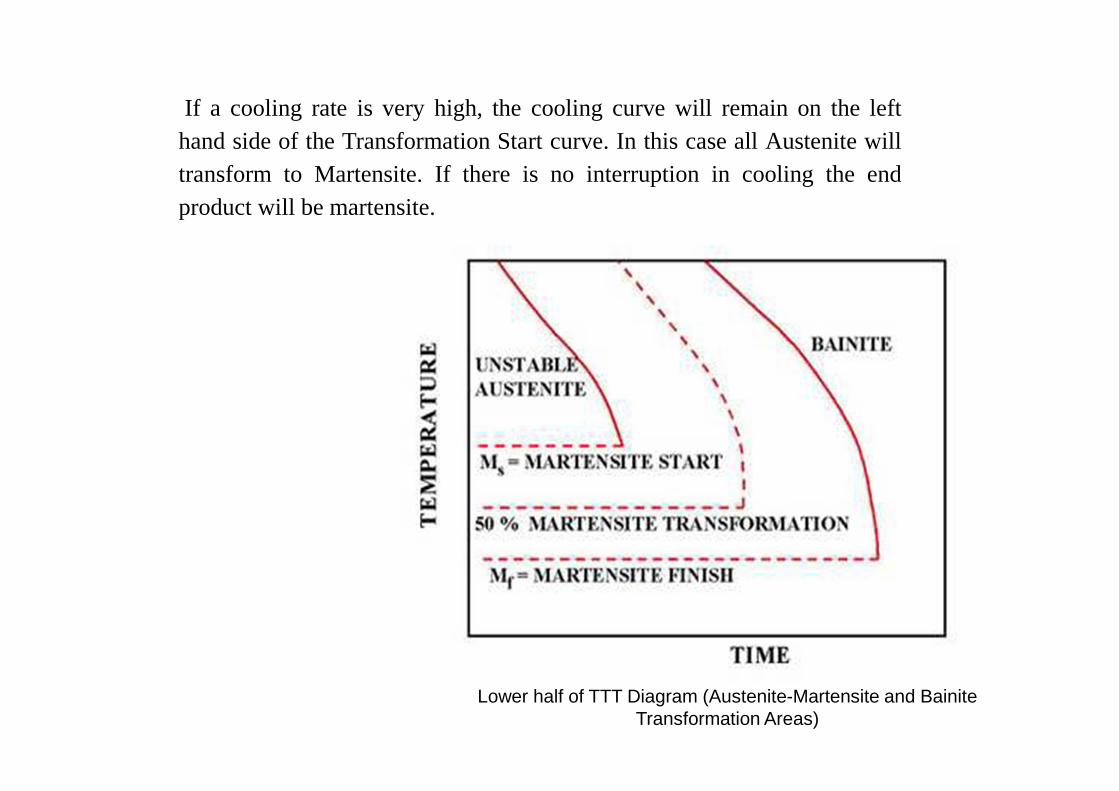
If a cooling rate is very high, the cooling curve will remain on the lefthand side of the Transformation Start curve. In this case all Austenite willtransform to Martensite. If there is no interruption in cooling the endproduct will be martensite.
Lower half of TTT Diagram (Austenite-Martensite and Bainite Transformation Areas)