Embed Size (px)
Citation preview

1
Paul Lorton, IDOT
Yanning Li, Juan Carlos Martinez Mori, andProf. Dan Work (UIUC)
Improving the Effectiveness of Smart Work Zone Technologies
ICT R27-155

2
• Background on smart work zones
• Evaluation of smart work zones in microsimulation
• Representative findings
Outline

3
• Work Zone Safety and Mobility– Safety Policy 3-07
• The overall goal of this policy is to reduce and eliminate crashes and fatalities, and to mitigate congestion due to work zones
• IDOT has utilized smart work zone technology for several years
• This research project was initiated with the goal to provide a better understanding of the most efficient, accurate, and cost-effective system deployments for various work zone conditions
IDOT Motivation

4
IDOT Motivation (cont.)

5
Smart Work ZonesThe use of sensors, computers, and portable changeable message signs to collect and convey real-time traffic information to motorists

6
Smart Work Zones (cont.)
The use of sensors, computers, and portable changeable message signs to collect and convey real-time traffic information to motorists
Research project with UIUC
(Location)
7
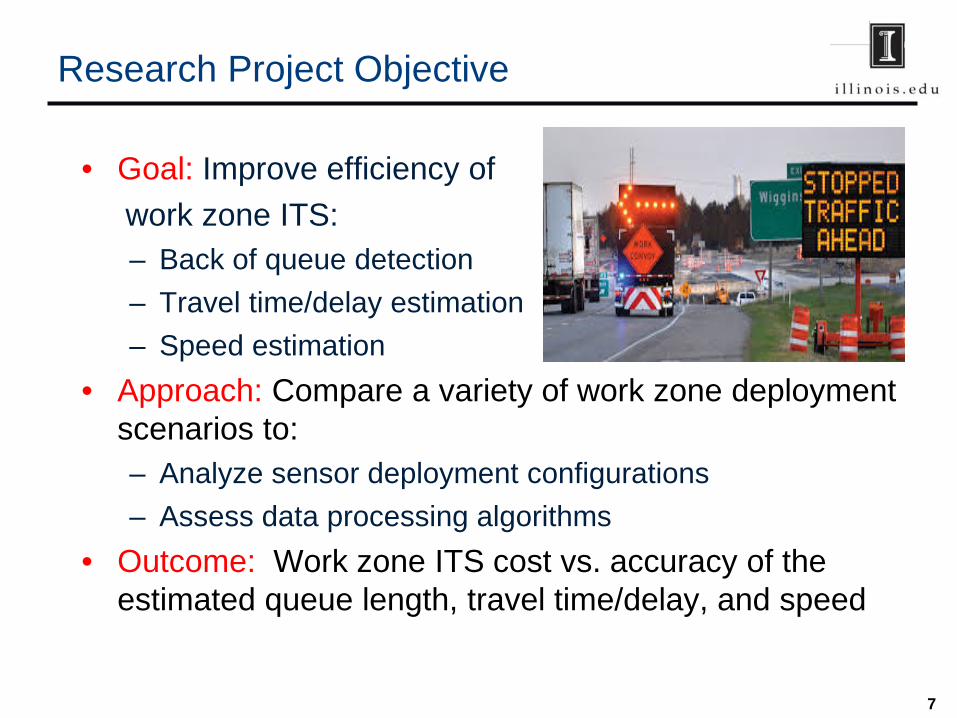
Research Project Objective
• Goal: Improve efficiency ofwork zone ITS:– Back of queue detection – Travel time/delay estimation– Speed estimation
• Approach: Compare a variety of work zone deployment scenarios to:– Analyze sensor deployment configurations– Assess data processing algorithms
• Outcome: Work zone ITS cost vs. accuracy of the estimated queue length, travel time/delay, and speed

8
• Background on smart work zones
• Evaluation of smart work zones in microsimulation
• Representative findings
Outline

9
Proposed Microsimulation Approach
Raw data
Data Processing Algorithms
Estimates
Simulated in Aimsun
Ground Truth
Extract from Aimsun
Compare
Error Metric for Estimates
• Extract the traffic data directly from Aimsun– use as ground truth
• Compare the estimates with the ground truth– compute the error – compare the performance across
configurations of networks– compare the performance across
algorithms
Sensors

10
• Southbound on I-57 near Mt. Vernon in Jefferson County, District 9
• Simulated congested traffic from 3:30~6:00 PM on November 26, 2014
• Eight (8) radar sensors and one (1) RTMS* sensor (SB7) were deployed
*Remote Traffic Microwave Sensor
Modeling of Two Work Zones: I-57
Simulated Traffic
Work zone

11
• Eastbound on I-80 west of the Des Plaines River in Will County, District 1
• Simulated congested traffic from 3:30~6:00 PM on May 1, 2015
• Eight (8) radar sensors and five (5) RTMS sensors were deployed
Modeling of Two Work Zones: I-80
Work zoneSimulated
Traffic

12
Goal: Model “virtual” sensors with realistic errors in the microsimulation environment. • Types of errors:
– Measurement noise – Inconsistency due to placement and orientation– Missing data– Occlusion …
Modeling Sensors in Microsimulation

13
Goal: Model “virtual” sensors with realistic error in the microsimulation environment. • Typical sensors used in work zones:
– RTMS• Pro: Less prone to occlusion• Con: Difficult to install and calibrate
– Doppler radar• Pro: Easy installation• Con: Large error in slow traffic conditions
– LER* (iCone)• Pro: Fast and easy deployment• Con: Less accurate volume data
*Low-Energy Radar
Modeling Sensors in Microsimulation (cont.)

14
Three algorithms were implemented covering different levels of complexity:• Simple: Interpolate the sensor measurement in space
– Pro: Easy to implement
– Con: Instantaneous estimates changes in time
• Intermediate: Smooth measurements in time and space – Pro: Smoother changes of estimates in travel time
– Con: Degraded performance in online estimation
• Advanced: Integrate traffic models with measurements– Pro: High performance in traffic condition estimation
– Con: Difficult to implement
Algorithms

15
• Estimated quantity:– Traffic velocity (for traffic velocity estimation)– Queue length (for back of queue detection)– Travel time (for travel time estimation)
• For each quantity:– Evaluated different sensor deployments that varied in:
• spacing of sensors• types of sensors• accuracy of sensors
– Evaluated three algorithms:
• simple, intermediate, and advanced
Completed Evaluation

16
• Background on smart work zones
• Evaluation of smart work zones in microsimulation
• Representative findings
Outline
17
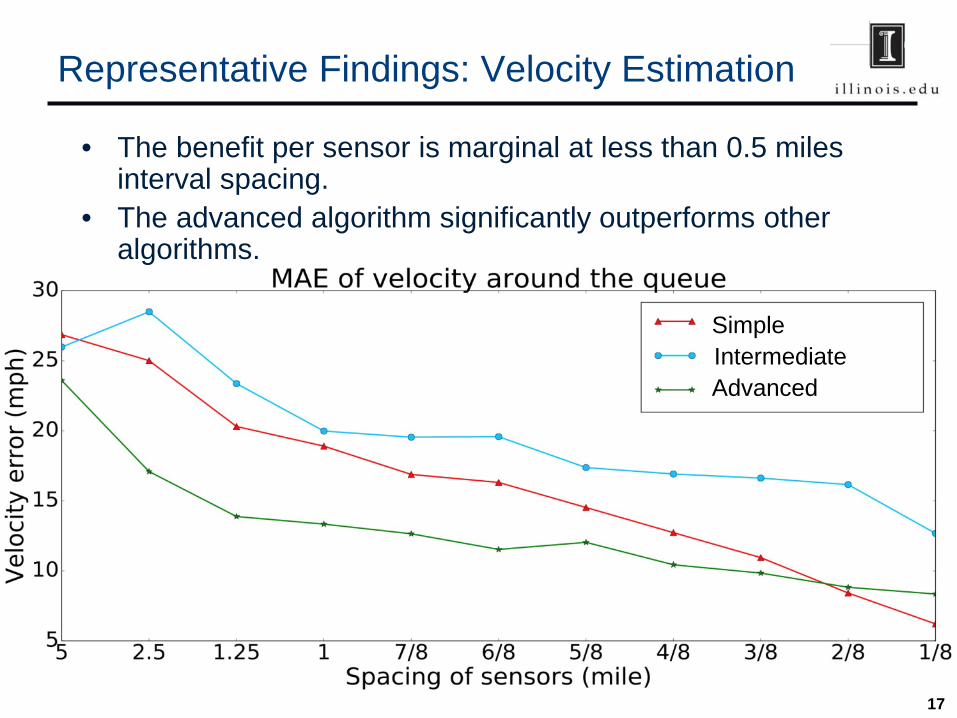
Representative Findings: Velocity Estimation
• The benefit per sensor is marginal at less than 0.5 miles interval spacing.
• The advanced algorithm significantly outperforms other algorithms.
IntermediateSimple
Advanced

18
Representative Findings: Velocity Estimation
• Types of sensors have insignificant effect on the velocity estimation.
• Higher accuracy of sensors provides marginal benefit.
SimpleIntermediateAdvanced
SimpleIntermediateAdvanced

19
• Denser spacing than 1 mile interval provides insignificant improvements.
• The advanced significantly outperforms other algorithms.
Representative Findings: Queue Estimation
IntermediateSimple
Advanced

20
• Types and accuracy of sensors do not have significant influence on queue estimation.
• The advanced algorithm is relatively more sensitive to the types of sensors.
Representative Findings: Queue Estimation
SimpleIntermediateAdvanced
SimpleIntermediateAdvanced

21
• All algorithms have poor performance in travel time estimation across different sensor configurations.
• Algorithms with predictive models should be used for an accurate travel time estimation.
Representative Findings: Travel Time Estimation
IntermediateSimple
Advanced

22
• Advanced algorithms can reduce the number of sensors needed, however they require significant effort for implementation.
• At the same cost, adding more lower cost radar sensors provides more benefit than fewer more expensive RTMS sensors.
Representative Findings: Cost Performance
Simple + RTMSSimple + RADARIntermediate + RTMSIntermediate + RADARAdvanced + RTMSAdvanced + RADAR

23
Challenges in Data Quality
• Missing data:– Example: I-57 Southbound,
11/26/2014, 2-11PM• 20.87% of speed data is missing• Vehicle count is set to 0 (unrealistic)

24
• Inconsistent data:– Example: I-80, May 2015: Vehicle count measurements differ by
88-108% with no entrance/exit ramp in either sensor group.
Challenges in Data Quality

25
• Causes for data quality issues:– Malfunctioning sensors– Inappropriate calibration of sensors– Principle limitation of sensors– Cellular network issues (e.g., cellular tower maintenance)
• Ongoing efforts:– Vendors are actively increasing the reliability of sensors.– Vendors collaborates with cellular providers to increase
the reliability of cellular communication.– IDOT will start to investigate these issues through
collaboration with vendors, now that this issue come to light.
Challenges in Data Quality

26
• The spacing of sensors is important for all applications (velocity, queue length, and travel time estimation).– However, additional sensors spaced closer than a 0.5
mile interval provide marginal benefits. • The advanced algorithm has the potential to improve
the estimation accuracy and reduce cost. – However, it requires significant effort to implement.
• The accuracy of sensors provides marginal benefits, although the reliability of sensors should be improved.
• All algorithms implemented provide poor travel time estimation. Accurate travel time estimation requires predictive models.
Findings: Summary