Embed Size (px)
Citation preview

12/11/2017
1
qi.elft.nhs.uk
@ELFT_QI
Improving Behavioral Health
through Quality Improvement
Marie Navina Auzewell
Paul John James Amar
Introducing the ELFT Team
12/11/2017
2
Mental health servicesNewham, Tower Hamlets, City & Hackney
Forensic servicesAll above & Waltham Forest, Redbridge, Barking & Dagenham, Havering
Child & Adolescent services, including tier 4 inpatient service
Regional Mother & Baby unit
Community health services Newham
IAPTNewham, Richmond and Luton
Speech & LanguageBarnet
Challenges and
opportunities
Cultural diversity
Social deprivation
Geographical diversity
Commissioningarrangements
Financial stability and
strong assurance systems
12/11/2017
3
@ELFT_QI
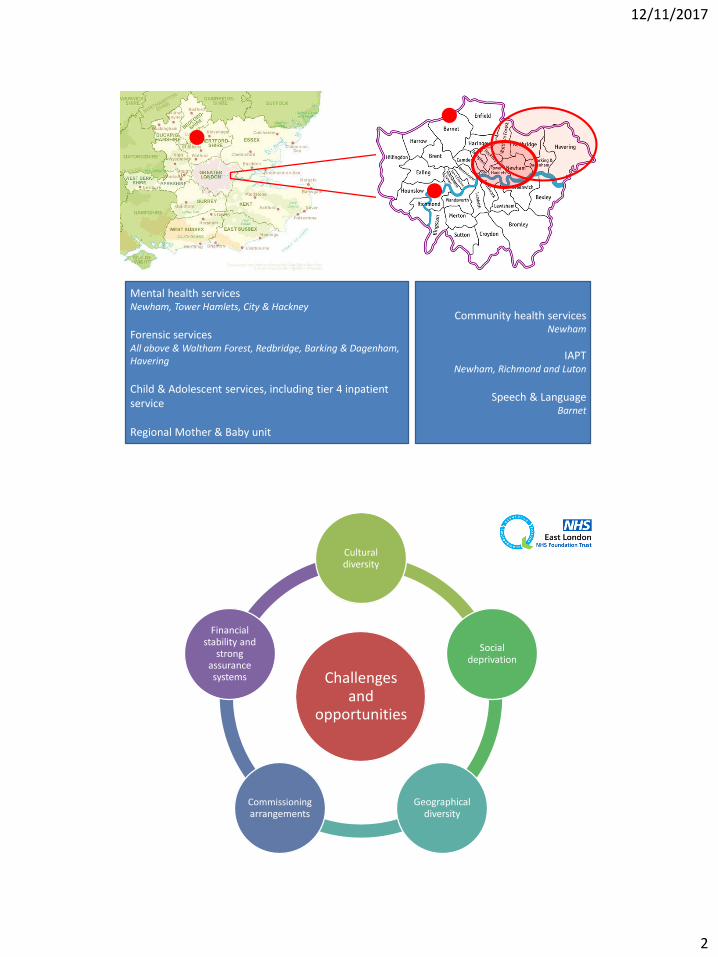
Objectives for today’s learning lab
1. Develop an understanding of how quality improvement can be applied in behavioralhealth settings
2. Identify change ideas that might help solve complex quality issues in behavioral health care
3. Understand the link between involvement, improvement and recovery
[email protected] qi.elft.nhs.uk
@ELFT_QI
Today’s Agenda
[email protected] qi.elft.nhs.uk
• Introduction to ELFT & setting the context for improvement work to begin
• Overview of our organisational approach
• Increasing service user, carer and family involvement in QI
• Is it making a difference?
• Panel Discussion
12/11/2017
4
@[email protected] qi.elft.nhs.uk
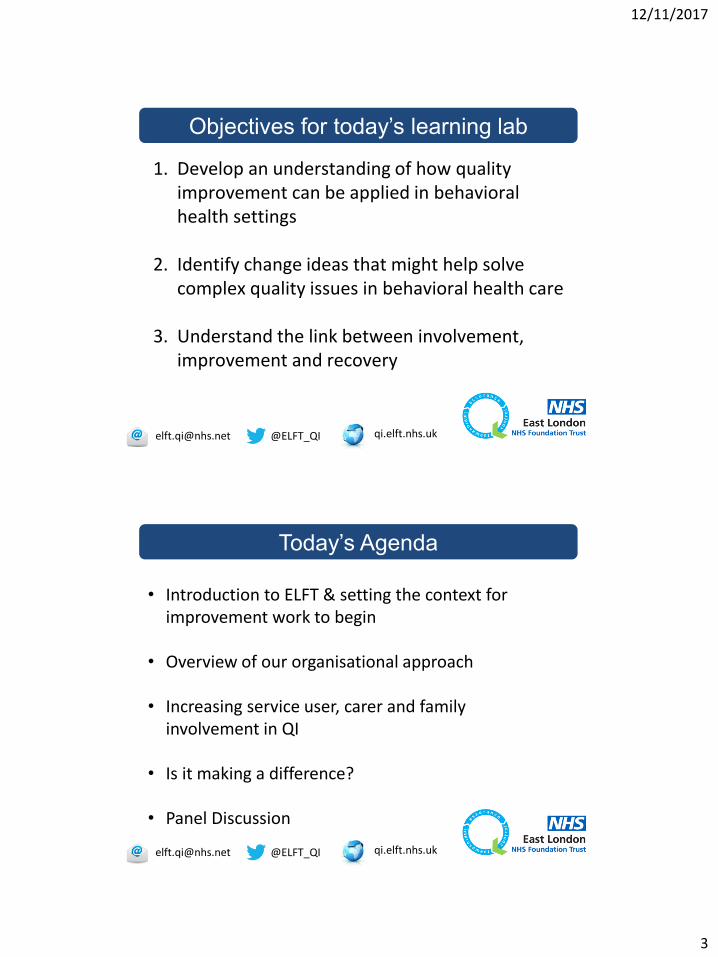
Introduction
with Dr Navina EvansConsultant child & adolescent psychiatrist
Chief Executive Officer

12/11/2017
5
12/11/2017
6
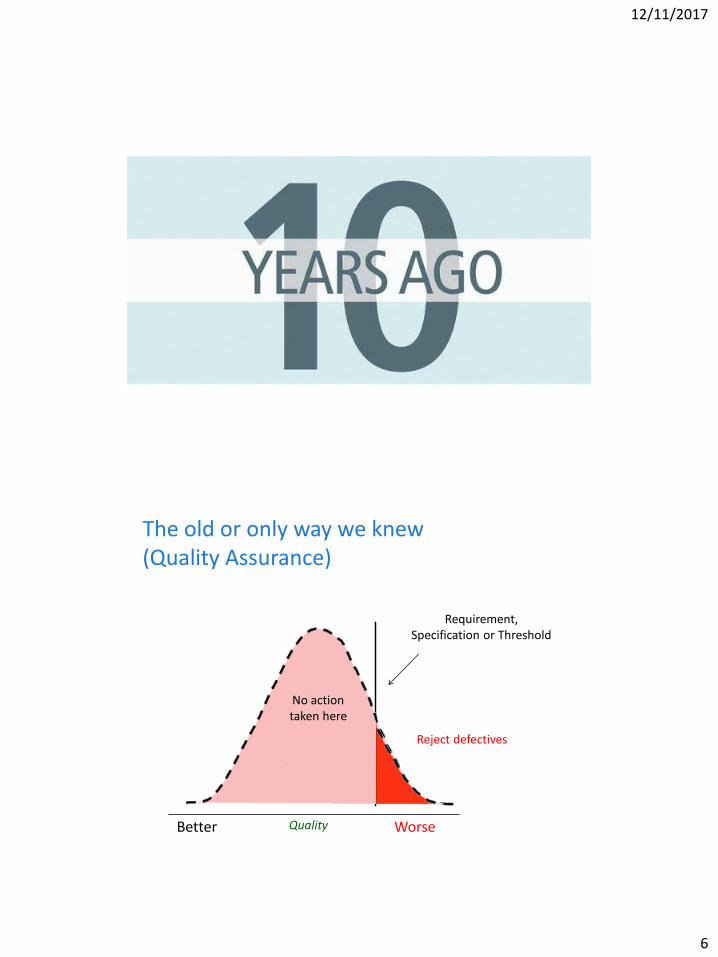
The old or only way we knew (Quality Assurance)
QualityBetter
Reject defectives
Requirement,Specification or Threshold
No action taken here
Worse
12/11/2017
7
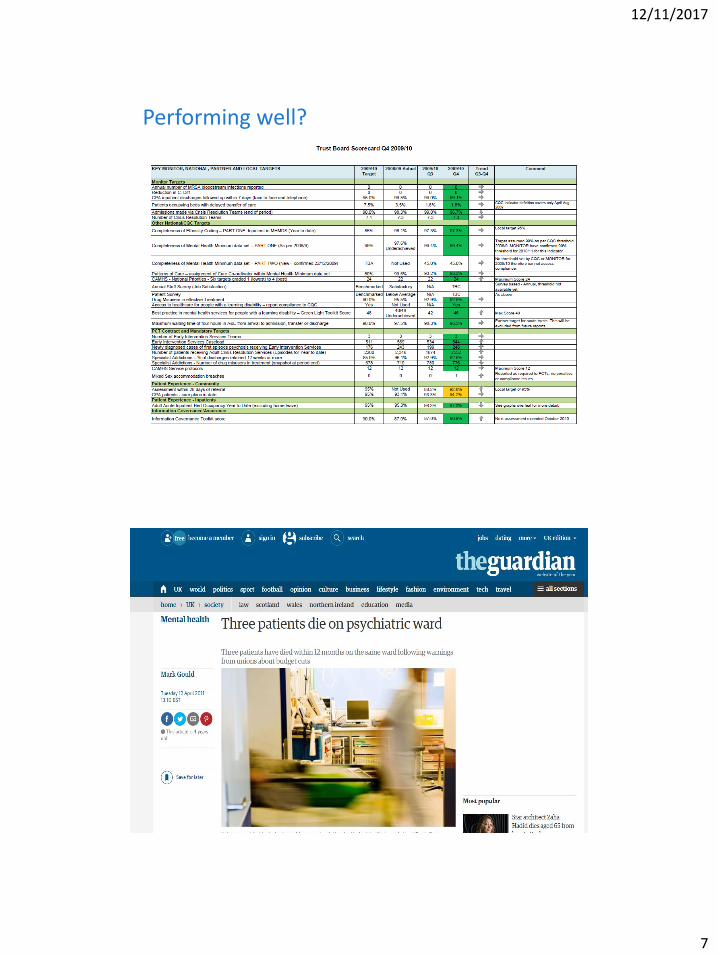
Performing well?
12/11/2017
8
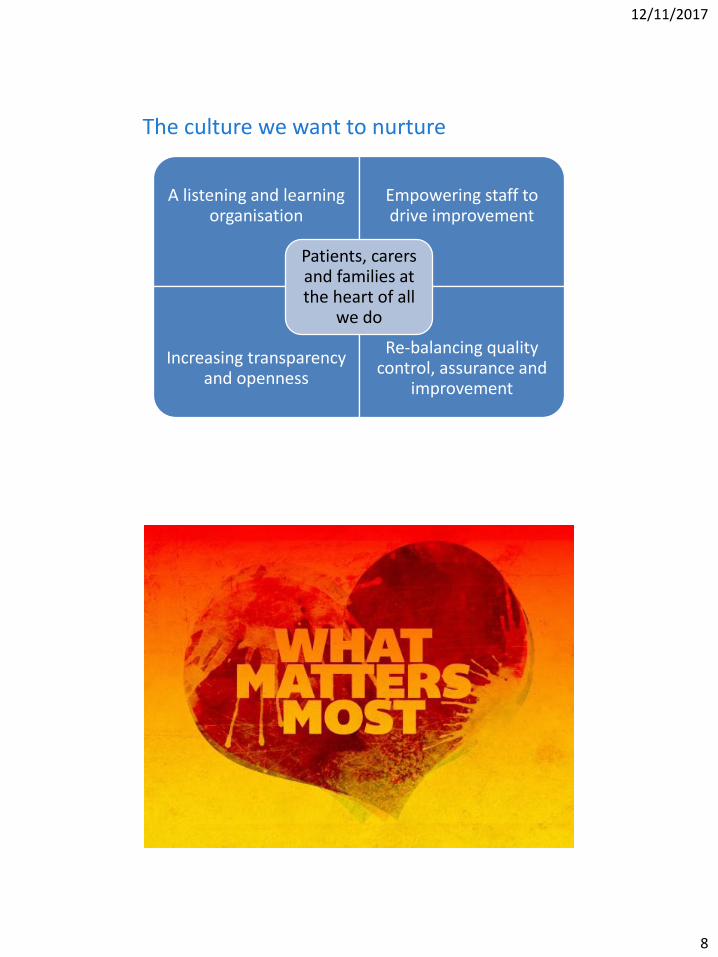
The culture we want to nurture
A listening and learning organisation
Empowering staff to drive improvement
Increasing transparency and openness
Re-balancing quality control, assurance and
improvement
Patients, carers and families at the heart of all
we do

12/11/2017
9
YEARS AGO
Building the case for change
Trust board bespoke learning sessions
Visits to other organisationsSentinel event
Developing the strategy through engagement
Early small scale tests
Long-term business case approved
Assess readiness for change
Identify strategic partner
12/11/2017
10
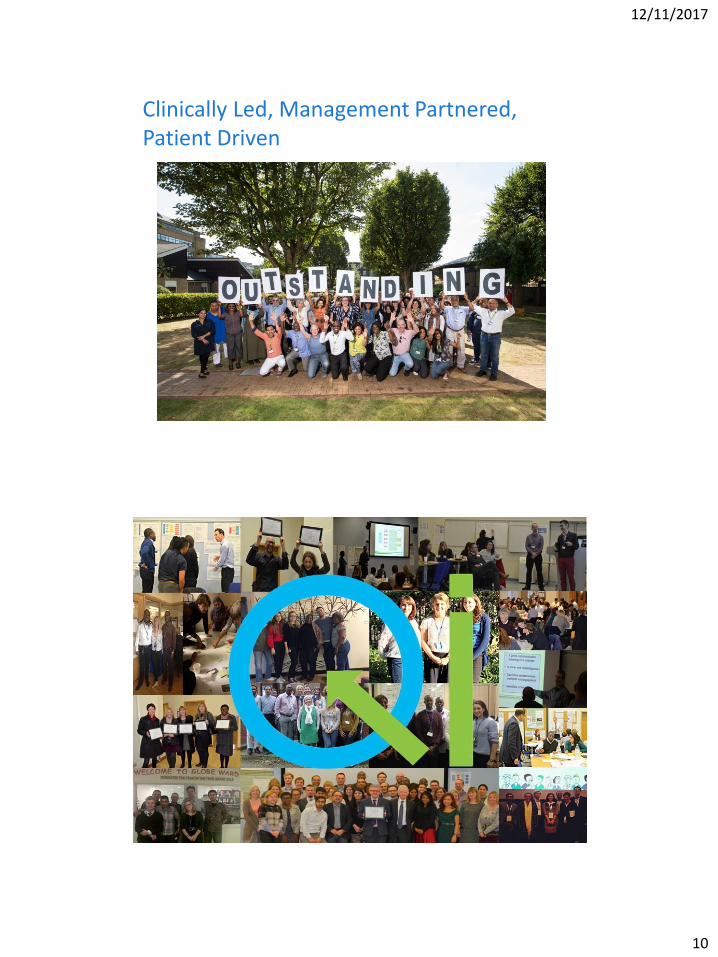
Clinically Led, Management Partnered,Patient Driven
12/11/2017
11
Better outcomesBetter satisfactionValue for moneyBetter population health
Contribution to
12/11/2017
12
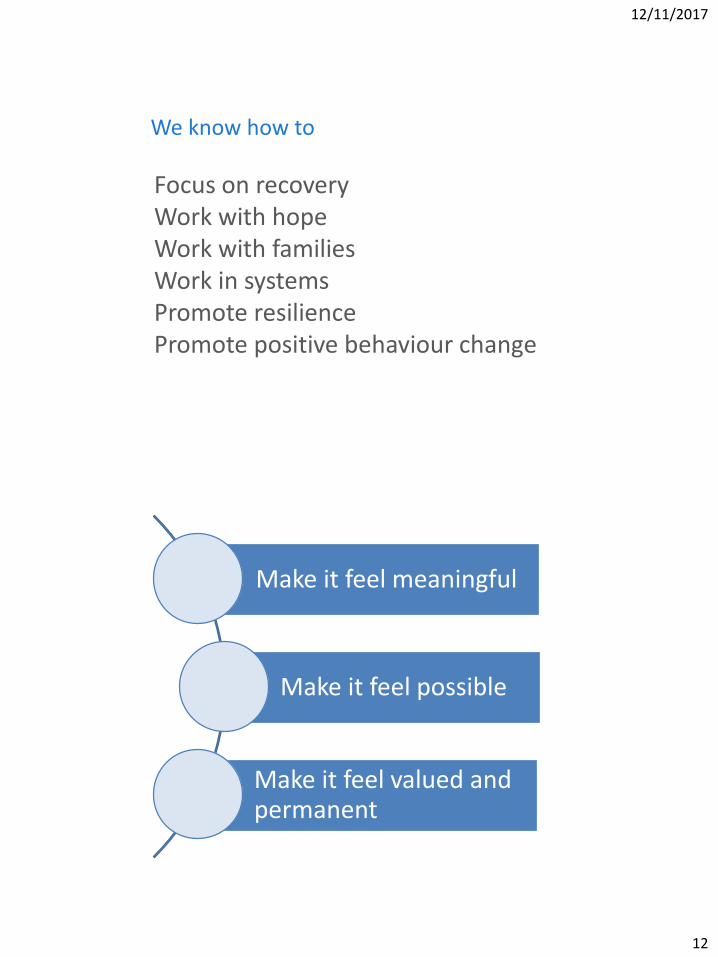
Focus on recoveryWork with hopeWork with familiesWork in systemsPromote resiliencePromote positive behaviour change
We know how to
Make it feel meaningful
Make it feel possible
Make it feel valued and permanent
12/11/2017
13
@[email protected] qi.elft.nhs.uk
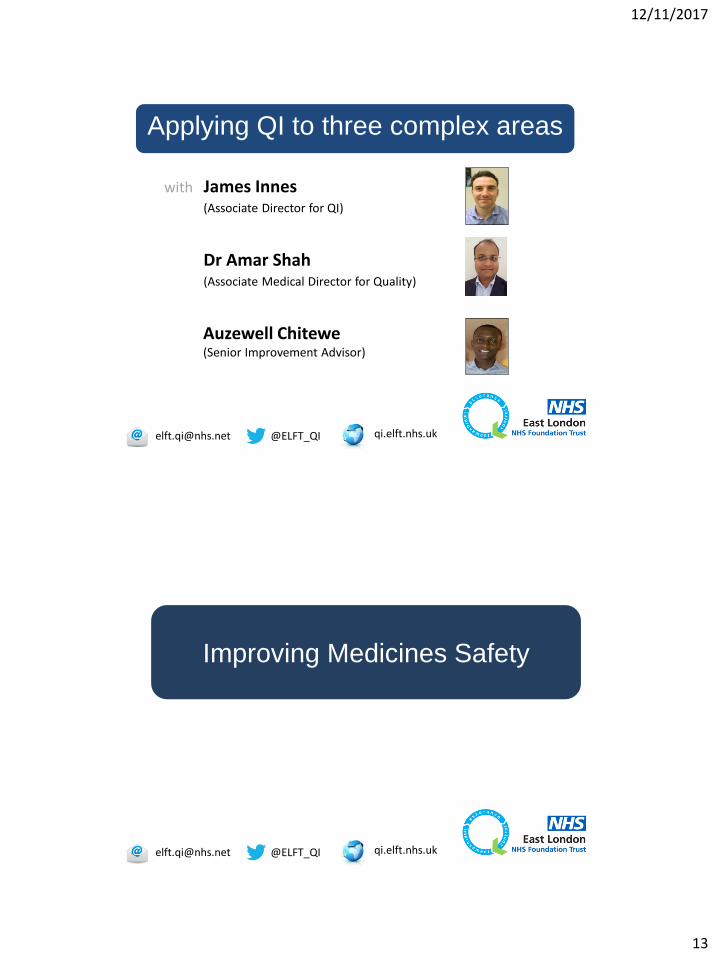
Applying QI to three complex areas
with James Innes(Associate Director for QI)
Dr Amar Shah(Associate Medical Director for Quality)
Auzewell Chitewe(Senior Improvement Advisor)
Improving Medicines Safety
@[email protected] qi.elft.nhs.uk
12/11/2017
14
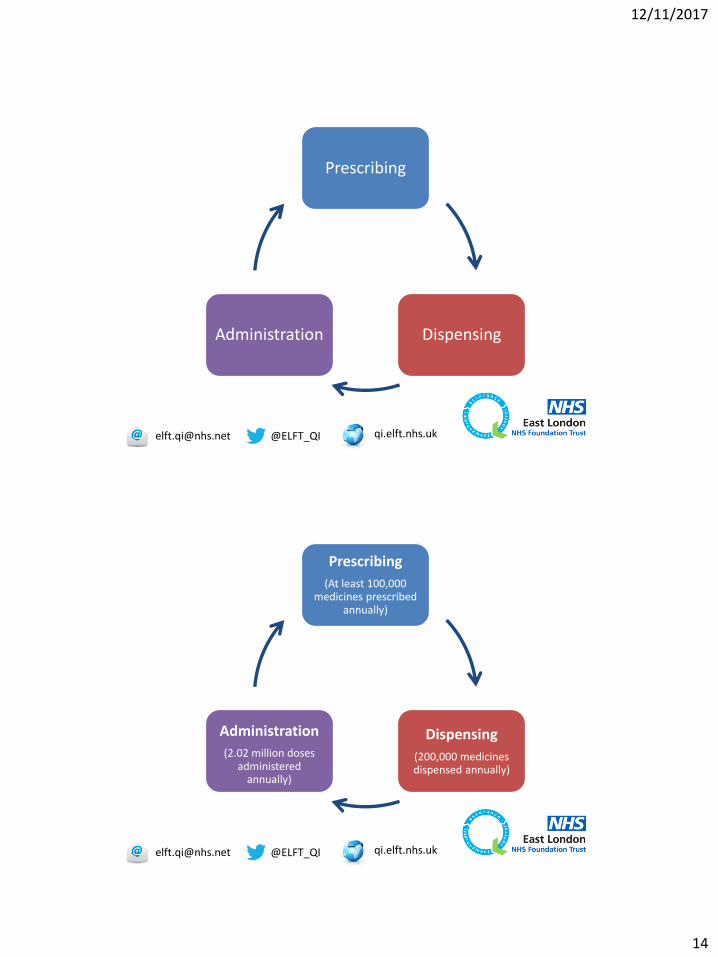
Prescribing
DispensingAdministration
@[email protected] qi.elft.nhs.uk
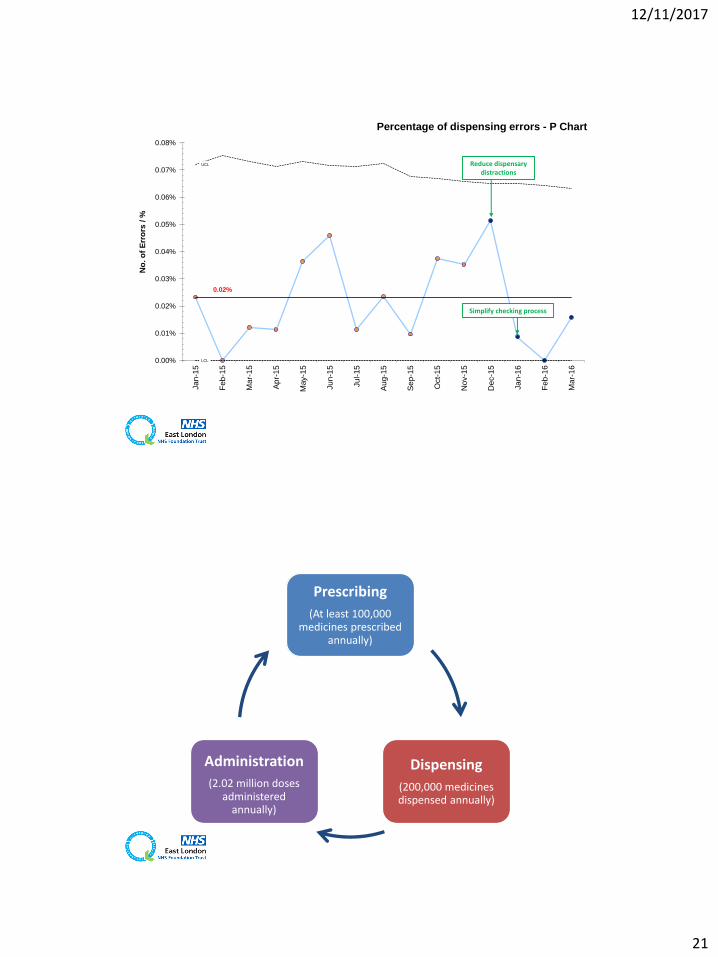
Prescribing
(At least 100,000 medicines prescribed
annually)
Dispensing
(200,000 medicines dispensed annually)
Administration
(2.02 million doses administered
annually)
@[email protected] qi.elft.nhs.uk
12/11/2017
15
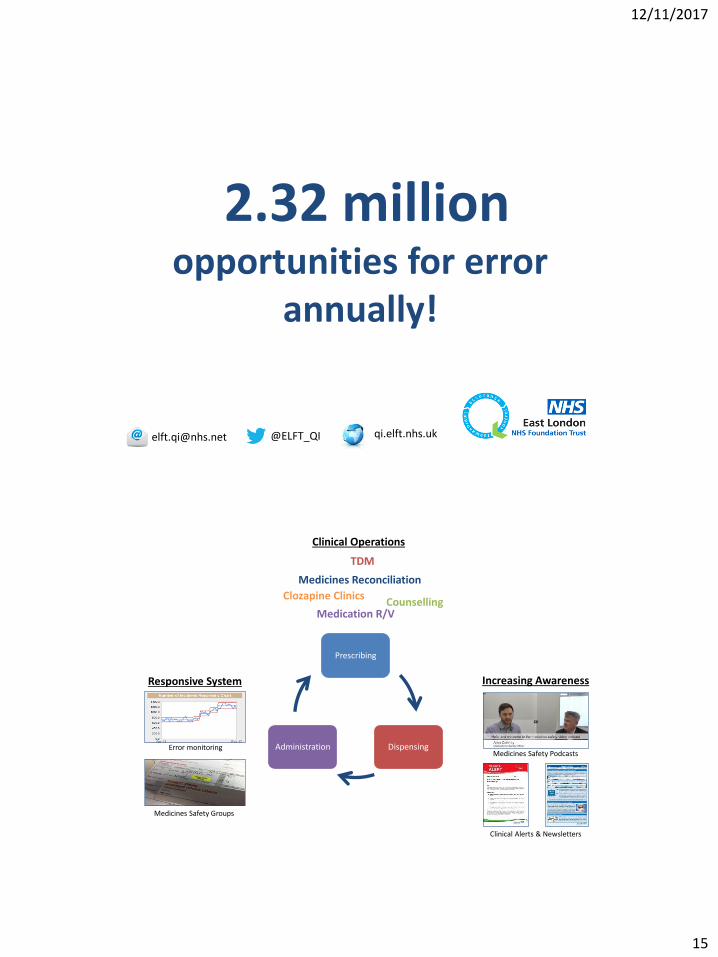
2.32 million opportunities for error
annually!
@[email protected] qi.elft.nhs.uk
Prescribing
DispensingAdministration
Increasing Awareness
Clinical Operations
Medicines Reconciliation
Responsive System
Error monitoring
Medicines Safety Groups
Medicines Safety Podcasts
Clinical Alerts & Newsletters
TDM
CounsellingMedication R/V
Clozapine Clinics
12/11/2017
16
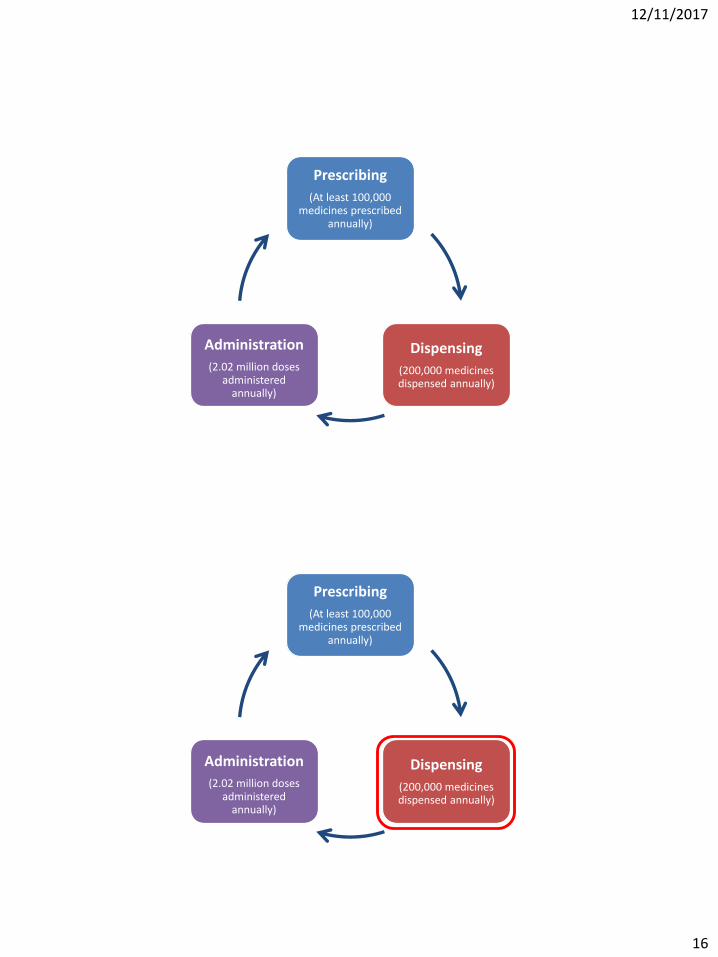
Prescribing
(At least 100,000 medicines prescribed
annually)
Dispensing
(200,000 medicines dispensed annually)
Administration
(2.02 million doses administered
annually)
Prescribing
(At least 100,000 medicines prescribed
annually)
Dispensing
(200,000 medicines dispensed annually)
Administration
(2.02 million doses administered
annually)
12/11/2017
17
12/11/2017
18
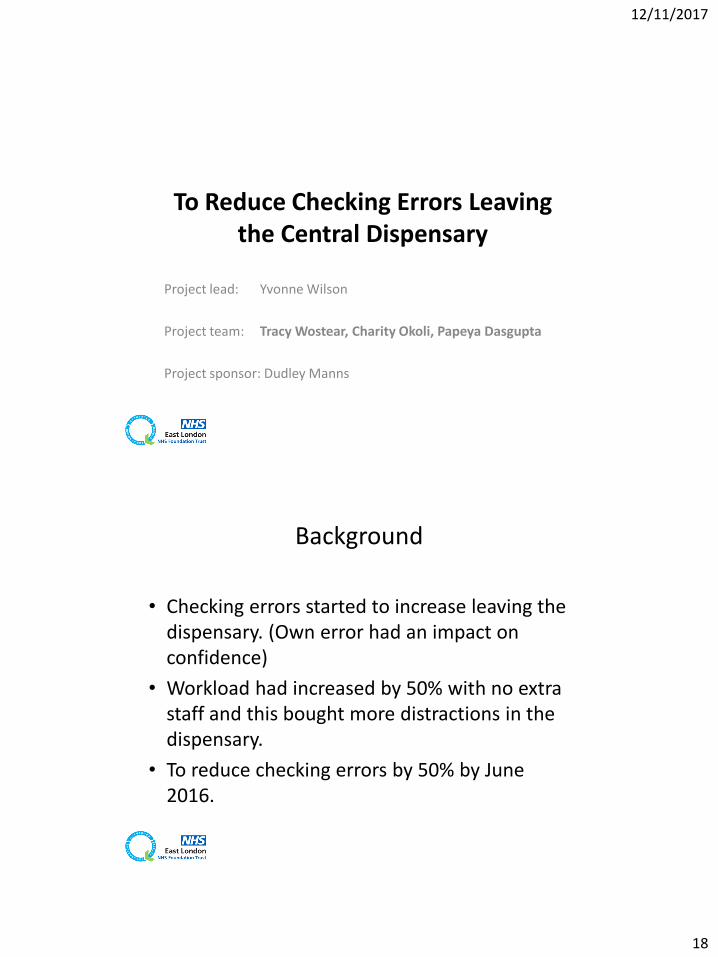
To Reduce Checking Errors Leaving the Central Dispensary
Project lead: Yvonne Wilson
Project team: Tracy Wostear, Charity Okoli, Papeya Dasgupta
Project sponsor: Dudley Manns
Background
• Checking errors started to increase leaving the dispensary. (Own error had an impact on confidence)
• Workload had increased by 50% with no extra staff and this bought more distractions in the dispensary.
• To reduce checking errors by 50% by June 2016.
12/11/2017
19
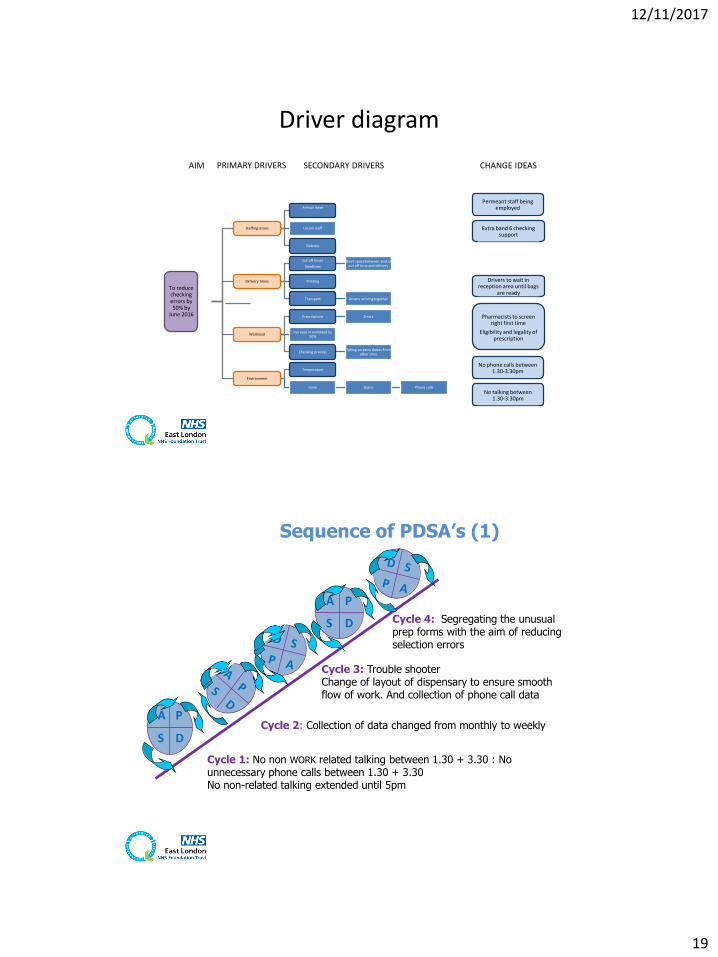
Driver diagram
To reduce checking errors by 50% by
June 2016
Staffing issues
Annual leave
Locum staff
Sickness
Delivery times
Cut off times
Deadlines
Short space between end of cut off time and delivery
Printing
Transport Drivers arriving together
Workload
Prescriptions Errors
Increase in workload by 50%
Checking processTaking on extra duties from
other sites
Environment
Temperature
noise Space Phone calls
Permeant staff being employed
AIM PRIMARY DRIVERS SECONDARY DRIVERS CHANGE IDEAS
Extra band 6 checking support
Drivers to wait in reception area until bags
are ready
Pharmacists to screen right first time
Eligibility and legality of prescription
No phone calls between 1.30-3.30pm
No talking between 1.30-3.30pm
A P
S D
A P
S D
Cycle 1: No non WORK related talking between 1.30 + 3.30 : No unnecessary phone calls between 1.30 + 3.30 No non-related talking extended until 5pm
Cycle 2: Collection of data changed from monthly to weekly
Cycle 3: Trouble shooterChange of layout of dispensary to ensure smooth flow of work. And collection of phone call data
Sequence of PDSA’s (1)
Cycle 4: Segregating the unusual prep forms with the aim of reducing selection errors
12/11/2017
20
A P
S D
A P
S D
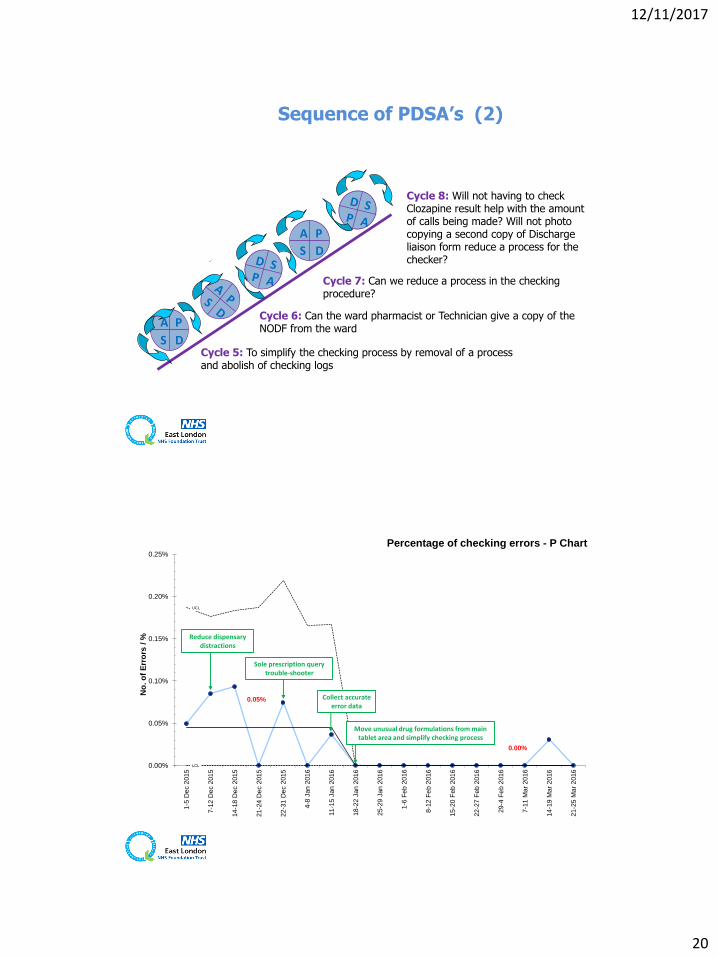
Sequence of PDSA’s (2)
Cycle 6: Can the ward pharmacist or Technician give a copy of the NODF from the ward
Cycle 5: To simplify the checking process by removal of a process and abolish of checking logs
Cycle 7: Can we reduce a process in the checking procedure?
Cycle 8: Will not having to check Clozapine result help with the amount of calls being made? Will not photo copying a second copy of Discharge liaison form reduce a process for the checker?
0.05%
0.00%
UCL
LCL0.00%
0.05%
0.10%
0.15%
0.20%
0.25%
1-5
Dec 2
015
7-1
2 D
ec 2
015
14-1
8 D
ec 2
015
21-2
4 D
ec 2
015
22-3
1 D
ec 2
015
4-8
Jan 2
016
11-1
5 J
an 2
016
18-2
2 J
an 2
016
25-2
9 J
an 2
016
1-6
Feb
20
16
8-1
2 F
eb 2
016
15-2
0 F
eb 2
016
22-2
7 F
eb 2
016
29-4
Fe
b 2
016
7-1
1 M
ar
20
16
14-1
9 M
ar
2016
21-2
5 M
ar
2016
No
. o
f E
rro
rs /
%
Percentage of checking errors - P Chart
Reduce dispensary distractions
Sole prescription query trouble-shooter
Collect accurate error data
Move unusual drug formulations from main tablet area and simplify checking process
12/11/2017
21
0.02%
UCL
LCL0.00%
0.01%
0.02%
0.03%
0.04%
0.05%
0.06%
0.07%
0.08%
Ja
n-1
5
Feb
-15
Mar-
15
Ap
r-1
5
May-1
5
Ju
n-1
5
Ju
l-15
Au
g-1
5
Se
p-1
5
Oct-
15
Nov-1
5
Dec-1
5
Ja
n-1
6
Feb
-16
Mar-
16
No
. o
f E
rro
rs /
%
Percentage of dispensing errors - P Chart
Simplify checking process
Reduce dispensary distractions
Prescribing
(At least 100,000 medicines prescribed
annually)
Dispensing
(200,000 medicines dispensed annually)
Administration
(2.02 million doses administered
annually)
12/11/2017
22
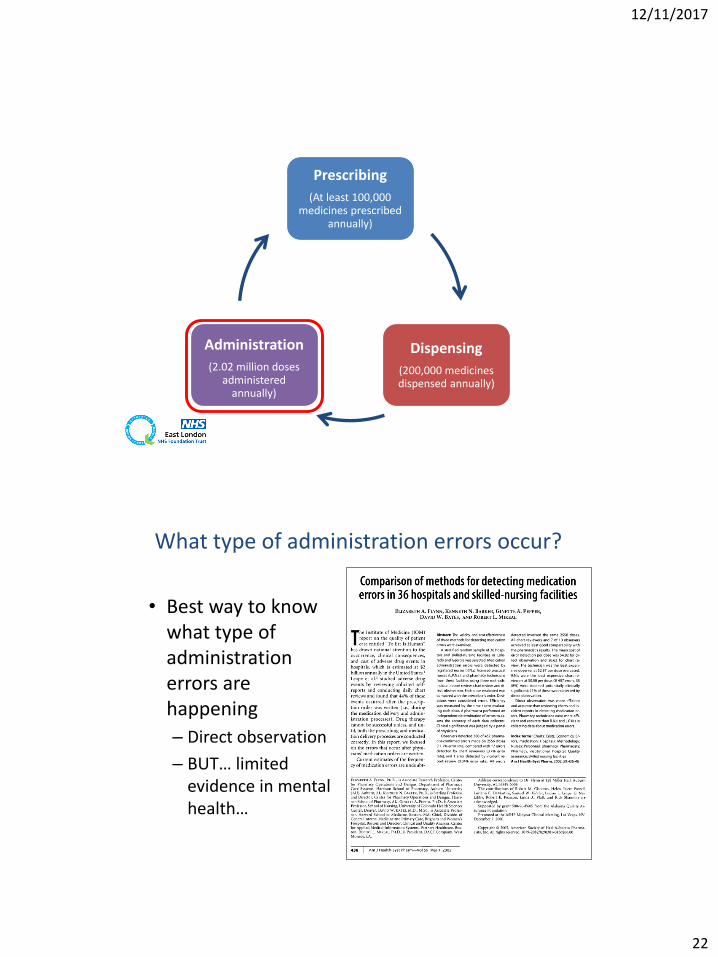
Prescribing
(At least 100,000 medicines prescribed
annually)
Dispensing
(200,000 medicines dispensed annually)
Administration
(2.02 million doses administered
annually)
What type of administration errors occur?
• Best way to know what type of administration errors are happening
– Direct observation
– BUT… limited evidence in mental health…
12/11/2017
23
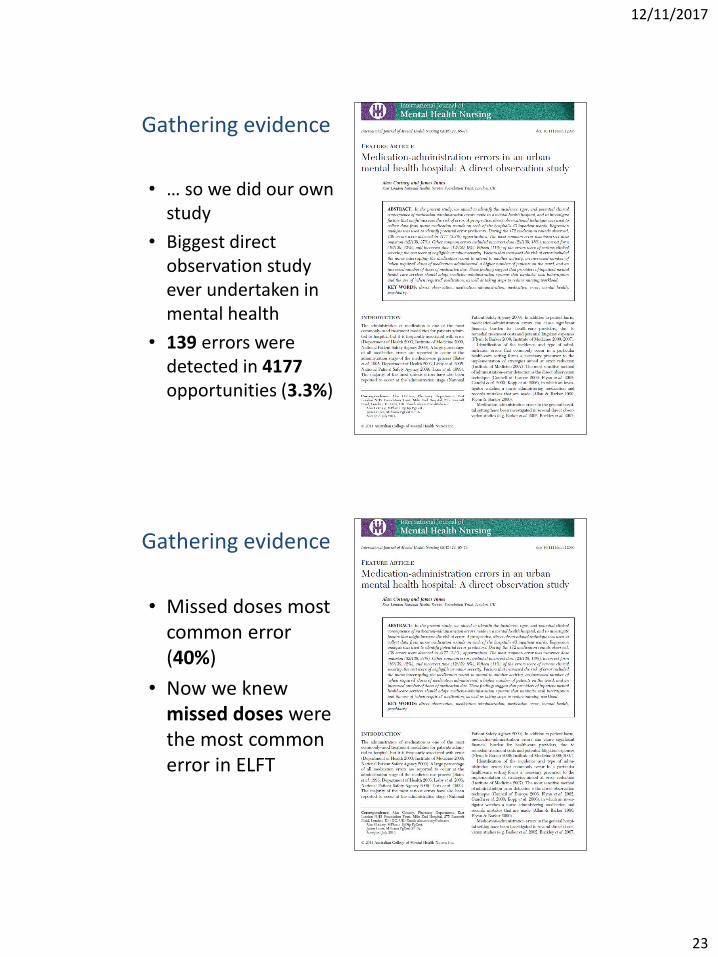
Gathering evidence
• … so we did our own study
• Biggest direct observation study ever undertaken in mental health
• 139 errors were detected in 4177opportunities (3.3%)
Gathering evidence
• Missed doses most common error (40%)
• Now we knew missed doses were the most common error in ELFT
12/11/2017
24
Reducing omitted doses of medication on the Mental Healthcare of Older
Peoples’ (MHCOP) Wards
Lead contact: Alan CottneyProject team: Carmel Stevenson, Peter Bell, Von-de-Viel Nettey,
Femi Odugbesan, Andrew Huggard, Natasha Patel, Louise Missen & Tim Pham
Background
• Baseline investigation on 6 MHCOP wards:
– Missed dose rate = 1.07%
– Equates to approx. 2900 missed doses a year
• Project aim:
– To reduce omitted doses of medication to less than 0.5% of total doses due by the end of March 2015
12/11/2017
25
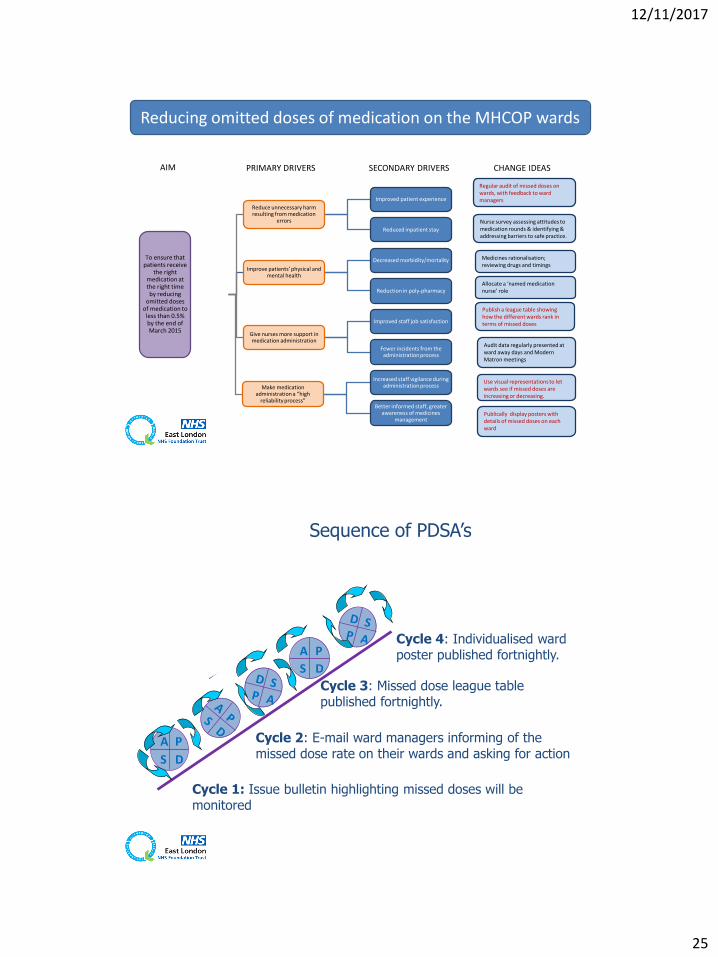
To ensure that patients receive
the right medication at the right time by reducing
omitted doses of medication to
less than 0.5% by the end of March 2015
Reduce unnecessary harm resulting from medication
errors
Improved patient experience
Reduced inpatient stay
Improve patients’ physical and mental health
Decreased morbidity/mortality
Reduction in poly-pharmacy
Give nurses more support in medication administration
Improved staff job satisfaction
Fewer incidents from the administration process
Make medication administration a “high
reliability process”
Increased staff vigilance during administration process
Better informed staff, greater awareness of medicines
managementPublically display posters with details of missed doses on each ward
AIM PRIMARY DRIVERS SECONDARY DRIVERS CHANGE IDEAS
Regular audit of missed doses on wards, with feedback to ward managers
Nurse survey assessing attitudes to medication rounds & identifying & addressing barriers to safe practice.
Medicines rationalisation; reviewing drugs and timings
Use visual representations to let wards see if missed doses are increasing or decreasing.
Audit data regularly presented at ward away days and Modern Matron meetings
Allocate a ‘named medication nurse’ role
Reducing omitted doses of medication on the MHCOP wards
Publish a league table showing how the different wards rank in terms of missed doses
A P
S D
A P
S D
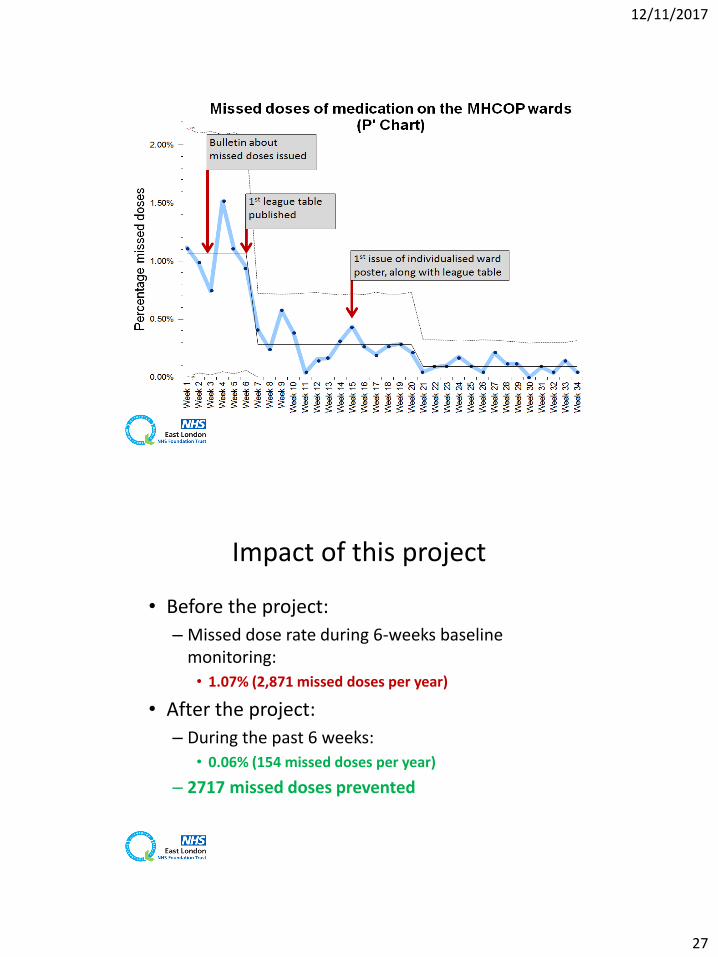
Cycle 1: Issue bulletin highlighting missed doses will be monitored
Cycle 2: E-mail ward managers informing of the missed dose rate on their wards and asking for action
Cycle 4: Individualised ward poster published fortnightly.
Cycle 3: Missed dose league table published fortnightly.
Sequence of PDSA’s
12/11/2017
26
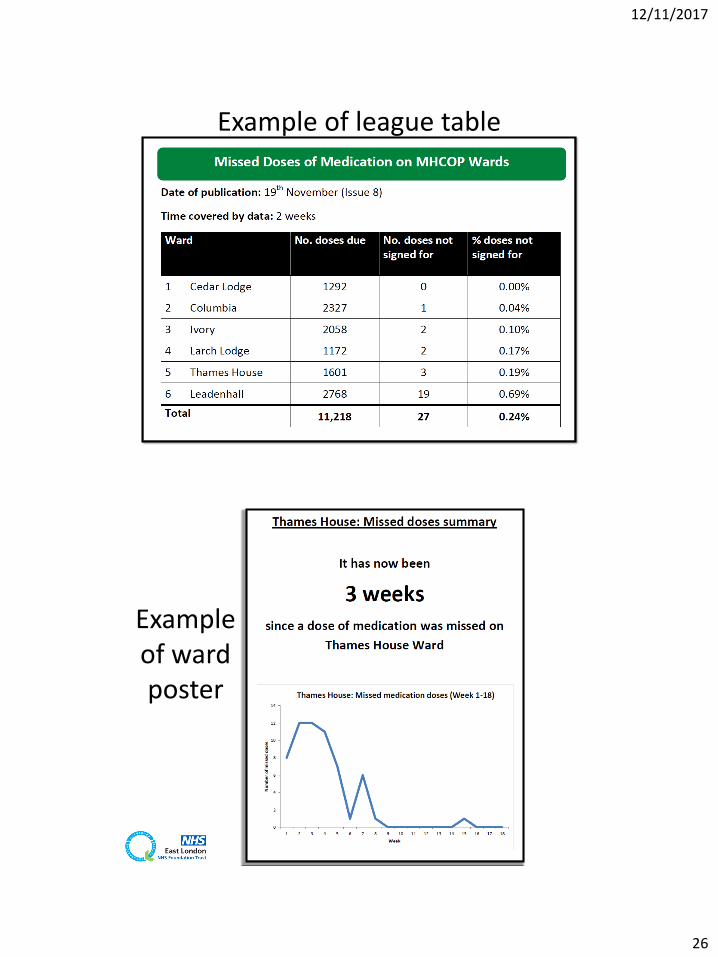
Example of league table
Example of ward poster
12/11/2017
27
Impact of this project
• Before the project:
– Missed dose rate during 6-weeks baseline monitoring:
• 1.07% (2,871 missed doses per year)
• After the project:
– During the past 6 weeks:
• 0.06% (154 missed doses per year)
– 2717 missed doses prevented
12/11/2017
28
Financial data
• Estimate of cost-saving:
– 2717 medication errors will result in an average of 26 adverse drug events1
– One adverse drug event is estimated to cost £1,4772
– Cost-saving from avoiding 26 adverse drug events per year on 6 MHCOP wards: £38,402
1: Bates DW et al. Relationship between medication errors and adverse drug events. J Gen Intern Med. 1995 Apr;10(4):199-205.2: Senst BL et al. Practical approach to determining costs and frequency of adverse drug events in a health care network. Am J Health Syst Pharm. 2001 Jun 15;58(12):1126-32
Violence Reduction on inpatient
mental health wards
12/11/2017
29
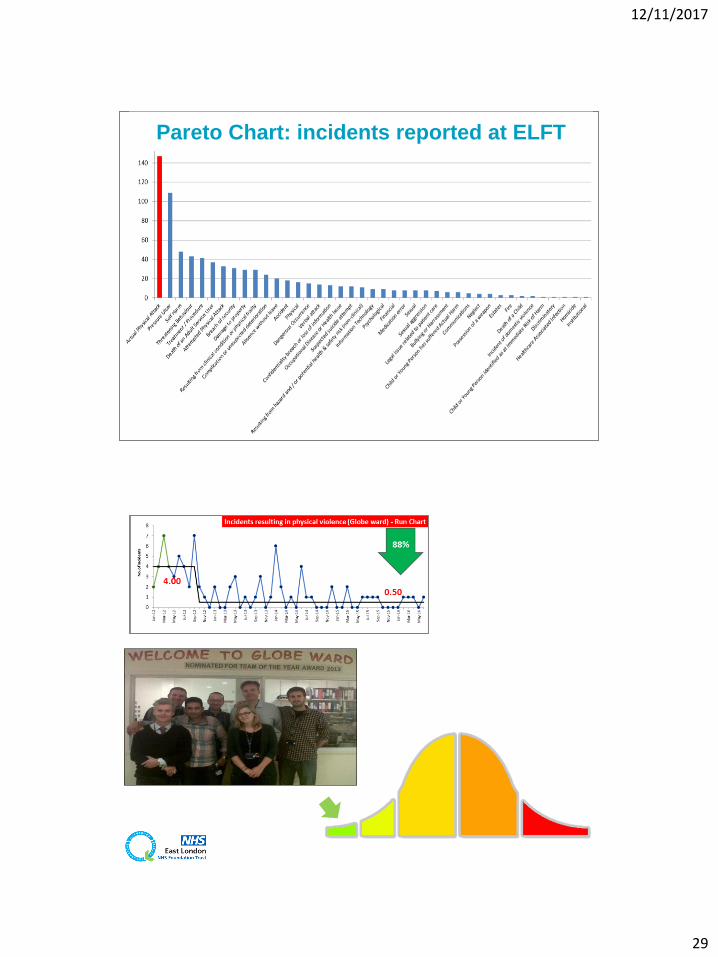
Pareto Chart: incidents reported at ELFT
2012
12/11/2017
30
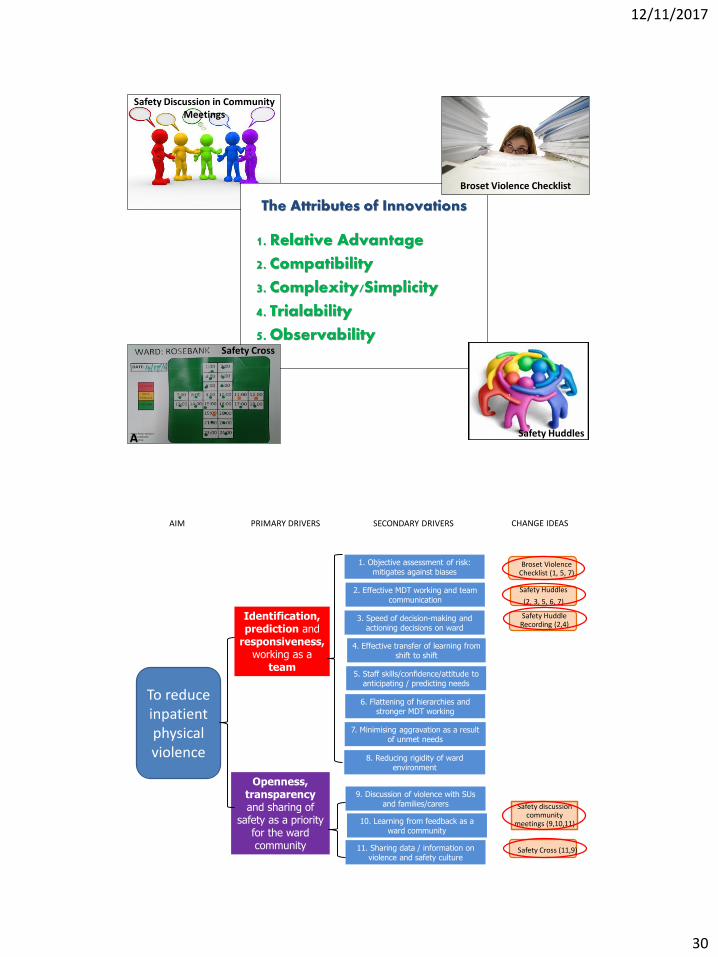
Safety Discussion in Community Meetings
Safety Huddles
Broset Violence Checklist
Safety Cross
A
AIM PRIMARY DRIVERS CHANGE IDEAS
Safety Huddles
(2, 3, 5, 6, 7)
Safety discussion community
meetings (9,10,11)
Safety Cross (11,9)
Identification, prediction and
responsiveness, working as a
team
7. Minimising aggravation as a result of unmet needs
Openness, transparency and sharing of
safety as a priority for the ward community
Broset Violence Checklist (1, 5, 7)
SECONDARY DRIVERS
2. Effective MDT working and team communication
5. Staff skills/confidence/attitude to anticipating / predicting needs
6. Flattening of hierarchies and stronger MDT working
9. Discussion of violence with SUs and families/carers
3. Speed of decision-making and actioning decisions on ward
11. Sharing data / information on violence and safety culture
To reduce inpatient physical violence
1. Objective assessment of risk: mitigates against biases
8. Reducing rigidity of ward environment
10. Learning from feedback as a ward community
4. Effective transfer of learning from shift to shift
Safety Huddle Recording (2,4)
12/11/2017
31
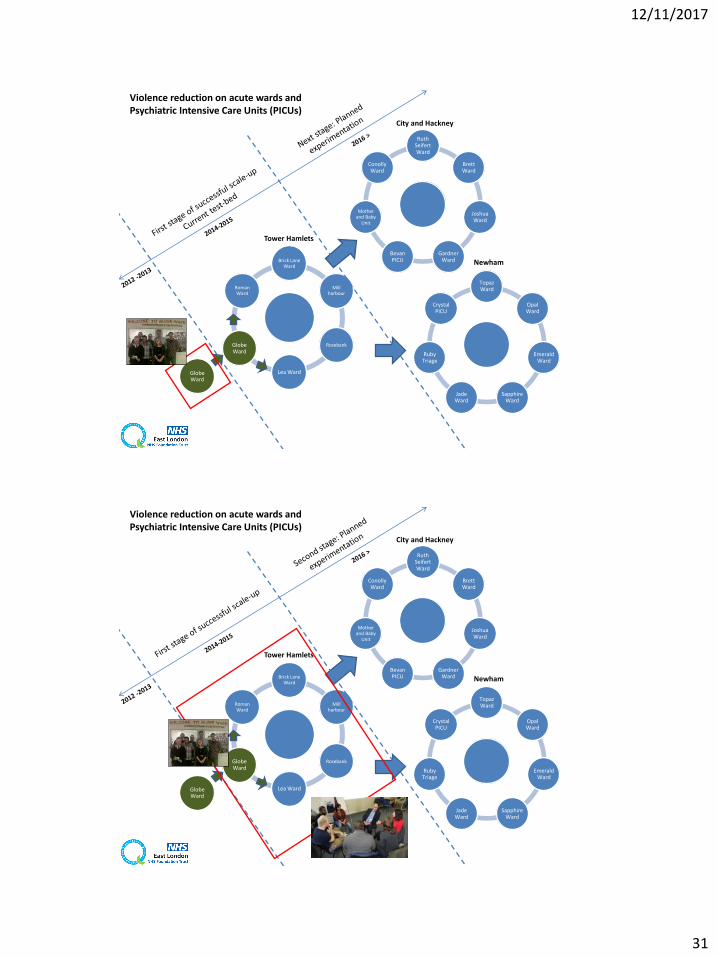
Violence reduction on acute wards and Psychiatric Intensive Care Units (PICUs)
Brick Lane Ward
Mill harbour
Rosebank
Lea Ward
Globe Ward
Roman Ward
Ruth Seifert Ward
Brett Ward
Joshua Ward
Gardner Ward
Bevan PICU
Mother and Baby
Unit
ConollyWard
Topaz Ward
Opal Ward
Emerald Ward
Sapphire Ward
Jade Ward
Ruby Triage
Crystal PICU
City and Hackney
Newham
Tower Hamlets
Globe Ward
J
12/11/2017
32
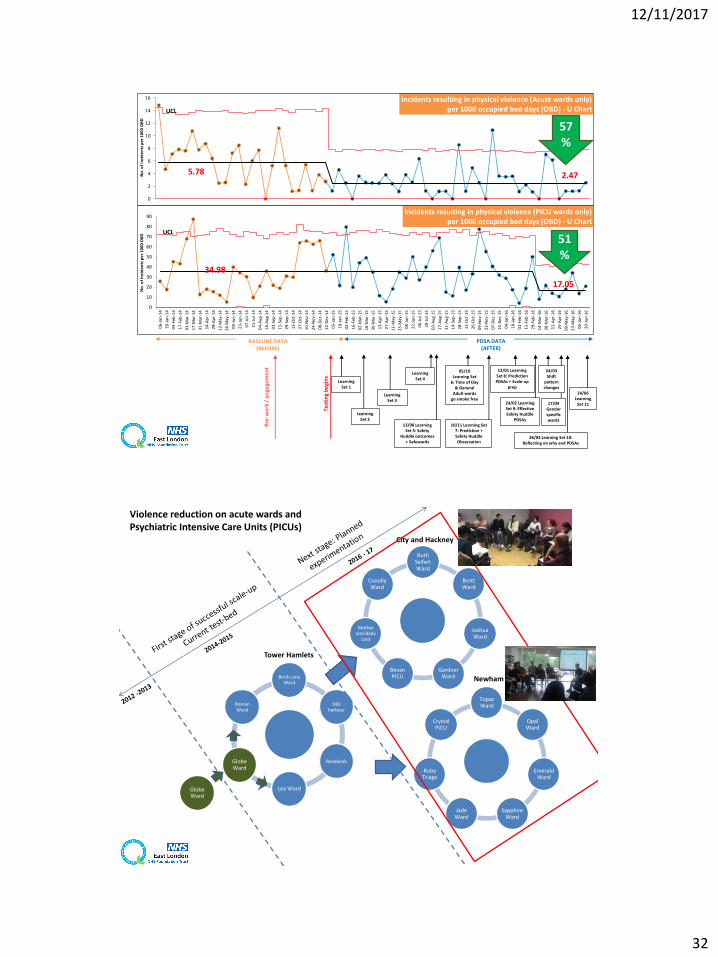
5.78 2.47
UCL
0
2
4
6
8
10
12
14
16
No
. of
Inci
de
nts
pe
r 1
00
0 O
BD
Incidents resulting in physical violence (Acute wards only)per 1000 occupied bed days (OBD) - U Chart
BASELINE DATA(BEFORE)
PDSA DATA(AFTER)
57%
Learning Set 1
Test
ing
beg
ins
05/10 Learning Set
6: Time of Day & General
Adult wards go smoke free
10/11 Learning Set 7: Prediction + Safety Huddle Observation
Pre
-wo
rk /
en
gage
me
nt
12/01 Learning Set 8: Prediction PDSAs + Scale-up
prep
Learning Set 4
Learning Set 3
Learning Set 2
13/08 Learning Set 5: Safety
Huddle outcomes + Safewards
24/02 Learning Set 9: Effective Safety Huddle
PDSAs
24/03 Shift
pattern changes
26/04 Learning Set 10: Reflecting on why and PDSAs
17/04 Gender specific wards
34.98
17.05
UCL
0
10
20
30
40
50
60
70
80
90
06
-Jan
-14
20
-Jan
-14
03
-Feb
-14
17
-Feb
-14
03
-Mar
-14
17
-Mar
-14
31
-Mar
-14
14
-Ap
r-1
4
28
-Ap
r-1
4
12
-May
-14
26
-May
-14
09
-Ju
n-1
4
23
-Ju
n-1
4
07
-Ju
l-1
4
21
-Ju
l-1
4
04
-Au
g-1
4
18
-Au
g-1
4
01
-Sep
-14
15
-Sep
-14
29
-Sep
-14
13
-Oct
-14
27
-Oct
-14
10
-No
v-1
4
24
-No
v-1
4
08
-De
c-1
4
22
-De
c-1
4
05
-Jan
-15
19
-Jan
-15
02
-Feb
-15
16
-Feb
-15
02
-Mar
-15
16
-Mar
-15
30
-Mar
-15
13
-Ap
r-1
5
27
-Ap
r-1
5
11
-May
-15
25
-May
-15
08
-Ju
n-1
5
22
-Ju
n-1
5
06
-Ju
l-1
5
20
-Ju
l-1
5
03
-Au
g-1
5
17
-Au
g-1
5
31
-Au
g-1
5
14
-Sep
-15
28
-Sep
-15
12
-Oct
-15
26
-Oct
-15
09
-No
v-1
5
23
-No
v-1
5
07
-De
c-1
5
21
-De
c-1
5
04
-Jan
-16
18
-Jan
-16
01
-Feb
-16
15
-Feb
-16
29
-Feb
-16
14
-Mar
-16
28
-Mar
-16
11
-Ap
r-1
6
25
-Ap
r-1
6
09
-May
-16
23
-May
-16
06
-Ju
n-1
6
20
-Ju
n-1
6
No
. of
Inci
de
nts
pe
r 1
00
0 O
BD
Incidents resulting in physical violence (PICU wards only)per 1000 occupied bed days (OBD) - U Chart
51%
24/06 Learning
Set 11
J
Violence reduction on acute wards and Psychiatric Intensive Care Units (PICUs)
Brick Lane Ward
Mill harbour
Rosebank
Lea Ward
Globe Ward
Roman Ward
Ruth Seifert Ward
Brett Ward
Joshua Ward
Gardner Ward
Bevan PICU
Mother and Baby
Unit
ConollyWard
Topaz Ward
Opal Ward
Emerald Ward
Sapphire Ward
Jade Ward
Ruby Triage
Crystal PICU
City and Hackney
Newham
Tower Hamlets
Globe Ward
J
12/11/2017
33
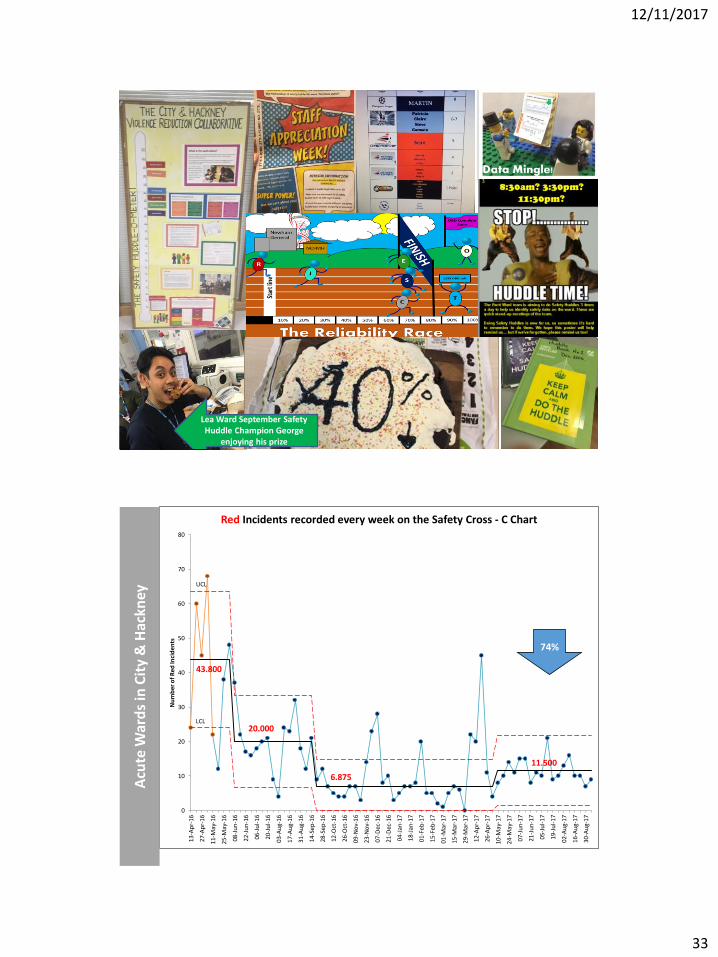
Lea Ward September Safety Huddle Champion George
enjoying his prize
UCL
43.800
20.000
6.875
11.500
LCL
0
10
20
30
40
50
60
70
80
13-A
pr-
16
27-A
pr-
16
11-M
ay-1
6
25-M
ay-1
6
08-J
un
-16
22-J
un
-16
06-J
ul-
16
20-J
ul-
16
03-A
ug-
16
17-A
ug-
16
31-A
ug-
16
14-S
ep-1
6
28-S
ep-1
6
12-O
ct-1
6
26-O
ct-1
6
09-N
ov-
16
23-N
ov-
16
07-D
ec-1
6
21-D
ec-1
6
04-J
an-1
7
18-J
an-1
7
01-F
eb-1
7
15-F
eb-1
7
01-M
ar-1
7
15-M
ar-1
7
29-M
ar-1
7
12-A
pr-
17
26-A
pr-
17
10-M
ay-1
7
24-M
ay-1
7
07-J
un
-17
21-J
un
-17
05-J
ul-
17
19-J
ul-
17
02-A
ug-
17
16-A
ug-
17
30-A
ug-
17
Nu
mb
er o
f R
ed In
cid
ents
Red Incidents recorded every week on the Safety Cross - C Chart
Acu
te W
ard
s in
Cit
y &
Hac
kney
74%
12/11/2017
34
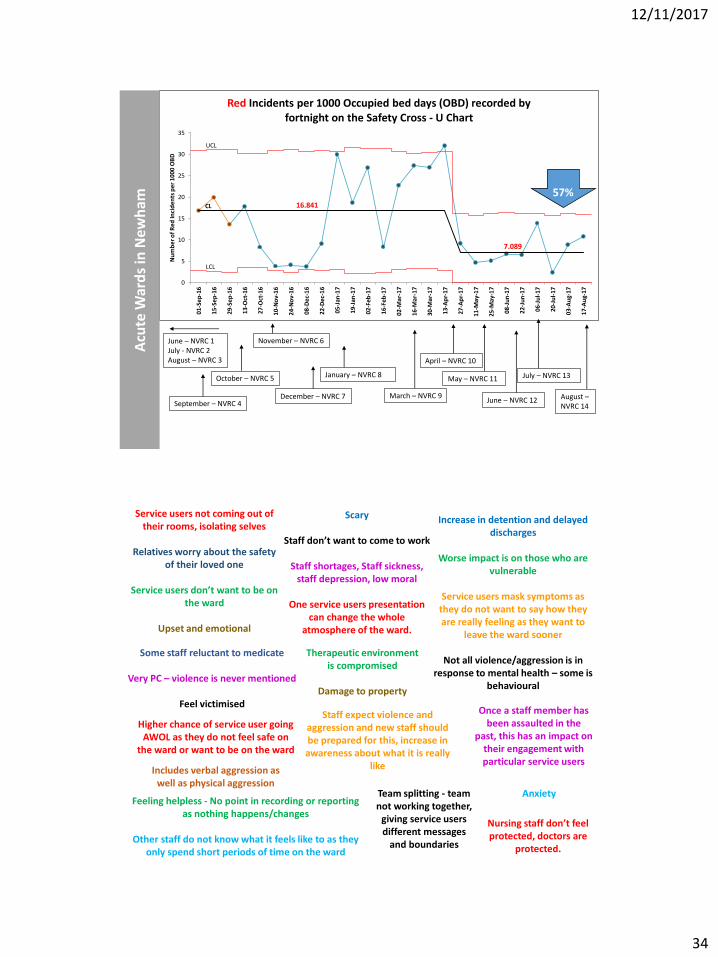
CL 16.841
7.089
UCL
LCL
0
5
10
15
20
25
30
35
01-S
ep
-16
15-S
ep
-16
29-S
ep
-16
13-O
ct-1
6
27-O
ct-1
6
10-N
ov-
16
24-N
ov-
16
08-D
ec-
16
22-D
ec-
16
05-J
an-1
7
19-J
an-1
7
02-F
eb
-17
16-F
eb
-17
02-M
ar-1
7
16-M
ar-1
7
30-M
ar-1
7
13-A
pr-
17
27-A
pr-
17
11-M
ay-1
7
25-M
ay-1
7
08-J
un
-17
22-J
un
-17
06-J
ul-
17
20-J
ul-
17
03-A
ug-
17
17-A
ug-
17
Nu
mb
er o
f R
ed In
cid
ents
per
10
00
OB
D
Red Incidents per 1000 Occupied bed days (OBD) recorded by fortnight on the Safety Cross - U Chart
June – NVRC 1July - NVRC 2August – NVRC 3
September – NVRC 4
October – NVRC 5
November – NVRC 6
March – NVRC 9
Acu
te W
ard
s in
Ne
wh
am
December – NVRC 7
January – NVRC 8
April – NVRC 10
May – NVRC 11
June – NVRC 12
57%
July – NVRC 13
August –NVRC 14
Service users not coming out of their rooms, isolating selves
Relatives worry about the safety of their loved one
Service users don’t want to be on the ward
Upset and emotional
Scary
Staff don’t want to come to work
Staff shortages, Staff sickness, staff depression, low moral
One service users presentation can change the whole
atmosphere of the ward.
Therapeutic environment is compromised
Damage to property
Increase in detention and delayed discharges
Worse impact is on those who are vulnerable
Service users mask symptoms as they do not want to say how they are really feeling as they want to
leave the ward sooner
Not all violence/aggression is in response to mental health – some is
behavioural
Some staff reluctant to medicate
Very PC – violence is never mentioned
Feel victimisedStaff expect violence and
aggression and new staff should be prepared for this, increase in awareness about what it is really
likeIncludes verbal aggression as well as physical aggression
Higher chance of service user going AWOL as they do not feel safe on
the ward or want to be on the ward
Once a staff member has been assaulted in the
past, this has an impact on their engagement with particular service users
Feeling helpless - No point in recording or reporting as nothing happens/changes
Other staff do not know what it feels like to as they only spend short periods of time on the ward
Nursing staff don’t feel protected, doctors are
protected.
Team splitting - team not working together,
giving service users different messages
and boundaries
Anxiety
12/11/2017
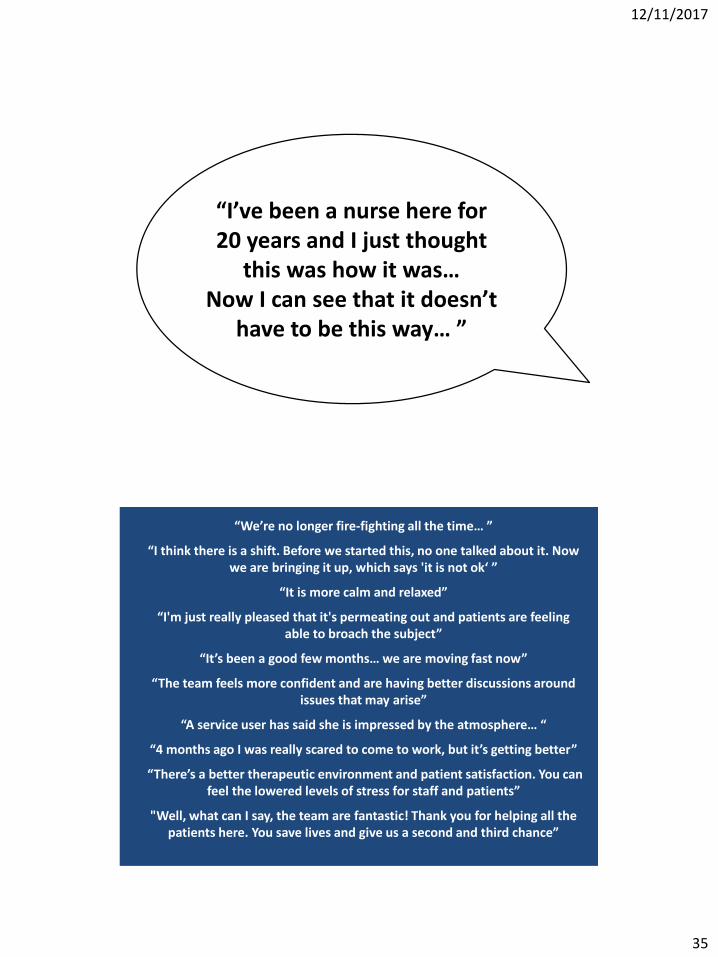
35
“I’ve been a nurse here for 20 years and I just thought
this was how it was… Now I can see that it doesn’t
have to be this way… ”
J
“We’re no longer fire-fighting all the time… ”
“I think there is a shift. Before we started this, no one talked about it. Now we are bringing it up, which says 'it is not ok‘ ”
“It is more calm and relaxed”
“I'm just really pleased that it's permeating out and patients are feeling able to broach the subject”
“It’s been a good few months… we are moving fast now”
“The team feels more confident and are having better discussions around issues that may arise”
“A service user has said she is impressed by the atmosphere… “
“4 months ago I was really scared to come to work, but it’s getting better”
“There’s a better therapeutic environment and patient satisfaction. You can feel the lowered levels of stress for staff and patients”
"Well, what can I say, the team are fantastic! Thank you for helping all the patients here. You save lives and give us a second and third chance”
12/11/2017
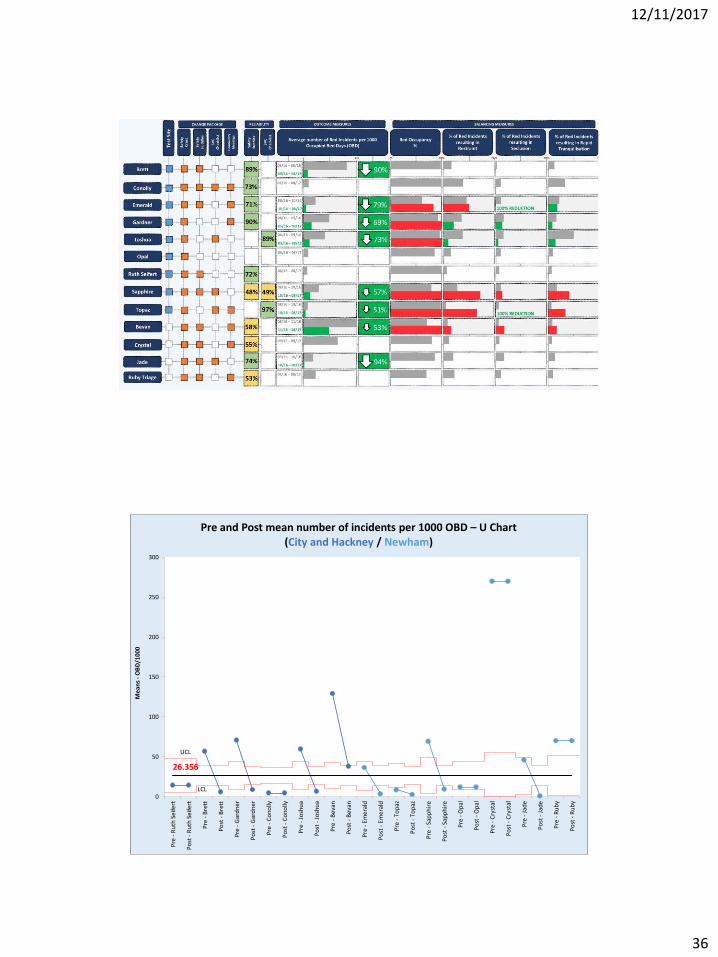
36
26.356
UCL
LCL0
50
100
150
200
250
300
Pre
- R
uth
Sei
fert
Po
st -
Ru
th S
eife
rt
Pre
- B
rett
Po
st -
Bre
tt
Pre
- G
ard
ner
Po
st -
Gar
dn
er
Pre
- C
ono
lly
Po
st -
Co
nolly
Pre
- J
osh
ua
Po
st -
Jo
shu
a
Pre
- B
evan
Po
st -
Bev
an
Pre
- E
mer
ald
Po
st -
Em
eral
d
Pre
- T
op
az
Po
st -
To
paz
Pre
- S
app
hir
e
Po
st -
Sap
ph
ire
Pre
- O
pal
Po
st -
Op
al
Pre
- C
ryst
al
Po
st -
Cry
stal
Pre
- J
ade
Po
st -
Jad
e
Pre
- R
ub
y
Po
st -
Ru
by
Mea
ns
-O
BD
/100
0
Pre and Post mean number of incidents per 1000 OBD – U Chart(City and Hackney / Newham)
12/11/2017
37
0
10
20
30
40
50
60
05-A
pr-
13
07-A
pr-
13
14-M
ay-1
3
02-J
un-1
3
07-J
un-1
3
14-J
un-1
3
24-J
un-1
3
10-J
ul-13
11-J
ul-13
20-J
ul-13
22-J
ul-13
15-A
ug-1
3
18-A
ug-1
3
06-S
ep-1
3
24-S
ep-1
3
13-O
ct-
13
18-O
ct-
13
23-O
ct-
13
01-N
ov-1
3
05-N
ov-1
3
11-N
ov-1
3
23-N
ov-1
3
26-D
ec-1
3
14-J
an-1
4
11-F
eb-1
4
06-M
ar-
14
27-M
ar-
14
16-A
pr-
14
22-M
ay-1
4
04-J
un-1
4
17-J
un-1
4
28-J
un-1
4
12-J
ul-14
05-A
ug-1
4
18-O
ct-
14
16-D
ec-1
4
14-J
an-1
5
30-J
an-1
5
03-F
eb-1
5
02-M
ar-
15
23-A
pr-
15
05-J
un-1
5
21-J
ul-15
14-A
ug-1
5
Tim
e b
etw
een
ev
en
ts /
day
s
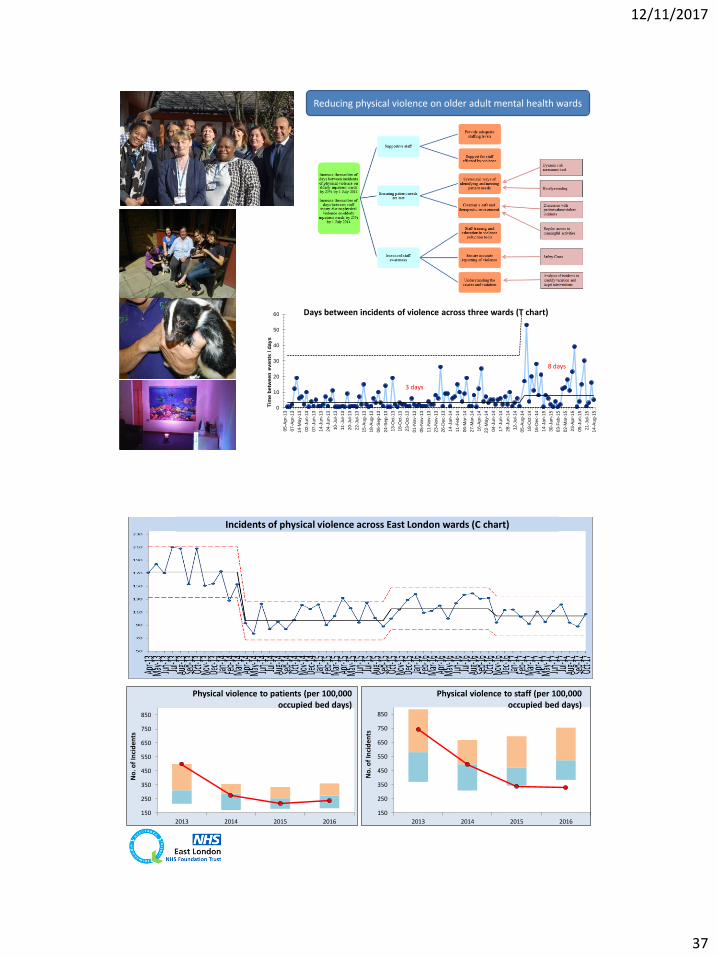
Days between incidents of violence across three wards (T chart)
3 days
8 days
Reducing physical violence on older adult mental health wards
150
250
350
450
550
650
750
850
2013 2014 2015 2016
No
. of
Inci
den
ts
Physical violence to staff (per 100,000 occupied bed days)
150
250
350
450
550
650
750
850
2013 2014 2015 2016
No
. of
Inci
den
ts
Physical violence to patients (per 100,000 occupied bed days)
Incidents of physical violence across East London wards (C chart)
12/11/2017
38
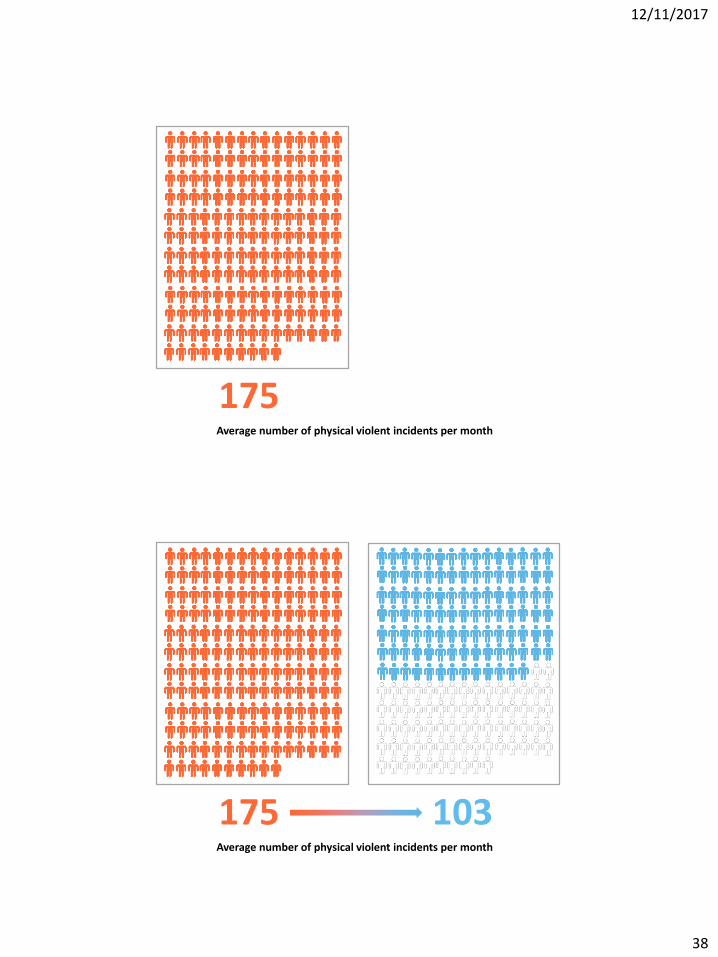
175Average number of physical violent incidents per month
175 103Average number of physical violent incidents per month
12/11/2017
39
https://qi.elft.nhs.uk
Improving Joy in Work
12/11/2017
40
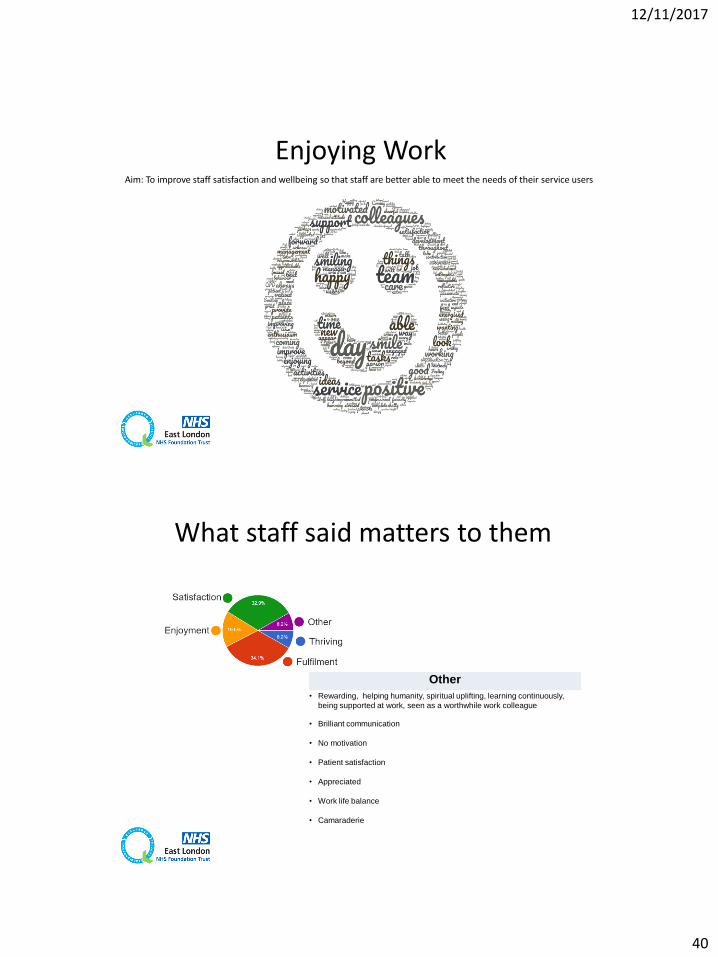
Enjoying WorkAim: To improve staff satisfaction and wellbeing so that staff are better able to meet the needs of their service users
Other
• Rewarding, helping humanity, spiritual uplifting, learning continuously,
being supported at work, seen as a worthwhile work colleague
• Brilliant communication
• No motivation
• Patient satisfaction
• Appreciated
• Work life balance
• Camaraderie
What staff said matters to them
12/11/2017
41
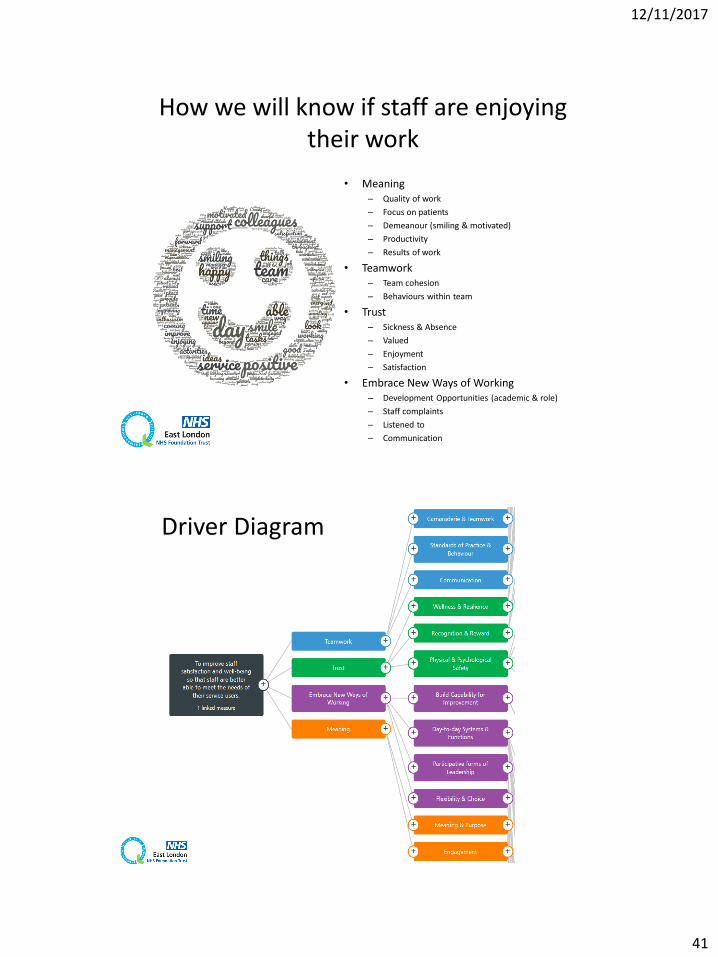
• Meaning– Quality of work
– Focus on patients
– Demeanour (smiling & motivated)
– Productivity
– Results of work
• Teamwork– Team cohesion
– Behaviours within team
• Trust– Sickness & Absence
– Valued
– Enjoyment
– Satisfaction
• Embrace New Ways of Working– Development Opportunities (academic & role)
– Staff complaints
– Listened to
– Communication
How we will know if staff are enjoying their work
Driver Diagram
12/11/2017
42
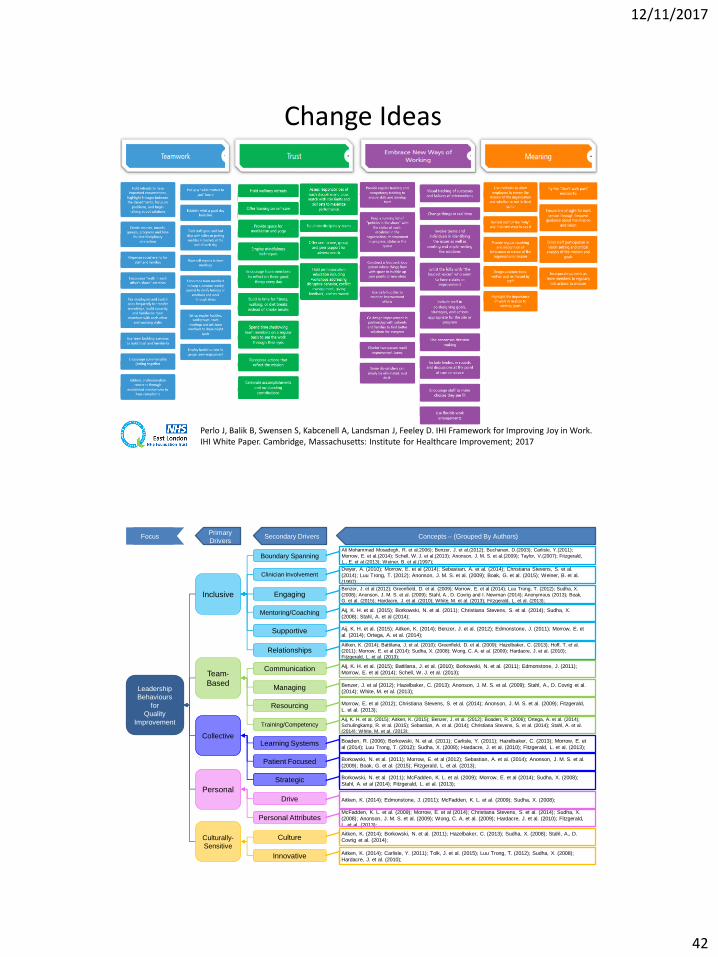
Perlo J, Balik B, Swensen S, Kabcenell A, Landsman J, Feeley D. IHI Framework for Improving Joy in Work. IHI White Paper. Cambridge, Massachusetts: Institute for Healthcare Improvement; 2017
Change Ideas
Leadership
Behaviours
for
Quality
Improvement
Inclusive
Team-
Based
Culturally-
Sensitive
Personal
Collective
Primary
DriversSecondary Drivers Concepts – (Grouped By Authors)Focus
Boundary SpanningAli Mohammad Mosadegh, R. et al.2006); Benzer, J. et al.(2012); Buchanan, D.(2003); Carlisle, Y.(2011);
Morrow, E. et al.(2014); Schell, W. J. et al.(2013); Anonson, J. M. S. et al.(2009); Taylor, V.(2007); Fitzgerald,
L., E. et al.(2013); Weiner, B. et al.(1997);
Clinician InvolvementDwyer, A. (2010); Morrow, E. et al (2014); Sebastian, A. et al. (2014); Christiana Stevens, S. et al.
(2014); Luu Trong, T. (2012); Anonson, J. M. S. et al. (2009); Boak, G. et al. (2015); Weiner, B. et al.
(1997);
Communication Aij, K. H. et al. (2015); Battilana, J. et al. (2010); Borkowski, N. et al. (2011); Edmonstone, J. (2011);
Morrow, E. et al (2014); Schell, W. J. et al. (2013);
CultureAitken, K. (2014); Borkowski, N. et al. (2011); Hazelbaker, C. (2013); Sudha, X. (2008); Stahl, A., D.
Covrig et al. (2014);
Drive Aitken, K. (2014); Edmonstone, J. (2011); McFadden, K. L. et al. (2009); Sudha, X. (2008);
EngagingBenzer, J. et al (2012); Greenfield, D. et al. (2009); Morrow, E. et al (2014); Luu Trong, T. (2012); Sudha, X.
(2008); Anonson, J. M. S. et al. (2009); Stahl, A., D. Covrig and I. Newman (2014); Anonymous (2013); Boak,
G. et al. (2015); Hardacre, J. et al. (2010); White, M. et al. (2013); Fitzgerald, L. et al. (2013);
InnovativeAitken, K. (2014); Carlisle, Y. (2011); Tolk, J. et al. (2015); Luu Trong, T. (2012); Sudha, X. (2008);
Hardacre, J. et al. (2010);
Learning Systems Boaden, R. (2006); Borkowski, N. et al. (2011); Carlisle, Y. (2011); Hazelbaker, C. (2013); Morrow, E. et
al (2014); Luu Trong, T. (2012); Sudha, X. (2008); Hardacre, J. et al. (2010); Fitzgerald, L. et al. (2013);
Managing Benzer, J. et al (2012); Hazelbaker, C. (2013); Anonson, J. M. S. et al. (2009); Stahl, A., D. Covrig et al.
(2014); White, M. et al. (2013);
Mentoring/Coaching Aij, K. H. et al. (2015); Borkowski, N. et al. (2011); Christiana Stevens, S. et al. (2014); Sudha, X.
(2008); Stahl, A. et al (2014);
Patient Focused Borkowski, N. et al. (2011); Morrow, E. et al (2012); Sebastian, A. et al. (2014); Anonson, J. M. S. et al.
(2009); Boak, G. et al. (2015); Fitzgerald, L. et al. (2013);
Personal AttributesMcFadden, K. L. et al. (2009); Morrow, E. et al (2014); Christiana Stevens, S. et al. (2014); Sudha, X.
(2008); Anonson, J. M. S. et al. (2009); Wong, C. A. et al. (2009); Hardacre, J. et al. (2010); Fitzgerald,
L. et al. (2013);
RelationshipsAitken, K. (2014); Battilana, J. et al. (2010); Greenfield, D. et al. (2009); Hazelbaker, C. (2013); Hoff, T. et al.
(2011); Morrow, E. et al (2014); Sudha, X. (2008); Wong, C. A. et al. (2009); Hardacre, J. et al. (2010);
Fitzgerald, L. et al. (2013);
Resourcing Morrow, E. et al (2012); Christiana Stevens, S. et al. (2014); Anonson, J. M. S. et al. (2009); Fitzgerald,
L. et al. (2013);
Strategic Borkowski, N. et al. (2011); McFadden, K. L. et al. (2009); Morrow, E. et al (2014); Sudha, X. (2008);
Stahl, A. et al (2014); Fitzgerald, L. et al. (2013);
Supportive Aij, K. H. et al. (2015); Aitken, K. (2014); Benzer, J. et al. (2012); Edmonstone, J. (2011); Morrow, E. et
al. (2014); Ortega, A. et al. (2014);
Training/CompetencyAij, K. H. et al. (2015); Aitken, K. (2015); Benzer, J. et al. (2012); Boaden, R. (2006); Ortega, A. et al. (2014);
Schulingkamp, R. et al. (2015); Sebastian, A. et al. (2014); Christiana Stevens, S. et al. (2014); Stahl, A. et al.
(2014); White, M. et al. (2013);
12/11/2017
43
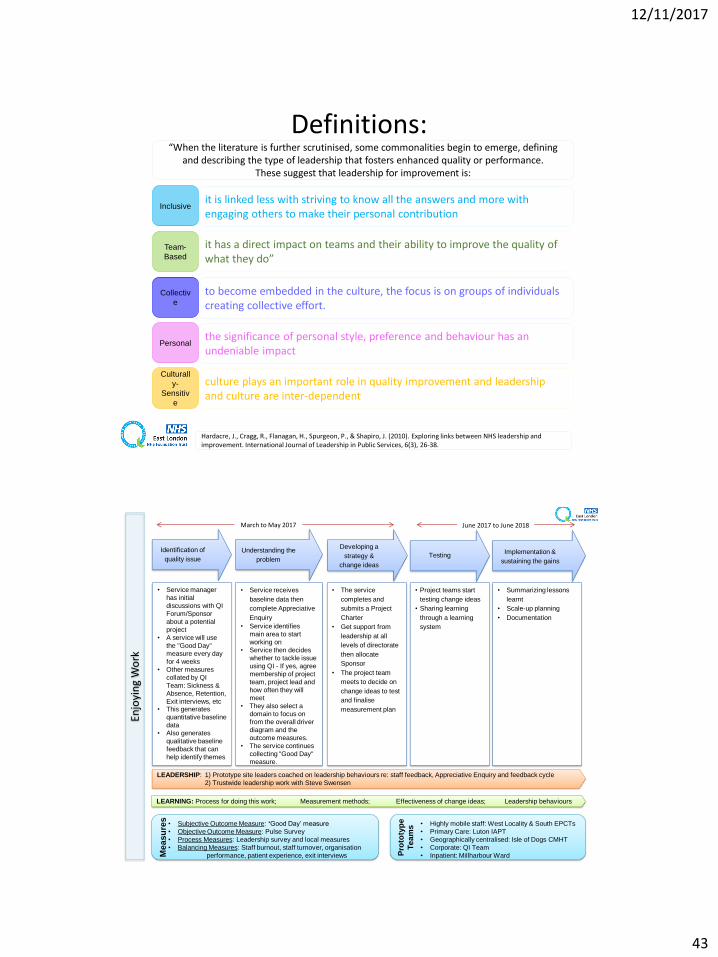
Definitions:
Inclusive
Team-
Based
Culturall
y-
Sensitiv
e
Personal
Collectiv
e
Hardacre, J., Cragg, R., Flanagan, H., Spurgeon, P., & Shapiro, J. (2010). Exploring links between NHS leadership and improvement. International Journal of Leadership in Public Services, 6(3), 26-38.
“When the literature is further scrutinised, some commonalities begin to emerge, defining and describing the type of leadership that fosters enhanced quality or performance.
These suggest that leadership for improvement is:
it is linked less with striving to know all the answers and more with engaging others to make their personal contribution
it has a direct impact on teams and their ability to improve the quality of what they do”
to become embedded in the culture, the focus is on groups of individuals creating collective effort.
the significance of personal style, preference and behaviour has an undeniable impact
culture plays an important role in quality improvement and leadership and culture are inter-dependent
Identification of
quality issue
• Service manager
has initial
discussions with QI
Forum/Sponsor
about a potential
project
• A service will use
the "Good Day"
measure every day
for 4 weeks
• Other measures
collated by QI
Team: Sickness &
Absence, Retention,
Exit interviews, etc• This generates
quantitative baseline
data
• Also generates
qualitative baseline
feedback that can
help identify themes
Understanding the
problem
• Service receives
baseline data then
complete Appreciative
Enquiry
• Service identifies
main area to start
working on
• Service then decides
whether to tackle issue
using QI - If yes, agree
membership of project
team, project lead and
how often they will
meet
• They also select a
domain to focus on
from the overall driver
diagram and the
outcome measures.
• The service continues
collecting "Good Day"
measure.
Developing a
strategy &
change ideas
• The service
completes and
submits a Project
Charter
• Get support from
leadership at all
levels of directorate
then allocate
Sponsor
• The project team
meets to decide on
change ideas to test
and finalise
measurement plan
Testing
• Project teams start
testing change ideas
• Sharing learning
through a learning
system
Implementation &
sustaining the gains
• Summarizing lessons
learnt
• Scale-up planning
• Documentation
LEADERSHIP: 1) Prototype site leaders coached on leadership behaviours re: staff feedback, Appreciative Enquiry and feedback cycle
2) Trustwide leadership work with Steve Swensen
LEARNING: Process for doing this work; Measurement methods; Effectiveness of change ideas; Leadership behaviours
March to May 2017 June 2017 to June 2018
Enjo
yin
g W
ork
• Subjective Outcome Measure: ‘Good Day’ measure
• Objective Outcome Measure: Pulse Survey
• Process Measures: Leadership survey and local measures
• Balancing Measures: Staff burnout, staff turnover, organisation
performance, patient experience, exit interviews Me
as
ure
s
• Highly mobile staff: West Locality & South EPCTs
• Primary Care: Luton IAPT
• Geographically centralised: Isle of Dogs CMHT
• Corporate: QI Team
• Inpatient: Millharbour WardPro
toty
pe
Te
am
s
12/11/2017
44
GO
OD
DA
Y M
EASU
RE
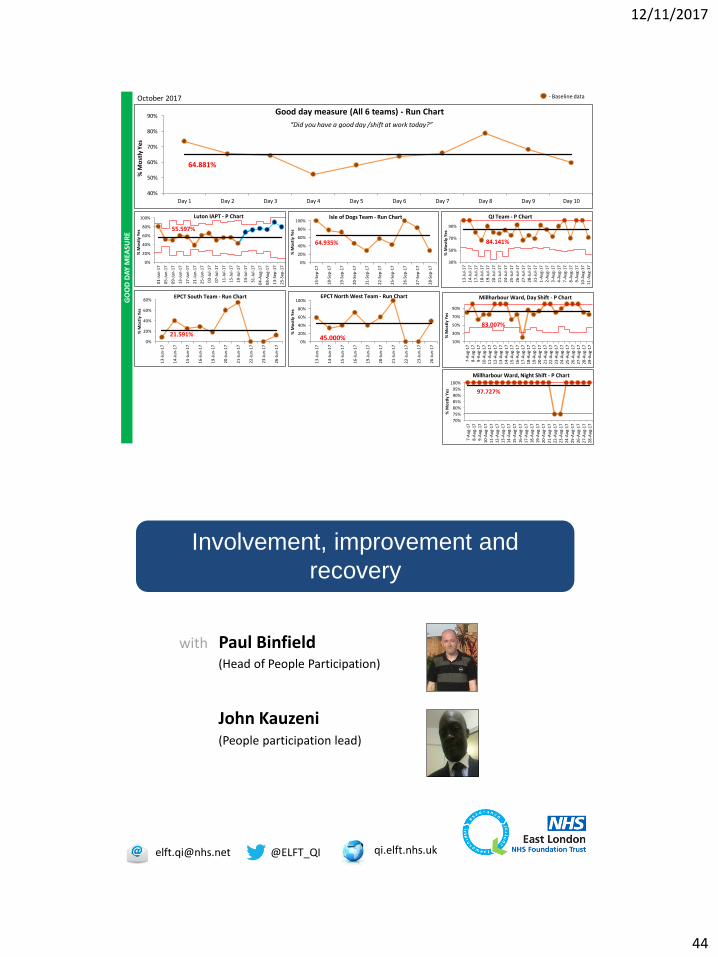
October 2017
2
- Baseline data
64.881%
40%
50%
60%
70%
80%
90%
Day 1 Day 2 Day 3 Day 4 Day 5 Day 6 Day 7 Day 8 Day 9 Day 10
% M
ost
ly Y
es
Good day measure (All 6 teams) - Run Chart
“Did you have a good day /shift at work today?”
55.597%
0%
20%
40%
60%
80%
100%
01
-Ju
n-1
7
05
-Ju
n-1
7
09
-Ju
n-1
7
13
-Ju
n-1
7
17
-Ju
n-1
7
21
-Ju
n-1
7
25
-Ju
n-1
7
03
-Ju
l-1
7
07
-Ju
l-1
7
11
-Ju
l-1
7
15
-Ju
l-1
7
19
-Ju
l-1
7
23
-Ju
l-1
7
31
-Ju
l-1
7
04
-Au
g-1
7
08
-Au
g-1
7
13
-Sep
-17
25
-Sep
-17
% M
ost
ly Y
es
Luton IAPT - P Chart
64.935%
0%
20%
40%
60%
80%
100%
15
-Sep
-17
18
-Sep
-17
19
-Sep
-17
20
-Sep
-17
21
-Sep
-17
22
-Sep
-17
25
-Sep
-17
26
-Sep
-17
27
-Sep
-17
28
-Sep
-17
% M
ost
ly Y
es
Isle of Dogs Team - Run Chart
84.141%
30%
50%
70%
90%
13
-Ju
l-1
7
14
-Ju
l-1
7
17
-Ju
l-1
7
18
-Ju
l-1
7
19
-Ju
l-1
7
20
-Ju
l-1
7
21
-Ju
l-1
7
24
-Ju
l-1
7
25
-Ju
l-1
7
26
-Ju
l-1
7
27
-Ju
l-1
7
28
-Ju
l-1
7
31
-Ju
l-1
7
1-A
ug-
17
2-A
ug-
17
3-A
ug-
17
4-A
ug-
17
7-A
ug-
17
8-A
ug-
17
9-A
ug-
17
10
-Au
g-1
7
11
-Au
g-1
7
% M
ost
ly Y
es
QI Team - P Chart
21.591%0%
20%
40%
60%
80%
13
-Ju
n-1
7
14
-Ju
n-1
7
15
-Ju
n-1
7
16
-Ju
n-1
7
19
-Ju
n-1
7
20
-Ju
n-1
7
21
-Ju
n-1
7
22
-Ju
n-1
7
23
-Ju
n-1
7
26
-Ju
n-1
7
% M
ost
ly Y
es
EPCT South Team - Run Chart
45.000%0%
20%
40%
60%
80%
100%
13
-Ju
n-1
7
14
-Ju
n-1
7
15
-Ju
n-1
7
16
-Ju
n-1
7
19
-Ju
n-1
7
20
-Ju
n-1
7
21
-Ju
n-1
7
22
-Ju
n-1
7
23
-Ju
n-1
7
26
-Ju
n-1
7
% M
ost
ly Y
es
EPCT North West Team - Run Chart
83.007%
10%
30%
50%
70%
90%
7-A
ug-
178
-Au
g-17
9-A
ug-
171
0-A
ug-
17
11
-Au
g-1
71
2-A
ug-
17
13
-Au
g-1
71
4-A
ug-
17
15
-Au
g-1
71
6-A
ug-
17
17
-Au
g-1
71
8-A
ug-
17
19
-Au
g-1
72
0-A
ug-
17
21
-Au
g-1
72
2-A
ug-
17
23
-Au
g-1
72
4-A
ug-
17
25
-Au
g-1
72
6-A
ug-
17
27
-Au
g-1
72
8-A
ug-
17
29
-Au
g-1
7
% M
ost
ly Y
es
Millharbour Ward, Day Shift - P Chart
97.727%
70%
75%
80%
85%
90%
95%
100%
7-A
ug-
17
8-A
ug-
179
-Au
g-17
10
-Au
g-1
7
11
-Au
g-1
7
12
-Au
g-1
7
13
-Au
g-1
71
4-A
ug-
17
15
-Au
g-1
71
6-A
ug-
17
17
-Au
g-1
71
8-A
ug-
17
19
-Au
g-1
7
20
-Au
g-1
7
21
-Au
g-1
72
2-A
ug-
17
23
-Au
g-1
72
4-A
ug-
17
25
-Au
g-1
72
6-A
ug-
17
27
-Au
g-1
7
28
-Au
g-1
7
% M
ost
ly Y
es
Millharbour Ward, Night Shift - P Chart
@[email protected] qi.elft.nhs.uk
Involvement, improvement and
recovery
with Paul Binfield(Head of People Participation)
John Kauzeni(People participation lead)
12/11/2017
45
PRIDE Research Project
Adrian Curwen, Jane Fernandes, Racheal Howison, Paul Binfield, Winnie Chow and Domenico Giacco
2017
The PRIDE Project
• PRIDE = Participation; Recovery;
Involvement; Development; Experience.
• Funded by the Centre for Public
Engagement, Queen Mary University of
London, based at East London Foundation
Trust.
12/11/2017
46
9
1
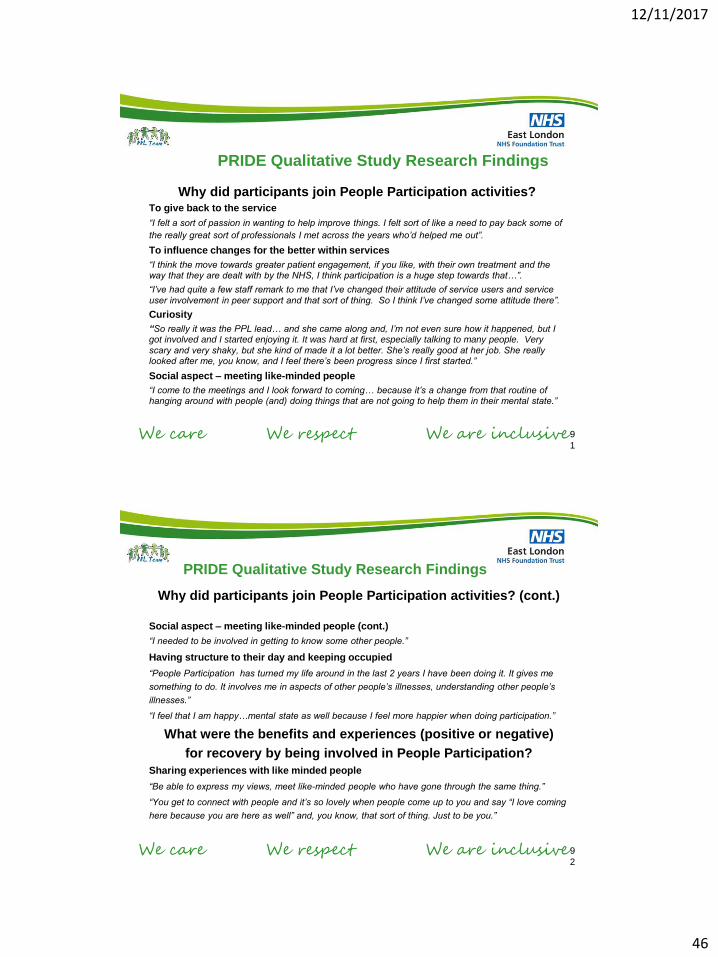
PRIDE Qualitative Study Research Findings
Why did participants join People Participation activities?To give back to the service
“I felt a sort of passion in wanting to help improve things. I felt sort of like a need to pay back some of
the really great sort of professionals I met across the years who’d helped me out”.
To influence changes for the better within services
“I think the move towards greater patient engagement, if you like, with their own treatment and the way that they are dealt with by the NHS, I think participation is a huge step towards that…”.
“I’ve had quite a few staff remark to me that I’ve changed their attitude of service users and service
user involvement in peer support and that sort of thing. So I think I’ve changed some attitude there”.
Curiosity
“So really it was the PPL lead… and she came along and, I’m not even sure how it happened, but I got involved and I started enjoying it. It was hard at first, especially talking to many people. Very
scary and very shaky, but she kind of made it a lot better. She’s really good at her job. She really looked after me, you know, and I feel there’s been progress since I first started.”
Social aspect – meeting like-minded people
“I come to the meetings and I look forward to coming… because it’s a change from that routine of hanging around with people (and) doing things that are not going to help them in their mental state.”
9
2
PRIDE Qualitative Study Research Findings
Why did participants join People Participation activities? (cont.)
Social aspect – meeting like-minded people (cont.)
“I needed to be involved in getting to know some other people.”
Having structure to their day and keeping occupied
“People Participation has turned my life around in the last 2 years I have been doing it. It gives me
something to do. It involves me in aspects of other people’s illnesses, understanding other people’s
illnesses.”
“I feel that I am happy…mental state as well because I feel more happier when doing participation.”
What were the benefits and experiences (positive or negative)
for recovery by being involved in People Participation?
Sharing experiences with like minded people
“Be able to express my views, meet like-minded people who have gone through the same thing.”
“You get to connect with people and it’s so lovely when people come up to you and say “I love coming
here because you are here as well” and, you know, that sort of thing. Just to be you.”
12/11/2017
47
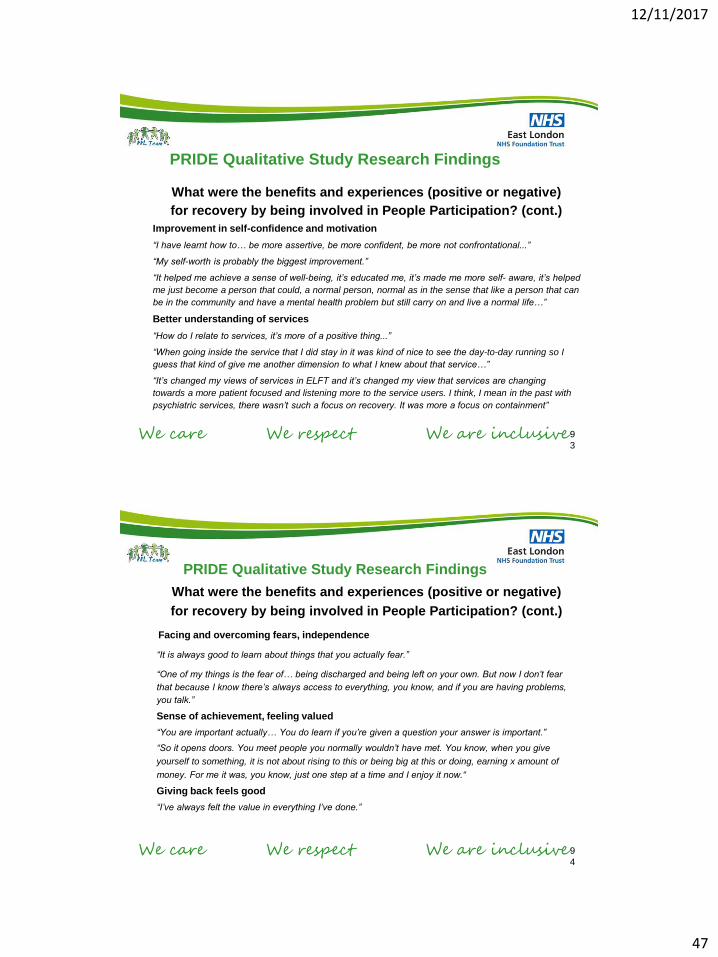
9
3
PRIDE Qualitative Study Research Findings
What were the benefits and experiences (positive or negative)
for recovery by being involved in People Participation? (cont.)
Improvement in self-confidence and motivation
“I have learnt how to… be more assertive, be more confident, be more not confrontational...”
“My self-worth is probably the biggest improvement.”
“It helped me achieve a sense of well-being, it’s educated me, it’s made me more self- aware, it’s helped
me just become a person that could, a normal person, normal as in the sense that like a person that can
be in the community and have a mental health problem but still carry on and live a normal life…”
Better understanding of services
“How do I relate to services, it’s more of a positive thing...”
“When going inside the service that I did stay in it was kind of nice to see the day-to-day running so I
guess that kind of give me another dimension to what I knew about that service…”
“It’s changed my views of services in ELFT and it’s changed my view that services are changing
towards a more patient focused and listening more to the service users. I think, I mean in the past with
psychiatric services, there wasn’t such a focus on recovery. It was more a focus on containment”
9
4
PRIDE Qualitative Study Research Findings
What were the benefits and experiences (positive or negative)
for recovery by being involved in People Participation? (cont.)
“It is always good to learn about things that you actually fear.”
“One of my things is the fear of… being discharged and being left on your own. But now I don’t fear
that because I know there’s always access to everything, you know, and if you are having problems,
you talk.”
Sense of achievement, feeling valued
“You are important actually… You do learn if you’re given a question your answer is important.”
“So it opens doors. You meet people you normally wouldn’t have met. You know, when you give
yourself to something, it is not about rising to this or being big at this or doing, earning x amount of
money. For me it was, you know, just one step at a time and I enjoy it now.“
Giving back feels good
“I’ve always felt the value in everything I’ve done.”
Facing and overcoming fears, independence
12/11/2017
48
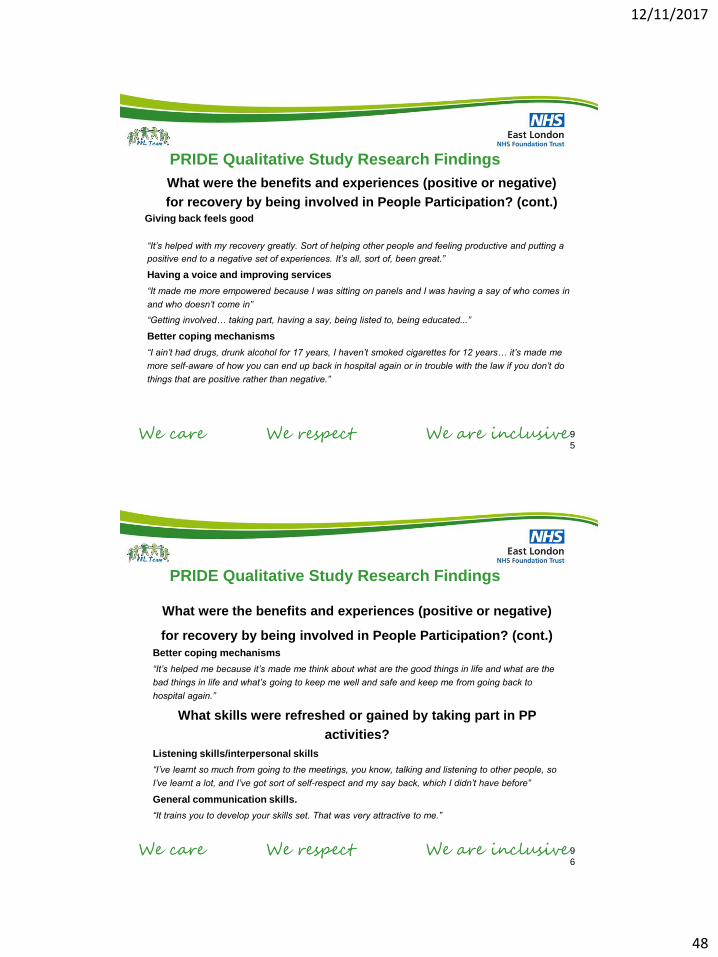
9
5
PRIDE Qualitative Study Research Findings
What were the benefits and experiences (positive or negative)
for recovery by being involved in People Participation? (cont.)
“It’s helped with my recovery greatly. Sort of helping other people and feeling productive and putting a
positive end to a negative set of experiences. It’s all, sort of, been great.”
Having a voice and improving services
“It made me more empowered because I was sitting on panels and I was having a say of who comes in
and who doesn’t come in”
“Getting involved… taking part, having a say, being listed to, being educated...”
Better coping mechanisms
“I ain’t had drugs, drunk alcohol for 17 years, I haven’t smoked cigarettes for 12 years… it’s made me
more self-aware of how you can end up back in hospital again or in trouble with the law if you don’t do
things that are positive rather than negative.”
Giving back feels good
9
6
PRIDE Qualitative Study Research Findings
What were the benefits and experiences (positive or negative)
for recovery by being involved in People Participation? (cont.)
Better coping mechanisms
“It’s helped me because it’s made me think about what are the good things in life and what are the
bad things in life and what’s going to keep me well and safe and keep me from going back to
hospital again.”
What skills were refreshed or gained by taking part in PP
activities?
Listening skills/interpersonal skills
“I’ve learnt so much from going to the meetings, you know, talking and listening to other people, so
I’ve learnt a lot, and I’ve got sort of self-respect and my say back, which I didn’t have before”
General communication skills.
“It trains you to develop your skills set. That was very attractive to me.”

12/11/2017
49
9
7
PRIDE Qualitative Study Research Findings
What skills were refreshed or gained by taking part
in People Participation activities?
Public speaking skills - giving training to staff
“I think being able to express yourself, especially when I do talks with new nurses or new social
therapists, they really want to hear the service user’s view and see the other side. Not just the things
they are trained in. Not just the things that are passed down, but the service user’s view is the reality.
The fact that I was a patient made my views more important.”
“I’ve had quite a few staff remark to me that I’ve changed their attitude of service users and service
user involvement in peer support and that sort of thing. So I think I’ve changed some attitude there.”
Creative skills (poetry)
Avoiding conflict/ dealing better with conflict
9
8
PRIDE Qualitative Study Research Findings
What were the participants’ experience of the support provided?
Trust/Availability
“Yes, she has been really good. I’ve needed to lean on her quite a bit. Especially when writing any
script or doing any talk, the fact that she’s there makes it much easier. I can get all the information that I
need and she really supports me. She does a wonderful job. She has great qualities, you know. So I
wouldn’t be able to do the stuff I’ve done without her.”
“Our People Participation Lead is probably the best one and I wouldn’t want anyone else. I can talk to
her about anything. She is down to earth, human. She’s a lovely lady and I can go to her whenever I
like.”
Being a companion
Facing fears - pushing personal boundaries
“I set myself boundaries because I guess we all live in our own safety nets when you have mental
illness. She actually makes me go to the edge and sometimes over. And when I do that, I feel, you
know, like, ‘wow, I’m so glad I did that. Can I do that? I can really do that’ you know.”
Keeping updated on training, events and opportunities
Support with personal issues
12/11/2017
50
9
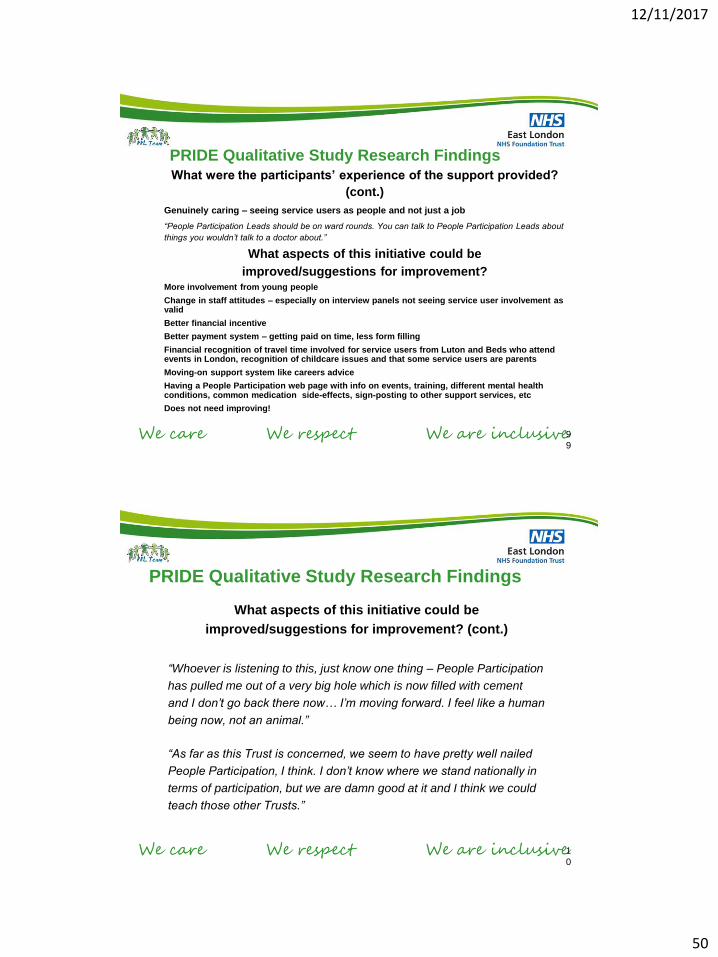
9
PRIDE Qualitative Study Research FindingsWhat were the participants’ experience of the support provided?
(cont.)
Genuinely caring – seeing service users as people and not just a job
“People Participation Leads should be on ward rounds. You can talk to People Participation Leads about
things you wouldn’t talk to a doctor about.”
What aspects of this initiative could be
improved/suggestions for improvement?More involvement from young people
Change in staff attitudes – especially on interview panels not seeing service user involvement as valid
Better financial incentive
Better payment system – getting paid on time, less form filling
Financial recognition of travel time involved for service users from Luton and Beds who attend events in London, recognition of childcare issues and that some service users are parents
Moving-on support system like careers advice
Having a People Participation web page with info on events, training, different mental health conditions, common medication side-effects, sign-posting to other support services, etc
Does not need improving!
1
0
0
PRIDE Qualitative Study Research Findings
What aspects of this initiative could be
improved/suggestions for improvement? (cont.)
“Whoever is listening to this, just know one thing – People Participation
has pulled me out of a very big hole which is now filled with cement
and I don’t go back there now… I’m moving forward. I feel like a human
being now, not an animal.”
“As far as this Trust is concerned, we seem to have pretty well nailed
People Participation, I think. I don’t know where we stand nationally in
terms of participation, but we are damn good at it and I think we could
teach those other Trusts.”
12/11/2017
51
@[email protected] qi.elft.nhs.uk
Break Time
@[email protected] qi.elft.nhs.uk
Some time to reflect
at your tables
• What are your biggest opportunities and challenges in behavioral health?
• Have you heard anything today that you’d like to try back in your organization?
• How might you get started with using QI in behavioral health and involving patients and families within your improvement work?
12/11/2017
52
Marie Navina Steven Auzewell
Paul John James Amar
Panel Discussion
@ELFT_QIqi.elft.nhs.uk [email protected]