Embed Size (px)
Citation preview
Improved Gridded Localized Aviation MOS Program
(LAMP) Ceiling and Visibility Guidance using HRRR
model output
Presenting: Judy E. Ghirardelli/Adam Schnapp
Developers: Bob Glahn, Adam Schnapp*, and Jung-Sun Im
National Weather Service
Meteorological Development Laboratory
* NOAA affiliate, Wyle, Inc.
Aviation Weather Testbed Summer Experiment 2015
Lunchtime Seminar
Aviation Weather Center
August 10, 2015
LAMP+HRRR Meld work funded by NOAA's Nextgen Weather Program
Outline
2
• LAMP Background
General
Ceiling height and Visibility
• Current Operational System
• Planned Improvements
• Development and Verification
• Cases
• Viewer
• Future Plans

3
LAMP Background
Localized Aviation MOS Program (LAMP)
Background
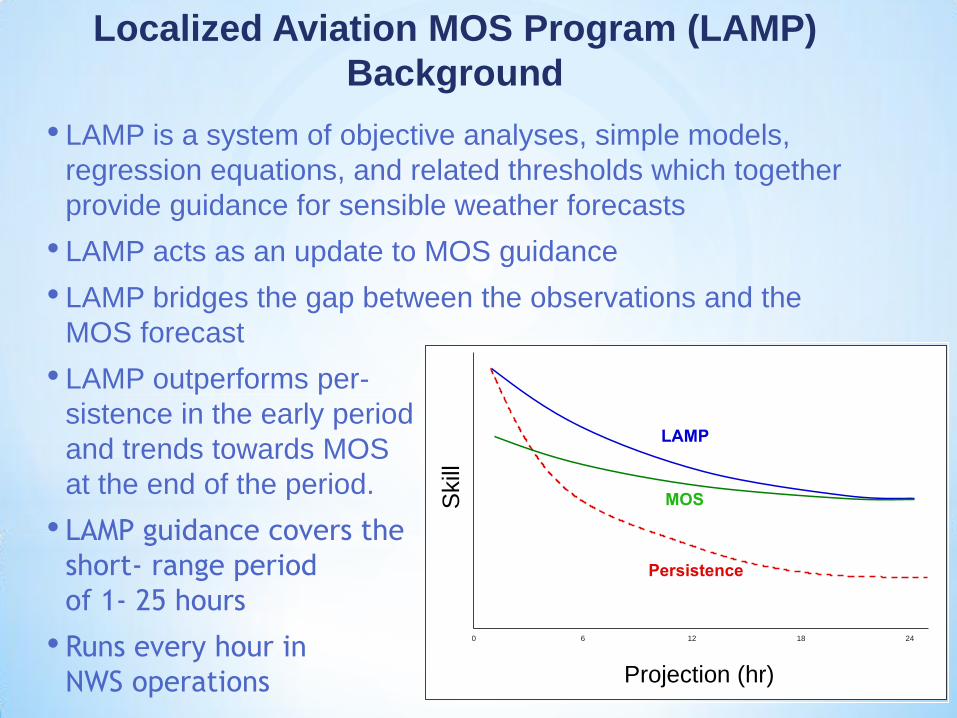
• LAMP is a system of objective analyses, simple models,
regression equations, and related thresholds which together
provide guidance for sensible weather forecasts
• LAMP acts as an update to MOS guidance
• LAMP bridges the gap between the observations and the
MOS forecast
• LAMP outperforms per-
sistence in the early period
and trends towards MOS
at the end of the period.
• LAMP guidance covers the
short- range period
of 1- 25 hours
• Runs every hour in
NWS operations 4
0 6 12 18 24
Skill
Projection (hr)
LAMP
MOS
Persistence
Projection (hr)
Skill
LAMP Guidance Details
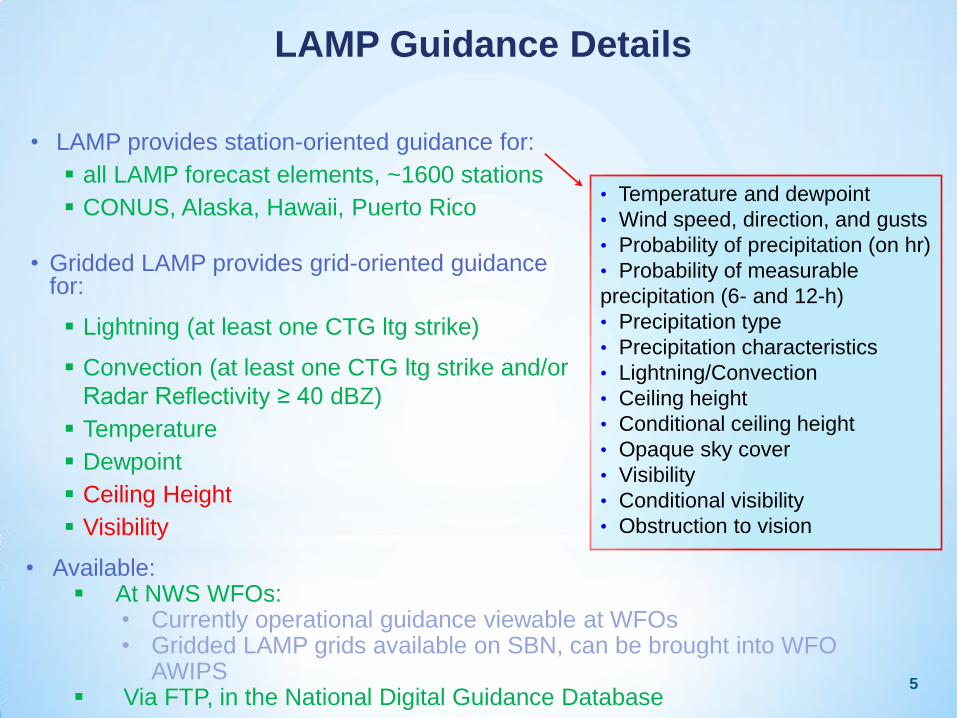
• LAMP provides station-oriented guidance for:
all LAMP forecast elements, ~1600 stations
CONUS, Alaska, Hawaii, Puerto Rico
• Gridded LAMP provides grid-oriented guidance for:
Lightning (at least one CTG ltg strike)
Convection (at least one CTG ltg strike and/or
Radar Reflectivity ≥ 40 dBZ)
Temperature
Dewpoint
Ceiling Height
Visibility
• Temperature and dewpoint
• Wind speed, direction, and gusts
• Probability of precipitation (on hr)
• Probability of measurable
precipitation (6- and 12-h)
• Precipitation type
• Precipitation characteristics
• Lightning/Convection
• Ceiling height
• Conditional ceiling height
• Opaque sky cover
• Visibility
• Conditional visibility
• Obstruction to vision
• Available: At NWS WFOs:
• Currently operational guidance viewable at WFOs • Gridded LAMP grids available on SBN, can be brought into WFO
AWIPS Via FTP, in the National Digital Guidance Database
5

LAMP Current Status: Available Products
• Website products: http://weather.gov/mdl/lamp/index.shtml
• Website products: Text bulletins
Meteograms
Station plots
Probability/Threshold images
Gridded lightning/ convection images
Gridded LAMP images
6
7
Current Operational
System
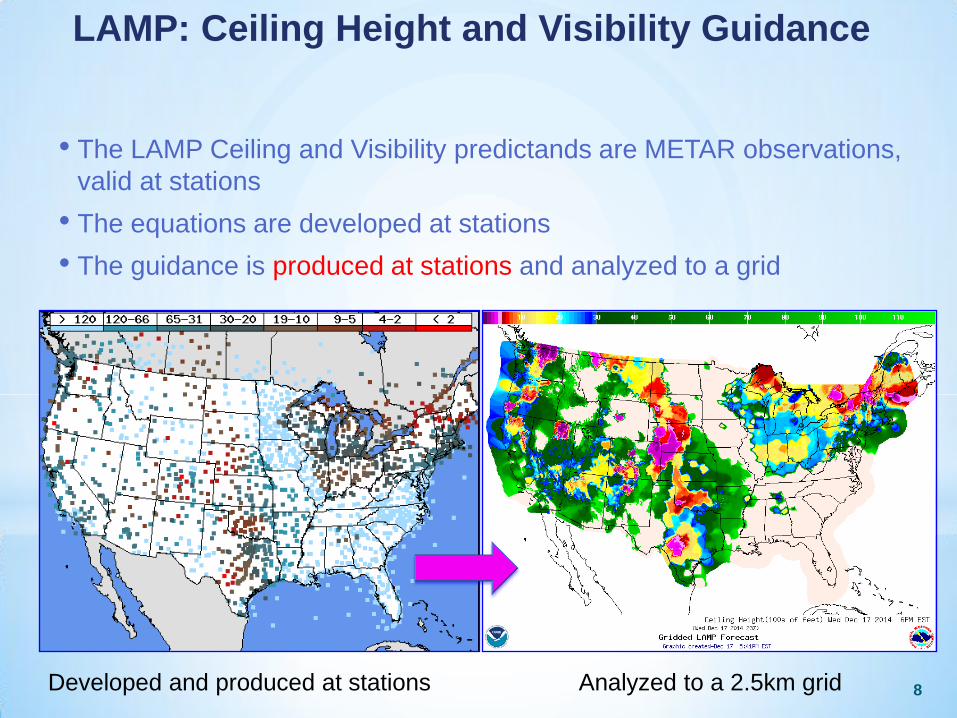
LAMP: Ceiling Height and Visibility Guidance
• The LAMP Ceiling and Visibility predictands are METAR observations,
valid at stations
• The equations are developed at stations
• The guidance is produced at stations and analyzed to a grid
8Developed and produced at stations Analyzed to a 2.5km grid
Current Challenges
• LAMP Ceiling Height and Visibility:
Very few (< 3,000) METAR station observations to adequately
cover the CONUS grid; no mesonet data
No observations of ceiling and visibility in the Atlantic or Pacific,
some observations in the Gulf of Mexico insufficient
information in the water areas to provide spatially detailed
guidance over the water or in marine areas
Ceiling height and visibility are very discontinuous fields
9
10
Planned
Improvements
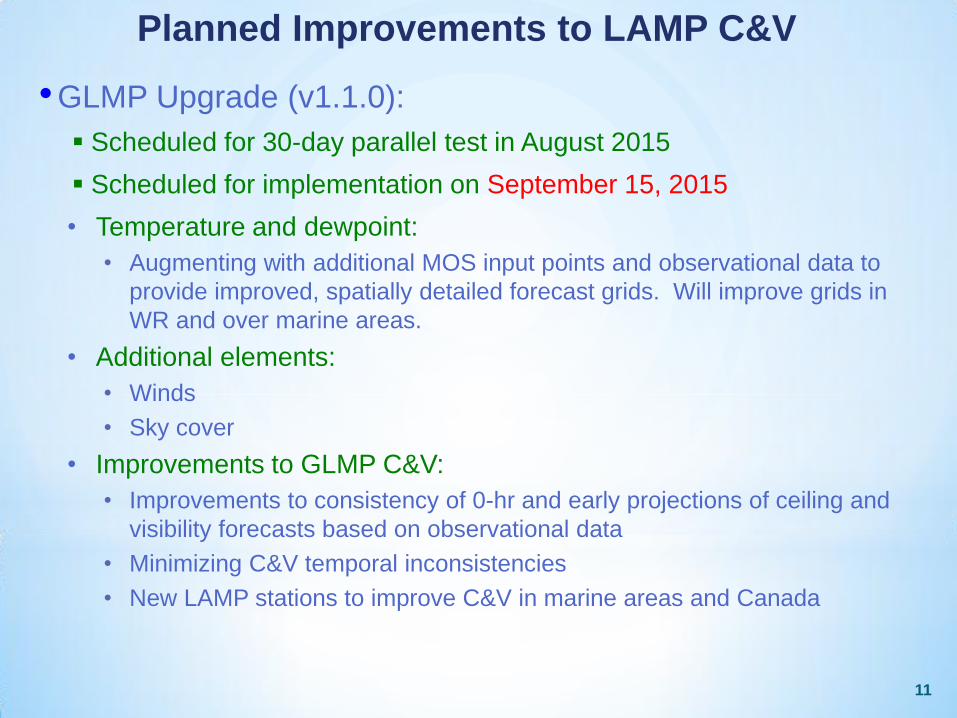
Planned Improvements to LAMP C&V
• GLMP Upgrade (v1.1.0):
Scheduled for 30-day parallel test in August 2015
Scheduled for implementation on September 15, 2015
• Temperature and dewpoint:
• Augmenting with additional MOS input points and observational data to
provide improved, spatially detailed forecast grids. Will improve grids in
WR and over marine areas.
• Additional elements:
• Winds
• Sky cover
• Improvements to GLMP C&V:
• Improvements to consistency of 0-hr and early projections of ceiling and
visibility forecasts based on observational data
• Minimizing C&V temporal inconsistencies
• New LAMP stations to improve C&V in marine areas and Canada
11
12
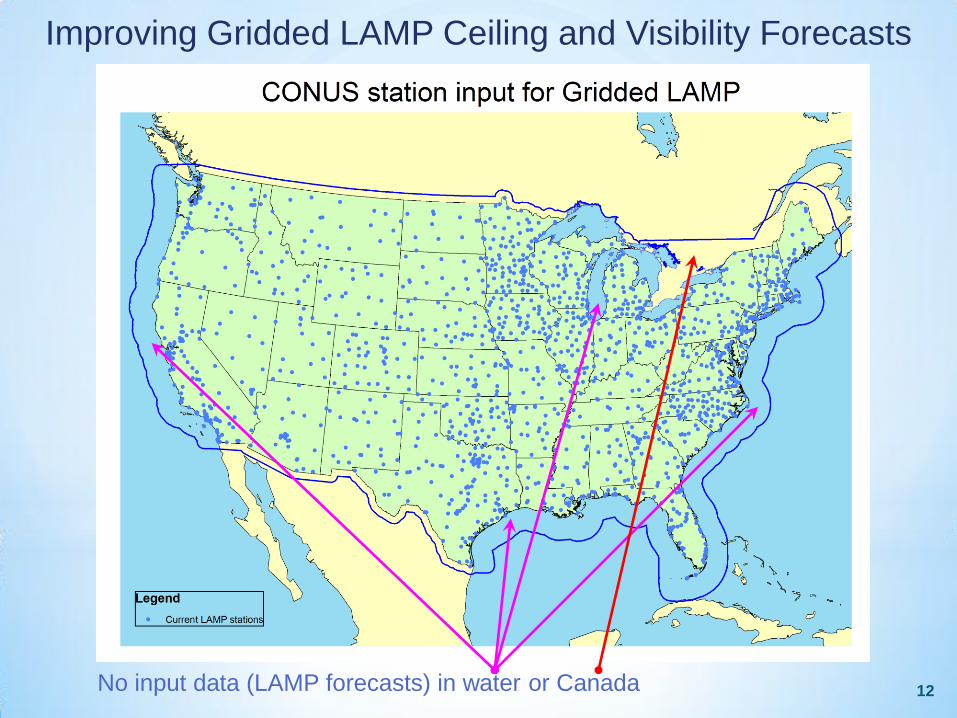
Improving Gridded LAMP Ceiling and Visibility Forecasts
No input data (LAMP forecasts) in water or Canada
13
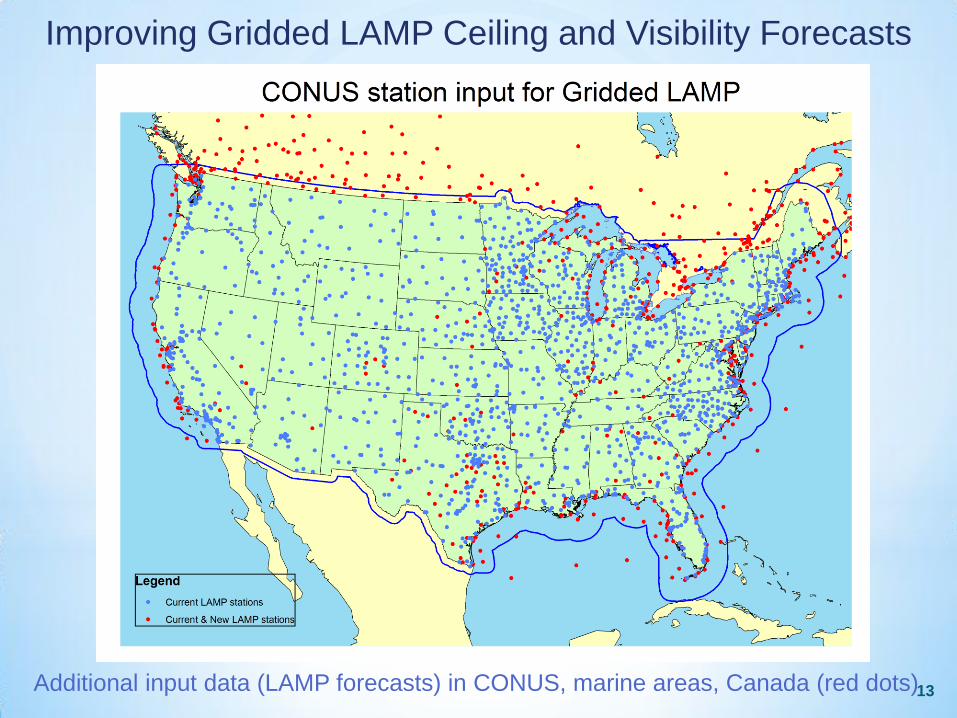
Improving Gridded LAMP Ceiling and Visibility Forecasts
Additional input data (LAMP forecasts) in CONUS, marine areas, Canada (red dots)
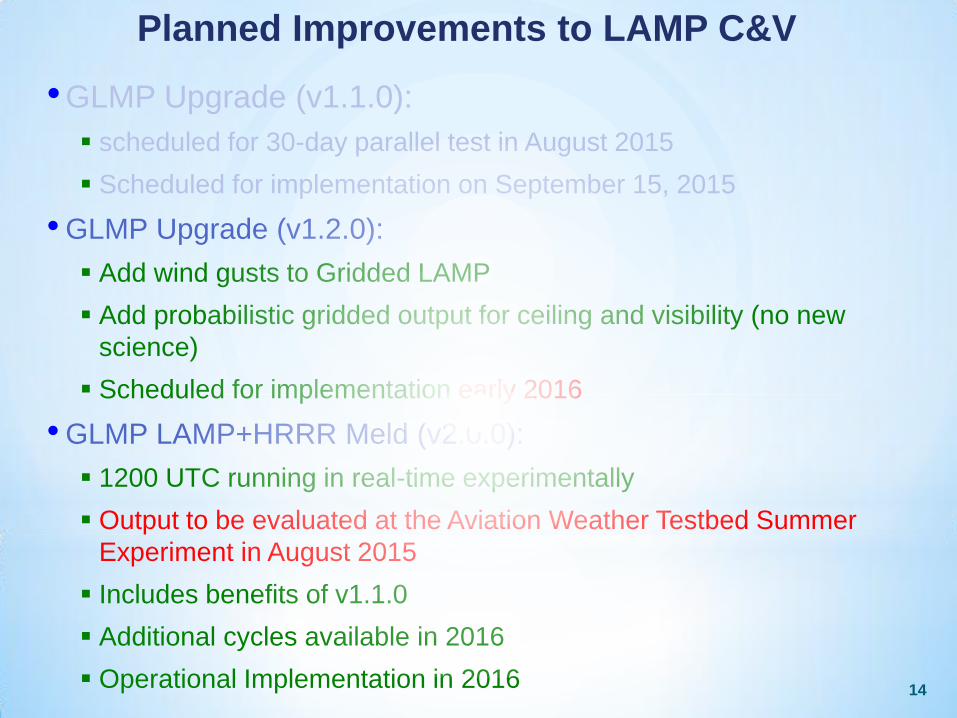
Planned Improvements to LAMP C&V
• GLMP Upgrade (v1.1.0):
scheduled for 30-day parallel test in August 2015
Scheduled for implementation on September 15, 2015
• GLMP Upgrade (v1.2.0):
Add wind gusts to Gridded LAMP
Add probabilistic gridded output for ceiling and visibility (no new
science)
Scheduled for implementation early 2016
• GLMP LAMP+HRRR Meld (v2.0.0):
1200 UTC running in real-time experimentally
Output to be evaluated at the Aviation Weather Testbed Summer
Experiment in August 2015
Includes benefits of v1.1.0
Additional cycles available in 2016
Operational Implementation in 2016 14
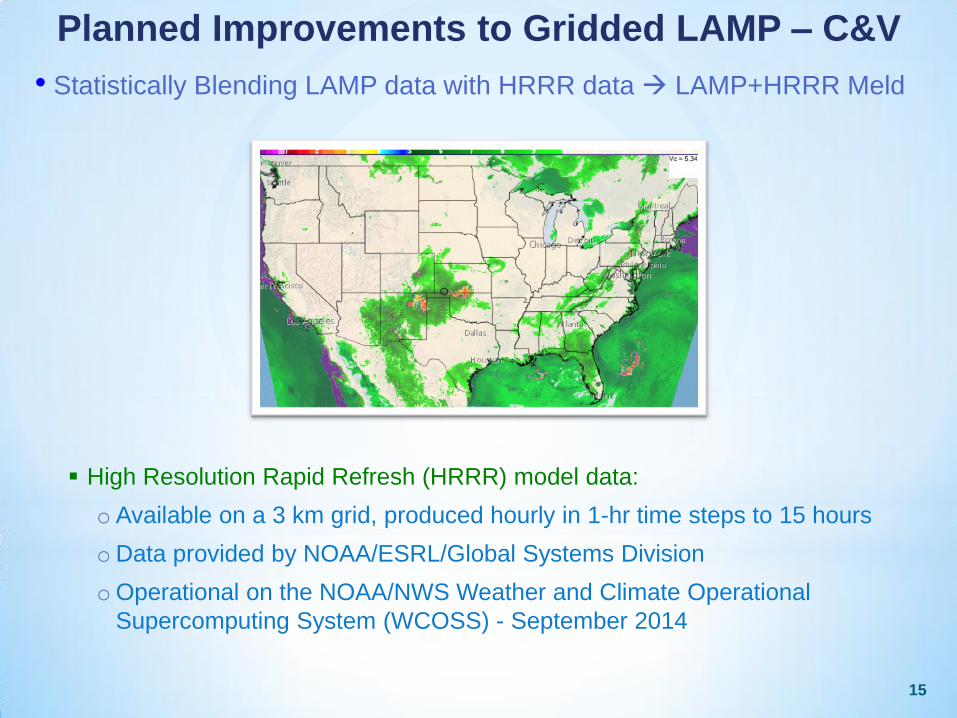
Planned Improvements to Gridded LAMP – C&V
• Statistically Blending LAMP data with HRRR data LAMP+HRRR Meld
High Resolution Rapid Refresh (HRRR) model data:
o Available on a 3 km grid, produced hourly in 1-hr time steps to 15 hours
o Data provided by NOAA/ESRL/Global Systems Division
o Operational on the NOAA/NWS Weather and Climate Operational
Supercomputing System (WCOSS) - September 2014
15
16
Development and Verification:
Cool Season
Improving LAMP CIG & VIS: HRRR Verification
• Initial Verification:
Verified at:
o 1562 CONUS LAMP stations; 314 CONUS non-LAMP stations
o Warm season (April – Sept. 2013) and cool season (Oct. 2013– Mar. 2014 ).
o 0000 UTC LAMP vs 2300 UTC HRRR;
o 1200 UTC LAMP vs 1100 UTC HRRR
Results:
HRRR had better Threat Scores (TS) than LAMP for VIS after
the beginning period at LAMP stations at 0000 UTC, and in
general, much better scores at non-LAMP stations
HRRR had higher biases than LAMP at the lower visibility
categories
HRRR showed less improvement over LAMP for CIG and in the
1200 UTC comparison, even at non-LAMP stations
HRRR showed less improvement over LAMP for CIG and VIS in
the warm season compared to the cool season 17
Improving LAMP CIG & VIS:
Regression Equation Development – Cool Season
• Regression Analysis:
First focused on visibility
Predictand Data: METAR Observations
Predictor Data: LAMP and HRRR VIS forecasts
Data Sample: Cool season development October 2013 – March 2014
o 4 months for dependent data
o 2 months for independent data
Generalized Operator Approach many cases
Equations developed for 0000 UTC:
o LAMP+HRRR Regression:
Using 0000 UTC LAMP Cumulative Probabilities + 2300
UTC HRRR Cumulative Binaries only 18
19
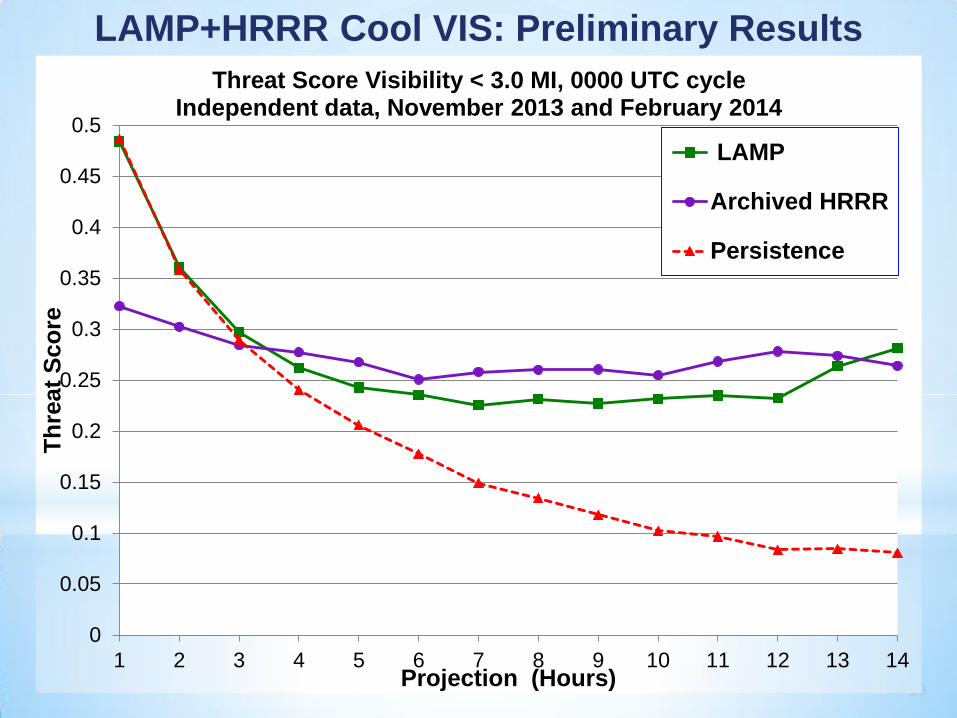
LAMP+HRRR Cool VIS: Preliminary Results
Threat Score Visibility < 3.0 MI, 0000 UTC cycle Independent data, November 2013 and February 2014
0.5
0.45
0
0.05
0.1
0.15
0.2
0.25
0.3
0.35
0.4
1 2 3 4 5 6 7 8 9 10 11 12 13 14
Th
reat
Sco
re
Projection (Hours)
LAMP
Archived HRRR
Persistence
20
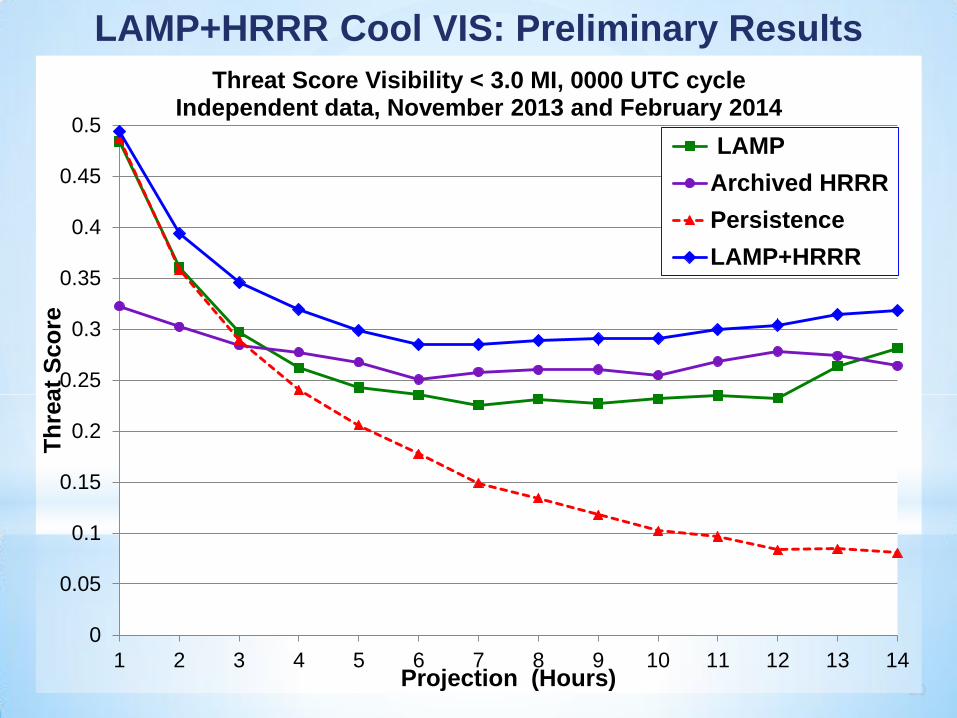
LAMP+HRRR Cool VIS: Preliminary Results
Threat Score Visibility < 3.0 MI, 0000 UTC cycle Independent data, November 2013 and February 2014
0
0.05
0.1
0.15
0.2
0.25
0.3
0.35
0.4
0.45
0.5
1 2 3 4 5 6 7 8 9 10 11 12 13 14
Th
reat
Sco
re
Projection (Hours)
LAMP
Archived HRRR
Persistence
LAMP+HRRR
21
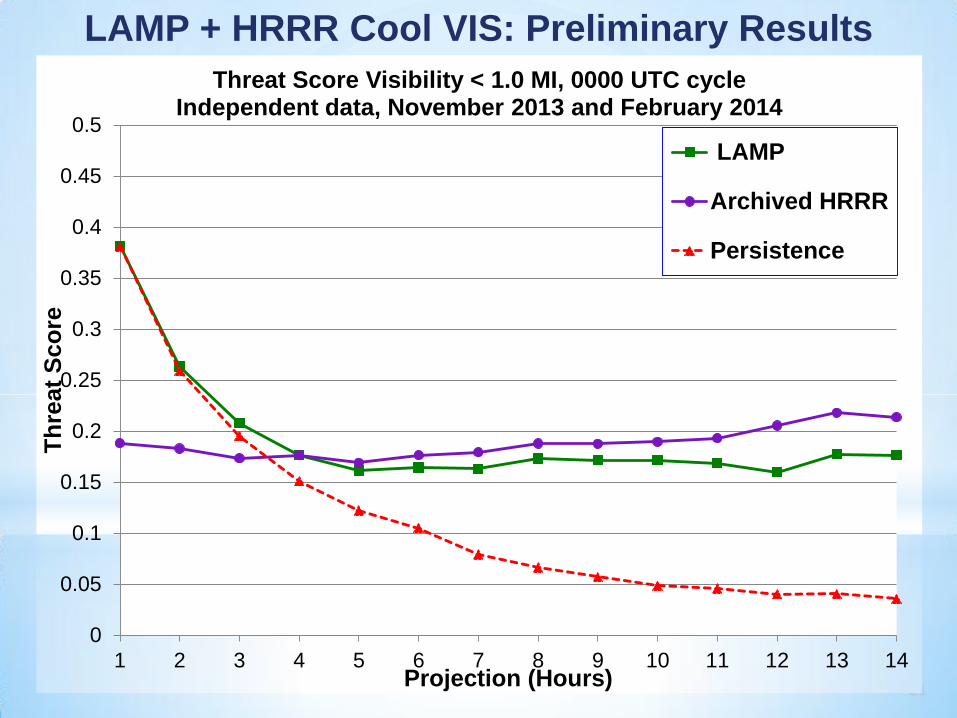
LAMP + HRRR Cool VIS: Preliminary Results
Threat Score Visibility < 1.0 MI, 0000 UTC cycle Independent data, November 2013 and February 2014
0.5
0.45
0
0.05
0.1
0.15
0.2
0.25
0.3
0.35
0.4
1 2 3 4 5 6 7 8 9 10 11 12 13 14
Th
reat
Sco
re
Projection (Hours)
LAMP
Archived HRRR
Persistence
22
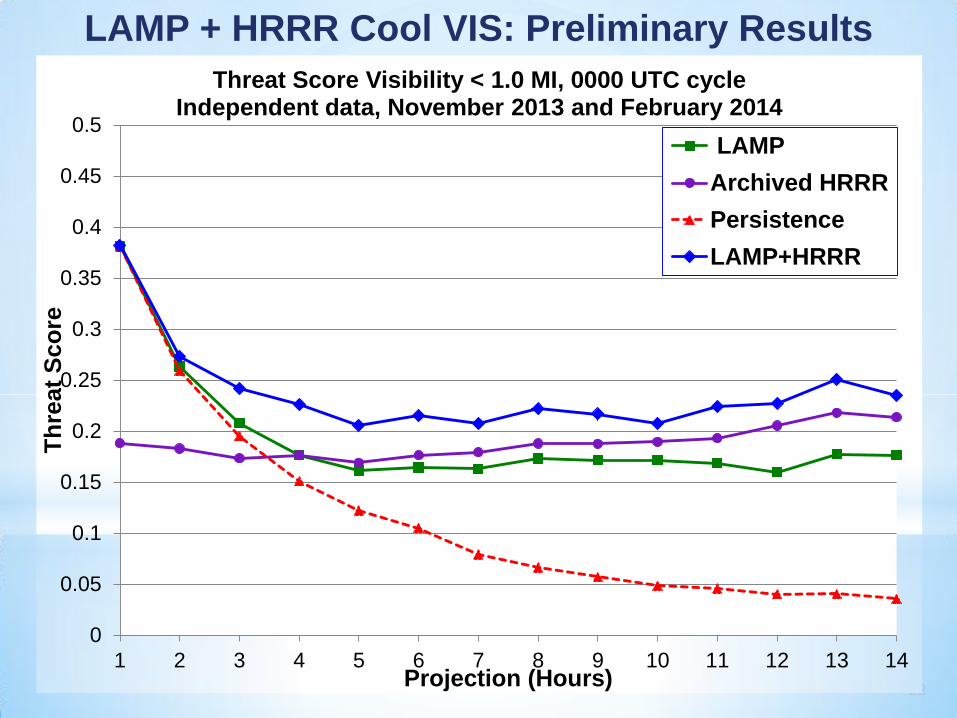
LAMP + HRRR Cool VIS: Preliminary Results
Threat Score Visibility < 1.0 MI, 0000 UTC cycle Independent data, November 2013 and February 2014
0
0.05
0.1
0.15
0.2
0.25
0.3
0.35
0.4
0.45
0.5
1 2 3 4 5 6 7 8 9 10 11 12 13 14
Th
reat
Sco
re
Projection (Hours)
LAMP
Archived HRRR
Persistence
LAMP+HRRR
23
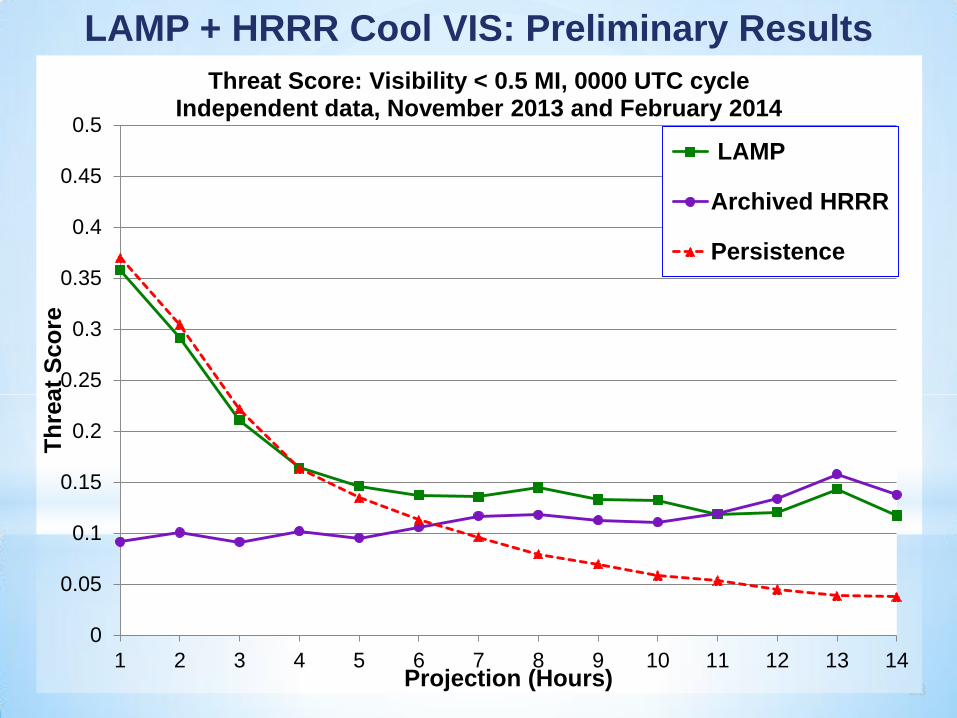
LAMP + HRRR Cool VIS: Preliminary Results
Threat Score: Visibility < 0.5 MI, 0000 UTC cycle Independent data, November 2013 and February 2014
0.5
0.45
0
0.05
0.1
0.15
0.2
0.25
0.3
0.35
0.4
1 2 3 4 5 6 7 8 9 10 11 12 13 14
Th
reat
Sco
re
Projection (Hours)
LAMP
Archived HRRR
Persistence
24
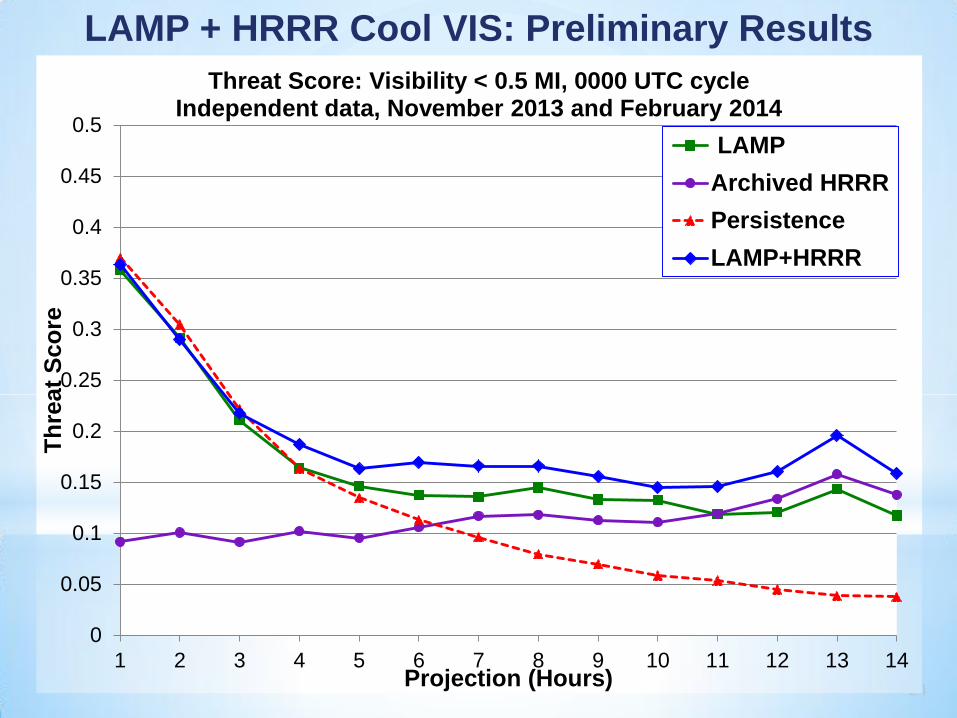
LAMP + HRRR Cool VIS: Preliminary Results
Threat Score: Visibility < 0.5 MI, 0000 UTC cycle Independent data, November 2013 and February 2014
0.5
0.45
0
0.05
0.1
0.15
0.2
0.25
0.3
0.35
0.4
1 2 3 4 5 6 7 8 9 10 11 12 13 14
Th
reat
Sco
re
Projection (Hours)
LAMP
Archived HRRR
Persistence
LAMP+HRRR
25
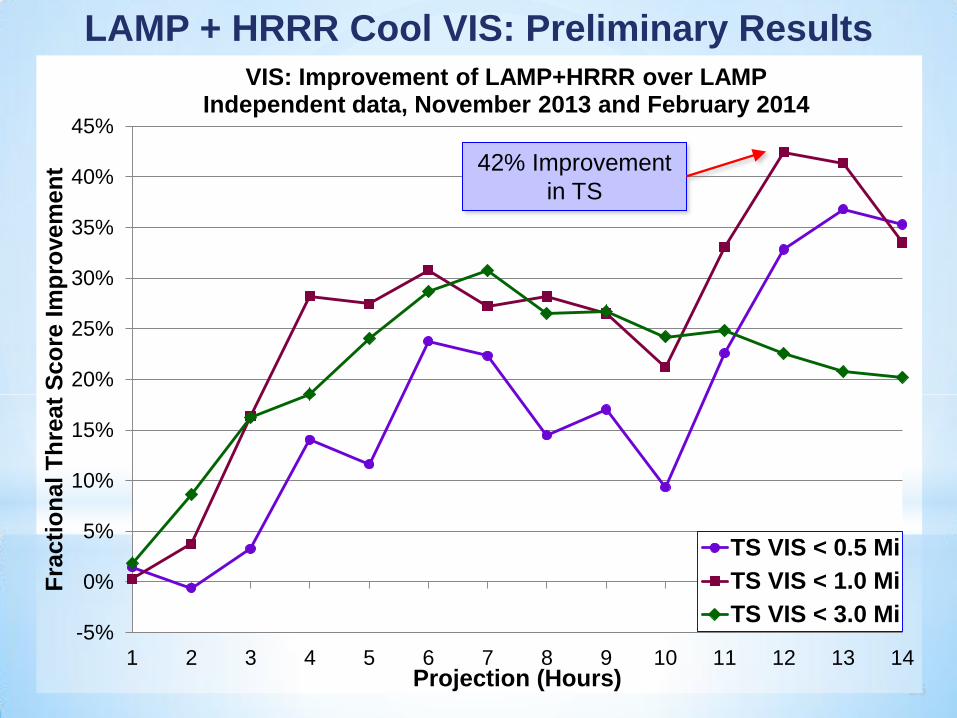
LAMP + HRRR Cool VIS: Preliminary Results
VIS: Improvement of LAMP+HRRR over LAMP Independent data, November 2013 and February 2014
-5%
0%
5%
10%
15%
20%
25%
30%
35%
40%
45%
1 2 3 4 5 6 7 8 9 10 11 12 13 14
Fra
cti
on
al T
hre
at
Sco
re I
mp
rovem
en
t
Projection (Hours)
TS VIS < 0.5 Mi
TS VIS < 1.0 Mi
TS VIS < 3.0 Mi
42% Improvement
in TS
26
Development and Verification:
Warm Season
Improving LAMP CIG & VIS:
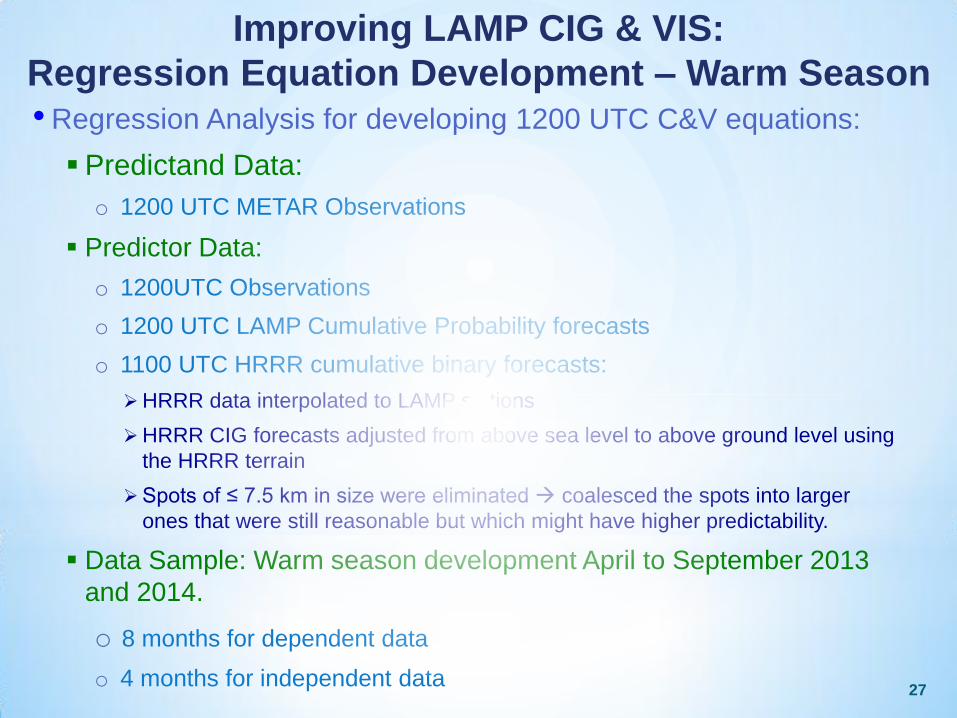
Regression Equation Development – Warm Season • Regression Analysis for developing 1200 UTC C&V equations:
Predictand Data:
o 1200 UTC METAR Observations
Predictor Data:
o 1200UTC Observations
o 1200 UTC LAMP Cumulative Probability forecasts
o 1100 UTC HRRR cumulative binary forecasts:
HRRR data interpolated to LAMP stations
HRRR CIG forecasts adjusted from above sea level to above ground level using
the HRRR terrain
Spots of ≤ 7.5 km in size were eliminated coalesced the spots into larger
ones that were still reasonable but which might have higher predictability.
Data Sample: Warm season development April to September 2013
and 2014.
o 8 months for dependent data
o 4 months for independent data 27
Improving LAMP CIG & VIS:
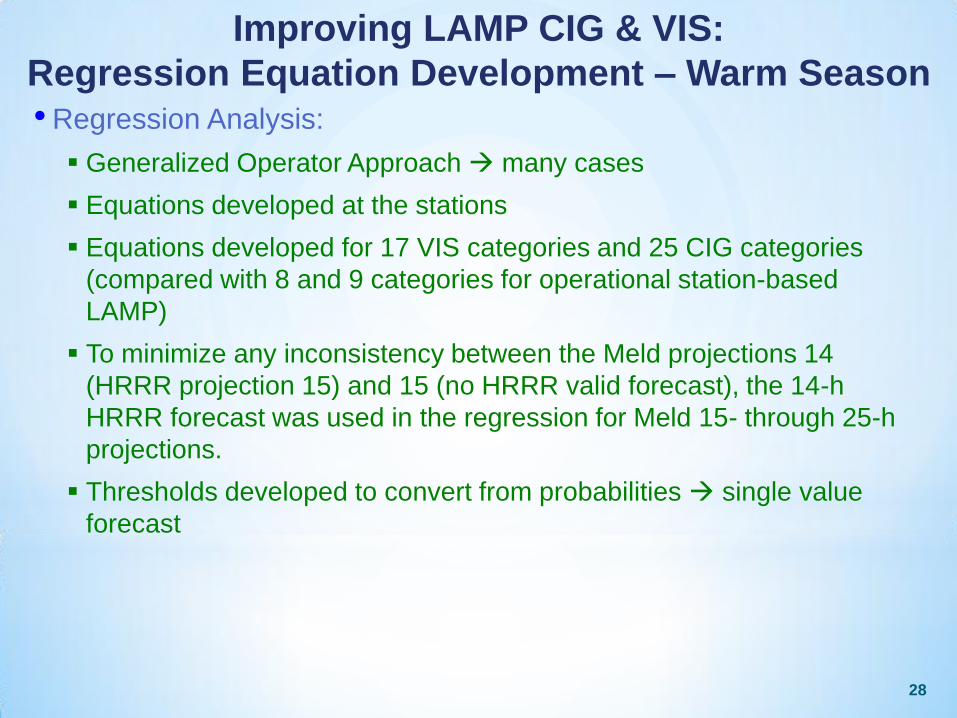
Regression Equation Development – Warm Season • Regression Analysis:
28
Generalized Operator Approach many cases
Equations developed at the stations
Equations developed for 17 VIS categories and 25 CIG categories
(compared with 8 and 9 categories for operational station-based
LAMP)
To minimize any inconsistency between the Meld projections 14
(HRRR projection 15) and 15 (no HRRR valid forecast), the 14-h
HRRR forecast was used in the regression for Meld 15- through 25-h
projections.
Thresholds developed to convert from probabilities single value
forecast
Improving LAMP CIG & VIS:
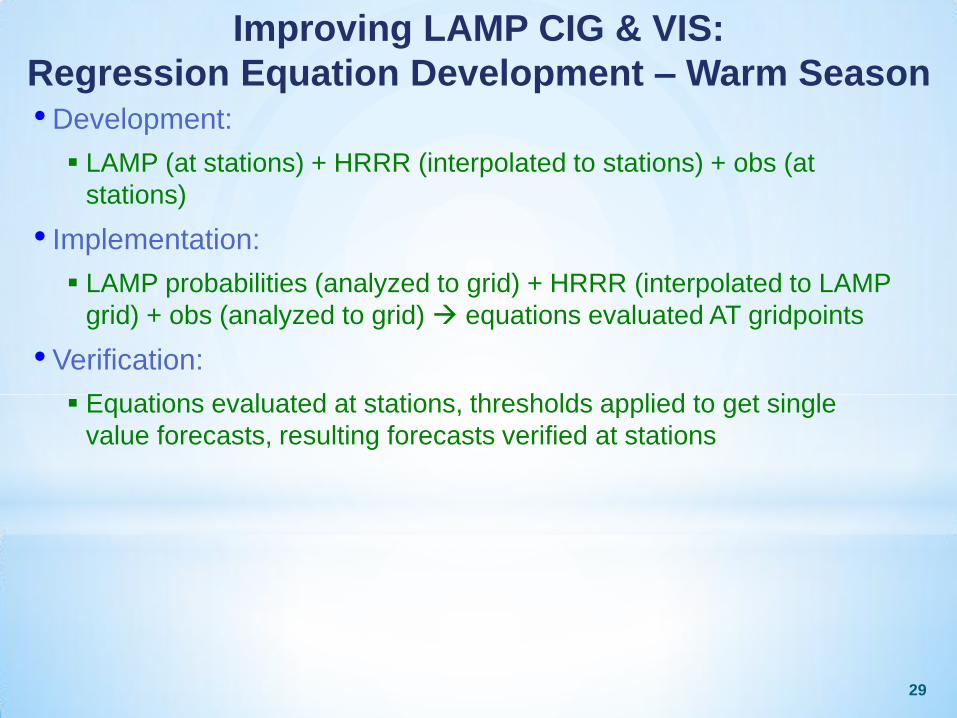
Regression Equation Development – Warm Season • Development:
29
LAMP (at stations) + HRRR (interpolated to stations) + obs (at
stations)
• Implementation:
LAMP probabilities (analyzed to grid) + HRRR (interpolated to LAMP
grid) + obs (analyzed to grid) equations evaluated AT gridpoints
• Verification:
Equations evaluated at stations, thresholds applied to get single
value forecasts, resulting forecasts verified at stations
30
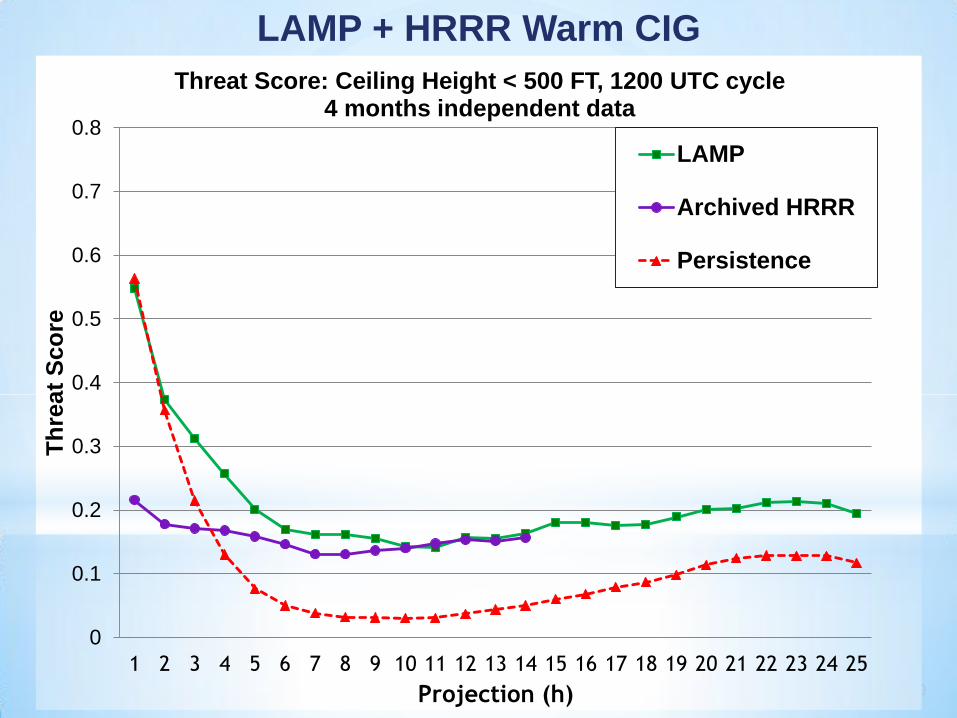
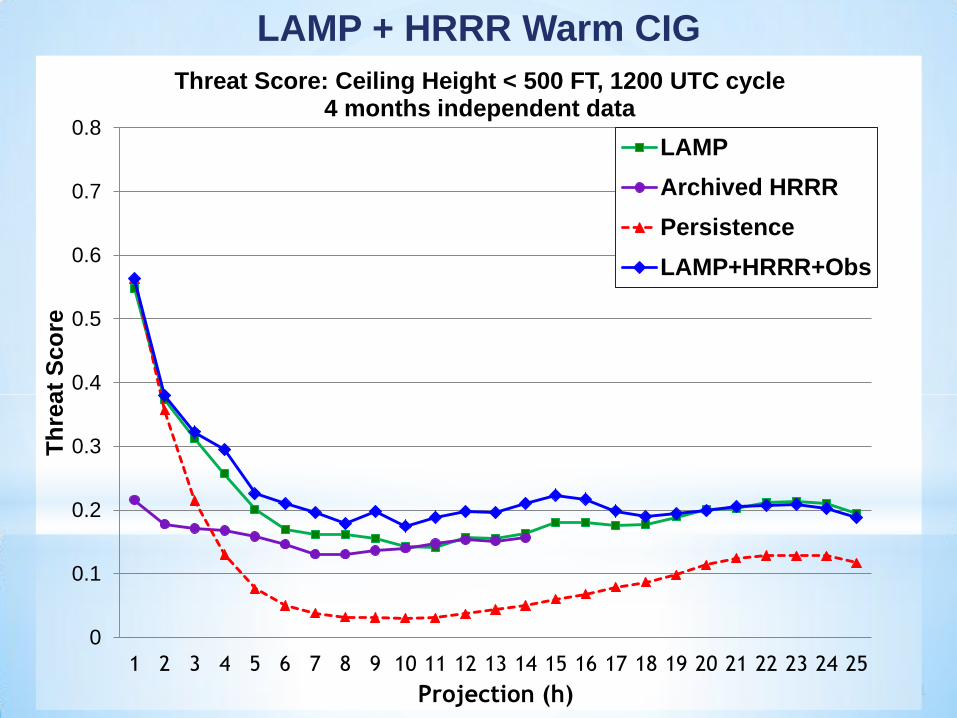
LAMP + HRRR Warm CIG
Threat Score: Ceiling Height < 500 FT, 1200 UTC cycle 4 months independent data
0.8
0.7
0
0.1
0.2
0.3
0.4
0.5
0.6
1 2 3 4 5 6 7 8 9 10 11 12 13 14 15 16 17 18 19 20 21 22 23 24 25
Th
reat
Sco
re
Projection (h)
LAMP
Archived HRRR
Persistence
31
LAMP + HRRR Warm CIG
Threat Score: Ceiling Height < 500 FT, 1200 UTC cycle 4 months independent data
0
0.1
0.2
0.3
0.4
0.5
0.6
0.7
0.8
1 2 3 4 5 6 7 8 9 10 11 12 13 14 15 16 17 18 19 20 21 22 23 24 25
Th
reat
Sco
re
Projection (h)
LAMP
Archived HRRR
Persistence
LAMP+HRRR+Obs
32
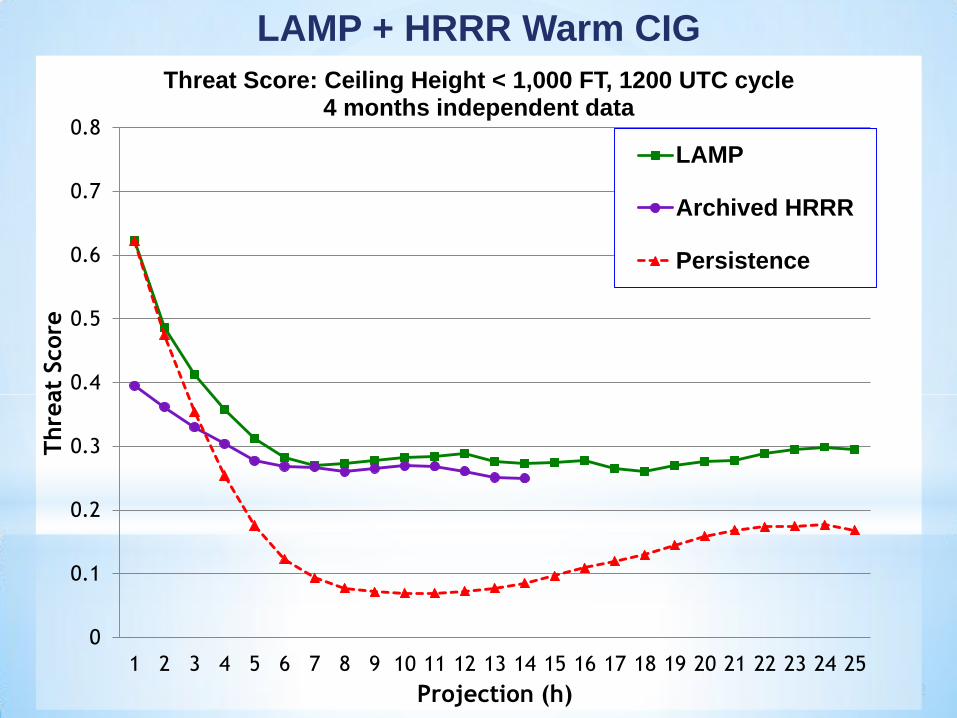
LAMP + HRRR Warm CIG
Threat Score: Ceiling Height < 1,000 FT, 1200 UTC cycle 4 months independent data
0.8
0.7
0
0.1
0.2
0.3
0.4
0.5
0.6
1 2 3 4 5 6 7 8 9 10 11 12 13 14 15 16 17 18 19 20 21 22 23 24 25
Thre
at
Score
Projection (h)
LAMP
Archived HRRR
Persistence
33
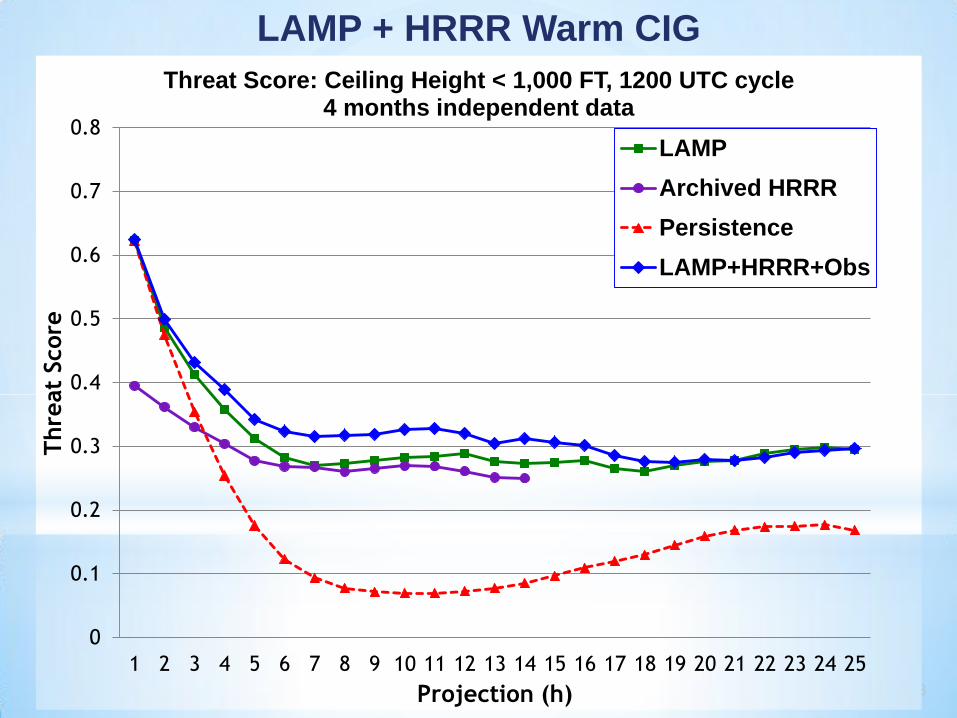
LAMP + HRRR Warm CIG
Threat Score: Ceiling Height < 1,000 FT, 1200 UTC cycle 4 months independent data
0
0.1
0.2
0.3
0.4
0.5
0.6
0.7
0.8
1 2 3 4 5 6 7 8 9 10 11 12 13 14 15 16 17 18 19 20 21 22 23 24 25
Thre
at
Score
Projection (h)
LAMP
Archived HRRR
Persistence
LAMP+HRRR+Obs
34
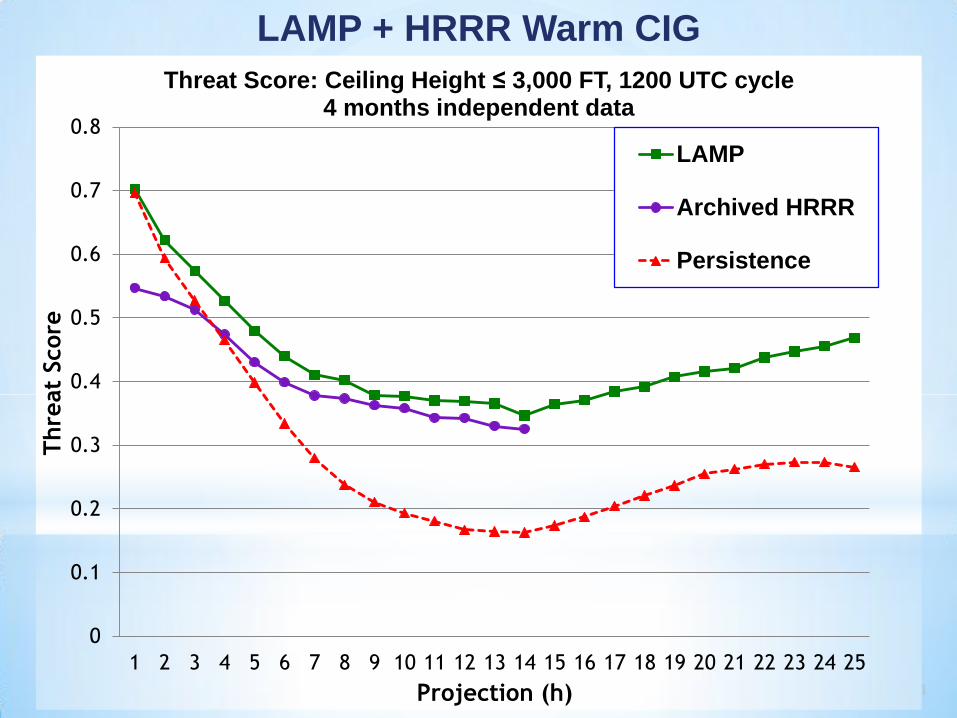
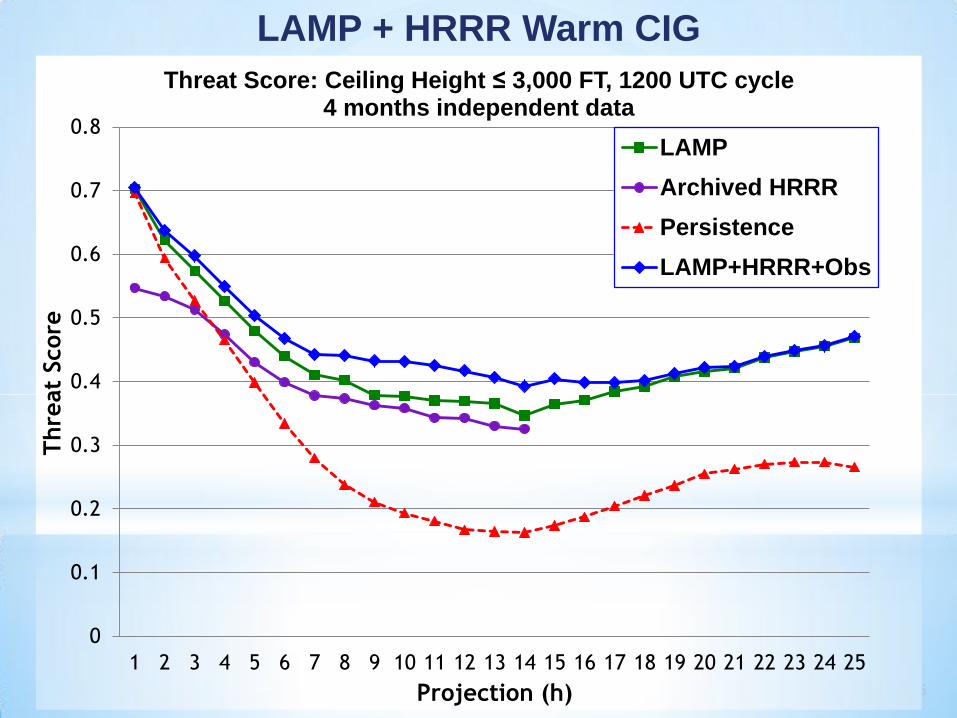
LAMP + HRRR Warm CIG
Threat Score: Ceiling Height ≤ 3,000 FT, 1200 UTC cycle 4 months independent data
0.8
0.7
0
0.1
0.2
0.3
0.4
0.5
0.6
1 2 3 4 5 6 7 8 9 10 11 12 13 14 15 16 17 18 19 20 21 22 23 24 25
Thre
at
Score
Projection (h)
LAMP
Archived HRRR
Persistence
35
LAMP + HRRR Warm CIG
Threat Score: Ceiling Height ≤ 3,000 FT, 1200 UTC cycle 4 months independent data
0
0.1
0.2
0.3
0.4
0.5
0.6
0.7
0.8
1 2 3 4 5 6 7 8 9 10 11 12 13 14 15 16 17 18 19 20 21 22 23 24 25
Thre
at
Score
Projection (h)
LAMP
Archived HRRR
Persistence
LAMP+HRRR+Obs
36
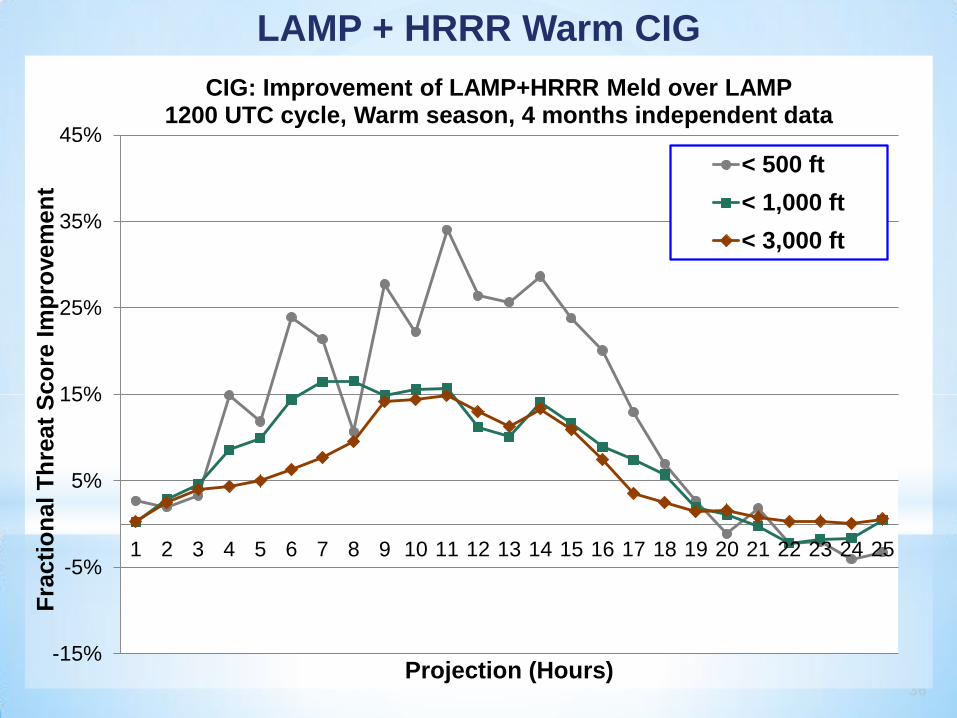
LAMP + HRRR Warm CIG
CIG: Improvement of LAMP+HRRR Meld over LAMP 1200 UTC cycle, Warm season, 4 months independent data
-15%
-5%
5%
15%
25%
35%
45%
1 2 3 4 5 6 7 8 9 10 11 12 13 14 15 16 17 18 19 20 21 22 23 24 25
Fra
cti
on
al T
hre
at
Sco
re Im
pro
vem
en
t
Projection (Hours)
< 500 ft
< 1,000 ft
< 3,000 ft
37
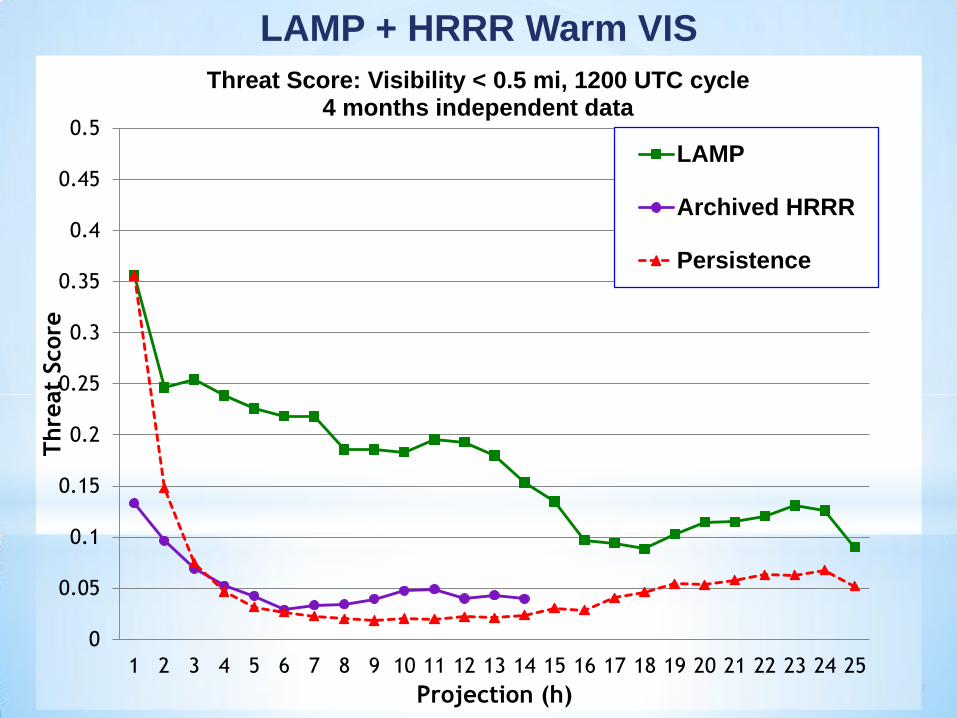
LAMP + HRRR Warm VIS
Threat Score: Visibility < 0.5 mi, 1200 UTC cycle 4 months independent data
0.5
0.45
0
0.05
0.1
0.15
0.2
0.25
0.3
0.35
0.4
1 2 3 4 5 6 7 8 9 10 11 12 13 14 15 16 17 18 19 20 21 22 23 24 25
Thre
at
Score
Projection (h)
LAMP
Archived HRRR
Persistence
38
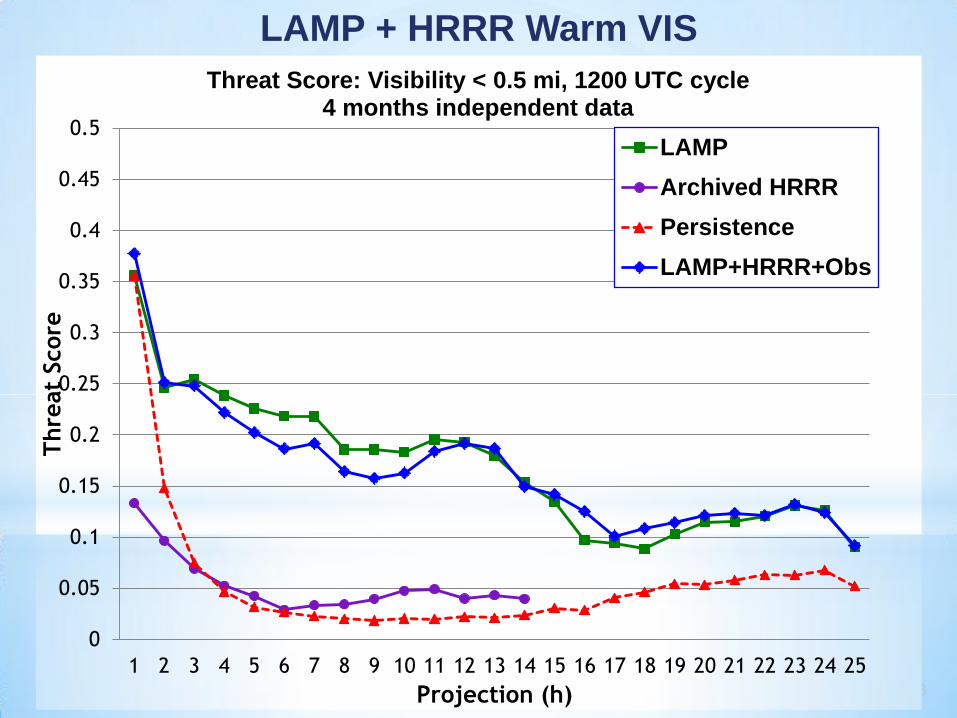
LAMP + HRRR Warm VIS
Threat Score: Visibility < 0.5 mi, 1200 UTC cycle 4 months independent data
0
0.05
0.1
0.15
0.2
0.25
0.3
0.35
0.4
0.45
0.5
1 2 3 4 5 6 7 8 9 10 11 12 13 14 15 16 17 18 19 20 21 22 23 24 25
Thre
at
Score
Projection (h)
LAMP
Archived HRRR
Persistence
LAMP+HRRR+Obs
39
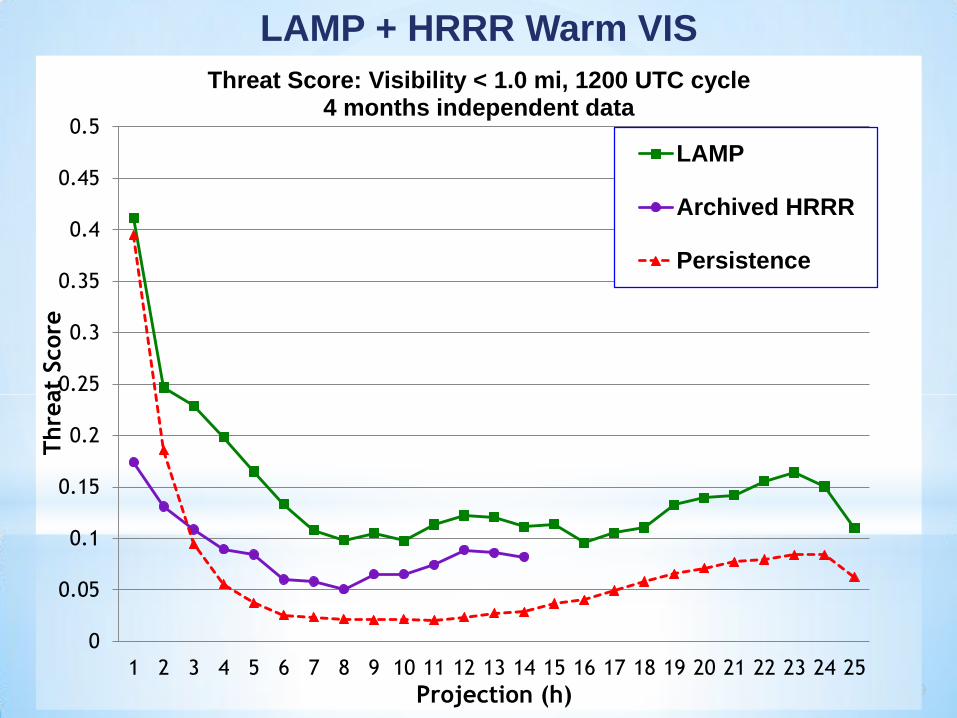
LAMP + HRRR Warm VIS
Threat Score: Visibility < 1.0 mi, 1200 UTC cycle 4 months independent data
0.5
0.45
0
0.05
0.1
0.15
0.2
0.25
0.3
0.35
0.4
1 2 3 4 5 6 7 8 9 10 11 12 13 14 15 16 17 18 19 20 21 22 23 24 25
Thre
at
Score
Projection (h)
LAMP
Archived HRRR
Persistence
40
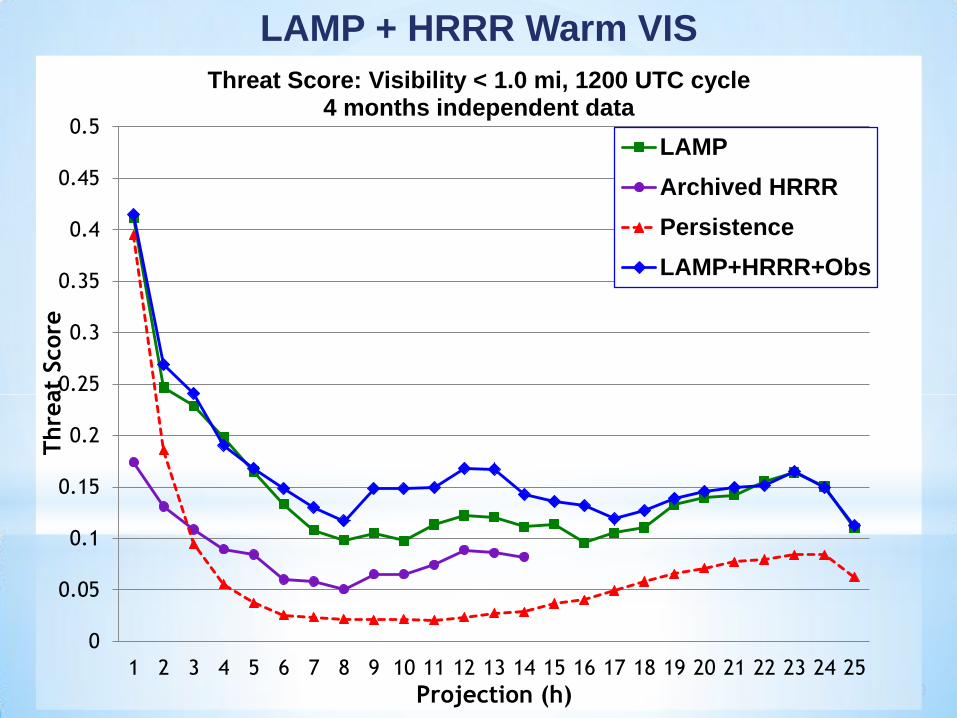
LAMP + HRRR Warm VIS
Threat Score: Visibility < 1.0 mi, 1200 UTC cycle 4 months independent data
0
0.05
0.1
0.15
0.2
0.25
0.3
0.35
0.4
0.45
0.5
1 2 3 4 5 6 7 8 9 10 11 12 13 14 15 16 17 18 19 20 21 22 23 24 25
Thre
at
Score
Projection (h)
LAMP
Archived HRRR
Persistence
LAMP+HRRR+Obs
41
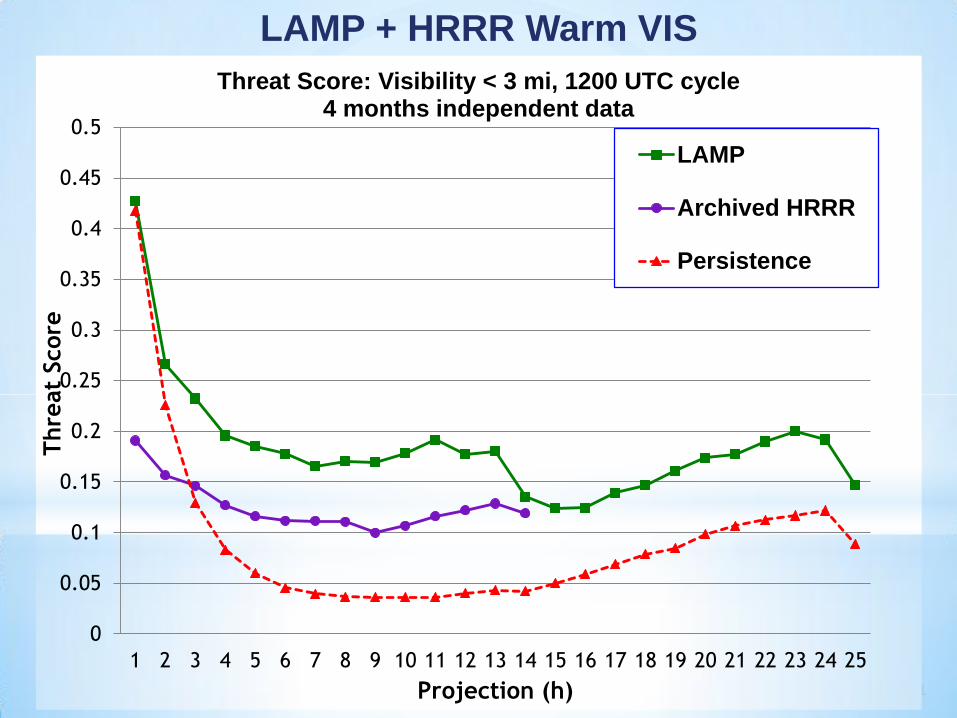
LAMP + HRRR Warm VIS
Threat Score: Visibility < 3 mi, 1200 UTC cycle 4 months independent data
0.5
0.45
0
0.05
0.1
0.15
0.2
0.25
0.3
0.35
0.4
1 2 3 4 5 6 7 8 9 10 11 12 13 14 15 16 17 18 19 20 21 22 23 24 25
Thre
at
Score
Projection (h)
LAMP
Archived HRRR
Persistence
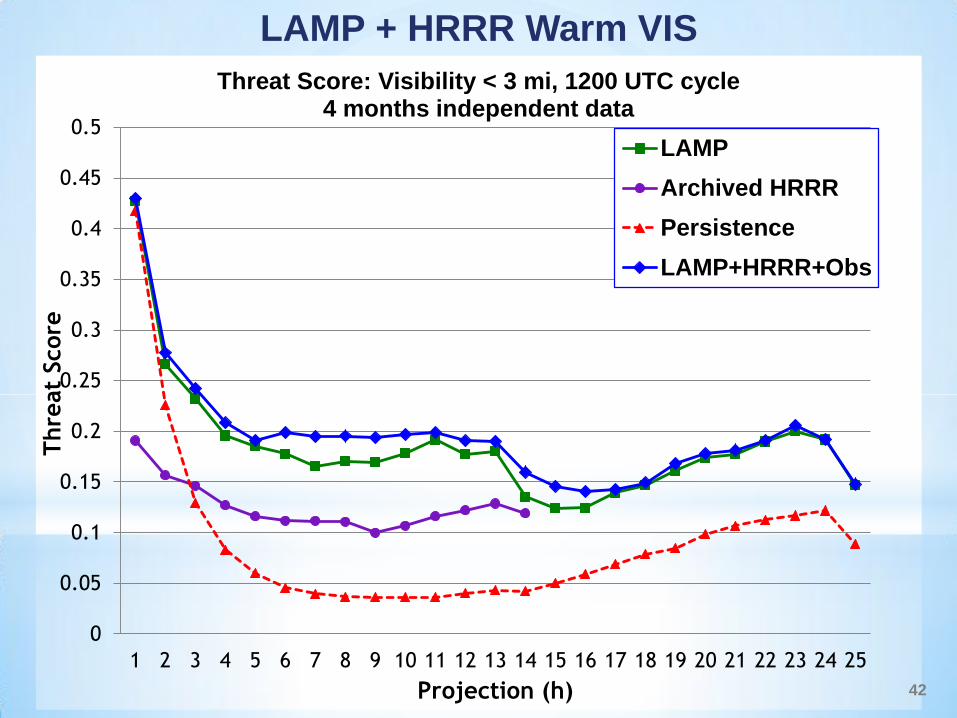
LAMP + HRRR Warm VIS
Threat Score: Visibility < 3 mi, 1200 UTC cycle 4 months independent data
0
0.05
0.1
0.15
0.2
0.25
0.3
0.35
0.4
0.45
0.5
1 2 3 4 5 6 7 8 9 10 11 12 13 14 15 16 17 18 19 20 21 22 23 24 25
Thre
at
Score
Projection (h)
LAMP
Archived HRRR
Persistence
LAMP+HRRR+Obs
42
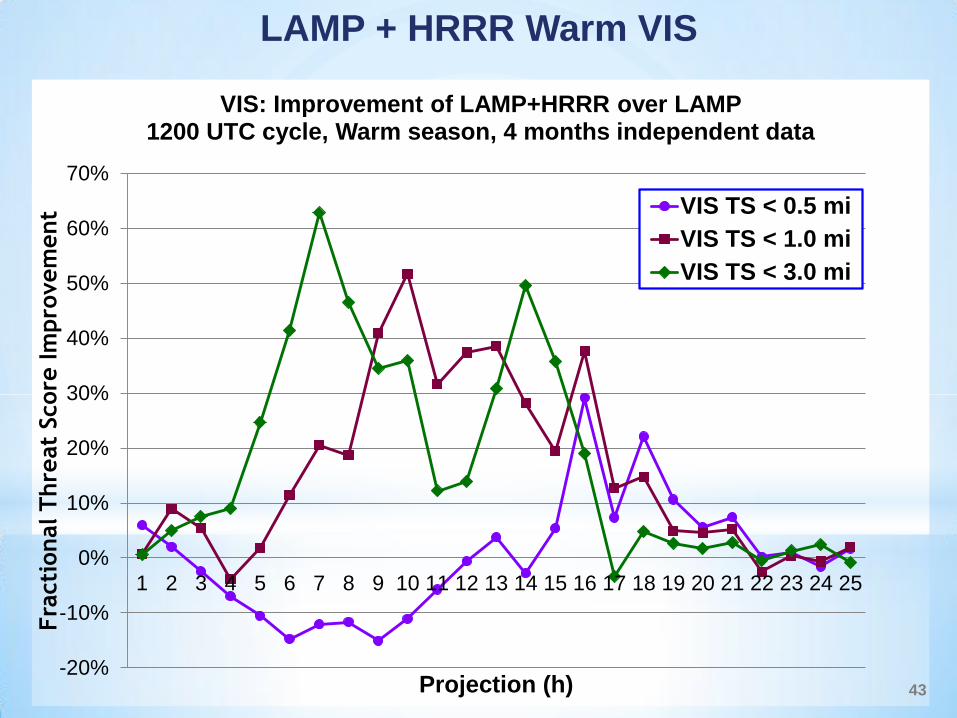
LAMP + HRRR Warm VIS
VIS: Improvement of LAMP+HRRR over LAMP 1200 UTC cycle, Warm season, 4 months independent data
-20%
-10%
0%
10%
20%
30%
40%
50%
60%
70%
1 2 3 4 5 6 7 8 9 10 11 12 13 14 15 16 17 18 19 20 21 22 23 24 25
Fra
cti
onal T
hre
at
Score
Im
pro
vem
ent
Projection (h)
VIS TS < 0.5 mi
VIS TS < 1.0 mi
VIS TS < 3.0 mi
43

44
Case Examples
45
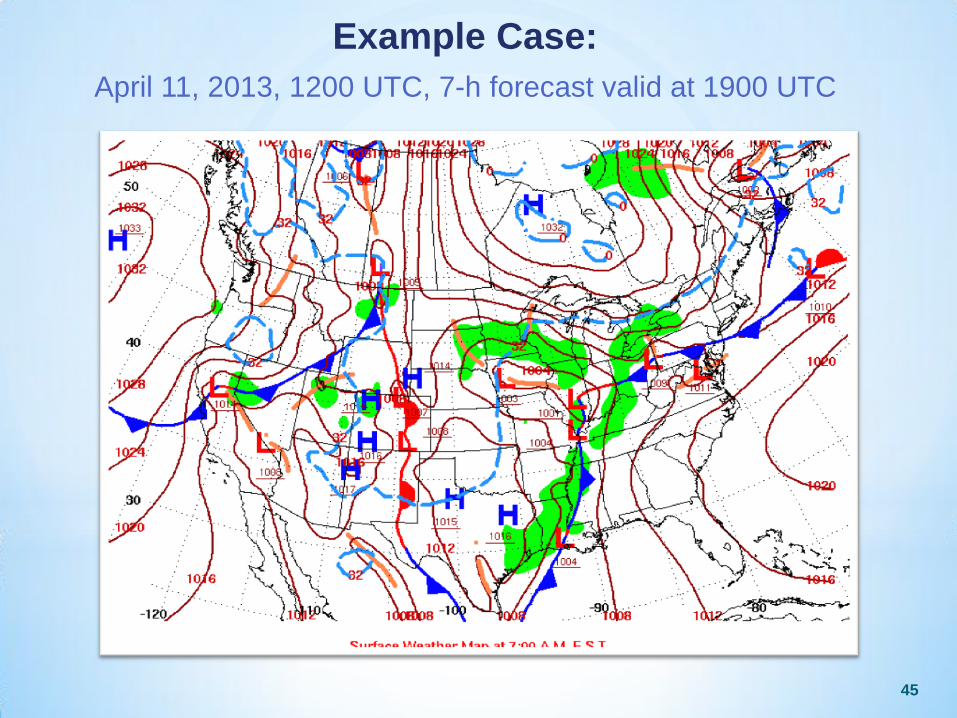
Example Case:
April 11, 2013, 1200 UTC, 7-h forecast valid at 1900 UTC
46
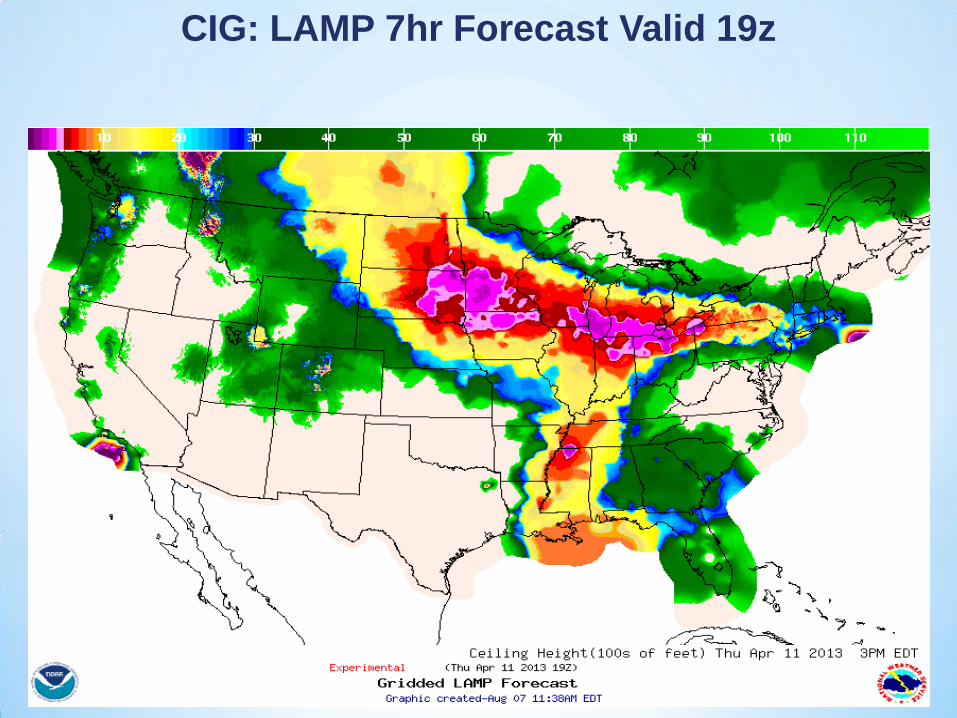
CIG: LAMP 7hr Forecast Valid 19z
47
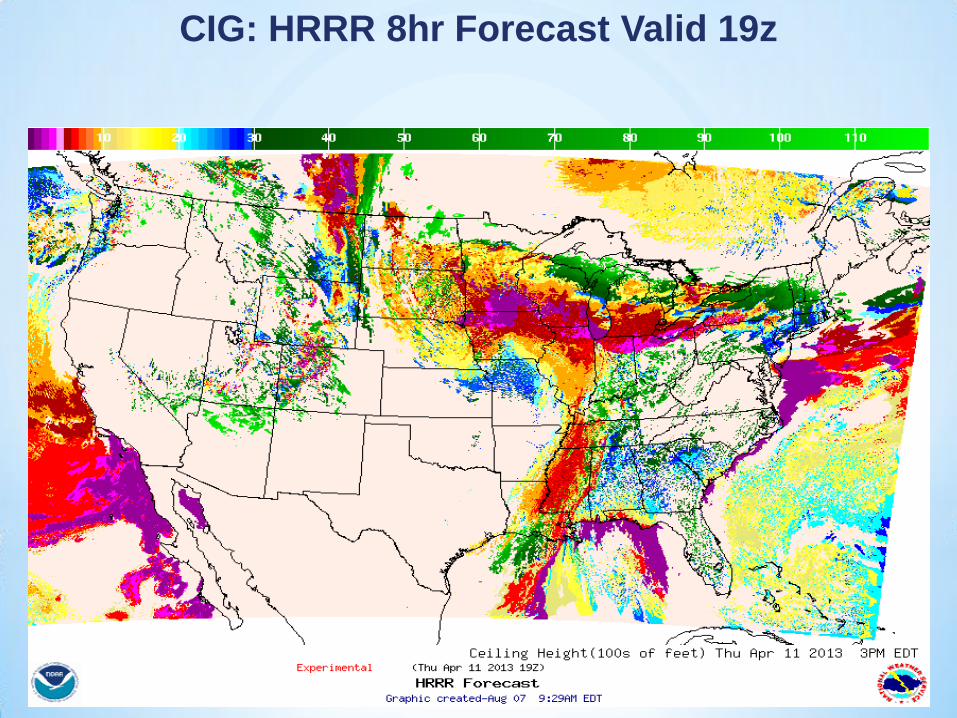
CIG: HRRR 8hr Forecast Valid 19z
48
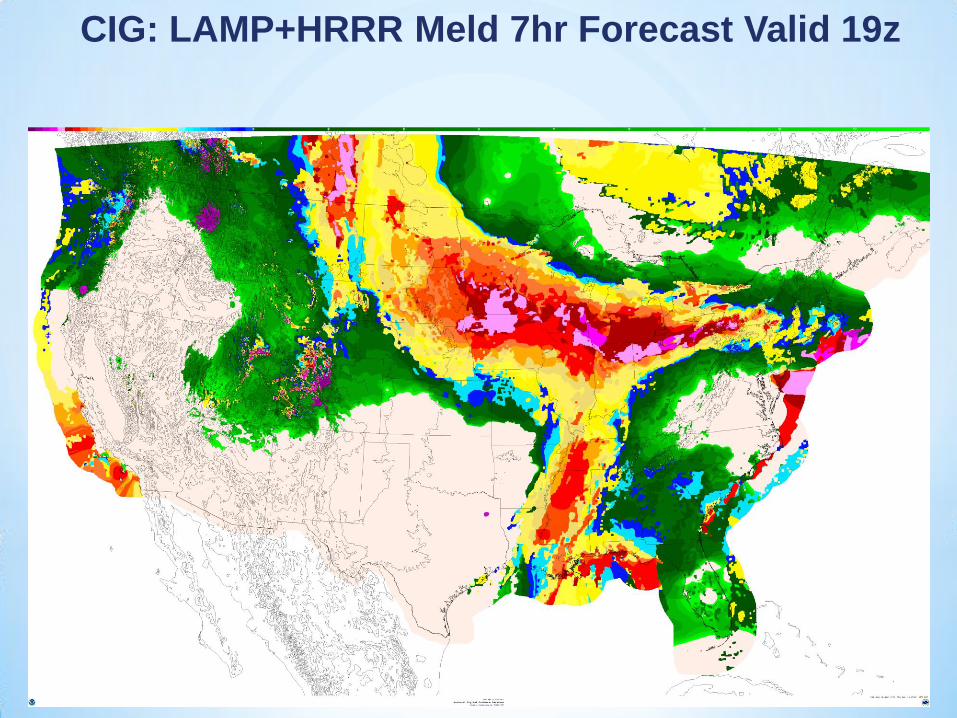
CIG: LAMP+HRRR Meld 7hr Forecast Valid 19z

49
CIG: LAMP+HRRR Meld 7hr Forecast Valid 19z Spot Remover Applied
50
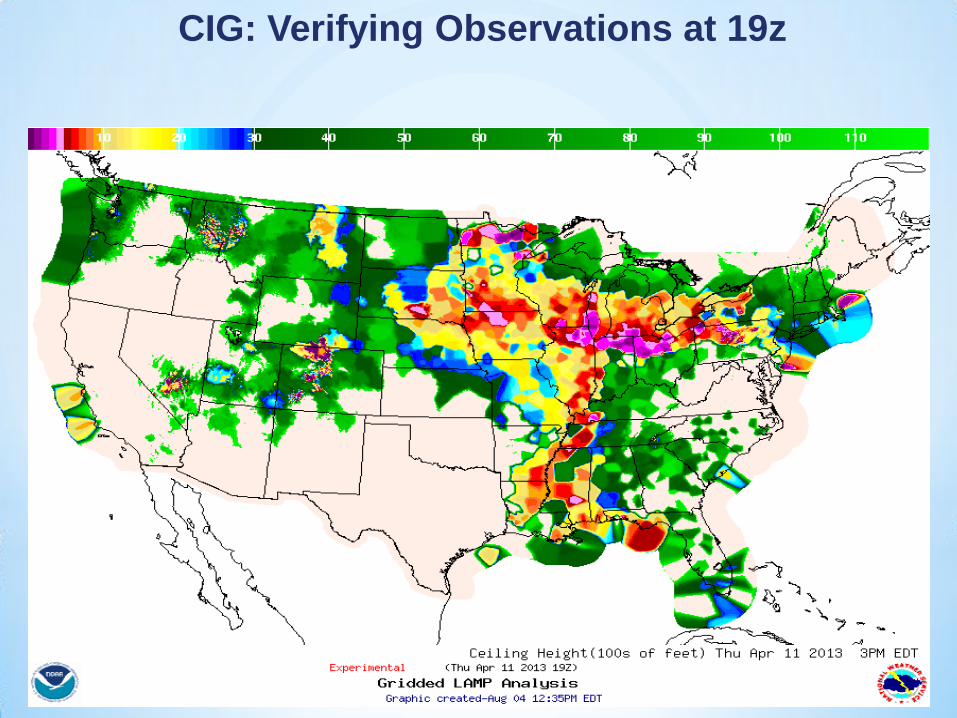
CIG: Verifying Observations at 19z
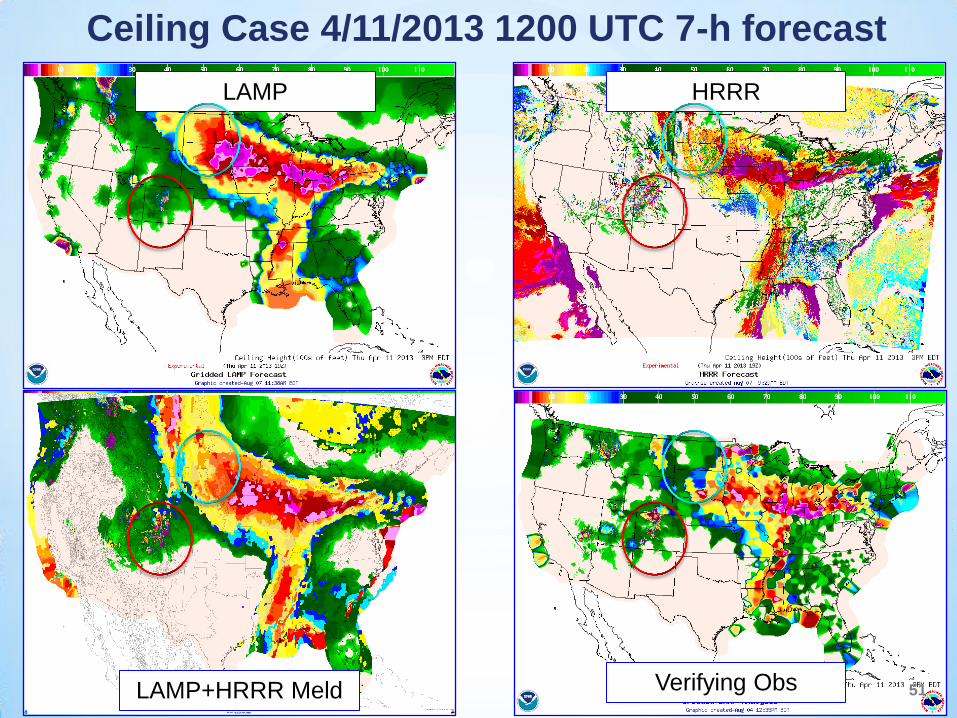
Ceiling Case 4/11/2013 1200 UTC 7-h forecast
LAMP+HRRR Meld
LAMP HRRR
Verifying Obs 51
April 11th Ceiling Case
• LAMP+HRRR Improved awareness of low ceilings
over the Colorado Rockies.
• LAMP+HRRR was less aggressive with low ceilings
over the Dakotas. While the forecasted ceilings
were still too low, it was a change in the right
direction.
• LAMP+HRRR appears to depict the extent of the low
ceilings more realistically over the water areas.
• Detail from the HRRR does show up in the
LAMP+HRRR Meld.
52
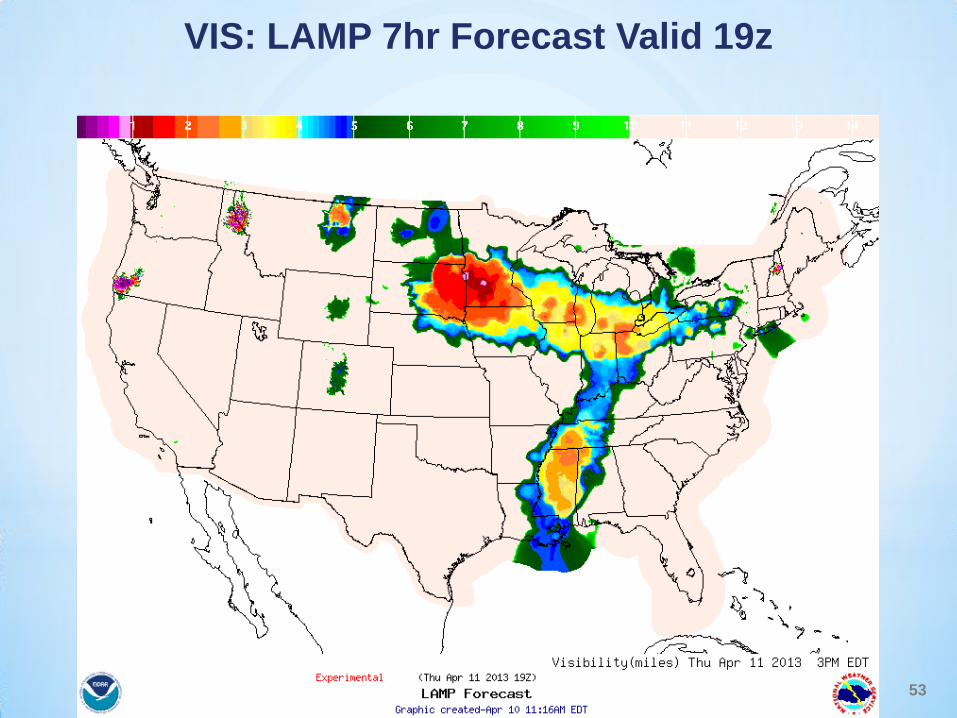
VIS: LAMP 7hr Forecast Valid 19z
53
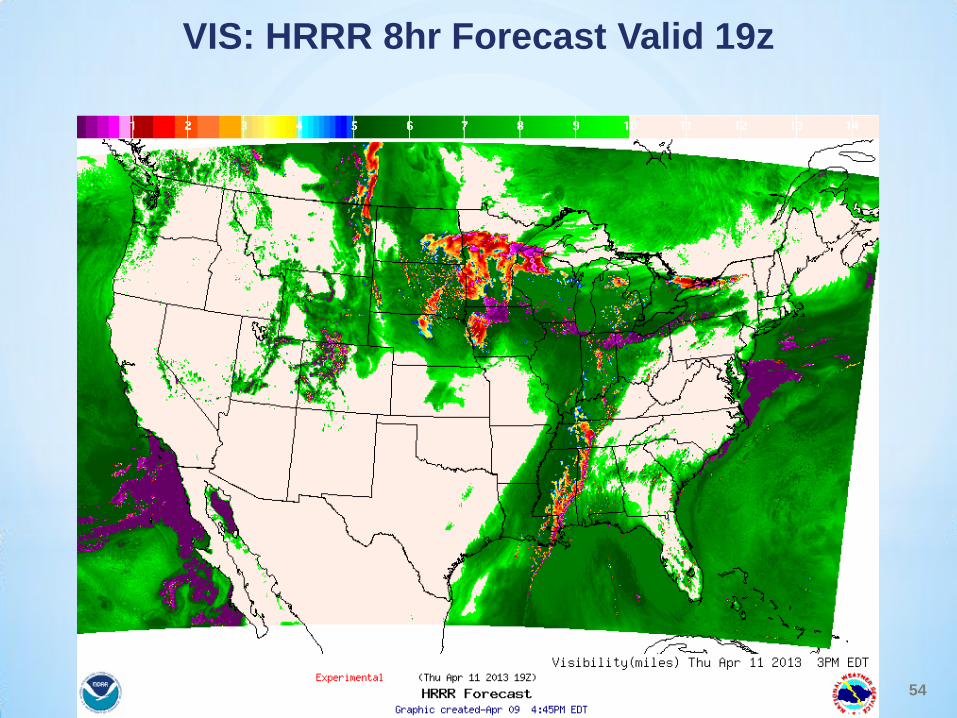
VIS: HRRR 8hr Forecast Valid 19z
54
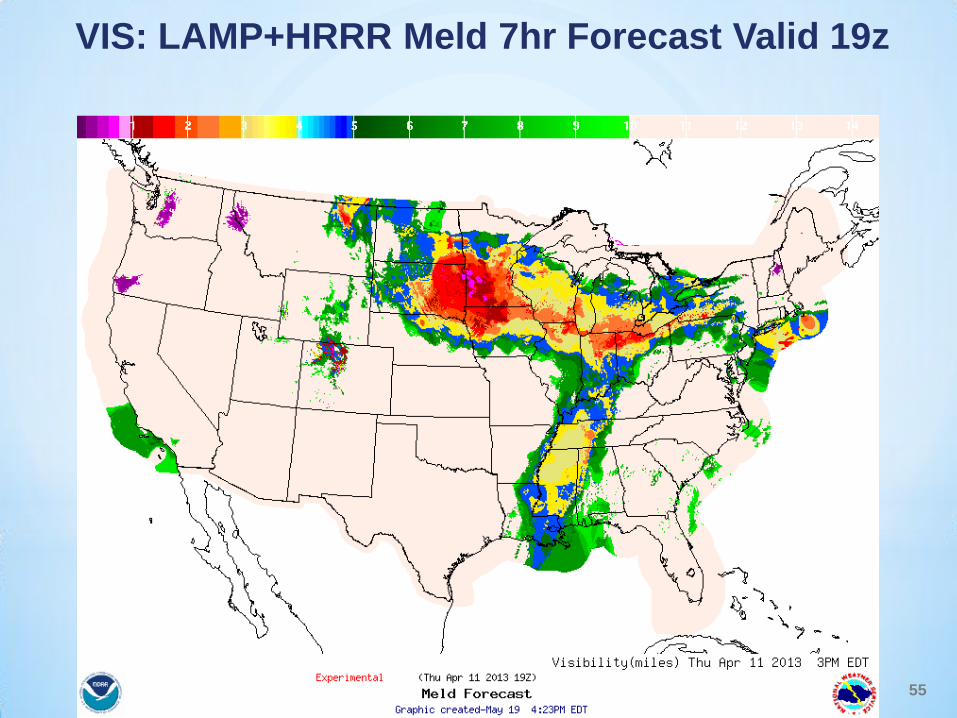
VIS: LAMP+HRRR Meld 7hr Forecast Valid 19z
55
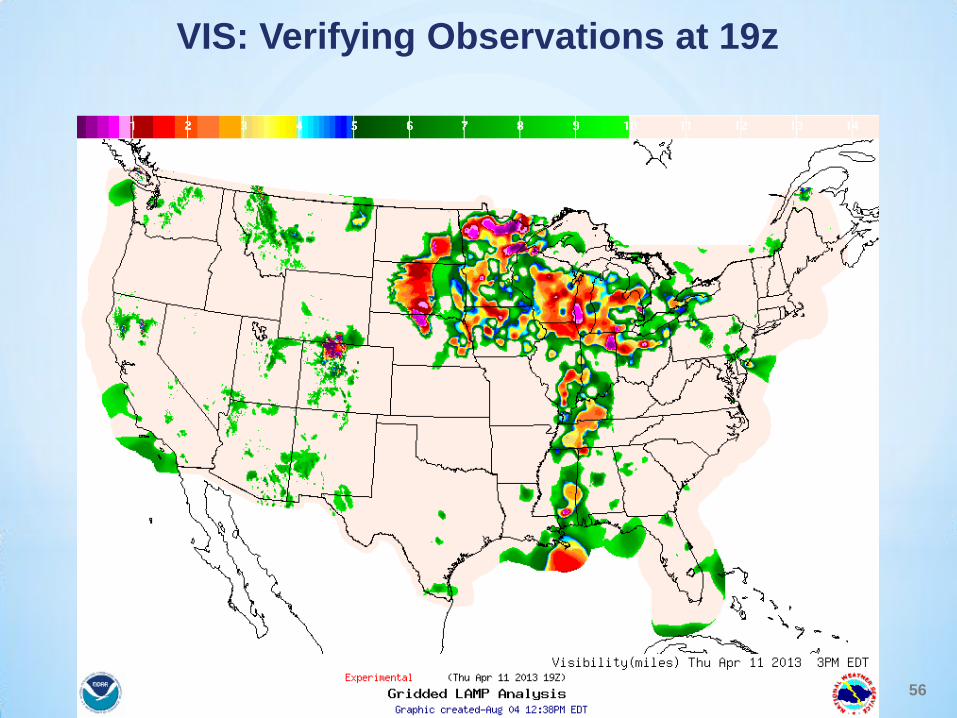
VIS: Verifying Observations at 19z
56
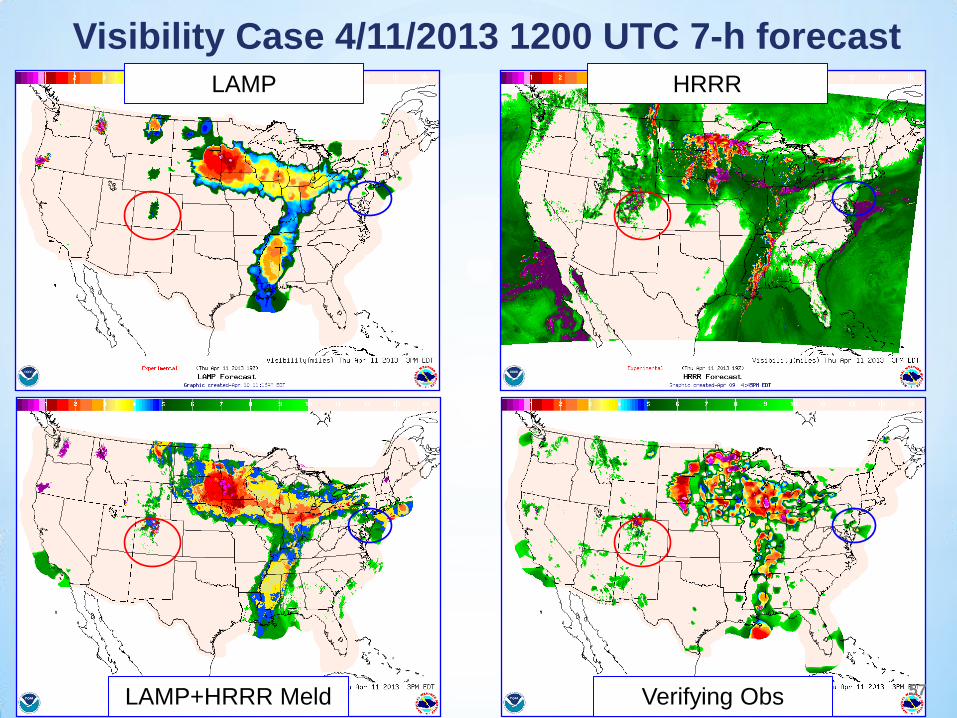
Visibility Case 4/11/2013 1200 UTC 7-h forecast
57
LAMP HRRR
LAMP+HRRR Meld Verifying Obs
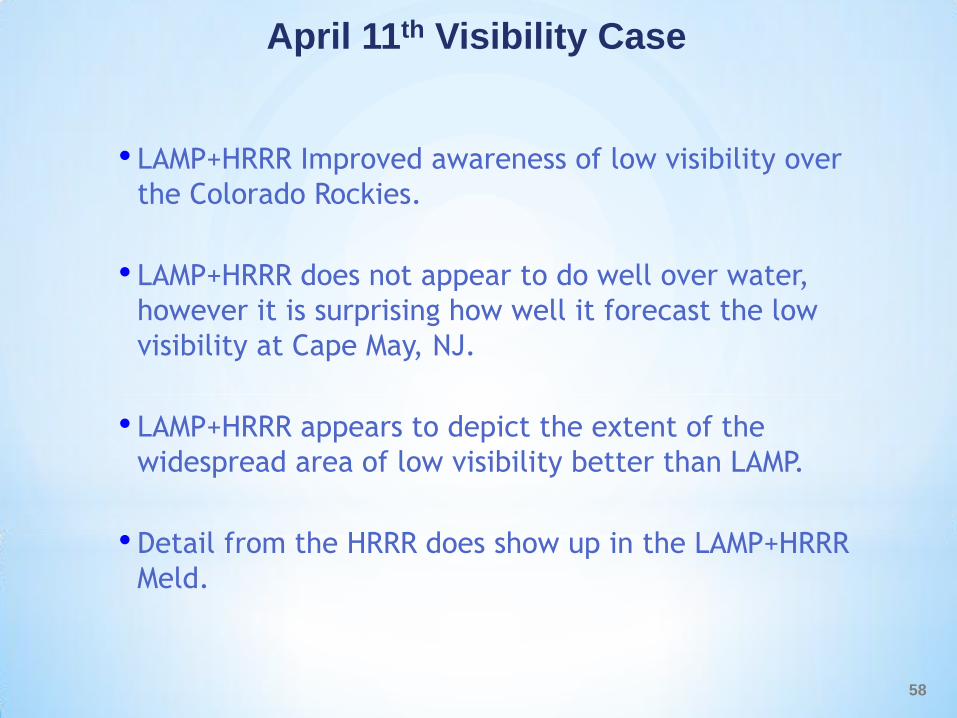
April 11th Visibility Case
• LAMP+HRRR Improved awareness of low visibility over
the Colorado Rockies.
• LAMP+HRRR does not appear to do well over water,
however it is surprising how well it forecast the low
visibility at Cape May, NJ.
• LAMP+HRRR appears to depict the extent of the
widespread area of low visibility better than LAMP.
• Detail from the HRRR does show up in the LAMP+HRRR
Meld.
58
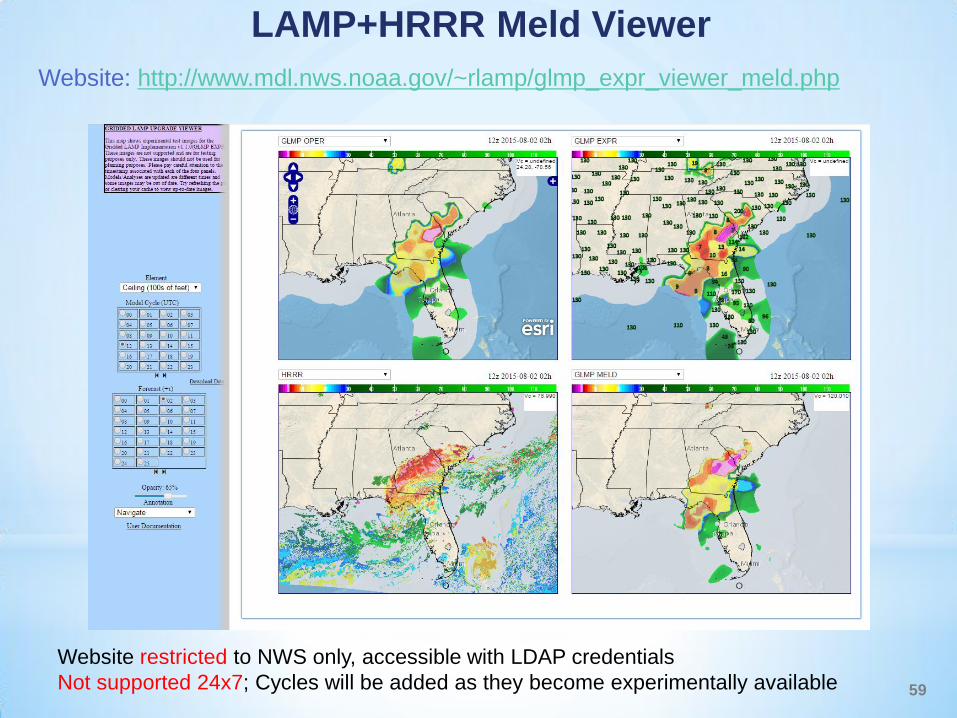
LAMP+HRRR Meld Viewer
Website: http://www.mdl.nws.noaa.gov/~rlamp/glmp_expr_viewer_meld.php
Website restricted to NWS only, accessible with LDAP credentials
Not supported 24x7; Cycles will be added as they become experimentally available 59

60
Summary
and
Future Plans
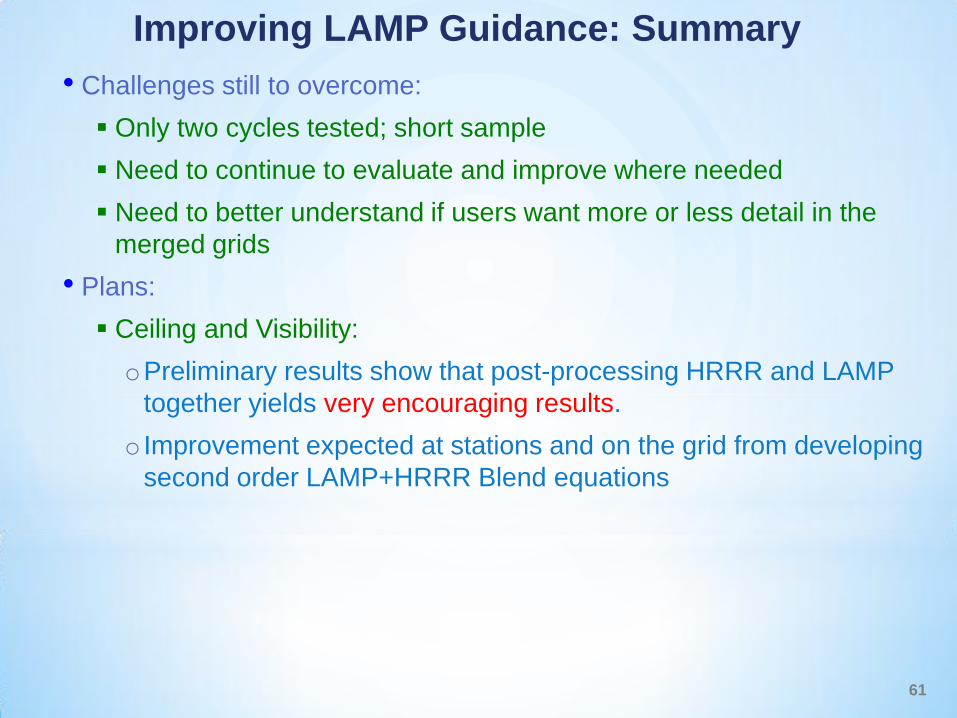
Improving LAMP Guidance: Summary
• Challenges still to overcome:
Only two cycles tested; short sample
Need to continue to evaluate and improve where needed
Need to better understand if users want more or less detail in the
merged grids
• Plans:
Ceiling and Visibility:
o Preliminary results show that post-processing HRRR and LAMP
together yields very encouraging results.
o Improvement expected at stations and on the grid from developing
second order LAMP+HRRR Blend equations
61
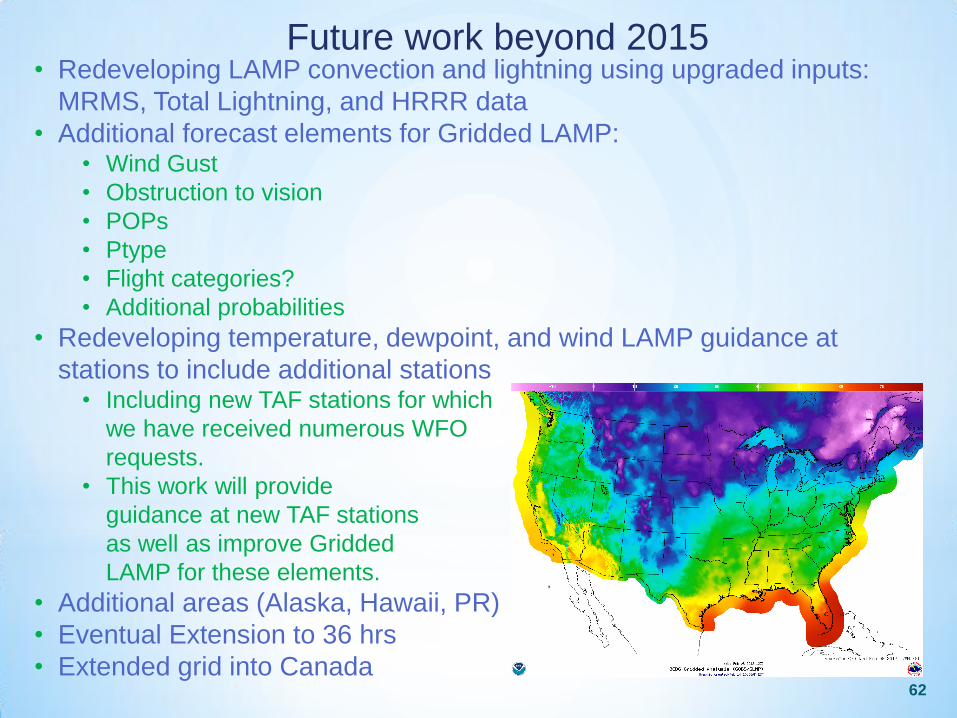
Future work beyond 2015 • Redeveloping LAMP convection and lightning using upgraded inputs:
MRMS, Total Lightning, and HRRR data
• Additional forecast elements for Gridded LAMP: • Wind Gust
• Obstruction to vision
• POPs
• Ptype
• Flight categories?
• Additional probabilities
• Redeveloping temperature, dewpoint, and wind LAMP guidance at
stations to include additional stations • Including new TAF stations for which
we have received numerous WFO
requests.
• This work will provide
guidance at new TAF stations
as well as improve Gridded
LAMP for these elements.
• Additional areas (Alaska, Hawaii, PR)
• Eventual Extension to 36 hrs
• Extended grid into Canada 62
63
Additional Resources
• MDL Office Note describing this work:
http://www.nws.noaa.gov/mdl/lamp/publications/lamp_hrrr_office_note_ON_15-1_7_31_15_final.pdf
• LAMP website: http://weather.gov/mdl/lamp
• Contacts:
Thank You!