Embed Size (px)
Citation preview

Important Clinical Studies in Stroke Rehabilitation
Robert Teasell MD FRCPC Rachel Mays
Norhayati Hussein MBBS MRehabMed
With contributions from: Norine Foley, Katherine Salter, Laura Zettler and Elizabeth Kruger
Department of Physical Medicine and Rehabilitation St. Joseph’s Health Care London
Schulich School of Medicine and Dentistry Western University
Lawson Health Research Institute London, Ontario, Canada

2
Introduction This project was designed to take the information contained in the Stroke Rehabilitation Evidence-Based Review and present it in an alternative format. Rather than review the literature, this project reviews the most important clinical studies in stroke rehabilitation. These studies were chosen because they were key studies illustrating key concepts in stroke rehabilitation.
Robert Teasell MD FRCPC This project has been funded by the Canadian Stroke Network.

3
Specialized Interdisciplinary Stroke Rehabilitation Garraway WM, Akhar AJ, Prescott RJ, Hockey L. Management of acute stroke in the elderly: preliminary results of a controlled trial. BMJ 1980; 280:1040-1043(a). Garraway WM, Akhtar AJ, Hockey L, Prescott RJ. Management of acute stroke in the elderly: follow-up of a controlled trial. BMJ 1980; 281:827-829(b). Smith ME, Garraway WM, Smith DL, Akhtar AJ. Therapy impact on functional outcome in a controlled trial of stroke rehabilitation.Arch Phys Med Rehabil 1982; 63:21-24. Indredavik B, Bakke F, Solberg R, Rokseth R, Haaheim LL, Holme I. Benefit of a stroke unit: a randomized controlled trial. Stroke 1991; 22:1026-1031. Indredavik B, Slordahl SA, Bakke F, Rokseth R, Haheim LL. Stroke unit treatment. Long-term effects.Stroke 1997; 28:1861-1866. Indredavik B, Slordahl SA, Bakke F, Rokseth R, Haheim LL. Stroke unit care improves long-term survival and function. Cardiology Review 1999; 16:24-27(a). Kalra L, Dale P, Crome P. Improving stroke rehabilitation. A controlled study. Stroke 1993; 24:1462-1467. Ronning OM, Guldvog B. Outcome of subacute stroke rehabilitation: a controlled trial. Stroke 1998; 29:779-784(b). Kalra L, Evans A, Perez I, Knapp M, Donaldson N, Swift CG. Alternative strategies for stroke care: a prospective randomised controlled trial. Lancet 2000; 356:894-899. Kalra L, Evans A, Perez I, Knapp M, Swift C, Donaldson N. A randomised controlled comparison of alternative strategies in stroke care.Health Technol Assess 2005; 9:1-94. Indredavik B, Fjaertoft H, Ekeberg G, Loge AD, Morch B. Benefit of an extended stroke unit service with early supported discharge: A randomized controlled trial. Stroke 2000; 31(12):2989-2994. Fjaertoft H, Indredavik B, Lydersen S. Stroke unit care combined with early supported discharge: long-term follow-up of a randomized controlled trial. Stroke 2003; 34(11):2687-91.
Foley N, Slater K, Teasell R. Specialized stroke services: A meta-analysis comparing three models of care. Cerebrovascular Diseases 2007; 23(2-3):194-202.

4
Specialized Interdisciplinary Stroke Rehabilitation
Garraway WM, Akhar AJ, Prescott RJ, Hockey L. Management of acute stroke in the elderly: preliminary results of a controlled trial. BMJ 1980; 280:1040-1043(a). Garraway WM, Akhtar AJ, Hockey L, Prescott RJ. Management of acute stroke in the elderly: follow-up of a controlled trial. BMJ 1980; 281:827-829(b). Smith ME, Garraway WM, Smith DL, Akhtar AJ. Therapy impact on functional outcome in a controlled trial of stroke rehabilitation. Arch Phys Med Rehabil 1982; 63:21-24.
Author / Year Country PEDro score
Methods Outcome
Garraway et al. 1980 (a) and Smith et al. 1982 UK 5 (RCT)
311 consecutive patients with moderate to severe strokes, admitted within 7 days of onset of symptoms were randomized to receive treatment on either a stroke unit or one of 12 medical units on call for emergency admissions.
A greater proportion of stroke unit patients were classified as independent when compared to medical unit patients, 50% vs. 32% at 60 days. When comparing only survivors, the proportion of independent patients rose to 62%. Agreater proportion of stroke unit patients were referred for physical and occupational therapy. There were shorter delays between admission and start of therapy.
Garraway et al. 1980 (b) UK 5 (RCT)
Follow up study of 192 stroke patients from “a” study.
At one year, there were no longer significant differences in the proportion of patients who were classified as independent. 55% of stroke unit patients and 52% of medical ward patients were assessed as independent.
Garraway et al. 1980 (a)
Patient Outcomes at the End of an Acute Phase of Rehabilitation
p<.01 Stroke unit has a greater percentage of patients who were independent and less who were dependent or dead when compared to the medical unit.
49
60
43
Medical Unit
Independent Dependent Dead
78
47
30
Stroke Unit
Independent Dependent Dead

5
Patients on medical unit were less likely to receive physiotherapy or occupational therapy when compared to the stroke unit.
Garraway et al. 1980 (b)
A greater proportion of stroke unit patients were classified as independent when compared to medical unit patients. At one year, there were no longer significant differences in the proportion of patients who were classified as independent.
Occurance of Physiotherapy and Occupational Therapy:
Stroke Unit vs. Medical Unit
** *
0
20
40
60
80
100
120
PT OT
*Non-significant; all other comparisons p<0.05
Perc
en
tag
e o
f P
ati
en
ts (
%)
MU Remained in
Admitting hosiptal
MU Transferred for
Rehabilitation
SU
PT=physiotherapy; OT=occupational therapy; SU=stroke unit; MU=medical
Independent Dependent Independent Dependent
At discharge At Follow-up
Medical Unit 46 45 52 39
Stroke Unit 67 34 56 45
0
10
20
30
40
50
60
70
Nu
mb
er
of
Pati
en
ts
Functional Outcome at Time of Hospital Discharge and at Follow-up

6
Smith et al. 1982
Less patients require no assistance in carrying out ADL activities on discharge from the stroke unit when compared to the medical unit.
p< .05
0
10
20
30
40
50
60
70
Needed no Assistance
Pe
rce
nta
ge
of
Pa
tie
nts
(%
)
Percentage of Patients Needing no Assistance in Carrying out the 7 ADL:
Stroke Unit vs. Medical Unit
Stroke Unit Medical Unit
Study name Outcome Statistics for each study Odds ratio and 95% CI
Odds Lower Upper
ratio limit limit Z-Value p-Value
Garraway et al., 1980 Dead 0.608 0.357 1.036 -1.830 0.067
Garraway et al., 1980 Dependant 0.667 0.416 1.070 -1.679 0.093
Garraway et al., 1980 Independant 2.129 1.340 3.385 3.196 0.001
0.996 0.752 1.319 -0.027 0.978
0.1 0.2 0.5 1 2 5 10
Favours A Favours B
Garraway et al., 1980a
Meta Analysis

7
Importance: This was the first study to demonstrate the benefit of stroke units over standard medical care.
Study name Subgroup within study Outcome Statistics for each study Odds ratio and 95% CI
Odds Lower Upper ratio limit limit Z-Value p-Value
Garraway et al., 1980 Primary Outcome Dead 0.608 0.357 1.036 -1.830 0.067
Garraway et al., 1980 Primary Outcome Dependant 0.667 0.416 1.070 -1.679 0.093
Garraway et al., 1980 Primary Outcome Independant 2.129 1.340 3.385 3.196 0.001
0.996 0.752 1.319 -0.027 0.978
0.1 0.2 0.5 1 2 5 10
Favours A Favours B
Garraway et al., 1980
Meta Analysis

8
Specialized Interdisciplinary Stroke Rehabilitation
Indredavik B, Bakke F, Solberg R, Rokseth R, Haaheim LL, Holme I. Benefit of a stroke unit: a randomized controlled trial. Stroke 1991; 22:1026-1031. Indredavik B, Slordahl SA, Bakke F, Rokseth R, Haheim LL. Stroke unit treatment. Long-term effects.Stroke 1997; 28:1861-1866. Indredavik B, Slordahl SA, Bakke F, Rokseth R, Haheim LL. Stroke unit care improves long-term survival and function. Cardiology Review 1999; 16:24-27(a).
Author / Yr Country PEDro score
Methods Outcome
Indredavik et al. 1991 Norway 7 (Single-blind RCT)
220 acute (within 7 days) stroke patients randomized to either a combined acute/rehabilitation stroke unit or a general medical unit
Patients who were treated on the combined stroke unit were more likely to have been discharged home, were less likely to have been institutionalized and were more likely to have higher Barthel Index scores at both 6 weeks and 1 year. The 6-week mortality rate was lower for patients treated on the combined stroke unit.
Indredavik et al. 1997 Norway 7 (RCT)
5-year follow-up study of 220 stroke patients examining long-term survival and functional state of stroke initially randomized to either a combined acute/rehabilitation stroke unit or a general medical unit.
5 years following stroke, a greater proportion of patients originally treated on the stroke unit were alive, residing at home with higher Barthel Index scores when compared to patients treated on the general medical unit.
Indredavik et al. 1999 (a) Norway 7 (RCT)
220 unselected hospitalized stroke patients randomized to receive care on either a stroke unit or a general medical ward. 10-year follow-up study of Indredavik et al. 1991.
At 10-years post stroke, a greater proportion of patients initially treated on the stroke unit were alive (25 vs. 13%), residing in their homes (20 vs 8%) and had Barthel
Index scores 60 (20 vs 8%) compared to patients treated on a general medical ward.
p=.0004 p=.02
p=.027
p=.002
p=.016 NS p=.06
NS
p=.041
01020304050607080
Home Institution Dead Home Institution Dead Home Institution Dead
After 6 wks. After 52 wks. After 5 yrs.
Perc
en
tag
e o
f P
ati
en
ts (
%)
Functional Status for Patients Treated on a Stroke vs. a Medical Unit at 6 weeks, 52 weeks and 5 years
Stroke Unit Medical Unit
9
Patients treated on the stroke unit were more likely to be discharged home at 6 weeks, 52 weeks and 5 years; more likely to not be institutionalized at 6 weeks and more likely to not be dead at 6 weeks and one year.
Importance: This study showed the benefits of stroke units could be determined by 6 weeks and that benefit continued through for 10 years after the study.
Study name Subgroup within study Outcome Statistics for each study Odds ratio and 95% CI
Odds Lower Upper
ratio limit limit Z-Value p-Value
Indredavik 1990 52 weeks At home 2.139 1.222 3.744 2.661 0.008
Indredavik 1990 52 weeks Dead 0.699 0.379 1.288 -1.150 0.250
Indredavik 1990 52 weeks In Institution 0.426 0.195 0.927 -2.150 0.032
Indredavik 1990 6 weeks At home 2.810 1.596 4.947 3.581 0.000
Indredavik 1990 6 weeks Dead 0.377 0.149 0.953 -2.062 0.039
Indredavik 1990 6 weeks In Institution 0.520 0.296 0.913 -2.278 0.023
Indredavik 1990 BI General medical wards 1.063 0.364 3.106 0.112 0.911
Indredavik 1990 BI Stroke unit 1.039 0.380 2.841 0.075 0.940
Indredavik 1990 Neurological score General medical wards 1.038 0.394 2.731 0.075 0.940
Indredavik 1990 Neurological score Stroke unit 1.053 0.385 2.877 0.100 0.920
1.014 0.806 1.277 0.122 0.903
0.1 0.2 0.5 1 2 5 10
Favours A Favours B
Indredavik et al., 1991
Meta Analysis

10
Specialized Interdisciplinary Stroke Rehabilitation
Kalra L, Dale P, Crome P. Improving stroke rehabilitation. A controlled study. Stroke 1993; 24:1462-1467.
Author / Year Country PEDro score
Methods Outcome
Kalra et al. 1993 UK 5 (RCT)
245 stroke patients randomized at 2 weeks post stroke to a rehabilitation unit or a general medical unit after stratification by stroke severity.
Patients with a poor prognosis treated on a general medical ward had higher mortality rates and longer hospital stays. Patients in the stroke rehab unit with stroke of intermediate severity had better discharge Barthel Index scores and shorter hospital stays.
Stroke patients admitted to a stroke unit had a shorter length of stay than patients admitted to a medical unit and the difference was greater for severe than moderate stroke patients.
0
20
40
60
80
100
120
140
StrokeUnit
MedicalUnit
StrokeUnit
MedicalUnit
Intermediate Poor
p<.001
48.7
104.6
p<.001
52.3
123.2
Ave
rag
e L
en
gth
of
Sta
y (
da
ys
)
Prognosis
Length of Stay for Different Stroke Severities in Patients Treated on a
Stroke vs. a Medical Unit

11
Importance: This RCT showed that patients in subacute stroke units had better outcomes with regard to mortality, average length of stay and discharge Barthel Index scores.
Study name Subgroup within study Outcome Statistics for each study Std diff in means and 95% CI
Std diff Standard Lower Upper in means error Variance limit limit Z-Value p-Value
Kalra et al., 1993 Prognostic Score <3 Discharge home 0.606 0.911 0.830 -1.180 2.391 0.665 0.506
Kalra et al., 1993 Prognostic Score <3 Length of stay 0.251 0.253 0.064 -0.245 0.747 0.993 0.321
Kalra et al., 1993 Prognostic Score <3 Long-term care -0.606 0.911 0.830 -2.391 1.180 -0.665 0.506
Kalra et al., 1993 Prognostic Score >5 Discharge BADL > 11 0.636 0.919 0.844 -1.165 2.437 0.692 0.489
Kalra et al., 1993 Prognostic Score >5 Discharge home 0.675 0.666 0.443 -0.630 1.980 1.013 0.311
Kalra et al., 1993 Prognostic Score >5 Length of stay 0.000 0.166 0.027 -0.325 0.325 0.000 1.000
Kalra et al., 1993 Prognostic Score >5 Long-term care 0.404 0.391 0.153 -0.362 1.169 1.034 0.301
Kalra et al., 1993 Prognostic Score >5 Mortality -0.631 0.383 0.147 -1.383 0.120 -1.646 0.100
Kalra et al., 1993 Prognostic Score 3-5 Discharge BADL > 11 0.607 0.211 0.044 0.194 1.020 2.881 0.004
Kalra et al., 1993 Prognostic Score 3-5 Discharge home 0.549 0.196 0.039 0.164 0.934 2.797 0.005
Kalra et al., 1993 Prognostic Score 3-5 Length of stay 1.924 0.403 0.163 1.134 2.714 4.773 0.000
Kalra et al., 1993 Prognostic Score 3-5 Long-term care -0.536 0.201 0.041 -0.931 -0.142 -2.663 0.008
Kalra et al., 1993 Prognostic Score 3-5 Mortality -0.263 0.512 0.262 -1.266 0.740 -0.513 0.608
0.195 0.080 0.006 0.037 0.353 2.420 0.016
-4.00 -2.00 0.00 2.00 4.00
Favours A Favours B
Kalra et al., 1993
Meta Analysis

12
Specialized Interdisciplinary Stroke Rehabilitation
Ronning OM, Guldvog B. Outcome of subacute stroke rehabilitation: a controlled trial. Stroke 1998; 29:779-784(b).
Author / Yr Country PEDro score
Methods Outcome
Ronning and Guldvog 1998 (b) Norway 6 (Quasi RCT)
251 stroke patients randomized to sub-acute rehabilitation in a hospital-based stroke rehabilitation program or to a community-based program (nursing home 40%, outpatient rehabilitation 30% and no rehabilitation 30%) and followed for 7 months.
Greater proportion of community-based rehab patients dependent or dead compared to hospital rehabilitation patients. No difference in survival at 7 months. Patients with moderate or severe stroke, treated in a hospital-based program, had higher median Barthel Index scores at 7 months (90 vs. 73) and lesser combined dependency and death (23 vs. 38%).
Patients in the stroke rehabilitation unit were less likely to be dead or dependent at 7 months post stroke when compared to patients in the ad hoc community group.
0 20 40 60 80 100
Dependent or Dead
Survival Rate
Dependency in ADL
p=.01
p=.11
p=.07
Percentage of Patients (%)
Outcomes 7 months Post-Stroke for Patients Treated in an Adhoc
Community vs. a Hospital Group
Municipal Group Hospital Group

13
More severe stroke patients (admission Barthel Index score <50) were more likely to be dead or dependent in the ad hoc community group when compared to the stroke rehabilitation group. There was no difference for the less severe stroke patients (admission Barthel Index score >50)
At 7 months the median Barthel Index score was significantly better for patients admitted to stroke rehabilitation unit with a Barthel Index score <50 when compared to a similar population in the ad hoc community group.
p=.002
p=.17
p=.35
p=.02
0 10 20 30 40 50 60 70
Dead or Dependent
Long-term Care
Dead or Dependent
Long-term Care
BI
Score
<50
BI
Score
>50
Percentage of Patients (%)
Outcomes According to the Prognostic Groups
Community-basedRehabilitation
HospitalRehabilitation
0
50
100
Median BI Median SSS
p=.005 p=.026
Valu
es
Outcome Measures for Patients (BI Score <50) treated at a Hospital vs. Community-
Rehabilitation Centre
Hospital Rehabilitation Community-based Rehabilitation

14
Importance: This RCT is the only study that compared organized stroke rehabilitation care to ad hoc treatment in the community, the closest thing to a non-treatment control.The benefits of stroke rehabilitation for more severe strokes was quite dramatic with a 48% reduction in death and dependency in the treatment group.
Study name Subgroup within study Outcome Statistics for each study Odds ratio and 95% CI
Odds Upper Lower ratio limit Z-Value p-Value limit
Ronning and Guldvog 1998 Due to Prognostic Group (BI Score <50) BI dependant (BI<75) 0.268 0.682 -2.765 0.006 0.106
Ronning and Guldvog 1998 Due to Prognostic Group (BI Score <50) Death 0.506 1.374 -1.336 0.182 0.187
Ronning and Guldvog 1998 Due to Prognostic Group (BI Score <50) Dependant or dead 0.288 0.641 -3.049 0.002 0.129
Ronning and Guldvog 1998 Due to Prognostic Group (BI Score <50) Long-term care 0.518 1.351 -1.345 0.179 0.199
Ronning and Guldvog 1998 Due to Prognostic Group (BI Score >50) BI dependant (BI<75) 1.000 3.665 0.000 1.000 0.273
Ronning and Guldvog 1998 Due to Prognostic Group (BI Score >50) Death 0.490 1.674 -1.138 0.255 0.143
Ronning and Guldvog 1998 Due to Prognostic Group (BI Score >50) Dependant or dead 0.643 1.618 -0.938 0.348 0.255
Ronning and Guldvog 1998 Due to Prognostic Group (BI Score >50) Long-term care 9.125 76.328 2.040 0.041 1.091
Ronning and Guldvog 1998 Outcome by Treatment Death 0.543 1.164 -1.570 0.116 0.253
Ronning and Guldvog 1998 Outcome by Treatment Dependant or dead 0.488 0.863 -2.468 0.014 0.276
Ronning and Guldvog 1998 Outcome by Treatment Dependent (BI<75) 0.522 1.062 -1.795 0.073 0.256
Ronning and Guldvog 1998 Outcome by Treatment Need of long-term care 1.231 2.679 0.523 0.601 0.565
Ronning and Guldvog 1998 SF-36 Scores Bodily pain 1.000 1.566 0.000 1.000 0.638
Ronning and Guldvog 1998 SF-36 Scores General health 1.288 2.019 1.104 0.270 0.822
Ronning and Guldvog 1998 SF-36 Scores Health change 1.000 1.566 0.000 1.000 0.638
Ronning and Guldvog 1998 SF-36 Scores Mental health 1.254 1.965 0.986 0.324 0.800
Ronning and Guldvog 1998 SF-36 Scores Mental health (summary) 1.000 1.566 0.000 1.000 0.638
Ronning and Guldvog 1998 SF-36 Scores Physical functioning 1.053 1.650 0.226 0.821 0.672
Ronning and Guldvog 1998 SF-36 Scores physicla health (summary) 1.097 1.719 0.406 0.685 0.701
Ronning and Guldvog 1998 SF-36 Scores Role emotional 1.179 1.847 0.719 0.472 0.753
Ronning and Guldvog 1998 SF-36 Scores Role physical 1.094 1.713 0.391 0.696 0.698
Ronning and Guldvog 1998 SF-36 Scores Social functioning 1.000 1.566 0.000 1.000 0.638
Ronning and Guldvog 1998 SF-36 Scores Vitality 1.210 1.896 0.832 0.406 0.772
0.941 1.060 -0.996 0.319 0.836
0.01 0.1 1 10 100
Ronning and Guldvog 1998
Meta Analysis

15
Specialized Interdisciplinary Stroke Rehabilitation
Kalra L, Evans A, Perez I, Knapp M, Donaldson N, Swift CG. Alternative strategies for stroke care: a prospective randomised controlled trial. Lancet 2000; 356:894-899. Kalra L, Evans A, Perez I, Knapp M, Swift C, Donaldson N. A randomised controlled comparison of alternative strategies in stroke care.Health Technol Assess 2005; 9:1-94.
Author / Year Country PEDro score
Methods Outcome
Kalra et al. 2000 UK 8 (RCT)
457 patients suffering from an acute, moderately disabling stroke were randomized to a stroke unit (n=152), a stroke team (n=152) or home care (n=153). Care was provided for a maximum of 3 months. The main outcome measure was death or need for institutionalization at one year.
The odds of dying or being institutionalized at 1 yr were 3.2 times greater for stroke-team and 1.8 times greater for home care patients when compared to stroke unit patients. Barthel Index scores were better for stroke unit patients than for stroke team and home care. Modified Rankin scores were better for stroke unit patients than for stroke team, and home care patients.
Kalra et al. 2005 UK 8 (RCT)
Additional outcomes from Kalra et al. 2000 study.
Mortality and institutionalization was significantly lower among patients managed on the stroke unit compared to the other two forms of management (13.8% compared to 30.2% for stroke team and 23.6% for home care). Although the median Barthel Index and Frenchay Activity Index scores were not significantly different between the groups although patients managed on the stroke unit achieved greater change scores. Stroke units were more cost-effective than home care or stroke teams.
Patients were much less likely to die when treated on a stroke unit when compared to a mobile stroke team or home care.
p=0.20‡
p=0.001* p=0.03†
0 5 10 15 20 25
Stroke Unit
Stroke Team
Home Care
Percentage of Patients with Mortality at 1 yr (%) …
Mortality at 1 Year for 3 Different Rehabilitation Groups

16
Mortality and institutionalization at 12 months was greater in the stroke unit when compared to the mobile stroke team and home care.
Percentage of patients with Barthel scores 15-20 was higher in the stroke unit than the mobile stroke team or the home care groups.
0
5
10
15
20
25
30
Stroke Unit StrokeTeam
HomeCare
p=0.001*
p=0.03†
p=0.20‡
Mo
rtali
ty &
In
sti
tuti
on
alisati
on
at
12 m
on
ths (
%)
Rehabilitation Group
*Unit vs team; †Unit vs home; ‡Team vs Home
Mortality & Institutionalization at 12 months for 3 Different Rehabilitation Groups
0
20
40
60
80
100
StrokeUnit
StrokeTeam
HomeCare
p=.001*
p=.001†
p=.65‡
Perc
en
tag
e o
f P
ati
en
ts w
ith
Bart
he
l S
co
res 1
5-2
0
(%)
Rehabilitation Group
*Unit vs team; †Unit vs home; ‡Team vs Home
Patients with Barthel Scores from 15-20 at 1 Year According
to Rehabilitation Group

17
Importance: This RCT compared stroke unit, mobile stroke team or home care treatments. Stroke unit care was superior to home care or mobile stroke team care in terms of combined death or institutionalisation, functional change scores and cost-effectiveness.

18
Specialized Interdisciplinary Stroke Rehabilitation
Indredavik B, Fjaertoft H, Ekeberg G, Loge AD, Morch B. Benefit of an extended stroke unit service with early supported discharge: A randomized controlled trial. Stroke 2000; 31(12):2989-2994. Fjaertoft H, Indredavik B, Lydersen S. Stroke unit care combined with early supported discharge: long-term follow-up of a randomized controlled trial. Stroke 2003; 34(11):2687-91.
Author / Year Country PEDro score
Methods Outcome
Indredavik et al. 2000 Norway 7 (RCT)
320 stroke patients were randomized to receive care on an enhanced stroke unit service (ESUS) with an early supported discharge component or an ordinary stroke service (OSUS).
A greater proportion of patients treated in the extended stroke unit was independent
(using Rankin scores 2 and BI scores 95) and had been discharged home (64 vs. 46%). Shorter LOS for patients treated on the extended stroke service (19 vs. 31 days).
Fjaertoft et al. 2003 Norway 7 (RCT)
52 week follow-up to 2000 study
A greater proportion of ESUS patients was independent, defined as a modified Rankin
Scale score of 2, (56.3% vs. 45.0%, p=0.045). There were non-significant improvements in independence, defined as
a Barthel Index score of 95, favouring ESUS patients (52.5% vs. 46.3%, p=0.264).
Indredavik et al. 2000
Patients admitted to the enhanced or extended stroke unit service were discharged home at discharge when compared to an ordinary stroke serice and this trend continued at 6 and 12 weeks
0
10
20
30
40
50
60
70
80
90
At Home Institution Dead At Home Institution Dead At Home Institution Dead
Discharge At 6 Weeks At 12 Weeks
Pe
rce
nta
ge
of
Pa
tie
nts
(%
)
Destination Outcomes for Extended vs. Ordinary Stroke Unit Service
Extended Stroke Unit Service Ordinary Stroke Unit Service

19
Fjaertoft et al. 2003
Patients in the Extended Stroke Unit Service has significantly lower length of inhospital stay.
Importance: This study was important because it showed that stroke unit care combined with early supported discharge appears to improve long term clinical outcome when compared with ordinary stroke unit care while shortening in-patient hospital stays.
0 5 10 15 20 25 30 35
ESUS
OSUS
18.6
31.1
Average Length of Inpatient Stay (days)
Average Length of Inpatient Stay for Extended vs. Ordinary Stroke Unit Service at 52 Weeks
ESUS=Extended Stroke Unit Service; OSUS=Ordinary Stroke Unit Service
p=.032
Study name Subgroup within study Statistics for each study Odds ratio and 95% CI
Odds Lower Upper
ratio limit limit Z-Value p-Value
Indredavik et al., 2000 BI 1.536 0.987 2.392 1.901 0.057
Indredavik et al., 2000 mRS 1.721 1.098 2.697 2.370 0.018
1.625 1.185 2.227 3.017 0.003
0.1 0.2 0.5 1 2 5 10
OSUS ESUS
Indredavik et al., 2000
Meta Analysis
Study name Outcome Statistics for each study Odds ratio and 95% CI
Odds Lower Upper
ratio limit limit Z-Value p-Value
Fjaertoft et al., 2003 mRS 1.393 0.890 2.179 1.452 0.147
1.393 0.890 2.179 1.452 0.147
0.1 0.2 0.5 1 2 5 10
Favours A Favours B
Fjaertoft et al., 2003
Meta Analysis

20
Specialized Interdisciplinary Stroke Rehabilitation
Foley N, Slater K, Teasell R. Specialized stroke services: A meta-analysis comparing three models of care. Cerebrovascular Diseases 2007; 23(2-3):194-202.
Importance: This meta-analysis was the first to show that acute stroke units improved outcomes when compared to more general acute neurological care. Demonstrated that combined stroke units (acute and rehabilitation) and subacute rehabilitation units had better outcomes than general neurology or medical units.

21
Elements of Stroke Rehabilitation Early Rehabilitation Paolucci S, Antonucci G, Grasso MG, Morelli D, Troisi E, Coiro P, Bragoni M. Early versus delayed inpatient stroke rehabilitation: a matched comparison conducted in Italy. Arch Phys Med Rehabil 2000; 81:695-700. AVERT Trial Bernhardt J, Dewey H, Thrift A, Collier J, Donnan G. A very early rehabilitation trial for stroke (AVERT): phase II safey and feasibility. Stroke 2008; 39:390-396. Cumming TB, Thrift AG, Collier JM, Churilov L, Dewey HM, Donnan GA et al. Very early mobilization after stroke fast-tracks return to walking: further results from the phase II AVERT randomized controlled trial. Stroke 2011; 42(11):153-158. Sorbello D, Dewey HM, Churilov L, Thrift AC, Collier JM, Donnan G, Bernhardt J. Very early mobilization and complications in the first 3 months after stroke: further results from phase II of a A Very Early Rehabilitation Trial (AVERT). Cerebrovasc Dis 2009; 28:378-383.
Therapy Intensity Kalra L. The influence of stroke unit rehabilitation on functional recovery from stroke.Stroke 1994; 25:821-825. Kwakkel G, Wagenaar RC, Twisk JW, Lankhorst GJ, Koetsier JC. Intensity of leg and arm training after primary middle-cerebral-artery stroke: a randomised trial. Lancet 1999; 354:191-196.
Kwakkel G, van Peppen R, Wagenaar RC, et al. Effects of augmented exercise therapy time after stroke: a meta-analysis. Stroke 2004; 35:2529-2539. Lincoln NB, Parry RH, Vass CD. Randomized, controlled trial to evaluate increased intensity of physiotherapy treatment of arm function after stroke.Stroke 1999; 30:573-579. Rodgers H, Mackintosh J, Price C, Wood R, McNamee P, Fearon T, Marritt A, Curless R. Does an early increased-intensity interdisciplinary upper limb therapy programme following acute stroke improve outcome? Clinical Rehabilitation 2003; 17(6):579-589. Harris JE, Eng JJ, Miller WC, Dawson AS. A self-administered Graded Repetitive Arm Supplementary Program (GRASP) improves arm function during inpatient stroke rehabilitation: a multi-site randomized controlled trial. Stroke 2009; 40:2123-2128. CERISE Trial De Wit L, Putman K, Schuback B, Komárek A, Angst F, Baert I, Berman P, Bogaerts K, Brinkmann N, Connell L, Dejaeger E, Feys H, Jenni W, Kaske C, Lesaffre E, Leys M, Lincoln N, Louckx F, Schupp W, Smith B, De Weerdt W. Motor and functional recovery after stroke: a comparison of 4 European rehabilitation centers. Stroke 2007; 38(7):2101-2107.

22
Care Pathways
Sulch D, Evans A, Melbourn A, Kalra L. Does an integrated care pathway improve processes of care in stroke rehabilitation? A randomized controlled trial.Age Ageing 2002; 31(3):175-179. Sulch D, Kalra L. Integrated care pathways in stroke management. Age Ageing 2000; 29:349-352. Sulch D, Melbourn A, Perez I, Kalra L. Integrated care pathways and quality of life on a stroke rehabilitation unit. Stroke 2002; 33(6):1600-4.
Weekend Therapy Sonoda S, Saitoh E, Nagai S, Kawakita M, Kanada Y. Full-time integrated treatment program, a new system for stroke rehabilitation in Japan: comparison with conventional rehabilitation. Am J Phys Med Rehabilitation 2004; 83(2):88-93. Task Specificity Langhammer B, Stanghelle JK. Bobath or motor relearning programme? A comparison of two different approach of physiotherapy in stroke rehabilitation: a randomized controlled study. Clinical Rehabilitation 2000; 14:361-369. Langhammer B, Stanghelle JK.Bobath or Motor Relearning Programme? A follow-up one and four years post stroke. Clinical Rehabilitation 2003; 17:731-734. Van Vliet PM, Lincoln NB, Foxall A. Comparison of Bobath based and movement science based treatment for stroke: A randomized controlled trial. J Neurol Neurosurg Psychiatry 2005; 76:503-508. Hafsteinsdottir TB, Algra A, Kapelle LJ, Grypdonk MH. Neurodevelopmental treatment after stroke: A comparative study. J Neurol Neurosurg Psychiatry 2005; 76:788-792. Salbach NM, Mayo NE, Wood-Dauphinee S, Hanley JA, Richards CL, Cote R. A task-orientated intervention enhances walking distance and speed in the first year post stroke: a randomized controlled trial. Clinical Rehabilitation 2004; 18:509-519. Arya KN, Verma R, Garg RK, Sharma VP, Agarwal M, Aggarwal GG. Meaningful task-specific training (MTST) for stroke rehabilitation: a randomized controlled trial. Topics Stroke Rehab 2012; 19:193-211.

23
Early Rehabilitation Paolucci S, Antonucci G, Grasso MG, Morelli D, Troisi E, Coiro P, Bragoni M. Early versus delayed inpatient stroke rehabilitation: a matched comparison conducted in Italy. Arch Phys Med Rehabil 2000; 81:695-700.
Author / Year Country PEDro score
Methods Outcome
Paolucci et al. 2000 Italy No Score
A case controlled study of 135 stroke patients who received: 1) rehabilitation within the first 20 days post-stroke (short onset) 2) rehabilitation 21 to 40 days post-stroke (medium onset) and rehabilitation 41 to 60 days (long onset) post-stroke. All patients received the same physical therapy program.
Higher dropout rate was noted in the short onset group. Barthel Index scores in the short onset group showed significantly greater rate of improvement than the other two groups.
Shorter time from onset to admission to rehabilitation resulted in improved rehabilitation efficiency.
Importance: This case-controlled study demonstrated that patients who entered into rehabilitation early (<20 days) showed a significantly greater rate of improvement than those who entered rehabilitation later (>20 days).
Rehabilitation Efficiency on Barthel Index (BI) according to
Onset-Admission Intervals (OAI)
0 0.1 0.2 0.3 0.4 0.5 0.6
Short OAI (<20 days
from onset)
Medium OAI (21-40
days from onset)
Long OAI (41-60 days
from onset)
Resp
on
se t
o T
reatm
en
t
Rehabilitation Efficiancy on BI
Note: Efficiency refres to the average increase per day gained during rehabilitation stay,
=(improvement in score on each scale)/(length of rehabilitation stay)

24
Early Rehabilitation AVERT Trial Bernhardt J, Dewey H, Thrift A, Collier J, Donnan G. A very early rehabilitation trial for stroke (AVERT): phase II safey and feasibility. Stroke 2008; 39:390-396. Cumming TB, Thrift AG, Collier JM, Churilov L, Dewey HM, Donnan GA et al. Very early mobilization after stroke fast-tracks return to walking: further results from the phase II AVERT randomized controlled trial. Stroke 2011; 42(11):153-158. Sorbello D, Dewey HM, Churilov L, Thrift AC, Collier JM, Donnan G, Bernhardt J. Very early mobilization and complications in the first 3 months after stroke: further results from phase II of a A Very Early Rehabilitation Trial (AVERT). Cerebrovasc Dis 2009; 28:378-383.
Author, Year Country
PEDro Score
Methods Outcomes
Bernhardt et al. 2008 Australia 8 (RCT)
71 patients within 24 hrs of stroke onset were randomly assigned to receive standard care (SC) (n=33) or SC plus very early mobilization (VEM)(n=38). In the VEM group the goal of first was mobilization within 24 hours of stroke symptom onset. VEM continued daily for the first 14 days after stroke or until discharge (whichever was sooner) and was delivered by a nurse/physiotherapist. It was intended to provide twice the therapy compared with the SC group. The primary safety outcome was the number of deaths at 3 months. A good outcome, defined as a modified Rankin Score (mRS) of 0-2 at 3, 6 and 12 months was also assessed.
There was no significant difference in the number of deaths between groups (SC, 3 of 33; VEM, 8 of 38; p=0.20). Almost all deaths occurred in patients with severe stroke. After adjusting for age, baseline NIHSS score and premorbid mRS score, the odds of experiencing a good outcome were significantly higher at 12 months for the VEM group (OR: 8.15, 95% CI 1.61-41.2, p<0.01). There was also a trend towards good outcome at 3 months, but not at 6 months.
Sorbello et al. 2009 Australia 7 (RCT)
Additional analysis from AVERT trial, examining the number and severity of complications between groups. Complications were classified according to type (complications of immobility, stroke-related, co-morbidity related, psychological and other) and severity.
Within 3 months of admission there were no differences in the number or severity of complications between groups. Patients in the SC group experienced a total of 91 counts of complications while patients in the VEM group experienced 87. There were no differences in the severity of complications between groups.
Cumming et al. 2011 Australia 7 (RCT)
Additional analysis from AVERT trial. Patients in the very early and intensive mobilization group returned to walking significantly sooner than did standard stroke unit care controls (P=0.032; median 3.5 vs. 7.0 days). There were no differences in proportions

25
of patients who were independent on the BI (score of 20) or who had achieved a good outcome on the Rivermead Motor Assessment Scale (score of 10-13) at either 3 or 12 months. VEM group assignment was a significant, independent predictor of independence on the BI at 3 months, but not at 6 months. VEM group assignment was a significant, independent predictor of good outcome on RMA at both 3 and 12 months.
Importance: Patients who were rehabilitated in the very early and intensive rehabilitation group returned to walking sooner than standard stroke care patients and achieved better independence and motor recovery scores.
Study name Subgroup within study Outcome Statistics for each study Odds ratio and 95% CI
Odds Lower Upper ratio limit limit Z-Value p-Value
AVERT Trial 2008 Good Outcome Death at 12 months 0.503 0.178 1.424 -1.295 0.195
AVERT Trial 2008 Good Outcome Death at 3 months 0.667 0.248 1.789 -0.805 0.421
AVERT Trial 2008 Good Outcome Death at 6 months 0.733 0.274 1.965 -0.617 0.537
0.631 0.354 1.127 -1.556 0.120
0.1 0.2 0.5 1 2 5 10
Alive Death
AVERT Trial 2008
Meta Analysis

26
Therapy Intensity Kalra L. The influence of stroke unit rehabilitation on functional recovery from stroke. Stroke 1994; 25:821-825.
Author / Year Country PEDro score
Methods Outcome
Kalra et al. 1994(a) UK 5 (RCT)
Analysis of 146 middle-band stroke patients taken from a sample of 245 stroke patients randomized at 2 weeks post stroke to a rehabilitation unit or a general medical unit after stratification by stroke severity. (Analysis of 1993 RCT).
The median Barthel Index (BI) scores of patients managed on the stroke unit were significantly higher when compared to patients on the medical unit (15 vs 12). The rate of improvement in BI scores was faster for patients on the stroke unit and these patients had significantly shorter LOS (6 vs 20 weeks). Significant gains were achieved at a faster rate without additional physiotherapy or occupational therapy in total.
Patients on a stroke unit showed more rapid and complete improvements in Barthel scores when compared to patients on a medical unit.
NS p=.002
p=.001
p=.001 p=.001
p=.001 p=.001 p=.001
p=.001
0
2
4
6
8
10
12
14
16
0 1 2 3 4 6 8 10 12
Bart
hel
Sco
res
Weeks
Barthel Scores from 0 to 12 Weeks for Patients on a Stroke
vs. a Medical Unit
Barthel Scores Stroke Unit Barthel Scores Medical Unit

27
Patients on stroke unit were discharged much sooner than patients on medical unit.
The total number of hours of physiotherapy was actually more on the medical unit than on the stroke unit while for occupational therapy it was less. However, on the stroke unit it was all delivered over an average of 6 weeks while on the stroke unit it was spread out over 20 weeks resulting in more intensive therapy on the stroke unit.
Importance: This study demonstrates that middle-band stroke patients do better in a specialized stroke rehabilitation unit when compared to a general medicine unit in terms of functional outcomes and length of hospital stay. This despite the fact that both groups received the same amount of overall therapy. The stroke unit care was more specialized and intensive (“front-loading”). The result was significant improvements in function with shorter lengths of stay; hence, better health outcomes were obtained at a lesser cost.
0 20 40 60 80 100 120
Stroke Unit
Medical Unit
p<.001
Length of Stay (days)
Length of Stay for Patients Treated on a Stroke Unit vs. a Medical Unit
0
5
10
15
20
25
Physiotherapy Occupational Therapy
p< .05
NS
Ho
urs
Hours of Physiotherapy and Occupational Therapy on a Stroke vs. Medical Unit
Stroke Unit
Medical Unit

28
Therapy Intensity Kwakkel G, Wagenaar RC, Twisk JW, Lankhorst GJ, Koetsier JC. Intensity of leg and arm training after primary middle-cerebral-artery stroke: a randomised trial. Lancet 1999; 354:191-196.
Author / Year Country PEDro score
Methods Outcome
Kwakkel et al. 1999 Netherlands 8 (RCT)
101 patients were randomized 14 days following stroke to receive one of 3 therapies: 1) arm training, 2) leg training or 3) basic rehabilitation only. Leg and arm treatments were applied for 30 min 5 days/week x 20 weeks. All patients received basic rehabilitation.
At week 26, significant differences in median Action Research arm (ARA) scores between the three groups were observed. Median Barthel Index and ARA scores of patients in both arm and leg training groups were significantly higher when compared to the control group.
Leg training group achieved higher comfortable walking speeds than basic rehabilitation controls during the course of the training.
p< .05
p< .05 p< .05
NS
0
0.1
0.2
0.3
0.4
0.5
0.6
0.7
6 12 20 26
Co
mfo
rtab
le W
alk
ing
Sp
eed
s (
m/s
)
Weeks
Comfortable Walking Speeds from 6-26 weeks for 2 Rehabilitation Subgroups
Leg-training Control
p< .05
p< .05 p< .05 NS
0
0.2
0.4
0.6
0.8
1
6 12 20 26
Maxim
um
Walk
ing
Sp
eed
s
(m/s
)
Weeks
Maximum Walking Speeds for 6-26 weeks for 2 Rehabilitation Subgroups
Leg-training Control

29
Leg training group achieved better maximum walking speeds than basic rehabilitation controls during the course of training.
Leg training group achieved higher comfortable walking speed and maximum walking speeds than basic rehabilitation controls during the course of the training.
Importance: This RCT showed the benefit of increased physiotherapy on walking speeds post-stroke. This benefit continued for 20 weeks becoming statistically non-significant not until 6 months had passed. Gains were maintained over time.
p< .05 p< .05
p< .05 NS p< .05
p< .05 p< .05 NS
00.20.40.60.8
1
6 12 20 26 6 12 20 26
Comfrotable Walking Speeds Maximum Walking SpeedsWalk
ing
Sp
eed
s (
m/s
)
Walking Speeds Outcome from 6-12 weeks for 2 Rehabilitation Subgroups
Leg-training Control
Study name Subgroup within study Outcome Statistics for each study Std diff in means and 95% CI
Std diff Standard Lower Upper in means error Variance limit limit Z-Value p-Value
Kwakkel et al., 1999 Arm-training Group Comfortable walking speed 0.159 0.240 0.058 -0.311 0.629 0.663 0.507
Kwakkel et al., 1999 Arm-training Group Frenchay activites index 0.336 0.241 0.058 -0.137 0.808 1.393 0.164
Kwakkel et al., 1999 Arm-training Group Maximum walking speed 0.082 0.240 0.057 -0.387 0.552 0.342 0.732
Kwakkel et al., 1999 Arm-training Group Nottingham health profile 0.284 0.241 0.058 -0.187 0.756 1.182 0.237
Kwakkel et al., 1999 Arm-training Group Sickness impact profile 0.056 0.239 0.057 -0.414 0.525 0.233 0.816
Kwakkel et al., 1999 Arm-training Group Used walking aids Post 0.123 0.187 0.035 -0.244 0.490 0.658 0.511
Kwakkel et al., 1999 Arm-training Group Used walking aids Pre 0.523 0.228 0.052 0.077 0.969 2.300 0.021
Kwakkel et al., 1999 Leg-training Group Comfortable walking speed 0.088 0.244 0.059 -0.389 0.566 0.362 0.718
Kwakkel et al., 1999 Leg-training Group Frenchay activites index 0.638 0.250 0.062 0.149 1.128 2.558 0.011
Kwakkel et al., 1999 Leg-training Group Maximum walking speed 0.080 0.244 0.059 -0.397 0.558 0.329 0.742
Kwakkel et al., 1999 Leg-training Group Nottingham health profile 0.413 0.246 0.061 -0.069 0.895 1.678 0.093
Kwakkel et al., 1999 Leg-training Group Sickness impact profile 0.219 0.244 0.060 -0.260 0.698 0.897 0.370
Kwakkel et al., 1999 Leg-training Group Used walking aids Post -0.017 0.191 0.036 -0.391 0.356 -0.091 0.927
Kwakkel et al., 1999 Leg-training Group Used walking aids Pre 0.496 0.230 0.053 0.045 0.948 2.155 0.031
0.235 0.062 0.004 0.114 0.355 3.812 0.000
-1.00 -0.50 0.00 0.50 1.00
Kwakkel et al., 1999
Meta Analysis

30
Therapy Intensity Kwakkel G, van Peppen R, Wagenaar RC, et al. Effects of augmented exercise therapy time after stroke: a meta-analysis. Stroke 2004; 35:2529-2539.
Author / Year Country PEDro score
Methods Outcome
Kwakkel et al. 2004 USA No Score
A systematic review to study the effects of augmented exercise therapy time (AETT) on various stroke outcomes. Searched for candidate articles published between 1966 and 2003. Using a fixed and random effects model, effect sizes were computed for ADL, walking speed and dexterity.
Thirty-one studies met the inclusion criteria, of which 20 were used for analysis, establishing a sample of 2686 stroke patients. At end of intervention, a small heterogeneous summary effect size was established for ADL (p<.05). A homogeneous summary effect size (p<.001) was established when therapy occurred within the first 6 months after stroke but not thereafter. A significant homogeneous summary effect size was also noted for walking speed (p=.017), but not for dexterity.
Augmented therapy has been studied for both OT and PT and the majority of the studies demonstrated a significant difference in outcomes with more intensive therapy.
Importance: This study is an extension of a previous meta-analysis, evaluating the benefit of augmented physical therapy, including 20 studies which had assessed many interventions: occupational (upper extremity), physiotherapy (lower extremity), leisure therapy, home care and sensorimotor training. After adjusting for differences in treatment intensity contrasts, augmented
0 10 20 30 40 50
PT
OT
Time Daily (min)
Average Physiotherapy (PT) and Occupational Therapy (OT) for a Control vs. Experimental
Group for 17 Studies
Control
Experimental
0
2
4
6
8
10
12
14
SignificantDifference
No SignificantDifference
14
6
Th
e N
um
be
r o
f S
tud
ies
Studies on the Significance of
Augumented Therapy Time

31
therapy was associated with statistically significant treatment effects for the outcomes of ADL and walking speeds, although not for upper extremity therapy.

32
Therapy Intensity Lincoln NB, Parry RH, Vass CD. Randomized, controlled trial to evaluate increased intensity of physiotherapy treatment of arm function after stroke.Stroke 1999; 30:573-579.
Author / Year Country PEDro score
Methods Outcome
Lincoln et al. 1999 UK 7 (RCT)
A single blind trial of 282 patients randomized to receive either routine physiotherapy, or additional physiotherapy (10 hrs over 5 weeks) from a qualified therapist or a physiotherapy assistant.
No significant differences between the groups on any of the outcome measures (Rivermead Motor Assessment Arm Scale, Action Research Arm test or Barthel Index) were observed post intervention, at 3 or 6 month follow-up.
Comparison of Routine PT to additional therapy from a Qualified PT or PT Assistant across a number of outcome measures
Outcome Measures at Postintervention (Post) and 6 Months:
Routine (RPT) vs. Additional Therapy from Qualified (QPT) or Assistant (APT) Physiotherapist
0
5
10
15
20
25
30
Post 6 Mo Post 6 Mo Post 6 Mo Post 6 Mo Post 6 Mo Post 6 Mo
RMA* Arm ARAT** Barthel EADL† RMA gross function
Max. Grip
Outcome Measure
Va
lue
RPT QPT APT
*Rivermead Motor Assessment **Action Research Arm Test † Extended Activities of Daily Living
No significant differences were found between groups (p>.30).

33
Importance: Although many patients will experience impaired arm and hand function following a stroke, it is unclear if enhanced or additional therapy will lead to significant improvements in function. This study evaluated whether an additional 10 hours of therapy, provided over a 5-week period, by either a qualified physiotherapist or an assistant was effective.
Study name Subgroup within study Outcome Statistics for each study Odds ratio and 95% CI
Odds Lower Upper ratio limit limit Z-Value p-Value
Lincoln et al. 1999 ATP Deceased 3.695 0.983 13.885 1.935 0.053
Lincoln et al. 1999 ATP Worse RMA arm score 0.255 0.069 0.944 -2.046 0.041
Lincoln et al. 1999 QTP Deceased 1.723 0.400 7.424 0.730 0.465
Lincoln et al. 1999 QTP Worse RMA arm score 0.252 0.068 0.934 -2.063 0.039
0.762 0.389 1.495 -0.791 0.429
0.1 0.2 0.5 1 2 5 10
Lincoln et al., 1999
Meta Analysis

34
Therapy Intensity Rodgers H, Mackintosh J, Price C, Wood R, McNamee P, Fearon T, Marritt A, Curless R. Does an early increased-intensity interdisciplinary upper limb therapy programme following acute stroke improve outcome? Clinical Rehabilitation 2003; 17(6):579-589.
Author / Year Country PEDro score
Methods Outcome
Rodgers et al. 2003 United Kingdom 7 (RCT)
123 patients with stroke causing upper limb impairment within the previous 10 days were randomized to either an experimental group or into a control group. The experimental group received stroke unit care plus enhanced upper limb therapy from both a physiotherapist and an occupational therapist commencing within 10 days of stroke and available up to 30 minutes/day, five days/week for 6 weeks. The control group received stroke unit care.
There was no significant difference between groups on any outcome measure (Action Research Arm Test, Motricity Index, Frenchay Arm Test, upper limb pain, Barthel ADL, Nottingham E-ADL) at 3 and 6 months after stroke. There was no significant difference in service costs between groups.
p< .001
p=.03
p=.006
0
5
10
15
20
25
30
Physiotherapy Occupational Therapy Joint sessions
Med
ian
min
/wo
rkin
g d
ay
Inpatient
Physiotherapy and Occuptational Therapy Hours for Enhanced Upper Limb Rehabilitation vs. Control
Intervention Control

35
Comparison of enhanced upper extremity rehabilitation therapy to usual therapy demonstrated no difference in a number of outcomes.
Importance: This randomized controlled trial of good methodological quality, examined the effectiveness of additional physiotherapy, aimed at the upper extremity, provided acutely following stroke.
p=.786
p=.668 p=.679
p=.168
p=.307
p=.681
p=.276
0 10 20 30 40 50 60 70 80 90
ARAT
Upper Limb Motricity Index
Frenchay Arm Test
Nottingham E-ADL
Upper limp Pain
OHS 0-2
OHS 3-5
Barthel Index
6 month Outcome Values
Ou
tco
me
Me
as
ure
s
Median Outcome Measures at 6-months: Enhanced Upper Limb Rehabilitation vs. Control
Control Intervention
Study name Subgroup within study Outcome Statistics for each study Odds ratio and 95% CI
Odds Lower Upper ratio limit limit Z-Value p-Value
Rodgers et al., 2003 3 months OHS 0.806 0.371 1.754 -0.542 0.588
Rodgers et al., 2003 6 months OHS 1.185 0.528 2.656 0.411 0.681
0.970 0.554 1.699 -0.105 0.916
0.1 0.2 0.5 1 2 5 10
Non Event Event
Rodgers et al., 2008
Meta Analysis

36
Therapy Intensity Harris JE, Eng JJ, Miller WC, Dawson AS. A self-administered Graded Repetitive Arm Supplementary Program (GRASP) improves arm function during inpatient stroke rehabilitation: a multi-site randomized controlled trial. Stroke 2009; 40:2123-2128.
Author / Year Country PEDro score
Methods Outcome
Harris et al. 2009 Canada 8 (RCT)
103 patients admitted for inpatient rehabilitation participated in a 4-week program of upper extremity therapy. Patients were randomized to either a graded repetitive upper limb supplementary program (GRASP group, n=53) or the control group (education protocol, n=50). The primary outcome measure was the Chedoke Arm and Hand Activity Inventory (CAHAI). Assessment was conducted before and after treatment and at 5 months post stroke. Secondary measures were used to evaluate grip strength and paretic upper limb use outside of therapy time.
Subjects in the GRASP group showed greater improvement in upper limb function (CAHAI) compared to the control group (mean change score: 14.1 vs. 7.9, p<0.001). The GRASP group maintained this significant gain at 5 months poststroke. Significant differences were also found in favor of the GRASP protocol for grip strength and paretic upper limb use.
Importance: A graded repetitive upper extremity therapy program as a supplement during inpatient rehabilitation resulted in greater improvement in upper limb function than an education control group.

37
Therapy Intensity CERISE Trial De Wit L, Putman K, Schuback B, Komárek A, Angst F, Baert I, Berman P, Bogaerts K, Brinkmann N, Connell L, Dejaeger E, Feys H, Jenni W, Kaske C, Lesaffre E, Leys M, Lincoln N, Louckx F, Schupp W, Smith B, De Weerdt W. Motor and functional recovery after stroke: a comparison of 4 European rehabilitation centers. Stroke 2007; 38(7):2101-2107. • Study compared motor and functional recovery after stroke between 4 European Rehab
Centers • Gross motor and functional recovery was better in Swiss and German than UK center with
Belgian center in middle • Time sampling study showed avg. daily direct therapy time of 60 min in UK, 120 min in
Belgian, 140 min in German and 166 min in Swiss centers • Differences in therapy time not attributed to differences in patient/staff ratio (similar staffing)
For CERISE trial this chart shows patients in the German and Swiss centers received significantly more therapy than in the UK center.
1 2 2.3 2.8 0
0.5
1
1.5
2
2.5
3
Hrs Therapy per day
Hrs Therapy perday

38
Chart demonstrating the amount of time as a percentage spent in direct patient care for PT and OT in Germany and the UK.Therapists in the UK spent much less time than the German therapists.
• No differences were found in the content of physiotherapy and occupational therapy • In German and Swiss centers, the rehabilitation programs were strictly timed (therapists had
less freedom), while in UK and Belgian centers they were organized on an ad hoc basis (therapists had more freedom to decide)!
“More formal management in the German center may have resulted in the most efficient use of human resources, which may have resulted in more therapy time for the patients” Importance: This study suggested that more formal management of therapist’s time on a stroke rehabilitation unit resulted in patients receiving a greater intensity of therapy time with resultant improvements in outcomes.
0.0%
10.0%
20.0%
30.0%
40.0%
50.0%
60.0%
70.0%
UK
Germany
45.90%
66.10%
32.90%
63.30%
PT
OT

39
Weekend Therapy Sonoda S, Saitoh E, Nagai S, Kawakita M, Kanada Y. Full-time integrated treatment program, a new system for stroke rehabilitation in Japan: comparison with conventional rehabilitation. Am J Phys Med Rehabil 2004; 83(2):88-93.
Author / Year Country PEDro score
Methods Outcome
Sonoda et al. 2004 Japan No Score
Historical comparison of 48 stroke patients treated admitted to a conventional stroke rehabilitation program in Dec 1999, compared to 58 patients treated by the Full-time Integrated Treatment (FIT) program. The key difference between the 2 programs was the intensity and frequency of treatment (80 minutes of OT/PT therapy 5x/week vs. same daily total of therapy time, but provided 7x/week, although patients were encouraged to remain active outside of structured sessions).
Admission FIM scores between the 2 groups were similar (80.9, conventional vs. 81.2, FIT), however at discharge the FIT group had higher average FIM scores (97.1 vs. 105.0, p<0.01) and FIM efficiency, (change/LOS) (0.19 vs. 0.33, p<0.01). Hospital stays were also shorter for patients in the FIT group (72.9 vs. 81.1 days). The days of onset of stroke to admission into rehabilitation was 54 days for patients in the conventional group and 50 days for patients in the FIT group.
Subjects in the weekend group scored higher on the Total FIM score, the Motor FIM score and were discharged from hospital sooner than those patients who did not have weekend therapy.
0
0.05
0.1
0.15
0.2
0.25
0.3
0.35
Total FIMscore
Motor FIMsubscore
p< .01
0.18
p< .01
0.16
0.32 0.3
Me
an
Va
lue
of
FIM
eff
ice
nc
y
FIM Efficiency Scores for the Conventional Treatment Group
vs. the FIT Group
Conventional FIT
0
10
20
30
40
50
60
70
80
Conventional FIT
p< .05
Le
ng
th o
f S
tay (
da
ys
)
Length of Stay for the Conventional Treatment Group vs. the FIT group

40
Importance: This comparative study demonstrated that additional weekend therapy results in significant improvements in FIM efficiency as well as a reduction in length of stay.

41
Task Specificity Langhammer B, Stanghelle JK. Bobath or motor relearning programme? A comparison of two different approach of physiotherapy in stroke rehabilitation: a randomized controlled study. Clinical Rehabilitation 2000; 14:361-369. Langhammer B, Stanghelle JK.Bobath or Motor Relearning Programme? A follow-up one and four years post stroke. Clinical Rehabilitation 2003; 17:731-734.
Author / Year Country PEDro score
Methods Outcome
Langhammer & Stanghelle 2000 Norway 8 (RCT)
A double blind trial of 61 stroke patients randomized to receive therapy based on Bobath concept (represents a theoretical framework in a reflex-hierarchical theory) or to receive a Motor Relearning Programme (based on system theory and task oriented) (MRP). All patients received physiotherapy 5 days weekly with a minimum of 40 minutes duration as long as they were hospitalized and the same comprehensive multidisciplinary treatment for stroke patients from doctors, nurses, occupational therapist and speech therapist according to recommendation for stroke units in Norway. The patients were tested three times: (1) three days after admission to the hospital, (2) two weeks thereafter, and (3) three months post stroke using Motor Assessment Scale (MAS) (all times), Sødring Motor Evaluation Scale (SMES), (all times) Barthel ADL Index (first and third time) and Nottingham Health Profile (NHP) (only third time).
Length of stay was significantly shorter in MRP group compared to Bobath group, 21 vs. 34 days (p = 0.008). MRP group improve better in motor function (MAS). Both groups improves on MAS, SMES, Barthel Index, no difference in improvement between groups.
Langhammer & Stanghelle 2003 Norway 8 (RCT)
Follow up study ay one and 4 years post stroke was performed to determine whether the initial physiotherapy approach ( Bobath vs MRP) had any long-term effects on mortality, motor function, postural control, activities of daily living, life quality, follow-up from community services and living conditions.
Initial physiotherapy approach (Bobath vs MRP) did not show difference in long term outcome at 1 and 4 years.

42
Motor Learning vs. Bobath Langhammer & Stanghelle 2000
Motor Relearning Programme resulted in improvement in MAS scores when compared to Bobath at 3 months with a non-significant difference at 1 year.
Motor Relearning Programme resulted in decreased length of hospital stay when compared to treatment
using the Bobath approach.
p=.0001
p=.0001
p=.05 p=.0001
NS
p=.0001 NS
05
10152025303540
Test 1 Test 2 Test 3
Ou
tco
me
Me
as
ure
Va
lue
s
Mean Motor Assessment Scale (MAS)
Mean MAS scores at 3 Tests for Physiotherapy using the Motor Relearning Programme (MRP) vs. Bobath
MRP Bobath
NS
p=.001
p=.01
p=.0006
NS
p=.0007 p=.0003
0
20
40
60
80
Energy Sleep Emotions Mobility Pain Social Life Total
NH
P V
alu
es
NHP Categories
Gender Difference using the Life Quality Test (NHP)
Women Men
0 5 10 15 20 25 30 35
MRP
Bobath
21
34
p=.008
Length of Stay (days)
LOS for Physiotherapy using the Motor Relearning Programme (MRP) vs. Bobath
43
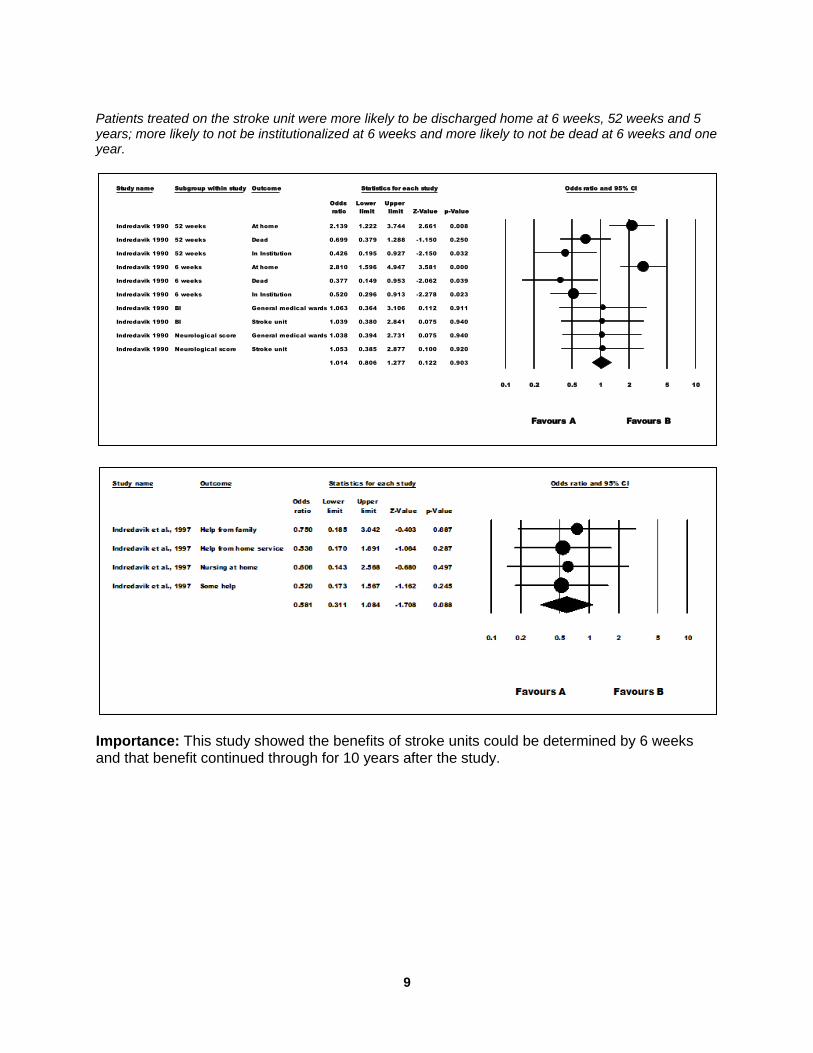
Langhammer& Stanghelle 2003
Importance: One of the great debates in physiotherapy is whether the neuro-developmental (or restorative) approach, is preferred or whether the compensatory, task-focused, adaptive approach is superior. The most common restorative technique is the Bobath approach that is based upon a theoretical framework in a reflex-hierarchical therapy. Synergistic movements are supported while normal movements are facilitated and encouraged. Langhammer and Stronghelle (2000, 2003), in a RCT, compared the Bobath approach to the Motor Relearning Programme and found the latter resulted in shorter hospital stays and improved motor function in the first three months post stroke. Improvement were not sustained during one and four years follow-up post stroke.
Outcome Measures at 3 Assessments Following Stroke:
Motor Relearning Programme (MRP) vs. Bobath Group
Outcome
Measures:
MAS=Motor
Assessment Scale
SMES=Sodring
Motor Evaluation
Scale
NHP=Nottingham
Health Profile
0
10
20
30
40
50
60
70
80
90
3 M
o
1 Y
r
4 Y
r
3 M
o
1 Y
r
4 Y
r
3 M
o
1 Y
r
4 Y
r
3 M
o
1 Y
r
4 Y
r
3 M
o
1 Y
r
4 Y
r
3 M
o
1 Y
r
4 Y
r
MAS SMES1 SMES2 SMES3 Barthel NHP
Outcome MeasureNote: No significant differences were found between groups
Sco
re
MRP
Bobath
Study name Subgroup within study Outcome Statistics for each study Std diff in means and 95% CI
Std diff Standard Lower Upper
in means error Variance limit limit Z-Value p-Value
Langhammer et al., 2000 Sumscore 1 SMES 0.000 0.276 0.076 -0.541 0.541 0.000 1.000
Langhammer et al., 2000 Sumscore 2 SMES 0.046 0.276 0.076 -0.495 0.587 0.165 0.869
Langhammer et al., 2000 Sumscore 3 SMES 0.000 0.276 0.076 -0.541 0.541 0.000 1.000
Langhammer et al., 2000 Total ADL 0.034 0.276 0.076 -0.507 0.575 0.123 0.902
Langhammer et al., 2000 Total MAS 0.074 0.276 0.076 -0.467 0.615 0.270 0.787
Langhammer et al., 2000 Total NHP 0.103 0.276 0.076 -0.438 0.644 0.373 0.709
0.043 0.113 0.013 -0.178 0.264 0.380 0.704
-1.00 -0.50 0.00 0.50 1.00
Langhammer et al., 2000
Meta Analysis

44
Task Specificity Van Vliet PM, Lincoln NB, Foxall A. Comparison of Bobath based and movement science based treatment for stroke: A randomized controlled trial. J Neurol Neurosurg Psychiatry 2005; 76:503-508.
Author / Year Country PEDro score
Methods Outcome
Van Vliet et al. 2005 UK 7 (RCT)
120 patients admitted to a stroke rehabilitation ward were randomized to two rehabilitation approaches Bobath based (BB) or movement science based (MSB). Rivermead Motor Assessment (RMA) and Motor Assessment Scale (MAS) scores were assessed at 1, 3 and 6 months.
There were no significant differences between the two groups. Scores on the subsections of both RAM and MAS associated with lower extremity function were similar.
Importance: This RCT demonstrated no difference in outcomes between the Bobath based approach and a movement-science based approach to motor therapy.

45
Task Specificity Hafsteinsdottir TB, Algra A, Kapelle LJ, Grypdonk MH. Neurodevelopmental treatment after stroke: A comparative study. J Neurol Neurosurg Psychiatry 2005; 76:788-792.
Author / Year Country PEDro score
Methods Outcome
Hafsteinsdottiret al. 2005 The Netherlands No Score
A controlled, multi-site cluster trial. 225 patients in 6 hospitals received rehabilitation on units using the NDT approach and 101 patients on 6 wards received rehabilitation on units using a conventional (non-NDT) approach. The primary outcome was a poor outcome (Barthel Index scores < 12 or death) at one-year. Quality of life (QoL) was also assessed.
There were no differences in the proportion of patients experiencing a poor outcome. The adjusted odds ratio associated with the NDT approach was 1.7 (0.8, 3.5). There were no differences in median QoL scores between the groups at 12 months.
Importance: This RCT showed that there was no difference in outcomes between an NDT versus a non-NDT approach.

46
Task Specificity Salbach NM, Mayo NE, Wood-Dauphinee S, Hanley JA, Richards CL, Cote R. A task-orientated intervention enhances walking distance and speed in the first year post stroke: a randomized controlled trial. Clinical Rehabilitation 2004; 18:509-519.
Author / Year Country PEDro score
Methods Outcome
Salbach et al. 2004 Canada 8 (RCT)
91 community-dwelling subjects with a residual walking deficit within one year of a first or recurrent stroke were randomized to an intervention which comprised 10 functional tasks designed to strengthen the lower extremities and enhance walking balance, speed and distance or to a control intervention focusing on upper extremity activities, 3 days a wk x 6 wks. The main outcomes assessed were 6-minute walk test (SMWT), 5-m walk (comfortable and maximum pace), Berg Balance Scale and timed 'up and go' test.
Following treatment patients in the intervention group had attained achieved greater improvements on the following outcomes measures: SMWT (40 m vs. 5m); comfortable walking speed (0.14 vs. 0.03 m/s); maximum walking speed (0.20 vs. –0.01 m/s); TUG (-1.2 vs. 1.7sec).
Task-specific gait training results in better mobility outcomes than an upper extremity training program.
-0.05
0
0.05
0.1
0.15
0.2
0.25
Comfortable WalkingSpeed
Maximum WalkingSpeed
Ch
an
ge
in
Sp
ee
d O
ve
r 6
we
ek
s o
f T
rain
ing
(m
/s)
Performance on measures of Walking Speeds
Mobility Training UE Training
200
210
220
230
240
250
260
Pre Post
Dis
tan
ce
(m
)
6 week Training Period
Performance measures for the Six-minute Walking Test
Mobility Training UE Training

47
Importance: Results from the studies of Dean et al. (2003) and Salbach et al. (2004) suggest that therapy designed to improve the strength and endurance of the affected lower limb and functional performance demonstrated improvement that was specific to the training.

48
Task Specificity Arya KN, Verma R, Garg RK, Sharma VP, Agarwal M, Aggarwal GG. Meaningful task-specific training (MTST) for stroke rehabilitation: a randomized controlled trial. Topics Stroke Rehab 2012; 19:193-211.
Author / Year Country PEDro score
Methods Outcome
Arya et al. 2012 India 9 (RCT)
103 patients with a Brunnstrom stage of 2 for arm recovery, an average of 12 weeks following stroke, were randomized to receive a 4 week course of either task-specific training or standard training using the Bobath neurodevelopmental technique. Patients in both groups received 1 hr of therapy 5x/week. Outcomes were assessed before and after treatment and at 8 weeks follow-up and included Fugl-Meyer assessment (FMA), Action Research Arm Test (ARAT), Graded Wolf Motor Function Test (GWMFT), and Motor Activity Log (MAL).
Ninety-five participants completed the 8-week follow-up. Patients in the task-specific group achieved significantly greater gains compared to patients in the control group, at both the end of treatment and at follow-up on FMA, ARAT, GWMFT, and MAL.
Importance: This RCT found that for upper extremity motor training, subjects in the task-specific therapy group did better than those in the Bobath NDT group.

49
Care Pathways
Sulch D, Evans A, Melbourn A, Kalra L. Does an integrated care pathway improve processes of care in stroke rehabilitation? A randomized controlled trial. Age Ageing 2002; 31(3):175-179. Sulch D, Kalra L. Integrated care pathways in stroke management. Age Ageing 2000; 29:349-352. Sulch D, Melbourn A, Perez I, Kalra L. Integrated care pathways and quality of life on a stroke rehabilitation unit. Stroke 2002; 33(6):1600-4.
Author / Year Country PEDro score
Methods Outcome
Sulch et al. 2000 UK 6 (RCT)
152 patients were randomized to be managed by an Integrated Care Pathway (ICP) based on evidence of best practice, professional standards and existing infrastructure for facilitating inter-disciplinary coordination, improving discharge planning and reducing length of hospital stay or were to be managed by conventional multi-disciplinary care (control). (see Figure)
There were no differences in mortality rates, frequency of institutionalization or LOS between the two groups. Conventional multidisciplinary care resulted in higher BI scores between 4 and 12 weeks and higher Quality of Life scores at 12 weeks and 6 months, compared to the ICP group patients.
Sulch et al. 2002 UK 6 (RCT)
Additional analyses from Sulch et al. 2000. Quality of life was assessed using the EuroQoL Visual Analogue Scale (EQ-VAS) at 6 mos.
Patients receiving conventional multidisciplinary therapy had significantly higher QoL scores at 6 mos compared to patients in Integrated Care Pathway group (median 72 vs. 63, p<0.005).
Sulch et al. 2002 UK 6 (RCT)
Additional analyses from Sulch et al. 2000, investigating the frequency of stroke specific assessments associated with either ICP or multidisciplinary care.
Increased frequency of stroke-related assessments with ICP, including testing for inattention (84% vs. 60%, p=0.015) and nutritional assessments (89% vs. 70%, p=0.024). Early discharge notifications to general practitioners were also higher among patients in the ICP group.

50
Sulch et al. (2000, 2002) Integrated Care Pathways
Integrated Care Plan did not improve median Barthel scores and did not improve quality of life scores when compared to conventional care.
Frequency of Assessments
Integrated Care Plan resulted in an increase in testing and discharge planning.
0
20
40
60
80
Week 4 Week 12 Week 26
41
59 63
44
65 72
Med
ian
Eu
roq
uo
l S
co
re
Time
Median QoL Scores of Patients receiving ICP or Conventional Care
ICP MDT
0
5
10
15
20
Baseline Week 1 Week 4 Week 12 Week 26Med
ian
Bart
he
l In
de
x S
co
re
Time
Median BI Scores over Time
ICP Group MDT Group
0
20
40
60
80
100
ICP MDT
Fre
qu
en
cy o
f S
tro
ke
Assessm
en
t (%
)
Rehabilitation Type
Testing For Inattention
Nutritional Assessment
Early Discharge Notification to GP
Study name Subgroup within study Statistics for each study Odds ratio and 95% CI
Odds Lower Upper
ratio limit limit Z-Value p-Value
Sulch et al., 2002 Clinical localisation of lesion 0.616 0.257 1.475 -1.088 0.277
Sulch et al., 2002 Cognitive function 2.724 0.940 7.896 1.845 0.065
Sulch et al., 2002 Communication 3.787 1.310 10.945 2.459 0.014
Sulch et al., 2002 Mood 0.830 0.356 1.936 -0.430 0.667
Sulch et al., 2002 Neurological assessment 20.000 2.578 155.142 2.866 0.004
Sulch et al., 2002 Nutritional assessment 10.294 4.581 23.133 5.644 0.000
Sulch et al., 2002 Pre-stroke funciton 3.040 0.122 75.803 0.677 0.498
Sulch et al., 2002 Sensation 1.239 0.590 2.605 0.567 0.571
Sulch et al., 2002 Standardised cognitive testing 0.641 0.233 1.763 -0.862 0.389
Sulch et al., 2002 Swallowing assessment 11.769 0.639 216.685 1.659 0.097
Sulch et al., 2002 Visual impairments 0.939 0.468 1.884 -0.178 0.859
Sulch et al., 2002 Visual/sensory inattention 3.440 1.328 8.912 2.543 0.011
1.762 1.326 2.340 3.910 0.000
0.1 0.2 0.5 1 2 5 10
MDT ICP
Sulch et al., 2002
Meta Analysis

51
Importance: This RCT demonstrated that care pathways did not improve stroke rehabilitation outcomes suggesting the importance of individualized therapies within an evidence-based context.

52
Outpatient Rehabilitation Gladman JR, Lincoln NB, Barer DH.A randomised controlled trial of domiciliary and hospital-based rehabilitation for stroke patients after discharge from hospital.J Neurol Neurosurg Psychiatry 1993; 56:960-966. Gladman JR, Lincoln NB.Follow-up of a controlled trial of domiciliary stroke rehabilitation (DOMINO Study).Age Ageing 1994; 23:9-13.
Early Supported Discharge Mayo NE, Wood-Dauphinee S, Cote R, Gayton D, Carlton J, Buttery J, Tamblyn R. There's no place like home: an evaluation of early supported discharge for stroke. Stroke 2000; 31:1016-1023. Teng J, Mayo NE, Latimer E, Hanley J, Wood-Dauphinee S, Cote R, Scott S. Costs and caregiver consequences of early supported discharge for stroke patients. Stroke 2003; 34(2):528-36. Fearon P, Langhorne P, Early Supported Discharge Trialists. Services for reducing duration of hospital care for acute stroke patients. Cochrane Database of Systematic Reviews 2012, Issue 9. Art. No.: CD000443. DOI: 10.1002/14651858.CD000443.pub3 Home-Based Exercise Program Duncan P, Studenski S, Richards L, et al. Randomized clinical trial of therapeutic exercise in subacute stroke. Stroke 2003; 34:2173-2180.

53
Outpatient Therapy Gladman JR, Lincoln NB, Barer DH.A randomised controlled trial of domiciliary and hospital-based rehabilitation for stroke patients after discharge from hospital. J Neurol Neurosurg Psychiatry 1993; 56:960-966. Gladman JR, Lincoln NB.Follow-up of a controlled trial of domiciliary stroke rehabilitation (DOMINO Study). Age Ageing 1994; 23:9-13. Author / Year Country PEDro score
Methods Outcome
Gladman et al. 1993 UK 6 (RCT)
327 stroke patients were randomized to receive domiciliary service for up to 6 months or hospital-based rehabilitation services.
Domiciliary group showed significantly greater performance on Extended ADL household and leisure sub-scores at 6 months.
Gladman and Lincoln. 1994 UK 6 (RCT)
Follow up of 1993 study reporting outcomes between 6-months and one-year after discharge.
Relative risk of death or institutionalization in the domiciliary group was 1.6 after one year.
Gladman et al. 1993 (DOMINO Study Group) and Gladman and Lincoln 1994 At 6 months, there was no difference in the proportion of patients who were residing at home, in hospital, residential care, or who were dead. At one year, 11% of patients in the Domicillary Rehabilitation Services (DRS) group were in an institution compared to 8% in the Hospital Rehabilitation Services (HRS) group. There was a trend towards higher rates of death or institutionalization for the DRS group at one year (27% vs. 19%, p=ns).
Living Location of Patients at 6 Months
*Other Designation combines:
(%) DRS HRS In hospital 2 1 Residential/nursing care 6 5 Dead 10 4
Patients in the home-based rehabilitation group were more likely to be living at home at the end of 6 months.
Importance: This RCT compared home-based stroke rehabilitation to hospital-based outpatient rehabilitation care. One-year follow-up revealed 3 interesting outcomes based on the
0
20
40
60
80
100
Home Other*
82
18
90
10 Perc
en
tag
e
DRS HRS

54
site stroke patients were transferred from. Those from a geriatric ward (elderly and frail) did best with hospital-based outpatient care, which in turn was 26% greater in terms of care. Those from the stroke unit (younger with more extensive CNS involvement) had better household and leisure activity scores at 6 months with home-based therapy, although costs were 2.6 times greater. The 3rd group, those from general medical wards (in between the other two groups described above) showed no difference but costs of hospital-based rehab was only 56% that of home-based rehab care.

55
Early Supported Discharge Mayo NE, Wood-Dauphinee S, Cote R, Gayton D, Carlton J, Buttery J, Tamblyn R. There's no place like home: an evaluation of early supported discharge for stroke. Stroke 2000; 31:1016-1023. Teng J, Mayo NE, Latimer E, Hanley J, Wood-Dauphinee S, Cote R, Scott S. Costs and caregiver consequences of early supported discharge for stroke patients. Stroke 2003; 34(2):528-36.
Author / Year Country PEDro score
Methods Outcome
Mayo et al. 2000 Canada 7 (RCT)
114 of 1542 admitted stroke patients were randomized after discharge to receive either home intervention or usual post stroke care. Eligibility criteria included patients with persistent motor deficits post stroke with caregivers willing and able to provide live-in care over a 4- week period. At 28 days those stroke patients who still needed >1 assist to walk, or those with cognitive impairment or with disabling coexisting conditions were excluded. Barthel scores were approximately 84 on average.
Duration of hospital stay reduced by 2.6 days (9.8 vs. 12.4) in the home treatment group. Barthel score did not change significantly between the two groups. Home therapy group did better on SF-36 physical health component and a community reintegration score vs. usual care.
Teng et al. 2003 Canada 7 (RCT)
Cost and caregiver burden analysis from study by Mayo et al. (2000).
The total costs after 3 mos. associated with the home care group were significantly less compared to the usual care group ($7,784 vs. $11,065 Canadian, p<0.0001). Lower caregiver burden scores were associated with home intervention group.
Mayo et al. 2000
39.5 NS
37.2
42.9 p=.048
37.9
35
40
45
SF-36 ScoreShort form 36 -
Physical Component
Summary
1 month 3 months
Evaluation Point
Impact of Intervention on Physical Health:
Home Intervention vs. Usual Care
Home Usual

56
Physical component of the SF-36 is improved at 3 months in the home intervention group. Teng et al. 2003
Total cost of care and caregiver burden were both higher in the usual care group when compared to the home care group.
Importance: This RCT showed that early-supported discharge, the concept of discharging patients to their home early under the care of an interdisciplinary stroke rehab term, can successfully reduce days in hospital without change in functional outcome. In this study it was also found to reduce overall costs.
$0
$2,000
$4,000
$6,000
$8,000
$10,000
$12,000
Home GroupCare Group
$7,784
$11,065
Total Cost 3 months following Randomization of Resource Use
p< .001
0
5
10
15
20
25
Home GroupCare Group
p=.02
Care
giv
er
Bu
rde
n In
de
x
Caregiver Burden after 3 Months
Study name Subgroup within study Outcome Statistics for each study Std diff in means and 95% CI
Std diff Standard Lower Upper
in means error Variance limit limit Z-Value p-Value
Mayo et al., 2000 Physical Health (SF-36) Physical health 0.253 0.199 0.039 -0.136 0.643 1.276 0.202
0.253 0.199 0.039 -0.136 0.643 1.276 0.202
-2.00 -1.00 0.00 1.00 2.00
Mayo et al., 2000
Meta Analysis
Study name Subgroup within study Statistics for each study Std diff in means and 95% CI
Std diff Standard Lower Upper
in means error Variance limit limit Z-Value p-Value
Teng et al., 2003 Physical Health SF-36 1.258 0.225 0.051 0.817 1.699 5.589 0.000
1.258 0.225 0.051 0.817 1.699 5.589 0.000
-2.00 -1.00 0.00 1.00 2.00
Teng et al., 2002
Meta Analysis

57
Early Supported Discharge Fearon P, Langhorne P, Early Supported Discharge Trialists. Services for reducing duration of hospital care for acute stroke patients. Cochrane Database of Systematic Reviews 2012, Issue 9. Art. No.: CD000443. DOI: 10.1002/14651858.CD000443.pub3 The efficacy of ESD for acute stroke patients was recently evaluated by the Early Supported Discharge Trialists, with the most recent update in 2012 (Fearon & Langhorne 2012). The purpose of the review was to establish the effects and cost of ESD services compared to conventional services. The review included results from 14 trials on 1957 patients.The results are presented in the Table below. Table: Statistical results on Outcome for ESD vs Conventional Care
Outcome
Significant
Result
(Yes/No)
OR (95%CI) or
Weighted Mean Difference
(95% CI
Death No 0.91 ( 0.67 to 1.25)
Death or need for institutionalization Yes 0.78 (0.61 to 1.0)
Death or dependency Yes 0.80 ( 0.67 to 0.97)
Length of initial hospital stay Yes -7.1 ( -10.03 to -4.14)
Satisfaction with service Yes 1.6 ( 1.08 to 2.38)
Extended ADL Yes 0.12 (0.00 to 0.25)
Subjective health No 0.0 ( -0.10 to 0.11)
Number or readmissions to hospital No 1.26 ( 0.94 to 1/67)
The review found there was a significant reduction in the number of patients requiring institutional care following discharge as well as reduced levels of dependency at 6 months. The ESD group also showed significant reductions (P < 0.0001) in the length of hospital stay equivalent to approximately seven days. Improvements were also seen in patients' extended activities of daily living scores. Patients who receive ESD services were more likely to report satisfaction with the services. There was no statistically significant differences seen in carers' subjective health status, mood or satisfaction with services. The apparent benefits were no longer statistically significant at five-year follow-up. Importance: This meta-analysis found that ESD improved important outcomes but primarily when rehabilitation in the home was organized by the same team that did the inpatient care.

58
Home-Based Exercise Program Duncan P, Studenski S, Richards L, et al. Randomized clinical trial of therapeutic exercise in subacute stroke. Stroke 2003; 34:2173-2180.
Author / Year Country PEDro score
Methods Outcome
Duncan et al. 2003 USA 8 (RCT)
100 stroke patients were randomized to receive structured, progressive, physiologically based exercise program to or usual care in a single blinded RCT. Intervention was a structured, progressive physiologically based, therapist-supervised, in-home program of thirty-six 90-minute sessions over 12 weeks targeting flexibility, strength balance, endurance and upper-extremity function.
Intention-to-treat multivariate analysis of variance testing the overall effect demonstrated that the intervention produced greater gains than usual care. Gains for the intervention group exceeded those in usual care group in balance, endurance, park aerobic capacity and mobility. The authors concluded that the structured, progressive program of therapeutic exercise in persons who had completed acute rehabilitation services produced gains in endurance, balance and mobility beyond those attributable to spontaneous recovery and usual care.
A structured therapist-supervised home therapy program resulted in greater improvement in peak Vo2 at 3 months when compared to usual care.
p<.01
0 0.5 1 1.5
Intervention
Usual Care
Change in Peak Vo2 from Baseline to 3 months (mL/kg.min)
Change in Peak Vo2 for a Usual Care Group vs. an Intervention Group
p<.001
0 0.5 1 1.5
Intervention
Usual Care
Change in Duration of Bike Exercises from Baseline to 3 months (min)
Change in the Duration of Bike Exercise for a Usual Care Group vs.
an Intervention Group

59
Improvement in endurance greater in the home-based exercise program when compared to usual care.
Significant improvement in Berg Balance score and gait velocity at 3 months in the home-based physiotherapy group when compared to usual care.
Significant improvement in 6 minute walk distance at 3 months in the home-based physiotherapy group when compared to usual care.
0
1
2
3
4
5
Intervention Usual Care
4.36
1.7
Mean
Ch
an
ge i
n B
BS
Change in Berg Balance Score (BBS) from Baseline to 3 months for
Intervention vs. Usual Care
p<.001 p<.05
0 0.05 0.1 0.15 0.2
Intervention
Usual Care
Change in 10-m Gait Velocity from baseline to 3 months (m/s)
Change in 10-m Gait Velocity for a Usual Care Group vs. an Intervention
Group
61.61
33.59
0
10
20
30
40
50
60
70
Intervention Usual Care
Ch
an
ge
in
6-m
in W
alk
Dis
tan
ce
fr
om
ba
se
lin
e t
o 3
mo
nth
s (
m)
Change in 6-min Walk Distance for a Usual Care Group vs. an Intervention Group
p<.05

60
Importance: This RCT of a structured therapist-supervised home program compared to usual care noted significant gains were made in balance, gait and endurance although no significant gains were made in upper extremity function.

61
Lower Extremity Motor Therapies in Stroke Rehabilitation Lower Extremity Specific TherapiesTreadmill Training Pohl M, Mehrholz J, Ritschel C, Ruckriem S. Speed-dependent treadmill training in ambulatory hemiparetic stroke patients. A randomized controlled trial. Stroke 2002; 33:553-558. Treadmill Training and PBWS Visintin M, Barbeau H, Korner-Bitensky N, Mayo NE. A new approach to retrain gait in stroke patients through body weight support and treadmill stimulation. Stroke 1998; 29:1122-1128. Lower Extremity Specific TherapiesTreadmill Training Pohl M, Mehrholz J, Ritschel C, Ruckriem S. Speed-dependent treadmill training in ambulatory hemiparetic stroke patients. A randomized controlled trial. Stroke 2002; 33:553-558. MOBILISE Trial Ada L, Dean CM, Morris ME, Simpson JM, Katrak P. Randomized trial of treadmill walking with body weight support to establish walking in subacute stroke. The MOBILISE trial. Stroke 2010; 41:1237-1242. LEAPS Trial (Locomotor Experience Applied Post Stroke) Duncan PW, Sullivan KJ, Behrman AL, Azen SP, Wu SS, Nadeau SE, Dobkin BH, Rose DK, Tilson JK, Cen S, Hayden SK, LEAPS Investigative Team. Body-weight-supported treadmill rehabilitation after stroke. New England Journal of Medicine 2011; 364:2026-2036. Strength Training Moreland JD, Goldsmith CH, Huijbregts MP, Anderson RE, Prentice DM, Brunton KB, O’Brien A, Torresin WD. Progressive resistance strengthening exercises after stroke: a single-blind randomized controlled trial. Arch Phys Med Rehabil 2003; 84:1433-40. Mead GE, Greig CA, Cunningham I et al. Stroke: a randomized trial of exercise or relaxation. J Am Geriatric Soc 2007; 55:892-899. Spasticity Foley N, Murie-Fernandez M, Speechley M, Salter K, Sequeira K, Teasell R. Does the treatment of spastic equinovarus deformity following stroke with botulinum toxin increase gait velocity? A systematic review and meta-analysis.European J Neurology 2010; 17(12):1419-1427.
Pittock SJ, Moore AP, Hardiman O, Ehler E, Kovac M, Bojakowski J, al Khawaja I, Brozman M, Kanovsky P, Skorometz A, Slawek J, Reichel G, Stenner A, timberbaeva S, Stelmasiak Z, Zifko UA, Bhakta B, Coxon E. A double-blind randomised placebo-controlled evaluation of three doses of botulinum toxin type A (Dysport®) in the treatment of spastic equinovarus deformity after stroke. Cerebrovasc Dis 2003; 15:289-30.

62
Functional Electrical Stimulation Lower Extermity Daly JJ, Roenigk K, Holcomb J, Rogers JM, Butler K, Gansen J, McCabe J, Fredrickson E, Marsolais EB, Ruff RL. A randomized controlled trial of functional neuromuscular stimulation in chronic stroke subjects. Stroke 2006; 37:172-178.
Gait Trainer Pohl M, Werner C, Holzgraefe M, Kroczek G, Mehrholz J, Wingendorf I, Hoolig G, Koch R, Hesse S. Repetitive locomotor training and physiotherapy improve walking and basic activities of daily living after stroke: a single-blind, randomized multicentre trial (Deutsche GAngtrainerStudie, DEGAS). Clinical Rehabilitation 2007; 21(1):17-27.
Lokomat Swartz I, Sajin A, Fisher I, Neeb M, Shochina M, Katz-Leurer M, Meiner Z. The effectiveness of locomotor therapy using robotic-assisted gait training in subacute stroke patients: a randomized controlled trial. PMR 2009; 1:516-523.

63
Lower Extremity Specific TherapiesTreadmill Training Pohl M, Mehrholz J, Ritschel C, Ruckriem S. Speed-dependent treadmill training in ambulatory hemiparetic stroke patients. A randomized controlled trial. Stroke 2002; 33:553-558.
Author / Year Country PEDro score
Methods Outcome
Pohl et al. 2002 Germany 6 (RCT)
60 ambulatory patients suffering from hemiparesis, for at least 4 weeks, caused by right or left supratentorial ischemic stroke or intracerebral hemorrhage, exhibiting impaired gait were randomized into 1 of 3 groups: structured speed-dependent treadmill training (STT) where walking speed was increased with each session; limited progressive treadmill training (LTT) in which training speed was increased by no more than 5% of the maximum initial walking speed each week; and, conventional gait therapy (CGT) involving physiotherapeutic gait therapy based on latest PNF and Bobath concepts. Patients were evaluated before training, 2 and 4 weeks post-training on over ground walking speed, cadence, stride length and FAC.
After 4 weeks training period, the STT group scored significantly higher than the LTT and CGT for all outcome measures.
Speed-dependent treadmill training in ambulatory hemiparetic stroke patients
CGT= Conventional Gait therapy, LTT= Limited Progressive Treadmill Training
p<.001
3.5 4 4.5 5 5.5
STT
LTT
CGT
FAC score
FAC Score for 3 Rehabilitation Groups at the End of the Study
p<.001
0 50 100 150
STT
LTT
CGT
Stride Length (m)
Stride Length for 3 Rehabilitation Groups at the End of the Study
0 0.5 1 1.5 2
STT
LTT
CGT
Overground Walking Speed (m/s)
Overground Walking Speed for 3 Rehabiltation Groups at the End of
the Study
p<.001
0 0.2 0.4 0.6 0.8
STT
LTT
CGT
Cadence (steps/m)
Cadence for 3 Rehabilitation Groups at the End of the Study

64
STT= Speed-dependent Treadmill Training Speed-dependent Treadmill Training resulted in better FAC score, stride length, overground walking speed and cadence (steps/m) when compared to limited progressive treadmill training which was better than conventional gait therapy.
Importance: This RCT demonstrated that structured speed-dependent treadmill training, where walking was increased with each session, resulted in significant improvements in many gait-related outcomes when compared to a less aggressive progressive treadmill training program or conventional gait therapy.

65
Treadmill Training and PBWS Visintin M, Barbeau H, Korner-Bitensky N, Mayo NE. A new approach to retrain gait in stroke patients through body weight support and treadmill stimulation. Stroke 1998; 29:1122-1128.
Author / Year Country PEDro score
Methods Outcome
Visintin et al. 1998 Canada 6 (RCT)
100 patients were randomized to be trained to walk with up to 40% of their body weight supported by a BWS system with overhead harness (BWS group) or to be trained to walk bearing full body weight (no-BWS group). Stroke onset was > 6 months.
Significant effect in favour of BWS group on balance; motor control; overhead walking speed and over-ground endurance at the end of the training period compared to the no-BWS group. At the 3-month follow-up, BWS group was found to have maintained its effect for motor recovery and over-ground walking speed.
Visintin et al. (1998) Comparing Body Weight Support (BWS) with no BWS
0 50 100 150 200
Balance Scale Score
Motor Recovery(STREAM-Scale
Score)
Overground WalkingEndurance (m)
Va
lue
s a
t P
os
t-T
rain
ing
no BWS BWS
p = .018
p = .001
p = .018
0 0.1 0.2 0.3 0.4
Overground Walking Speed (m/s)
p = .006

66
Treadmill training with partial body weight support resulted in significantly improved overground walking speed, overground walking endurance, motor recovery and balance scale score when compared to no PBWS.
Importance: This RCT was the key initial study supporting the concept that treadmill training with partial weight support results in improved gait performance. However, the training is very labour intensive and other RCTs as well as a meta-analyses by Moseley et al. (2003) have presented a more mixed picture.

67
Treadmill Training and PBWS MOBILISE Trial Ada L, Dean CM, Morris ME, Simpson JM, Katrak P. Randomized trial of treadmill walking with body weight support to establish walking in subacute stroke. The MOBILISE trial. Stroke 2010; 41:1237-1242.
Author / Year Country PEDro score
Methods Outcome
Ada et al. 2010 Australia 8 (RCT) (MOBILISE trial)
126 acute (within 28 days of stroke onset), nonambulatory stroke patients were randomly allocated to an experimental (n=64) or a control group (n=62). The experimental group undertook up to 30 minutes per day of treadmill walking with body weight support via an overhead harness whereas the control group undertook up to 30 minutes of overground walking. The primary outcome was the proportion of participants achieving independent walking within 6 months.
The proportion of experimental participants who achieved independent walking were 37% compared with 26% of the control group at 1 month, 66% compared with 55% at 2 months, and 71% compared with 60% at 6 months (P=0.13). The experimental group walked 2 weeks earlier, with a median time to independent walking of 5 weeks compared to 7 weeks for the control group.
Importance: This RCT showed that PBWTT group achieved independent walking more often and earlier than an overground walking group.
Study name Outcome Statistics for each study Odds ratio and 95% CI
Odds Lower Upper
ratio limit limit Z-Value p-Value
Ada et al., 2010 Ability to walk 0.500 0.088 2.834 -0.783 0.434
0.500 0.088 2.834 -0.783 0.434
0.01 0.1 1 10 100
Ada et al., 2010
Meta Analysis

68
Treadmill Training and PBWS LEAPS Trial (Locomotor Experience Applied Post Stroke) Duncan PW, Sullivan KJ, Behrman AL, Azen SP, Wu SS, Nadeau SE, Dobkin BH, Rose DK, Tilson JK, Cen S, Hayden SK, LEAPS Investigative Team. Body-weight-supported treadmill rehabilitation after stroke. New England Journal of Medicine 2011; 364:2026-2036.
Author / Year Country PEDro score
Methods Outcome
Duncan et al. 2011 USA 7 (RCT)
408 patients with stroke onset of 2 months were randomized to undergo one of 3 training regimens: early treadmill training with partial body-weight support (within 2 months of stroke) (n=139), late treadmill training with partial body-weight support (6 months after stroke) (n=143) and a home-based exercise program (n=126). All programs consisted of 90 min sessions, 3x/week for 12 to 16 weeks. The primary outcome was the proportion of patients with improved level of functional walking, defined as the ability to walk independently at a speed of >0.4 m/s (severe impairment at baseline) or >0.8 m/s (moderate baseline impairment) at 1 year. Secondary outcomes included gait speed, Fugl-Meyer Assessment, Berg Balance Scale, activities of daily living and items on the stroke Impact Scale.
At one-year, 52% of all patients had improved functional walking ability. There was no difference in the proportion of improvement was found among the 3 groups. There were no differences among the groups on any of the secondary outcomes. The lack of difference persisted after adjusting for initial impairment.
For this study we used the early LT- control and the late-LT control as two different effect time size data points.
Importance: This RCT was the largest and most sophisticated trial of BWSTT conducted. PBWTT group did not do better than a home-based exercise group.
Study name Subgroup within study Outcome Statistics for each study Std diff in means and 95% CI
Std diff Standard Lower Upper in means error Variance limit limit Z-Value p-Value
Duncan et al. 2011 Early ASBCS 0.082 0.123 0.015 -0.159 0.323 0.664 0.506
Duncan et al. 2011 Early BBS 0.145 0.123 0.015 -0.096 0.386 1.177 0.239
Duncan et al. 2011 Early Distance walked in 6 min (m) 0.138 0.123 0.015 -0.104 0.379 1.119 0.263
Duncan et al. 2011 Early FMA 0.049 0.123 0.015 -0.192 0.290 0.397 0.691
Duncan et al. 2011 Early Mobility 0.076 0.123 0.015 -0.165 0.317 0.619 0.536
Duncan et al. 2011 Early Partic ipation 0.106 0.123 0.015 -0.135 0.348 0.863 0.388
Duncan et al. 2011 Early SIS 0.239 0.123 0.015 -0.003 0.481 1.934 0.053
Duncan et al. 2011 Early Usual walking speed (m/sec) 0.000 0.123 0.015 -0.241 0.241 0.000 1.000
Duncan et al. 2011 Late ASBCS 0.214 0.123 0.015 -0.026 0.455 1.750 0.080
Duncan et al. 2011 Late BBS 0.201 0.122 0.015 -0.039 0.441 1.642 0.101
Duncan et al. 2011 Late Distance walked in 6 min (m) 0.076 0.122 0.015 -0.164 0.315 0.618 0.536
Duncan et al. 2011 Late FMA 0.276 0.123 0.015 0.035 0.516 2.245 0.025
Duncan et al. 2011 Late Mobility 0.183 0.122 0.015 -0.057 0.423 1.495 0.135
Duncan et al. 2011 Late Partic ipation 0.145 0.122 0.015 -0.095 0.385 1.186 0.235
Duncan et al. 2011 Late SIS 0.354 0.123 0.015 0.113 0.596 2.877 0.004
Duncan et al. 2011 Late Usual walking speed (m/sec) 0.000 0.122 0.015 -0.239 0.239 0.000 1.000
0.143 0.031 0.001 0.082 0.203 4.645 0.000
-1.00 -0.50 0.00 0.50 1.00
Favours A Favours B
Duncan et al. 2011
Meta Analysis

69
Strength Training Moreland JD, Goldsmith CH, Huijbregts MP, Anderson RE, Prentice DM, Brunton KB, O’Brien A, Torresin WD. Progressive resistance strengthening exercises after stroke: a single-blind randomized controlled trial. Arch Phys Med Rehabil 2003; 84:1433-40.
Author / Year Country PEDro score
Methods Outcome
Moreland et al. 2003 Canada 6 (RCT)
133 stroke patients were randomized to the experimental group, receiving 9 lower-extremity progressive resistance exercises or to the control group who performed the same exercises without resistance. All patients received conventional physiotherapy.
No significant difference on the rate of change on the Disability Inventory or the 2-minute walking test was found between the groups.
2 minute walk test did not significantly improve between progressive resistance lower extremity and control group who performed the same exercises without resistance.
Importance: This RCT tested the benefit of two strengthening programs on gait. Unfortunately, strength training did not improve gait when compared to an exercise program which did not
25
30
35
40
45
50
55
60
65
Baseline 4 week Discharge 6 mo
2M
WT
(m
)
Results of Unadjusted Primary Outcomes
Experimental Control

70
involve strength training. Although strength training has been shown to be helpful in a number of studies, the benefit is by no means consistent.

71
Strength Training Mead GE, Greig CA, Cunningham I et al. Stroke: a randomized trial of exercise or relaxation. J Am Geriatric Soc 2007; 55:892-899.
Author / Year Country PEDro score
Methods Outcome
Mead et al. 2007 UK 8 (RCT)
66 ambulatory patients stroke patients who had completed inpatient rehabilitation were randomized to receive a 12-week outpatient program of strength and resistance exercise (n=32) or relaxation (n=34). Treatments were provided for 1.5 hrs, 3 times per week. Outcomes were assessed at 3 and 7 months and included: FIM, Nottingham Extended Activities of Daily Living; Rivermead Mobility Index; functional reach; sit-to-stand; elderly mobility score; timed up-and-go; Medical Outcomes Study 36-Item Short Form Questionnaire, version 2 (SF-36); Hospital Anxiety and Depression Score; aspects of physical fitness (comfortable walking speed, walking economy, and explosive leg extensor power).
At 3 months, the role-physical component of the SF-36, timed up and go and walking economy were significantly better among patients in the exercise group compared with the relaxation group. By 7 months, the only difference that remained between groups was the role physical component of the SF-36.
Importance: An RCT of ambulatory stroke patients treated with a strength and resistance exercise program did better with ambulation when compared to a control group receiving relaxation therapy.

72
Spasticity Foley N, Murie-Fernandez M, Speechley M, Salter K, Sequeira K, Teasell R. Does the treatment of spastic equinovarus deformity following stroke with botulinum toxin increase gait velocity? A systematic review and meta-analysis. European J Neurology 2010; 17(12):1419-1427.
• 8 trials, 5 RCTs, 3 uncontrolled (before/after) trials identified • BT-A doses ranged from 190 to 400 U of Botox ® and 500 to 2,000 U of Dysport ®. • BTx-A was associated with a small, but significant treatment effect on gait velocity, (Hedges
g = 0.193 ± 0.081; 95% CI: 0.033 to 0.353, p<0.018) representing an increase of 0.044 metres/sec.
Importance: This meta-analysis of botulinum toxin treatments in the lower extremity to manage a spastic equinovarus deformity demonstrated an improvement in a functional outcome, namely a small but significant treatment effect on gait velocity.

73
Spasticity Pittock SJ, Moore AP, Hardiman O, Ehler E, Kovac M, Bojakowski J, al Khawaja I, Brozman M, Kanovsky P, Skorometz A, Slawek J, Reichel G, Stenner A, timberbaeva S, Stelmasiak Z, Zifko UA, Bhakta B, Coxon E. A double-blind randomised placebo-controlled evaluation of three doses of botulinum toxin type A (Dysport®) in the treatment of spastic equinovarus deformity after stroke. Cerebrovasc Dis 2003; 15:289-30.
Author / Year Country PEDro score
Methods Outcome
Pittock et al. 2003 UK 8 (RCT)
In a double-blind, placebo-controlled, dose-ranging study, 234 patients with hemiparesis with spastic equinovarus deformity of the ankle after stroke were randomized to one of 4 treatment groups: 500 units of Dysport; 1000 units of Dysport; 1500 units of Dysport and placebo. Patients were assessed every 4 weeks over a 12-week period.
Distance covered during 2-minuate walking test significantly increased in each group, but there were no differences between groups. Significant improvement in calf spasticity, limp pain reduction in use of walking was noted in the Dysport groups relative to the control group.
Comparison of placebo and 500, 1,000 and 1,500 units Dysport; all groups improved in 2MWT.
Walking Parameters at Baseline and 12 Weeks: Placebo vs.
Different Treatment Levels
No significant
differences were
found between
groups.
0
10
20
30
40
50
60
70
80
Baseline 12 Weeks Baseline 12 Weeks Baseline 12 Weeks
2-min Walking Test, m Difference in Step Length, cm Stepping Rate, steps/min
Walking Parameter
Val
ue
Placebo Dysport 500 units Dysport 1000 units Dysport 1500 units

74
Importance: This RCT compared the effect of Botox to placebo on various gait parameters. Although gait quality was improved, 2-minute walking speed was not improved over the control.

75
Functional Electrical Stimulation Lower Extermity Daly JJ, Roenigk K, Holcomb J, Rogers JM, Butler K, Gansen J, McCabe J, Fredrickson E, Marsolais EB, Ruff RL. A randomized controlled trial of functional neuromuscular stimulation in chronic stroke subjects. Stroke 2006; 37:172-178.
Author / Year Country PEDro score
Methods Outcome
Daly et al. 2006 USA 8 (RCT)
32 stroke patients (>1 year post stroke) were randomly assigned to 1 of 2 groups: 1) With Functional Neuromuscular Stimulation using intramuscular electrodes (FNS-IM) incorporated into treatment or 2) No FNS (Control). Each group received 1.5 hour sessions 4 times a week for 12 weeks. Therapy included 30 min of body weight supported treadmill training (BWSTT) and 30 min of Overground (OG) walking and 30 min of strengthening and coordination. Evaluations included Tinetti gait (TG), FMLE, Fugl-Meyer knee flexion coordination (FMKnFx), Tinetti balance (TB), six-minute walking test (6MWT).
After 12 weeks of treatment the group receiving FNS-IM produced a significantly larger gain for the primary measure TG compared with the NO-FNS group (p=0.003). The FNS-IM group also made significant gains for FMKnFx versus No-FNS (p=0.049).
Importance: This RCT showed that functional neuromuscular stimulation using intramuscular electrodes resulted in significantly improved gait and knee flexion coordination than a non-stimulator group.

76
Gait Trainer Pohl M, Werner C, Holzgraefe M, Kroczek G, Mehrholz J, Wingendorf I, Hoolig G, Koch R, Hesse S. Repetitive locomotor training and physiotherapy improve walking and basic activities of daily living after stroke: a single-blind, randomized multicentre trial (Deutsche GAngtrainerStudie, DEGAS). Clinical Rehabilitation 2007; 21(1):17-27.
Author / Year Country PEDro score
Methods Outcome
Pohl et al. 2007 Germany 8 (RCT)
155 stroke patients admitted to a stroke rehabilitation unit were randomized to receive either 20 min of repetitive practice on a gait trainer, followed by 25 min of individual PT everyday for 25 min for four weeks (group A) or 45 min of individual PT (group b). Total treatment time was identical between groups. Outcomes, assessed at the end of treatment and 6 months included gait ability and ADL function.
At the end of treatment a significantly greater proportion of patients in group A were able to walk independently (53% vs. 22%, p<0.0001). Significantly more patients in group A had attained a BI scores of >75 (57 vs. 27%, p<0.0001). By 6 months, significantly more patients could walk independently (70% vs. 36%, p<0.0001) although there were no longer differences in the proportion of patients with BI scores > 75 (58% vs. 46%, p=0.025, corrected for multiple testing). There were no differences in the proportion of patients living at home (68% vs. 68%).
Importance: This RCT showed that paitents who had some of their PT on a gait trainer were more likely to walk independently and initiitally more had a BI score > 75.

77
Lokomat Swartz I, Sajin A, Fisher I, Neeb M, Shochina M, Katz-Leurer M, Meiner Z. The effectiveness of locomotor therapy using robotic-assisted gait training in subacute stroke patients: a randomized controlled trial. PMR 2009; 1:516-523.
Author / Year Country PEDro score
Methods Outcome
Schwartz et al. 2009 Israel 6 (RCT)
67 patients admitted for rehabilitation, within 3 months of stroke, were randomized to 2 groups. Patients in both groups received physical therapy for 30 min/day x 5 days/week x 6 weeks. The experimental group received additional therapy (20 min x 3x/week x 6 weeks) using the Lokomat training device. The control group received an equivalent amount of physical therapy. The primary outcome, assessed before and after treatment, was the ability to walk independently, as assessed by use of the Functional Ambulatory Capacity scale (i.e. FAC score of 4 or 5). Secondary outcomes included the NIHSS, the stroke activity scale (SAS), gait velocity, endurance, and number of climbed stairs.
At the end of 6 weeks, a greater proportion of subjects in the experimental group could walk independently (20/37 vs. 8/28, P<0.03). Subjects in experimental group also had better NIHSS scores at the end of treatment (6.6 vs. 8.0, p<0.01). Among those who achieved independent walking, there were nonsignificant differences between groups on SAS scores and timed walk tests
Importance: This RCT showed that those patients who received additional Lokomat therapy were more likely to be walking independent than a control group who received equivalent period of additional physical therapy.
Study name Outcome Statistics for each study Odds ratio and 95% CI
Odds Lower Upper
ratio limit limit Z-Value p-Value
Schwartz et al., 2009 FAC 2.941 1.035 8.356 2.025 0.043
2.941 1.035 8.356 2.025 0.043
0.01 0.1 1 10 100
Favours A Favours B
Schwartz et al., 2009
Meta Analysis

78
Upper Extremity Motor Therapies in Stroke Rehabilitation Bilateral Arm Therapies Morris JH, van WF, Joice S, Ogston SA, Cole I, MacWalter RS. A comparison of bilateral and unilateral upper-limb task training in early poststroke rehabilitation: a randomized controlled trial. Arch Phys Med Rehabil 2008; 89:1237-1245. Morris JH, Van WF. Responses of the less affected arm to bilateral upper limb task training in early rehabilitation after stroke: A randomized controlled trial. Arch Phys Med Rehabil 2012 (e-publ). Constraint-Induced Movement Therapy Taub E, Miller NE, Novack TA, Cook EW, Fleming WC, Nepomuceno CS, Connell JS, Crago JE. Technique to improve chronic motor deficit after stroke.Arch Phys Med Rehabil 1993; 74:347-354 Van der Lee JH, Wagenaar RC, Lankhorst GJ, Vogelaar TW, Deville WL, Bouter LM. Forced use of the upper extremity in chronic stroke patients: results from a single-blind randomized clinical trial. Stroke 1999; 30:2369-2375. EXCITE Trial Wolf SL, Winstein CJ, Miller JP, Taub E, Uswatte G, Morris D, Giuliani C, Light KE, Nichols-Larsen D. Effect of Constraint-Induced Movement Therapy on Upper Extremity Function 3 to 9 months after stroke. JAMA 2006; 296: 2095-2104. Wolf SL, Winstein CJ, Miller JP, et al. Retention of upper limb function in stroke survivors who have received constraint-induced movement therapy: the EXCITE randomised trial. Lancet Neurol 2008; 7:33-40. Wolf SL, Thompson PA, Winstein CJ, Miller JP, Blanton SR, Nichols-Larsen DS, Morris DM, Uswatte G, Taub E, Light KE, Sawaki L. The EXCITE Stroke Trial. Comparing Early and Delayed Constraint-Induced Movement Therapy. Stroke 2010; 41 (10):2309-15. VECTORS Trial Dromerick AW, Lang CE, Birkenmeier RL, Wagner JM, Miller JP, Videen TO, Powers WJ, Wolf SL, Edwards DF. Very Early Constraint-Induced Movement during Stroke Rehabilitation (VECTORS): A single-center RCT. Neurology 2009; 73:195-201. Electrical Stimulation Upper Extremity Powell J, Pandyan AD, Granat M, Cameron M, Stott DJ. Electrical stimulation of wrist extensors in poststroke hemiplegia. Stroke 1999; 30(7):1384-1389.

79
Mirror Therapy Thieme H, Bayn M, Wurg M, Zange C, Pohl M, Behrens J. Mirror therapy for patients with severe arm paresis after stroke - a randomized controlled trial. Clin Rehabil 2013; 27(4):314-324. Thieme H, Mehrholz J, Pohl M, Behrens J, Dohle C. Mirror therapy for improving motor function after stroke. Cochrane Database Syst Rev 2012; 3:CD008449.
Mental Practice Page SJ, Levine P, Leonard A. Mental Practice in Chronic Stroke: Results of a Randomized, Placebo Controlled Trial. Stroke 2007; 38:1293-1297. Robotic Upper Extremity Volpe BT, Krebs HI, Hogan N, Edelstein OL, Diels C, Aisen M. A novel approach to stroke rehabilitation: robot-aided sensorimotor stimulation. Neurology 2000; 54(10):1938-1944.
Robotic Upper Extremity Lo AC, Guarino PD, Richards LG, Haselkorn JK, Witterberg GI, Federman DG, Ringer RJ, Wagner TH, Krebs HJ, Volpe BT, Bever CT, Bravata DM, Duncan PW, Corn BH, Maffucci AD, Nadeau SE, Conroy SS, Powell JM, Huang GD, Peduzzi P. Robot-assisted therapy for long-term upper-limb impairment after stroke. N England J Medicine 2010; 362(19):1772-83. Botulinum Toxin for Focal Spasticity in the Upper Extremity Brashear A, McAfee AL, Kuhn ER, Fyffe J. Botulinum toxin type B in upper-limb poststroke spasticity: a double-blind, placebo-controlled study. Arch Phys Med Rehabil 2004; 85:705-709. McCrory P, Turner-Stokes L, Baguley RJ, De GS, Katrak P, Sandanam J, Davies L, Munns M, Hughes A. Botulinum toxin A for treatment of upper limb spasticity following stroke: a multi-centre randomized placebo-controlled study of the effects on quality of life and other person-centered outcomes. J Rehab Med 2009; 41:536-544. Shaw LC, Price CI, van Wijck FM, Shackley P, Steen N, Barnes MP et al. Botulinum Toxin for the Upper Limb after Stroke (BoTULS) Trial: Effect on impairment, activity limitation, and pain. Stroke 2011; 42(5):1371-1379. Foley N, Pereira S, Salter K, Murie-Fernandez M, Speechley M, Meyer M, Sequeira K, Miller T, Teasell R. Treatment with botulinum toxin improves upper extremity function post stroke? A systematic review and meta-analysis. Archives Physical Medicine and Rehabilitation 2013; 94(5):977-989. Functional Electrical Stimulation Chae J, Bethoux F, Bohine T, Dobos L, Davis T, Friedl A. Neuromuscular stimulation for upper extremity motor and functional recovery in acute hemiplegia. Stroke 1998; 29(5):975-979.

80
Exercises and Hemiplegic Shoulder Pain Post Stroke Kumar R, Metter EJ, Mehta AJ, Chew T. Shoulder pain in hemiplegia. The role of exercise. Am J Phys Med Rehabil 1990; 69(4):205-208.

81
Bilateral Arm Therapies Morris JH, van WF, Joice S, Ogston SA, Cole I, MacWalter RS. A comparison of bilateral and unilateral upper-limb task training in early poststroke rehabilitation: a randomized controlled trial. Arch Phys Med Rehabil 2008; 89:1237-1245. Morris JH, Van WF. Responses of the less affected arm to bilateral upper limb task training in early rehabilitation after stroke: A randomized controlled trial. Arch Phys Med Rehabil 2012. 93(7):1129-1137.
Author / Year Country PEDro score
Methods Outcome
Morris et al. 2008 UK 7 (RCT)
106 acute stroke patients (2-4 weeks post stroke) were randomized to receive bilateral arm training (n=56) or unilateral arm training (n=50). The supervised training was provided for 20 min 5x/week x 6 weeks. The main outcome measure was the Action Research Arm Test (ARAT), which was assessed before/after treatment and at follow-up (18 weeks). Additional outcomes assessed included the Rivermead Motor Assessment upper-limb scale, Nine-Hole Peg Test (9HPT), the Modified Barthel Index, Hospital Anxiety and Depression Scale, and Nottingham Health Profile.
While subjects in both groups improved over time, there were no significant differences in the change scores in short-term improvement (0-6 wk) on any measure. At follow-up, (0-18 wk), the only significant between-group difference was a change in the 9HPT and ARAT pinch section, which was lower, indicating less recovery for the bilateral training group. Baseline severity significantly influenced improvement in all upper-limb outcomes, irrespective of the treatment group.
Morris & Van Wijck 2012 UK 7 (RCT)
Additional reporting from Morris et al. 2008. Outcome assessments included Action Research Arm Test and Nine-Hole Peg Test (9HPT) of the ipsilateral arm.
The median change in ARAT scores for patients in both groups was 0 at 6 and 18 weeks. Patients in the bilateral training group moved a significantly greater number of pegs compared with the control group at 6 (0.06 vs. 0.02, p=0.03) but not 18 weeks (0.04 vs. 0.05, p=.93)
Importance: This RCT compared bilateral arm training to unilateral arm training. Both groups improved from baseline but there was no significant between-group differences; if anything the bilateral arm training group did not do as well.

82
Constraint-Induced Movement Therapy Taub E, Miller NE, Novack TA, Cook EW, Fleming WC, Nepomuceno CS, Connell JS, Crago JE. Technique to improve chronic motor deficit after stroke. Arch Phys Med Rehabil 1993; 74:347-354
Author / Year Country PEDro score
Methods Outcome
Taub et al. 1993 USA 6 (RCT)
9 patients randomized to either have their unaffected upper extremity restrained in a sling during waking hours for 14 days with 10 of those 10 days patients given 6 hours of practice in using impaired upper extremity or to receive several procedures designed to focus attention on use of the impaired upper extremity (control).
Restraint group showed significantly greater improvement in quality of movement and functional ability compared to control on Emory Test and the Arm Motor Activity Rest test at the end of treatment. Motor Activity Log indicates that the restraint group showed a marked increase in their ability to use their affected upper extremity. Gains made during treatment period were maintained during 2 year follow up.
Importance: Constraint-Induced Movement Therapy (CIMT) involves restraint of the unaffected hand/arm and increased practice/use of the affected hand arm (Fritz et al. 2005). Despite being a median of over 4 years post-stroke, the treatment group showed a marked increase in their upper extremity use.

83
Constraint-Induced Movement Therapy Van der Lee JH, Wagenaar RC, Lankhorst GJ, Vogelaar TW, Deville WL, Bouter LM. Forced use of the upper extremity in chronic stroke patients: results from a single-blind randomized clinical trial. Stroke 1999; 30:2369-2375.
Author / Year Country PEDro score
Methods Outcome
van der Lee et al. 1999 Netherlands 7 (RCT)
In an observer blind trial, 66 patients were randomized to receive either forced use therapy with immobilization of the unaffected arm combined with intensive treatment or to receive intensive bimanual training based on Neuro-Development Treatment.
Mean improvement on Action Research Arm in patients with sensory disorder was significantly greater in those receiving forced use rather than bimanual training. During treatment, forced use patients also showed greater clinical significant improvement on Motor Activity Log than bimanual training patients.
The ARAT was significantly improved in the upper extremity of patiens receiving forced use treatment when compared to bimanual exercises.
33.4
39.2 38 38.5
28.3 30 30.8 30.7
0
5
10
15
20
25
30
35
40
45
0 weeks 3 weeks 6 weeks 1 year
AR
A v
alu
e (
ran
ge 0
-57 p
oin
ts)
Action Research Arm (ARA) for Forced Use vs. Bimanual
Forced Use Bimanual
p=.001

84
Importance: This RCT examined Constraint Induced Movement Therapy (CIMT) and intensive therapy and compared it to intensive bimanual training based on NDT in chronic stroke patients. CIMT-treated patients showed significantly greater improvement.

85
Constraint-Induced Movement Therapy EXCITE Trial Wolf SL, Winstein CJ, Miller JP, Taub E, Uswatte G, Morris D, Giuliani C, Light KE, Nichols-Larsen D. Effect of Constraint-Induced Movement Therapy on Upper Extremity Function 3 to 9 months after stroke. JAMA 2006; 296: 2095-2104. Wolf SL, Winstein CJ, Miller JP, et al. Retention of upper limb function in stroke survivors who have received constraint-induced movement therapy: the EXCITE randomised trial. Lancet Neurol 2008; 7:33-40. Wolf SL, Thompson PA, Winstein CJ, Miller JP, Blanton SR, Nichols-Larsen DS, Morris DM, Uswatte G, Taub E, Light KE, Sawaki L. The EXCITE Stroke Trial. Comparing Early and Delayed Constraint-Induced Movement Therapy. Stroke 2010; 41 (10):2309-15.
Author / Year Country PEDro score
Methods Outcome
Wolf et al. 2006 USA 8 (RCT) EXCITE Trial
222 patients between 3 to 9 months post stroke received either CIMT (n=106) or usual care (no treatment, home care or outpatient programs) (n=116). The CIMT group wore a mitt on the less-affected hand while performing repetitive task practice and behavioural shaping with the hemiplegic hand). Outcome measures included the Wolf Motor Function Test (WMFT), Motor Activity Log (MAL), functional ability measures, a measure of the quality and frequency of the performance of 30 standard daily activities. Assessments were conducted before/after treatment and at 4, 6 and 12 months.
The CIMT group significantly improved in the WMFT (log performance time, functional ability 0-5 scale (p<0.001), the MAL Amount of Use (p<0.001) and the MAL Quality of Movement (p<0.001) and caregiver MAL. (Group x time interaction).
Wolf et al. 2008 USA 8 (RCT)
Further results from the EXCITE trial, which assessed outcomes at 24 months. Only the 106 patients who were randomized to receive immediate CIMT were included in this analysis.
The drop out rate was 34% at 24 months. The effects at 24 months either improved or remained stable compared with those at 12 months for all domains of the WMFT, the MAL and for all domains of the SIS scale, except memory and thinking.
Wolf et al. 2010 USA 8 (RCT)
Further results reported from the EXCITE trial whereby the outcomes of subjects who received treatment immediately following randomization (3 to 9 months) were compared with those who received delayed treatment (15 to 21 months). The primary outcomes were the Wolf Motor Function Test (WMFT) and the Motor Activity Log (MAL). The secondary outcome was the Stroke Impact Scale (SIS). Outcomes were assessed before
106 subjects received early treatment and 86, delayed. The earlier CIMT group showed significantly greater improvement compared with the delayed group on the WMFT and the MAL. SIS Hand and Activities domains scores were also significantly higher among subjects in the early group. Early and delayed group comparison of scores on these measures 24 months after enrollment showed no

86
and after treatment and at 4, 8, and 12 months later.
statistically significant differences between groups.
The WMFT performance time was improved in the CIMT group when compared to usual care.
Study name Subgroup within study Outcome Statistics for each study Std diff in means and 95% CI
Std diff Standard Lower Upper in means error Variance limit limit Z-Value p-Value
EXCITE 2006 Caregiver MAL MAL AOU 0.617 0.199 0.040 0.226 1.007 3.098 0.002
EXCITE 2006 Caregiver MAL MAL QOM 0.659 0.200 0.040 0.267 1.050 3.298 0.001
EXCITE 2006 MAL AOU 0.520 0.158 0.025 0.211 0.830 3.296 0.001
EXCITE 2006 MAL AOU tasks >3 0.520 0.158 0.025 0.211 0.830 3.296 0.001
EXCITE 2006 MAL QOM 0.520 0.158 0.025 0.211 0.830 3.296 0.001
EXCITE 2006 MAL QOM tasks >3 0.424 0.157 0.025 0.116 0.732 2.701 0.007
EXCITE 2006 SIS Hand function 0.274 0.156 0.024 -0.032 0.579 1.753 0.080
EXCITE 2006 SIS Physical function 0.146 0.156 0.024 -0.159 0.450 0.936 0.349
EXCITE 2006 WMFT Functional ability 0.520 0.158 0.025 0.211 0.830 3.296 0.001
EXCITE 2006 WMFT Grip 0.200 0.156 0.024 -0.105 0.505 1.284 0.199
EXCITE 2006 WMFT Log performance time 0.520 0.158 0.025 0.211 0.830 3.296 0.001
EXCITE 2006 WMFT Number of Tasks (>120s) 0.520 0.158 0.025 0.211 0.830 3.296 0.001
EXCITE 2006 WMFT Weight 0.155 0.156 0.024 -0.150 0.460 0.996 0.319
0.416 0.045 0.002 0.328 0.504 9.263 0.000
-2.00 -1.00 0.00 1.00 2.00
EXCITE Trial 2006
Meta Analysis
Study name Subgroup within study Outcome Statistics for each study Std diff in means and 95% CI
Std diff Standard Lower Upper
in means error Variance limit limit Z-Value p-Value
Wolf et al., 2010 AOU MAL 0.194 0.145 0.021 -0.091 0.479 1.333 0.183
Wolf et al., 2010 QOM MAL 0.173 0.145 0.021 -0.111 0.458 1.193 0.233
Wolf et al., 2010 Time (seconds) WMFT 0.270 0.146 0.021 -0.016 0.556 1.852 0.064
0.212 0.084 0.007 0.048 0.377 2.527 0.011
-1.00 -0.50 0.00 0.50 1.00
Wolf et al., 2010
Meta Analysis
0 5 10 15 20 25
Performance Time (s)
Baseline
Posttreatment
4-mo Follow -up
8-mo Follow-up
12-mo Follow-up
Figure 10.4 Effect of Constraint-Induced Movement
Therapy (CIMT) vs. Usual Care on WMFT
Performance Time at Baseline Through 12-Month
Follow-up
Usual Care
CIMT
p<0.001 Change from
baseline to 12-mo

87
For this study we used the differences between groups in 12-month change as the baseline and post-treatment did not report p values.
Importance: This RCT showed that those patients who received extensive CIMT 3-9 months post stroke showed much better improvement in function of the affected upper extremity than those individuals who received only usual care.

88
Constraint-Induced Movement Therapy VECTORS Trial Dromerick AW, Lang CE, Birkenmeier RL, Wagner JM, Miller JP, Videen TO, Powers WJ, Wolf SL, Edwards DF. Very Early Constraint-Induced Movement during Stroke Rehabilitation (VECTORS): A single-center RCT. Neurology 2009; 73:195-201.
Author / Yr Country PEDro score
Methods Outcome
VECTORS Dromerick et al. 2009 USA 6 (RCT)
Very Early Constraint-Induced Movement during Stroke Rehabilitation (VECTORS). 52 subjects were randomized to one of 3 groups an average of 9.7 days following stroke: 1) standard CIMT received 2 hours of shaping therapy and wore a mitt for 6 hours per day; 2) high-intensity CIMT, 3 hours of shaping exercise /day + wearing mitt 90% of waking hours; or 3) control treatment consisting of 1 hour of ADL training and 1 hour of UE bilateral training exercises. All treatment was provided for 2 weeks. The primary endpoint was the total Action Research Arm Test (ARAT) score on the more affected side at 90 days after stroke onset.
All groups improved with time on the total ARAT score. There was a significant time x group interaction. Subjects in the standard CIMT and control treatment groups achieved similar gains in total ARAT score (24.2 and 25.7, respectively), while subjects in the high-intensity CIMT group gained an average gain of only 12.6 points.

89
For this study we used the control – high CIMT and the control – low CIMT as two different effect size data points.
Importance: This RCT showed that standard CIMT was no better than standard intensity-matched therapy; both groups improved. The higher intensity CIMT did not do as well as the standard CIMT and standard intensity-matched therapy groups.
Study name Subgroup within study Outcome Statistics for each study Std diff in means and 95% CI
Std diff Standard Lower Upper in means error Variance limit limit Z-Value p-Value
VECTORS Trial ARAT Grasp (high) 2.177 0.439 0.193 1.316 3.038 4.954 0.000
VECTORS Trial ARAT Grasp (low) 0.421 0.338 0.114 -0.240 1.083 1.248 0.212
VECTORS Trial ARAT Grip (high) 2.586 0.472 0.223 1.662 3.511 5.481 0.000
VECTORS Trial ARAT Grip (low) 0.527 0.340 0.115 -0.139 1.193 1.552 0.121
VECTORS Trial ARAT Gross motor (high) 3.239 0.529 0.280 2.201 4.277 6.118 0.000
VECTORS Trial ARAT Gross motor (low) 0.922 0.351 0.123 0.234 1.611 2.627 0.009
VECTORS Trial ARAT Pinch (high) 4.363 0.640 0.410 3.108 5.618 6.816 0.000
VECTORS Trial ARAT Pinch (low) 0.254 0.335 0.112 -0.403 0.911 0.757 0.449
VECTORS Trial ARAT Total (high) 3.528 0.557 0.310 2.437 4.619 6.337 0.000
VECTORS Trial ARAT Total (low) 0.420 0.338 0.114 -0.241 1.082 1.246 0.213
VECTORS Trial FIM Upper extremity (high) 3.697 0.573 0.328 2.574 4.821 6.451 0.000
VECTORS Trial FIM Upper extremity (low) 0.908 0.351 0.123 0.221 1.595 2.589 0.010
VECTORS Trial SIS Hand and Arm (high) 2.641 0.476 0.227 1.707 3.575 5.543 0.000
VECTORS Trial SIS Hand and Arm (low) 1.038 0.356 0.126 0.341 1.735 2.919 0.004
1.362 0.108 0.012 1.150 1.574 12.606 0.000
-8.00 -4.00 0.00 4.00 8.00
VECTORS Trial 2009
Meta Analysis

90
Electrical Stimulation Upper Extremity Powell J, Pandyan AD, Granat M, Cameron M, Stott DJ. Electrical stimulation of wrist extensors in poststroke hemiplegia. Stroke 1999; 30(7):1384-1389.
Author / Year Country PEDro score
Methods Outcome
Powell et al. 1999 UK 7 (RCT)
60 hemiparetic stroke patients, 2-4 weeks post stroke were randomized to receive standard rehabilitation+ electrical stimulation (ES) of wrist extensors for 30 min/day x 3x/week x 8 weeks (n=25) or to routine rehabilitation (n=23).
Change in isometric strength of wrist extensors was significantly greater in the ES group, at 8 and 32 weeks (p=0.004 and p=0.014). Grasp and grip scores on the Action Research Arm test had increased significantly in the ES group at 8 weeks (p=0.013 and p=0.02).
Electrical stimulation of wrist extensors and rehabilitation improved some elements of the ARAT when compared to usual rehabilitation.
Importance: This RCT examined the use of functional electrical stimulation (FES) of wrist extensors plus standard rehabilitation and compared it to routine rehabilitation. The 8-week course of FES significantly increased isometric strength of wrist extensors in selected acute stroke patients, 2-4 weeks post-stroke onset with MRC 4/5 wrist extensor strength. Grasp and grip was improved at 8 weeks but not at 32 weeks.
Changes in Disability from Baseline to End of Treatment
NS
NS
NS
p=.02
p=.013
0 2 4 6 8 10 12
ARAT Grasp
ARAT Grip
ARAT Pinch
ARAT gross
movement
Action Research Arm
Test (ARAT) Total
Me
as
ure
Change in Score (0 to 8 weeks)
Control
Treatment

91
Mirror Therapy Thieme H, Bayn M, Wurg M, Zange C, Pohl M, Behrens J. Mirror therapy for patients with severe arm paresis after stroke - a randomized controlled trial. Clin Rehabil 2013; 27(4): 314-324. Thieme H, Mehrholz J, Pohl M, Behrens J, Dohle C. Mirror therapy for improving motor function after stroke. Cochrane Database Syst Rev 2012; 3:CD008449.
Author / Year Country PEDro score
Methods Outcome
Thieme et al. 2013 Germany 8 (RCT)
60 patients, within 3 mos of 1st stroke, with severe paresis of arm randomized to 1 of 3 treatment groups: 1) individual mirror therapy, (2) group mirror therapy and (3) control intervention with restricted view on the affected arm. Patients in all groups received standard inpatient therapy. In all 3 groups, patients received a maximum of 30 minutes of mirror therapy or control therapy-a minimum of 20 sessions.
Although patients in all groups demonstrated modest improvements over treatment period, there were no significant differences among groups on the primary outcomes. After 5 wks, no significant group differences for motor function were found (P > 0.05). Pre–post differences for the Action Research Arm Test and Fugl-Meyer Test: individual mirror therapy: 3.4 (7.1) and 3.2 (3.8), group mirror therapy: 1.1 (3.1) and 5.1 (10.0) and control therapy: 2.8 (6.7) and 5.2 (8.7). However, there was significant improvement on Star Cancellation test for patients in individual mirror therapy compared to control group.a (P < 0.01).
Thieme et al Cochrane Database Syst Rev 2012
This Cochrane review evaluated14 studies comprising of 12 RCTs and 2 randomised cross-over trials. In cross-over trials, only the 1st period as a parallel group trial was analyzed. Included studies were performed to compare mirror therapy (provided by a mirror or a simultaneous video or virtual setup) with any other therapy modality, no therapy or sham therapy.
.
Effect on motor function: When compared with all other interventions, mirror therapy may have a significant effect on motor function (post-intervention data: SMD 0.61; 95% confidence interval (CI) 0.22 to 1.0; P = 0.002; change scores: SMD 1.04; 95% CI 0.57 to 1.51; P < 0.0001). Effects on motor function are influenced by type of control intervention. effects on motor function were stable at follow-up assessment after 6 months Effect on improvement on ADL: Mirror therapy has a significant effect on ADLs for patients with stroke, compared with all other interventions (SMD 0.33; 95% CI 0.05 to 0.60; P = 0.02; I2 = 15%, fixed-effect model). To note, results for ADLs are based on 4 studies Effect of pain relief: Mirror therapy has a significant effect on pain reduction for patients after stroke, compared with all other interventions (SMD -1.10; 95% CI -2.10 to -0.09; P = 0.03; I2 = 89%, random-effects model). this result is mainly based

92
on 2 studies that included only patients with CRPS-type I after stroke and should not be generalised to an unselected stroke patient population Effect of visuospatial neglect: Based on data from 1 study, there was significant effect of mirror therapy vs all other interventions on visuospatial neglect after stroke (SMD 1.22; 95% CI 0.24 to 2.19)
Importance: The RCT showed no significant effect on sensorimotor function ( FMA, ARAT) of the arm, activities of daily living (BI) and quality of life (SIS) of mirror therapy compared to a control intervention after stroke. However, there is significant effect on the use of mirror therapy in visuospatial neglect based on improvement on Star Cancellation Test.
The Cochrane Review showed that there is evidence for the effectiveness of mirror therapy for improving motor function for patients after stroke. However, effects on motor function are influenced by the type of control intervention. Therefore, mirror therapy could be applied as an additional intervention in the rehabilitation of patients after stroke, but no clear conclusion could be drawn if mirror therapy replaced other interventions for improving motor function of the arm. There is evidence that mirror therapy may improve activities of daily living and visuospatial neglect, but the results must be interpreted with cautiondue to small RCT studies. Significant effects on pain are only present in studies that included only patients with a CRPS-type 1 after stroke. Therefore, mirror therapy seems to be an effective intervention, both for improving motor function and reducing pain.for this subgroup of patients

93
Mental Practice Page SJ, Levine P, Leonard A. Mental Practice in Chronic Stroke: Results of a Randomized, Placebo Controlled Trial. Stroke 2007; 38:1293-1297.
Author / Year Country PEDro score
Methods Outcome
Page et al. 2007 USA 6 (RCT)
32 chronic stroke patients were randomly assigned to receive 30-min mental practice (MP) sessions (n=16) or a sham intervention consisting of 30 min of relaxation exercises (n=16), 2 days/wk for 6 weeks and were preceded by 30 min of standard therapy. Outcomes included the upper-extremity portion of the Fugl-Meyer Assessment (FM) and the Action Research Arm test (ARA).
The MP group improved significantly on the FM compared to the control group (+ 6.7 vs. + 1.0, p<0.0001) and the ARA (+ 7.8 vs.+ 0.44, p< 0.001).
Importance: This RCT showed mental practice improved motor recovery and ARAT when compared to a sham intervention.
Study name Outcome Statistics for each study Odds ratio and 95% CI
Odds Lower Upper
ratio limit limit Z-Value p-Value
Page et al., 2007 ARAT 2.894 0.802 10.445 1.623 0.105
Page et al., 2007 FMA 3.162 0.872 11.467 1.752 0.080
3.025 1.218 7.508 2.386 0.017
0.01 0.1 1 10 100
Meta Analysis

94
Robotic Upper Extremity Volpe BT, Krebs HI, Hogan N, Edelstein OL, Diels C, Aisen M. A novel approach to stroke rehabilitation: robot-aided sensorimotor stimulation. Neurology 2000; 54(10):1938-1944.
Author / Year Country PEDro score
Methods Outcome
Volpe et al. 2000 USA 6 (RCT)
56 patients with stroke and hemiparesis or hemiplegia received standard poststroke multidisciplinary rehabilitation, and were randomly assigned either to receive robotic training (at least 25 hours) or exposure to the robotic device without training. Patients were assessed before treatment began and at the end of treatment, with the upper extremity component of the Fugl-Meyer Motor Assessment, the Motor Status score, the Motor Power score, and Functional Independence Measurement.
At the end of treatment, the robot-trained group demonstrated improvement in motor outcome for the trained shoulder and elbow (Motor Power score, p< 0.001; Motor Status score, p< 0.01) that did not generalize to the untrained wrist and hand. The robot-treated group also demonstrated significantly improved functional outcome (Functional Independence Measurement–Motor, p< 0.01).
Median disability motor FIM scores improved significantly for upper extremity when compared to the control group.
p <.05
p< .001
p< .01
p< .0001
p< .01
NS
0
10
20
30
40
50
60
Robot-Trained Control Robot-Trained Control Robot-Trained Control
Before After Post-pretreatment intervaldifference
Me
dia
n D
isa
bil
ity S
co
res
Median Disability Scores for Control vs. Robot-trained Subjects
FIM Motor FIM Cognition

95
Importance: Robotic devices offer a novel ancillary approach to upper limb rehabilitation, particularly for sensorimotor stimulation. This study was one of the first non-pilot studies to assess the effectiveness of the intervention.

96
Robotic Upper Extremity Lo AC, Guarino PD, Richards LG, Haselkorn JK, Witterberg GI, Federman DG, Ringer RJ, Wagner TH, Krebs HJ, Volpe BT, Bever CT, Bravata DM, Duncan PW, Corn BH, Maffucci AD, Nadeau SE, Conroy SS, Powell JM, Huang GD, Peduzzi P. Robot-assisted therapy for long-term upper-limb impairment after stroke. N Engl J Med. 2010 May 13; 362(19):1772-83.
Author / Year Country PEDro score
Methods Outcome
Lo et al. 2010 USA 7 (RCT)
127 patients with moderate-to-severe upper-limb impairment 6 months or more after a stroke, were randomly assigned to receive intensive robot-assisted therapy (n=49), intensive comparison therapy (n=50), or to usual care (n=28). Therapy consisted of 36, 1-hour sessions over a period of 12 weeks. The primary outcome was the Fugl-Meyer Assessment (FM) at 12 weeks. Secondary outcomes were scores on the Wolf Motor Function Test and the Stroke Impact Scale. Secondary analyses assessed the treatment effect at 36 weeks.
At 12 weeks, subjects in the robot assisted group had gained more FM points, compared to subjects in the usual care group (1.11 vs. -1.06, p=0.08). Subjects in the intensive therapy group gained more FM points compared with subjects in the robot-assist group (4.01 vs. 3.87, p=0.92). No other treatment comparisons were significant at 12 weeks. No serious adverse events were reported.
Importance: The RCT showed that robot assisted theapy improved more than usual care but not more than an equally intensive comparison therapy group.

97
Botulinum Toxin for Focal Spasticity in the Upper Extremity Brashear A, McAfee AL, Kuhn ER, Fyffe J. Botulinum toxin type B in upper-limb poststroke spasticity: a double-blind, placebo-controlled study. Arch Phys Med Rehabil 2004; 85:705-709.
Author / Year Country PEDro score
Methods Outcome
Brashear et al. 2004 USA 7 (RCT)
15 stroke patients were randomized to receive a single Botox type B injection in the elbow, wrist, finger and thumb (n=10) or placebo (n=5). Measures were recorded at 2, 4, 8, 12 and 16 weeks.
There was no significant decrease in muscle tone in the elbow, wrist, or finger. A decrease in Ashworth scale scores was observed at the wrist at week 2 in the treatment group. Improvement was also observed at week 4 for the elbow (p=.039), wrist (p=.002), finger (p=.001) and thumb (p=.002) in the treatment gr. Improvements were not sustained.
Importance: Only two studies have evaluated the effectiveness of botulinum toxin B for upper-limb spasticity associated with stroke.

98
Botulinum Toxin for Focal Spasticity in the Upper Extremity McCrory P, Turner-Stokes L, Baguley RJ, De GS, Katrak P, Sandanam J, Davies L, Munns M, Hughes A. Botulinum toxin A for treatment of upper limb spasticity following stroke: a multi-centre randomized placebo-controlled study of the effects on quality of life and other person-centered outcomes. J Rehab Med 2009; 41:536-544.
Author / Year Country PEDro score
Methods Outcome
McCrory et al. 2009 Australia 9 (RCT)
96 patients an average of 5.9 years post stroke were randomized to receive either 500-1,000U botulinum toxin type A or placebo into the affected distal upper limb muscles on 2 occasions, 12 weeks apart. Assessment was undertaken at baseline, 8, 12, 20 and 24 weeks. The primary outcome measure was the Assessment of Quality of Life scale (AQoL) assessed at week 20. Secondary outcome assessments included Goal Attainment Scaling (GAS), pain, mood, global benefit, Modified Ashworth Scale (MAS), disability and carer burden.
There were no significant between group differences in AQoL change scores, pain, mood, disability or carer burden. However, patients treated with botulinum toxin type A had significantly greater reduction in spasticity (MAS) (p < 0.001), higher GAS scores (p < 0.01) and greater global benefit (p < 0.01).
Importance: Botulinum toxin injected into the distal upper extremity reduced spasticity but did not improve Assessment Quality of Life change scores, pain, mood, disability or caregiver burden. The BTx injection group had a higher GAS score.
Study name Outcome Statistics for each study Std diff in means and 95% CI
Std diff Standard Lower Upper
in means error Variance limit limit Z-Value p-Value
McCory et al., 2009 AQoL 0.116 0.206 0.042 -0.288 0.519 0.563 0.574
0.116 0.206 0.042 -0.288 0.519 0.563 0.574
-1.00 -0.50 0.00 0.50 1.00
McCory et al., 2009
Meta Analysis

99
Botulinum Toxin for Focal Spasticity in the Upper Extremity Shaw LC, Price CI, van Wijck FM, Shackley P, Steen N, Barnes MP et al. Botulinum Toxin for the Upper Limb after Stroke (BoTULS) Trial: Effect on impairment, activity limitation, and pain. Stroke 2011; 42(5):1371-1379.
Author / Year Country PEDro score
Methods Outcome
Shaw et al. 2011 UK 8 (RCT)
333 patients with at least 1 month post stroke with upper limb spasticity and reduced arm function were randomized to receive injection(s) with 100 – 200 U botulinum toxin type A plus a 4-week therapy program (n=170) or a therapy program alone (n=163). Repeat injection(s) and therapy were available at 3, 6, and 9 months. The primary outcome was successful outcome, defined as either a 3-point gain on the Action Research Arm Test (ARAT) for those with baseline scores of 0-3, a gain of at least 6 points for those with baseline scores of 4-51, and a final ARAT score of 57 for those with baseline scores of 52-57at 1 month. Secondary outcomes included measures of impairment, activity limitation, and pain at 1, 3, and 12 months.
There was no significant difference in the percentage of patients who has achieved a successful outcome: 25% of patients in the treatment group had achieved a successful outcomes compared with 19.5% of patients in the control group; P=0.232. Significant differences in favor of the intervention group were seen in muscle tone at 1 month; upper limb strength at 3 months; basic arm functional tasks (hand hygiene, facilitation of dressing) at 1, 3, and 12 months; and pain at 12 months.
Importance: RCT found that the botulinum toxin + therapy group trended towards improvement over a therapy alone group for a number of functional outcomes and pain in the upper extremity.
Study name Outcome Statistics for each study Odds ratio and 95% CI
Odds Lower Upper
ratio limit limit Z-Value p-Value
Shaw et al., 2011 ARAT 1.389 0.817 2.360 1.214 0.225
1.389 0.817 2.360 1.214 0.225
0.1 0.2 0.5 1 2 5 10
Favours A Favours B
Shaw et al., 2011
Meta Analysis

100
Botulinum Toxin for Focal Spasticity in the Upper Extremity Foley N, Pereira S, Salter K, Murie-Fernandez M, Speechley M, Meyer M, Sequeira K, Miller T, Teasell R. Treatment with botulinum toxin improves upper extremity function post stroke? A systematic review and meta-analysis.Archives Physical Medicine and Rehabilitation 2013; 94(5):977-989. 16 RCTs were identified, 10 of which reported sufficient data for inclusion in the pooled analysis (n=1000). Overall BTX-A was associated with a moderate treatment effect (standardized mean difference =.564+.094, 95% confidence interval = .352-.721, P<.0001).
Treatment Effect Sizes Grouped by Similarity of Outcome
Measure Outcome Type Standardized Mean Difference ( 95% Confidence Interval) and p value
Disability Assessment Scale Disability Scale
Scales developed specifically to assess response to treatment with BTx-A
0.688 (0.454 to 1.012) p<0.0001
Action Research Arm Test Motor Assessment Scale Motor Activity Log
Assessments of motor function
0.406 (0.85 to 0.727) p=0.013
Barthel Index Generalized disability 0.372 (-0.002 to 0.746) p=0.051
Importance: This meta-analysis showed that injections of Botulinum toxin A resulted in an improvement in a number of functional outcomes of the upper extremity post stroke.
Study name Outcome Time point Statistics for each study Std diff in means and 95% CI
Std diff Standard Lower Upper in means error limit limit p-Value
Brashear 2002 DAS 6 weeks 0.788 0.185 0.426 1.151 0.000
Kanovsky 2009 DAS 2 weeks 0.496 0.167 0.169 0.823 0.003
McCrory 2009 MMAS 8 weeks 0.278 0.207 -0.127 0.683 0.179
Suputtitada 2005 ARAT 8 weeks 1.051 0.390 0.288 1.814 0.007
Guo 2006 BI 4 weeks 0.485 0.262 -0.029 0.998 0.064
Jahangir 2007 BI 4 weeks 0.245 0.279 -0.301 0.791 0.380
Meythaler 2009 MAL 12 weeks 0.647 0.342 -0.023 1.317 0.058
Bhakta 2000 Disability Scale 6 weeks 0.797 0.329 0.153 1.441 0.015
Kahi 2010 (low) DAS 8 weeks 1.350 0.409 0.549 2.151 0.001
Kaji 2010 (high) DAS 8 weeks 0.560 0.254 0.061 1.058 0.028
Shaw 2011 ARAT 6 weeks 0.181 0.149 -0.111 0.473 0.225
0.536 0.094 0.352 0.721 0.000
-2.00 -1.00 0.00 1.00 2.00
Favours placebo Favours BT-A
Figure 2. Forest Plot of Estimated Treatment Effect Sizes

101
Study name Subgroup within study Outcome Statistics for each study Std diff in means and 95% CI
Std diff Standard Lower Upper
in means error Variance limit limit Z-Value p-Value
Chae et al., 1998 After T reatment FIM gain 0.150 0.378 0.143 -0.592 0.891 0.395 0.693
Chae et al., 1998 After T reatment Fugl-Meyer gain 0.803 0.393 0.154 0.033 1.573 2.045 0.041
Chae et al., 1998 Follow Up at 12 weeks FIM gain 0.048 0.378 0.143 -0.693 0.789 0.127 0.899
Chae et al., 1998 Follow Up at 12 weeks Fugl-Meyer gain 0.763 0.391 0.153 -0.004 1.530 1.949 0.051
Chae et al., 1998 Follow Up at 4 weeks FIM gain 0.050 0.378 0.143 -0.691 0.791 0.132 0.895
Chae et al., 1998 Follow Up at 4 weeks Fugl-Meyer gain 0.776 0.392 0.154 0.008 1.544 1.979 0.048
0.419 0.157 0.025 0.111 0.727 2.665 0.008
-1.00 -0.50 0.00 0.50 1.00
Chae et al., 1998
Functional Electrical Stimulation Chae J, Bethoux F, Bohine T, Dobos L, Davis T, Friedl A. Neuromuscular stimulation for upper extremity motor and functional recovery in acute hemiplegia. Stroke 1998; 29(5):975-979.
Author / Year Country PEDro score
Methods Outcome
Chae et al.1998 USA 6 (RCT)
46 acute stroke rehabilitation inpatients were randomized to receive surface neuromuscular stimulation to produce wrist and finger extension exercises in addition to routine rehabilitation (n=14) or to sham stimulation + routine rehabilitation (n=14), for 1 hr/day x 15 sessions. 18 subjects were excluded after randomization.
Treatment group had significantly greater gains in upper extremity Fugl-Meyer scores compared to controls immediately following treatment (13.1 vs. 6.5, p=0.05), at 4 weeks (17.9 vs. 9.7, p=0.05), but not at 12 weeks (20.6 vs. 11.2, p=0.06) following treatment.
Importance: RCT of FES of wrist and finger extension + rehabilitation improved motor recovery earlier but not later when compared to sham stimulation + rehabilitation.

102
Exercises and Hemiplegic Shoulder Pain Post Stroke Kumar R, Metter EJ, Mehta AJ, Chew T. Shoulder pain in hemiplegia. The role of exercise.Am J Phys Med Rehabil 1990; 69(4):205-208.
Author / Year Country PEDro score
Methods Outcome
Kumar et al. 1990 USA 5 (quasi-randomized controlled trial)
28 patients were randomized to receive a rehabilitation program of range of motion by therapist (ROMT) once a day, 5 days a week; or a rehabilitation program with use of skate board once a day, 5 days a week; or a rehabilitation program with use of overhead pulley once a day, 5 days a week while an inpatient on a stroke rehabilitation unit.
Significant difference in the incidence of pain reported between the groups. Shoulder pain was more common in the overhead pulley (63%) group than in the ROMT group (8%). ROM was significantly reduced in those patients who developed shoulder pain when compared to those who did not develop shoulder pain motion abduction, forward flexion, internal rotation and external rotation. Shoulder subluxation was found in 46% of all patients with no significant difference between treatment groups.
RCT of three shoulder exercises in hemiplegic shoulders with overheald pullies creating significantly more pain.
0
2
4
6
8
10
12
Nu
mb
er
of
Pa
tie
nts
ROMT SB OP
The Relationship Between the Incidence of Pain in 3
Exercise Groups
Pain No Pain ROMT=range of motion by therapist; SB=skateboard; OP=overhead pulley
103
Importance: This study was one of the first to investigate the effectiveness of three different exercise approaches aimed at the reduction of shoulder pain and the first to suggest that certain forms of aggressive physiotherapy might be harmful.
Study name Subgroup within study Outcome Statistics for each study Odds ratio and 95% CI
Odds Lower Upper ratio limit limit Z-Value p-Value
Kumar et al., 1990 OP vs. ROMT Developed Shoulder Pain 18.333 1.508 222.875 2.282 0.022
Kumar et al., 1990 OP vs. ROMT No Pain 6.600 0.543 80.235 1.481 0.139
Kumar et al., 1990 ROMT vs. OP Developed Shoulder Pain 0.055 0.004 0.663 -2.282 0.022
Kumar et al., 1990 ROMT vs. OP No Pain 0.152 0.012 1.842 -1.481 0.139
Kumar et al., 1990 ROMT vs. SB Developed Shoulder Pain 0.636 0.034 11.909 -0.302 0.762
Kumar et al., 1990 ROMT vs. SB No Pain 0.013 0.001 0.243 -2.906 0.004
Kumar et al., 1990 SB vs. OP Developed Shoulder Pain 0.086 0.007 1.084 -1.898 0.058
Kumar et al., 1990 SB vs. OP No Pain 11.667 0.922 147.563 1.898 0.058
0.624 0.249 1.564 -1.006 0.314
0.01 0.1 1 10 100
Favours A Favours B
Kumar et al., 1990

104
Cognitive Rehabilitation Post Stroke Risk Factors for Cognitive Problems Leys D, Henon H, Mackowiak-Cordoliani MP, Pasquier F, Poststroke dementia. Lancet Neurology 2005; 4:752-759. Treatment of HBP and Cognition Tzourio C, Anderson C, Chapman N, Woodward M, Neal B, MacMahon S, Chalmers J, PROGRESS Collaborative Group. Effects of blood pressure lowering with perindopril and indapamide therapy on dementia and cognitive decline in patients with cerebrovascular disease. Arch Intern Med 2003; 163(9):1069-1075. Diener HC, Sacco RL, Yusuf S, Cotton D, Ounpuu S, Lawton WA, Palesch Y, Martin RH, Albers GW, Bath P, Bornstein N, Chan BP, Chen ST, Cunha L, Dahlof B, De KJ, Donnan GA, Estol C, Gorelick P, Gu V, Hermansson K, Hilbrich L, Kaste M, Lu C, Machnig T, Pais P, Roberts R, Skvortsova V, Teal P, Toni D, VanderMaelen C, Voigt T, Weber M, Yoon BW. Effects of aspirin plus extended-release dipyridamole versus clopidogrel and telmisartan on disability and cognitive function after recurrent stroke in patients with ischaemic stroke in the Prevention Regimen for Effectively Avoiding Second Strokes (PRoFESS) trial: a double-blind, active and placebo-controlled study. Lancet Neurol 2008 Oct; 7(10):875-84. Feigen V, Ratanasabapathy Y, Anderson C. Does blood pressure lowering treatment prevent dementia or cognitive decline in patients with cardiovascular and cerebrovascular disease? J Neuro Sci 2005; 229-230:151-155. (meta-analysis) Cognitive Rehabilitation Cicerone KD, Dahlberg C, Kalmar K, Langenbahn DM, Malec JF, Bergquist TF, Felicetti T, Giacino JT, Harley JP, Harrington DE, Herzog J, Kneipp S, Laatsch L, Morse PA. Evidence-based cognitive rehabilitation: recommendations for clinical practice. Arch Phys Med Rehabil 2000; 81(12):1596-615. Cicerone KD, Dahlberg C, Malec JF, et al. Evidence-based cognitive rehabilitation: updated review of the literature from 1998 through 2002. Arch Phys Med Rehab 2005; 86:1681-92. Cicerone KD, Langenbahn DM, Braden C, Malec JF, Kalmar K, Fraas M, Felicetti T, Laatsch L, Harley JP, Bergquist T, Azulay J, Cantor J, Ashman T. Evidence-based cognitive rehabilitation:Updated review of the Literature from 2003 through 2008. Arch Phys Med Rehabil 2011; 92: 519-530. Remediation of Attention Deficits Barker-Collo SL, Feigin VL, Lawes CM, Parag V, Senior H, Rodgers A. Reducing attention deficits after stroke using attention process training: A randomized controlled trial. Stroke 2009; 40:3293-3298.

105
Electroacupuncture or TENS and Cognitive Functioning Post Stroke Chou P, Chu H, Lin JG. Effects of electroacupuncture treatment on impaired cognition and quality of life in Taiwanese stroke patients. J Altern Complement Med 2009; 15(10):1067-1073. Medications for Vascular Dementia Donepezil for Vascular Dementia Black S, Roman GC, Geldmacher DS, Salloway S, Hecker J, Burns A, Perdomo C, Kumar D, Pratt R. Efficacy and tolerability of donepezil in vascular dementia: Positive results of a 24-week, multicenter, international, randomized, placebo-controlled clinical trial. Stroke 2003; 34(10):2323-2330. Wilkinson D, Doody R, Helme R, Taubman K, Mintzer J, Kertesz A, Pratt RD;Donepezil 308 Study Group. Donepezil in vascular dementia: a randomized, placebo-controlled study. Neurology 2003; 61(4):479-486. Roman GC, Salloway S, Black SE, Royall DR, DeCarli C, Weiner MW et al. Randomized, placebo-controlled, clinical trial of donepezil in vascular dementia: differential effects by hippocampal size. Stroke 2010; 41(6):1213-1221. Galantamine in Treatment of Vascular Dementia Erkinjuntti T, Kurz A, Gauthier S, Bullock R, Lilienfeld S, Damaraju CV. Efficacy of galantamine in probable vascular dementia and Alzheimer's disease combined with cerebrovascular disease: a randomised trial. Lancet 2002; 359:1283-1290. Memantine and the Treatment of Vascular Dementia Orgogozo JM, Rigaud AS, Stoffler A, Mobius HJ, Forette F. Efficacy and safety of memantine in patients with mild to moderate vascular dementia: a randomized, placebo-controlled trial (MMM 300). Stroke 2002; 33:1834-1839. Wilcock G, Mobius HJ, Stoffler A. A double-blind, placebo-controlled multicentre study of memantine in mild to moderate vascular dementia (MMM500). Int Clin Psychopharmacol 2002; 17:297-305. Apraxia Therapy Donkervoort M, Dekker J, Stehmann-Saris FC, Deelman BG. Efficacy of strategy training in left hemisphere stroke patients with apraxia: A randomized clinical trial. Neuropsychological Rehabilitation 2001; 11(5):549-566. Impact of Visual Perceptual Impairment on Rehabilitation Lincoln NB, Drummond AE, Berman P. Perceptual impairment and its impact on rehabilitation outcome. SUE Study Group. Disabil Rehabil 1997; 19:231-234.

106
Visual Perceptual Deficits/Neglect and Visual Scanning Strategies
Weinberg J, Diller L, Gordon WA, Gerstman LJ, Lieberman A, Lakin P, Hodges G, Ezrachi O. Visual scanning training effect on reading-related tasks in acquired right brain damage. Arch Phys Med Rehabil 1977; 58:479-486. Weinberg J, Diller L, Gordon WA, Gerstman LJ, Lieberman A, Lakin P, Hodges G, Ezrachi O. Training sensory awareness and spatial organization in people with right brain damage. Arch Phys Med Rehabil 1979; 60:491-496. Paolucci S, Antonucci G, Guariglia C, Magnotti L, Pizzamiglio L, Zoccolotti P. Facilitatory effect of neglect rehabilitation on the recovery of left hemiplegic stroke patients: a cross-over study. J Neurol 1996; 243:308-314. Trunk Rotation and Visual Scanning Wiart L, Come AB, Debelleix X, Petit H, Joseph PA, Mazaux JM, Barat M. Unilateral neglect syndrome rehabilitation by trunk rotation and scanning training. Arch Phys Med Rehabil 1997; 78:424-429. Activation Strategy for Visual Neglect Kalra L, Perez I, Gupta S, Wittink M. The influence of visual neglect on stroke rehabilitation. Stroke 1997; 28:1386-1391.
Robertson IH, McMillan TM, MacLeod E, Edgeworth J, Brock D. Rehabilitation by limb activation training reduces left-sided motor impairment in unilateral neglect patients: A single-blind randomised control trial. Neuropyschological Rehabilitation 2002; 12:439-454. Prisms Rossi PW, Khegfets S, Reding MJ. Fresnel prisms improve visual perception in stroke patients with homonymous hemianopsia or unilateral visual neglect. Neurology 1990; 40:1597-1599. Mizuno K, Tsuji T, Takebayashi T, Fujiwara T, Hase K, Liu M. Prism Adaptation Therapy Enhances Rehabilitation of Stroke Patients With Unilateral Spatial Neglect: A Randomized, Controlled Trial. Neurorehabil Neural Repair 2011; 25(8):711-20. Aphasia Lincoln NB, McGuirk E, Mulley GP, Lendrem W, Jones AC, Mitchell JR. Effectiveness of speech therapy for aphasic stroke patients.A randomised controlled trial. Lancet 1984; 1:1197-1200. Intensity of Aphasia Therapy Bhogal K, Teasell R, Speechley M. Intensity of aphasia therapy, impact on recovery. Stroke 2003; 34(4):987-993. Trained Volunteers Treating Aphasia

107
Marshall RC, Wertz RT, Weiss DG, Aten JL, Brookshire RH, Garcia-Bunuel L, Holland AL, Kurtzke JF, LaPointe LL, Milianti FJ. Home treatment for aphasic patients by trained nonprofessionals. J Speech Hear Disord 1989; 54:462-470. Supported Conversation for Aphasia Kagan A, Black SE, Duchan JF, Simmons-Mackie N, Square P. Training volunteers as conversation partners using “supported conversation for adults with aphasia” (SCA): A controlled trial. Journal of Speech, Language and Hearing Research 2001; 44:624-637.
Treatment of Word-Retrieval Deficits in Aphasia Rehabilitation Doesborgh SJC, van de Sandt-Koenderman MWE, Dippel DW, van Harskamp F, Koustall PJ, Visch-Brink EG.Effects of semantic treatment on verbal communication and linguistic processing in aphasia after stroke.A randomized controlled trial. Stroke 2004; 35:141-146. de Jong-Hagelstein M, van de Sandt-Koenderman WM, Prins ND, Dippel DW, Koudstaal PJ, Visch-Brink EG. Efficacy of early cognitive-linguistic treatment and communicative treatment in aphasia after stroke: a randomised controlled trial (RATS-2). J Neurol Neurosurg Psychiatry 2011; 82(4):399-404.

108
Risk Factors for Cognitive Problems Leys D, Henon H, Mackowiak-Cordoliani MP, Pasquier F, Poststroke dementia. Lancet Neurology 2005; 4:752-759. Leys et al. (2005) reported that hypertension has been established as a risk factor for vascular dementia, but not necessarily for post stroke dementia, that is, “all types of dementia that happen after stroke”. While diabetes mellitus and atrial fibrillation have been identified “in several studies” as independent risk factors for post stroke dementia, the role or influence of hyperlipidaemia, hyperhomocysteinaemia, alcohol consumption, and cigarette smoking has not been clearly delineated (Leys et al. 2005).

109
Treatment of HBP and Cognition PROGRESS Trial Tzourio C, Anderson C, Chapman N, Woodward M, Neal B, MacMahon S, Chalmers J, PROGRESS Collaborative Group. Effects of blood pressure lowering with perindopril and indapamide therapy on dementia and cognitive decline in patients with cerebrovascular disease. Arch Intern Med 2003; 163(9):1069-1075.
Author / Year Country PEDro score
Methods Outcome
PROGRESS Tzourio et al. 2003 International 8 (RCT)
6105 patients with stroke or transientischemic attack within the previous 5 years were included in this randomized, double-blind, placebo-controlledtrial. There were no blood pressure criteria for study entry. Participants who tolerated and adhered to at least 4 wks oftherapy with perindopril were randomly assigned, in adouble-blind manner, to continued active treatment or matchingplacebo. Active treatmentcomprised a flexible treatment regimen based on perindoprilwith the addition of indapamidein those participants for whomthe responsible study physician believed that there was no specificindication for, nor contraindication to, the use of a diuretic.
During a mean follow-up of 3.9 years, dementiawas documented in 193 (6.3%) of the 3051 randomized participantsin the actively treated group and 217 (7.1%) of the 3054 randomizedparticipants in the placebo group. Cognitivedecline occurred in 9.1% of the actively treated group and 11.0%of the placebo group (p=0.01). The risks of the composite outcomes ofdementia with recurrent stroke and of cognitive decline withrecurrent stroke were reduced by 34% (p = .03) and 45% (p<.001), respectively. Combination therapy was more effective in reducing the risk for dementia than monotherapy (23% vs. –8%).
Importance: Lowering blood pressure with the use of perindopril +/- indapamide (diuretic) reduces the risk of cognitive decline post stroke when compared to placebo; combination therapy was more effective than monotherapy.
Study name Outcome Statistics for each study Odds ratio and 95% CI
Odds Lower Upper
ratio limit limit Z-Value p-Value
PROGRESS Collaboration, 2003 DSM-IV 0.883 0.722 1.079 -1.216 0.224
PROGRESS Collaboration, 2003 MMSE 0.810 0.685 0.958 -2.459 0.014
0.839 0.738 0.955 -2.667 0.008
0.5 1 2
PROGRESS Collaboration 2003
Meta Analysis

110
Treatment of HBP and Cognition PRoFESS Trial Diener HC, Sacco RL, Yusuf S, Cotton D, Ounpuu S, Lawton WA, Palesch Y, Martin RH, Albers GW, Bath P, Bornstein N, Chan BP, Chen ST, Cunha L, Dahlof B, De KJ, Donnan GA, Estol C, Gorelick P, Gu V, Hermansson K, Hilbrich L, Kaste M, Lu C, Machnig T, Pais P, Roberts R, Skvortsova V, Teal P, Toni D, VanderMaelen C, Voigt T, Weber M, Yoon BW. Effects of aspirin plus extended-release dipyridamole versus clopidogrel and telmisartan on disability and cognitive function after recurrent stroke in patients with ischaemic stroke in the Prevention Regimen for Effectively Avoiding Second Strokes (PRoFESS) trial: a double-blind, active and placebo-controlled study. Lancet Neurol 2008 Oct; 7(10):875-84.
Author / Year Country PEDro score
Methods Outcome
PRoFESS Study Group Diener et al. 2008 10 (RCT)
20,332 patients with ischemic stroke within 90 days of within trial entry were randomly assigned to treatment (80 mg/day telmisartan, n=10,146) or matching placebo (n=10,186). All patients received open-label treatment for hypertension as necessary at the discretion of the investigators. 880 patients in the telmisartan condition and 934 patients in the placebo condition experienced recurrent stroke. Cognitive function was evaluated using the MMSE one month after randomization, at 2 years and at the next-to-last visit.
For many patients the 2-year follow-up coincided with the penultimate visit. Over time, there were no significant between group differences found in MMSE scores for individuals receiving placebo vs. telmisartan. Relative risk for MMSE score ≤24 points associated with treatment with telmisartan vs. placebo was 1.01 (95% CI 0.94-1.09). Although there were fewer individuals with MMSE decline of 3 points or more in the telmisartan group, this difference was not significant (RR=0.95, 95% CI 0.87-1.05). Results from a PRoFESS substudy of cognition are pending.
Importance: Although there are trends toward less MMSE decline in patients receiving telmarsartin when compared to placebo, it did not reach clinical significance.
Study name Subgroup within study Outcome Statistics for each study Odds ratio and 95% CI
Odds Lower Upper
ratio limit limit Z-Value p-Value
Diener et al., 2008 ASA+ER-DP vs Clopidogrel BI 1.134 0.933 1.378 1.265 0.206
Diener et al., 2008 ASA+ER-DP vs Clopidogrel MMSE 0.898 0.810 0.996 -2.045 0.041
Diener et al., 2008 ASA+ER-DP vs Clopidogrel mRS 0.805 0.610 1.062 -1.536 0.124
Diener et al., 2008 Telmisartan vs Placebo BI 1.036 0.853 1.259 0.357 0.721
Diener et al., 2008 Telmisartan vs Placebo MMSE 0.948 0.856 1.051 -1.008 0.313
Diener et al., 2008 Telmisartan vs Placebo mRS 1.151 0.874 1.517 1.000 0.317
0.957 0.900 1.017 -1.422 0.155
0.5 1 2
Diener et al., 2008
Meta Analysis

111
Treatment of HBP and Cognition Feigen V, Ratanasabapathy Y, Anderson C. Does blood pressure lowering treatment prevent dementia or cognitive decline in patients with cardiovascular and cerebrovascular disease? J Neuro Sci 2005; 229-230:151-155(meta-analysis).
Author / Year Country PEDro score
Methods Outcome
FeiginV, Ratnasabapathy Y, Anderson C. 2005 No PEDroscore (meta-analysis)
A systematic search was performed on RCTs on preventive effects of blood pressure lowering treatmenton dementia and /or cognitive decline in patients with vascular diseases. Results of 4 out of 6 potentially eligible studies were pooled for meta-analysis.
4 studies (PROGRESS, SCOPE, SHEP, and Syst-Eur)* were included in the meta-analysis.Total events (dementia and/or cognitive decline) per total patients were 410/11794 in the treatment group and 473/ 11711 in the control group. The random relative risk RR (95% CI) is 0.80(0.63 to 1.02). *PROGRESS: Tzourio et al, 2003 (pg 106) SCOPE: Lithell et al, 2003 SHEP: Di Bari et al, 2001 Syst-Eur: Forrette et al, 1998
Importance: The meta-analysis showed that blood pressure lowering treatment result in 20% relative risk reduction of dementia or cognitive decline in patients with vascular disease, but this effect was not statisticaly significant.

112
Cognitive Rehabilitation Cicerone KD, Dahlberg C, Kalmar K, Langenbahn DM, Malec JF, Bergquist TF, Felicetti T, Giacino JT, Harley JP, Harrington DE, Herzog J, Kneipp S, Laatsch L, Morse PA. Evidence-based cognitive rehabilitation: recommendations for clinical practice. Arch Phys Med Rehabil 2000; 81(12):1596-615. Cicerone KD, Dahlberg C, Malec JF, et al. Evidence-basedcognitive rehabilitation: updated review of the literature from1998 through 2002. Arch Phys Med Rehab 2005; 86:1681-92. Cicerone KD, Langenbahn DM, Braden C, Malec JF, Kalmar K, Fraas M, Felicetti T, Laatsch L, Harley JP, Bergquist T, Azulay J, Cantor J, Ashman T. Evidence-based cognitive rehabilitation: Updated review of the Literature from 2003 through 2008. Arch Phys Med Rehabil 2011; 92: 519-530.
Author / Year Country PEDro score
Methods Outcome
Cicerone et al, 2011 No PEDro score (meta-analysis)
Clinical recommendations for cognitive rehabilitation for individuals with stroke and traumatic brain injury (TBI) were made based on systematic review of the literature from 2003 through 2008. Articles were assigned to 1 of 6 categories reflecting the primary area of intervention: attention; vision and visuospatial functioning; language and communication skills; memory; executive functioning, problem solving and awareness; and comprehensive-holistic cognitive rehabilitation. Articles were abstracted and levels of evidence determined using specific criteria. Evidence within each area of intervention was synthesized and recommendations for Practice Standards, Practice Guidelines, and Practice Options were made.
Based on the evidence on stroke patients, the panel has recommendedPractice Standards/Guidelines /Options for stroke population. Practice standards: Visuospatial rehabilitation that includes visual scanning training for left visual neglect is recommended after right hemisphere stroke. Cognitive-linguitic therapies are recommended during acute and postacute rehabilitation for language deficits secondary to left hemispehere stroke Specific gestural or strategy training is recommened for apraxia during acute rehabilitation for left hemispehere stroke.
Importance: For the stroke population, the most recent synthesis of evidence of literature on cognitive rehabilitation supports visuospatialrehabilitation after right hemisphere stroke, and interventions for aphasia and apraxia for left hemisphere stroke.

113
Remediation of Attention Deficits Barker-Collo SL, Feigin VL, Lawes CM, Parag V, Senior H, Rodgers A. Reducing attention deficits after stroke using attention process training: A randomized controlled trial. Stroke 2009; 40:3293-3298.
Author / Year Country PEDro score
Methods Outcome
Barker-Collo, 2009 New Zealand 8 (RCT)
78 acute stroke patients with attention deficits identified by neuropsychological assessment. Participants were randomly allocated to standard care plus 30 hours of Attention Process Training (APT) or standard care alone. APT training consisted on 1 hour sessions prvided for a total of 4 weeks. The primary outcome was Integrated Visual Auditory Continuous Performance Test Full-Scale Attention Quotient (IVA-CPT).
Patients in the intervention group performed significantly better on the primary outcome, as compared to patients in the control group (p< 0.05). No other significant differences were reported between the two groups.
Importance: Stroke patients with attention deficits who received an additional 30 hours of attention process training improved more when compared to a standard care group.
Study name Subgroup within study Outcome Statistics for each study Std diff in means and 95% CI
Std diff Standard Lower Upper in means error Variance limit limit Z-Value p-Value
Barker-Collo et al., 2009 Change from baseline at 5 weeks Bell Center 0.217 0.166 0.028 -0.110 0.543 1.301 0.193
Barker-Collo et al., 2009 Change from baseline at 5 weeks Bell Left 0.100 0.166 0.028 -0.225 0.426 0.605 0.545
Barker-Collo et al., 2009 Change from baseline at 5 weeks Bell Right 0.138 0.166 0.028 -0.188 0.463 0.829 0.407
Barker-Collo et al., 2009 Change from baseline at 5 weeks SF-36 (MCS) 0.192 0.166 0.028 -0.134 0.518 1.155 0.248
Barker-Collo et al., 2009 Change from baseline at 5 weeks SF-36 (PCS) 0.143 0.166 0.028 -0.182 0.469 0.863 0.388
Barker-Collo et al., 2009 Change from baseline at 6 weeks Bell Center 0.099 0.167 0.028 -0.229 0.427 0.590 0.555
Barker-Collo et al., 2009 Change from baseline at 6 weeks Bell Left 0.303 0.168 0.028 -0.027 0.633 1.802 0.071
Barker-Collo et al., 2009 Change from baseline at 6 weeks Bell Right 0.126 0.167 0.028 -0.202 0.455 0.755 0.450
Barker-Collo et al., 2009 Change from baseline at 6 weeks CFQ TOTAL 0.305 0.168 0.028 -0.024 0.635 1.815 0.069
Barker-Collo et al., 2009 Change from baseline at 6 weeks GHQ-28 0.036 0.167 0.028 -0.292 0.363 0.213 0.832
Barker-Collo et al., 2009 Change from baseline at 6 weeks MRS TOTAL SCORE 0.189 0.168 0.028 -0.140 0.517 1.126 0.260
Barker-Collo et al., 2009 Change from baseline at 6 weeks SF-36 (MCS) 0.018 0.167 0.028 -0.310 0.346 0.108 0.914
Barker-Collo et al., 2009 Change from baseline at 6 weeks SF-36 (PCS) 0.189 0.168 0.028 -0.139 0.518 1.128 0.259
0.158 0.046 0.002 0.067 0.249 3.406 0.001
-1.00 -0.50 0.00 0.50 1.00
Barker-Collo et al., 2009

114
Electroacupuncture or TENS and Cognitive Functioning Post Stroke Chou P, Chu H, Lin JG. Effects of electroacupuncture treatment on impaired cognition and quality of life in Taiwanese stroke patients. J Altern Complement Med 2009; 15(10):1067-1073.
Author / Year Country PEDro score
Methods Outcome
Chou et al. 2009 China 6 (RCT)
383 patients with chronic stroke (MMSE<24) were randomly assigned to receive either electroacupuncture or sham TENS (no real electrical current) treatments. Treatment was provided 20-minute sessions, twice per week for a total of 8 weeks. All patients participated in conventional rehabilitation for one month following randomization. Treatment (and sham treatments) was initiated 35-40 days from baseline. All patients continued conventional rehabilitation for the 8-week intervention period. Assessment was conducted at baseline, and following the end of intervention (8 weeks). The Loewenstein Occupational Therapy Cognitive Assessment for geriatric populations (LOTCA-G) was used to assess cognitive function.
In the treatment group, there was significant improvement from baseline to 8 weeks on the following LOTCA-G subscores; orientation (p=0.003), perception (p=0.001), praxis (p=0.002) and memory (p=0.005). At 8 weeks, comparisons between the intervention and control groups demonstrated improved cognition in favour of treatment in the following areas; orientation (p=0.001), perception (p=0.04), praxis (p=0.004) and attention (p=0.045).
Importance: Electroacupuncture improved cognition in chronic stroke patients when compared to sham TENS.

115
Medications for Vascular Dementia
Donepezil for Vascular Dementia Black S, Roman GC, Geldmacher DS, Salloway S, Hecker J, Burns A, Perdomo C, Kumar D, Pratt R. Efficacy and tolerability of donepezil in vascular dementia: Positive results of a 24-week, multicenter, international, randomized, placebo-controlled clinical trial. Stroke 2003; 34(10):2323-2330.
Author / Year Country PEDro score
Methods Outcome
Black et al. 2003 International 7 (RCT)
603 patients with probable (70.5%) or possible (29.5%) VaD were randomized to 24 weeks of treatment with donepezil 5 mg/d, donepezil 10 mg/d (5 mg/d for first 28 days),or placebo.
At week 24, both donepezil groups showed significantimprovement in cognition versus placebo on the Alzheimer’sDisease Assessment Scale–cognitive subscale. Significant improvementsin global function were seen versus placeboat week 24, on the Clinician’s Interview-BasedImpression of Change–Plus version only for patients ondonepezil 5 mg/d, and on the Sum of the Boxes of theClinical Dementia Rating only for patients on 10 mg/d.Donepezil-treated patients showed significant benefits in activitiesof daily living over placebo on the Alzheimer’s DiseaseFunctional Assessment and Change Scale. Withdrawal rates due to adverse events were relatively low (placebo,11.1%; donepezil 5 mg/d, 11.1%; donepezil 10 mg/d, 21.8%; P=0.005versus placebo).
Significant improvementsin global function were seen versus placeboat week 24, on the Clinician’s Interview-BasedImpression of Change–Plus version only for patients ondonepezil 5 mg/d, and on the Sum of the Boxes of theClinical Dementia Rating only for patients on 10 mg/d.
Comparison of CIBIC*-plus Ratings across Treatment Groups
(Week 24 Observed Cases)
Note: p<0.05 for
overall Donepezil
treatment vs.
placebo
0%
10%
20%
30%
40%
50%
M arked
Improvement
M oderate
Improvement
M inimal
Improvement
No Change M inimal
Worsening
M oderate
Worsening
M arked
Worsening
CIBIC*-plus Category
*Clinician's Interview-Based Impression of Change
% o
f P
ati
en
ts
Placebo
Donepezil (5 mg)
Donepezil (10 mg)

116
Importance: Donepezil resulted in an improvement in activities of daily living when compared to placebo. Higher dose (10 mg/day) resulted in more adverse effects when compared to placebo.

117
Donepezil for Vascular Dementia Wilkinson D, Doody R, Helme R, Taubman K, Mintzer J, Kertesz A, Pratt RD;Donepezil 308 Study Group. Donepezil in vascular dementia: a randomized, placebo-controlled study. Neurology 2003; 61(4):479-486.
Author / Year Country PEDro score
Methods Outcome
Wilkinson et al. 2003 International 7 (RCT)
616 patients with probable or possible VaD, were randomized to receive donepezil 5 mg/day, donepezil 10 mg/day (after 5 mg/day for the first 28 days), or placebo for 24 weeks.
76% of patients had probable VaD. Both donepezil-treated groups showed significant improvements in cognitive function on the Alzheimer’s Disease Assessment Scale–cognitive subscale compared with placebo. Greater improvements on the Clinician’s Interview-Based Impression of Change–plus version were observed with both donepezil groups compared to the placebo group. Withdrawal rates due to adverse events were low (placebo, 8.8%; donepezil 5 mg, 10.1%; 10 mg, 16.3%).
Importance: Donepezil resulted in an improvement in cognitive function when compared to placebo. Higher dose (10 mg/day) resulted in more adverse effects when compared to placebo.

118
Donepezil for Vascular Dementia Roman GC, Salloway S, Black SE, Royall DR, DeCarli C, Weiner MW et al. Randomized, placebo-controlled, clinical trial of donepezil in vascular dementia: differential effects by hippocampal size. Stroke 2010; 41(6):1213-1221.
Author / Year Country PEDro score
Methods Outcome
Roman et al. 2010 International 7 (RCT)
974 patients with possible or probable VaD were randomized (2:1) to receive either treatment with donepezil 5 mg/day (n=648) or matching placebo (n=326). 77.5% and 76.7% of individuals in the treatment and control conditions, respectively, had a history of stroke or TIA at baseline. Primary outcome measures were the Vascular AD Assessment Scale – Cognitive Subscale (V-ADAS-Cog) and the Clinician’s Interview-Based Impression of Change + carer’s interview (CIBIC-plus). Assessments were conducted at baseline and weeks 6, 12, 18 and 24 (end of study).
Patients in the treatment condition demonstrated significant improvement from baseline when compared to the placebo condition at all assessment points except week 6 (p<0.05). CIBIC-plus scores were not significantly different between groups (p=0.23), but analysis of score distribution favoured treatment at 18 and 24 weeks. Examination of secondary outcomes revealed significant differences favouring donepezil at end of study on the ADAS-cog (p=0.046), MMSE (p=0.03) and NCT (p=0.039). A similar trend toward significance was demonstrated on the Disability Assessment for Dementia (DAD) (p=0.059).
Importance: Among patients with dementia of the Alzheimer’s type, the use of donepezil has been well studied. The effectiveness of donepezil among patients with vascular dementia has been the subject of 2 large randomized controlled trials of which this is one. Recent meta-analyses of the results from these two RCTs (Passmore et al. 2005, Malouf and Birks 2004) have reported that the use of donepezil in patients with mild to moderate vascular cognitive impairment is associated with significant improvements in cognitive and global function, including improvements in the performance of activities of daily living.

119
Galantaminein Treatment of Vascular Dementia Erkinjuntti T, Kurz A, Gauthier S, Bullock R, Lilienfeld S, Damaraju CV. Efficacy of galantamine in probable vascular dementia and Alzheimer's disease combined with cerebrovascular disease: a randomised trial. Lancet 2002; 359:1283-1290.
Author, Year Country
Pedro Score
Methods Outcome
Erkinjuntti et al. 2002 International 8 (RCT)
592 patients with probable vascular dementia or mixed dementia (AD+ cerebrovascular disease) were randomly assigned to receive either 24 mg/day galantamine (n=396) or matching placebo (n=196). Treatment continued for a period of 6 months.
Overall, patients treated with galantamine showed significant improvement on the ADAS-cog when compared to the placebo group (p<0.0001). Treatment with galantamine resulted in significant improvements when compared to placebo among patients with AD+CVD (p<0.0005) but not among patients with vascular dementia (p<0.06). The same pattern was reported for assessment on the Clinician’s Interview-based Impression of Change Plus scale. 74% of treatment group patients remained stable or improved on the CIBIC-plus vs. 59% of those in the placebo group (p=0.011) However, on subgroup analysis, the change seen among treated patients was not significantly different than for untreated patients (p=0.238) when taking only patients with vascular dementia into consideration.
Importance: Galantamine resulted in significant improvement in cognition for mixed dementia and came within a whisker of significance (p<.06) for vascular dementia when compared to placebo.
Study name Outcome Statistics for each study Odds ratio and 95% CI
Odds Lower Upper
ratio limit limit Z-Value p-Value
Erkinjuntti et al., 2002 CIBIC 0.808 0.574 1.139 -1.218 0.223
0.808 0.574 1.139 -1.218 0.223
0.1 0.2 0.5 1 2 5 10
Erkinjuntti et al., 2002
Meta Analysis

120
Memantine and the Treatment of Vascular Dementia Orgogozo JM, Rigaud AS, Stoffler A, Mobius HJ, Forette F. Efficacy and safety of memantine in patients with mild to moderate vascular dementia: a randomized, placebo-controlled trial (MMM 300). Stroke 2002; 33:1834-1839.
Author, Year
Country Pedro Score
Methods Outcome
Orgogozo et al. 2002 France 8 (RCT)
321 patients with probable vascular dementia were randomly allocated to treatment (n=165) or control (n=156) groups. Patients in the treatment condition received 20 mg/day while control patients received a matching placebo. Treatment continued for 28 weeks.
At 28 weeks, patients in the treatment condition had demonstrated improvement on the ADAS-cog while patients in the control condition declined. The difference between groups was significant (95% CI 0.49 – 3.60). On the Clinician’s Interview Based Impression of Change-Plus (CIBIC-plus), 60% of patients in the treatment condition were assessed as improved or stable vs. 52% in the placebo group (p=0.227). Scores on the MMSE were improved in the treatment group, but deteriorated in the placebo group (p=0.003). Assessment of intellectual function and of behaviour also demonstrated differences in favour of treatment (p=0.04 & p=0.07 respectively). A similar number of adverse events were reported in each condition.
Importance: Memantine resulted in improvements in cognition, intellectual functional and behaviour when compared to placebo in patients with probable vascular dementia.
Study name Outcome Statistics for each study Std diff in means and 95% CI
Std diff Standard Lower Upper
in means error Variance limit limit Z-Value p-Value
Orgogozo et al., 2002 ADAS-cog 0.479 0.135 0.018 0.214 0.744 3.545 0.000
Orgogozo et al., 2002 CIDIC-plus 0.202 0.133 0.018 -0.058 0.462 1.521 0.128
0.338 0.095 0.009 0.152 0.524 3.569 0.000
-1.00 -0.50 0.00 0.50 1.00
Orgogozo et al., 2002
Meta Analysis

121
Memantine and the Treatment of Vascular Dementia Wilcock G, Mobius HJ, Stoffler A. A double-blind, placebo-controlled multicentre study of memantine in mild to moderate vascular dementia (MMM500). Int Clin Psychopharmacol 2002; 17:297-305.
Author, Year
Country Pedro Score
Methods Outcome
Wilcock et al. 2002 UK 8 (RCT)
548 patients with probable vascular dementia and MMSE scores of 10 –22 were randomly assigned to treatment with 20 mg/day (10 mg twice daily) memantine (n=295) or matching placebo (n=284). Treatment duration was 28 weeks. Primary efficacy outcomes were assessed via the ADAS-cog and the Clinical Global Impression of Change (CGIC).
At 6 months, scores on the ADAS-cog showed significantly less decline among patients treated with memantine vs, placebo (95% CI –3.023 to –0.49). There was no significant difference reported between groups on the CGIC. Subgroup analysis demonstrated that the largest treatment effects were among patients with baseline MMSE scores less than 15 and in those with no cerebrovascular macrolesions. No serious adverse events were reported and the frequency of reporting was similar between treatment conditions.
Importance: Patients with probable vascular dementia showed less cognitive decline on memantine when compared to placebo.
Study name Outcome Statistics for each study Std diff in means and 95% CI
Std diff Standard Lower Upper
in means error Variance limit limit Z-Value p-Value
Wilcock et al., 2002 ADAS-cog 0.236 0.087 0.008 0.065 0.408 2.705 0.007
0.236 0.087 0.008 0.065 0.408 2.705 0.007
-0.50 -0.25 0.00 0.25 0.50
Wilcock et al., 2002
Meta Analysis

122
Apraxia Therapy Donkervoort M, Dekker J, Stehmann-Saris FC, Deelman BG. Efficacy of strategy training in left hemisphere stroke patients with apraxia: A randomized clinical trial. Neuropsychological Rehabilitation 2001; 11(5):549-566.
Author / Year Country PEDro score
Methods Outcome
Donkervoort et al. 2001 Netherlands 8 (RCT)
113 patients with apraxia secondary to left hemisphere stroke were randomly assigned to either strategy training integrated in usual OT or to regular OT. Strategy training involved the use of strategies to compensate for the apraxic impairment during the performance of ADL. Usual OT concentrated on sensory, motor, perceptual and cognitive deficits of the stroke patients and increasing independent functioning in ADL task. Patients underwent 8 weeks of treatment.
After 8 weeks of treatment, strategy training group improved significantly more than controls on ADL observations and on the Barthel ADL. No significant differences between the groups were noted at the 5 month follow-up.
Strategy training for apraxia resulted in improved ADL scores when compared to usual treatment.
p=.03
p<.01
NS
NS
0
0.5
1
1.5
2
2.5
ADL observations Barthel ADL index ADL judgement (OT) ADL judgement (PT)
Mean
Po
st-
treatm
en
t O
utc
om
e
Measu
re V
alu
es f
rom
ba
seli
ne
to
8 w
eeks
Outcome Measures
Outcome Measures for Strategy Training vs. Usual treatment
Strategy Training Usual Treatment

123
Importance: The study by Donkervoort et al. (2001) is the most recent and largest randomized controlled trial to assess the effectiveness of strategy training in the treatment of apraxia following left hemisphere stroke. Further studies are required and assessment of transfer of training effects to untrained activities is recommended.
Study name Outcome Statistics for each study Std diff in means and 95% CI
Std diff Standard Lower Upper
in means error Variance limit limit Z-Value p-Value
Donkervoort et al., 2001 ADL observations 0.677 0.227 0.052 0.231 1.123 2.977 0.003
0.677 0.227 0.052 0.231 1.123 2.977 0.003
-2.00 -1.00 0.00 1.00 2.00
Donkervoort et al., 2001
Meta Analysis

124
Impact of Visual Perceptual Impairment on Rehabilitation Lincoln NB, Drummond AE, Berman P. Perceptual impairment and its impact on rehabilitation outcome. SUE Study Group. Disabil Rehabil 1997; 19:231-234.
Author / Year Country PEDro score
Methods Outcome
Lincoln et al. 1997 UK 6 (RCT)
315 stroke patients who were randomly assigned to receive rehabilitation for neglect on the stroke unit or to remain on conventional ward.
Rey Figure Copy score were significantly better for stroke unit patients at 3 months 6 and 12 months compared to those patients on the conventional ward.
Comparison of Perceptual Impairment, as Measured by the Rey Figure Copy Scores, Between
Stroke Unit and Conventional Ward Patients
Rey scores (measure of perceptual impairment) improved significantly more on stroke units when compared to conventional wards at 3 and 6 months but became nonsignificant at 12 months.
Importance: By far the largest randomized controlled trial to assess the effects of perceptual assessment and rehabilitation provided on a specialized stroke unit on neglect following stroke,
Outcome of Perceptual Impairment:
Stroke Unit vs. Conventional Ward Patients
NSp=.005p=.001
NS0
5
10
15
20
25
Entry 3 6 12
Time (months)
Me
dia
n R
ey
Sc
ore
s
Stroke Unit
Conventional Wards
0
5
10
15
20
25
Baseline 3 mths 6 mths 12 mths
Rey
Fig
ure C
op
y S
cores
Stroke Unit
Conventional Wards

125
Lincoln et al. (1997) reported significant benefits to perceptual abilities assessed at 3 months, 6 months and 12 months post-stroke.

126
Visual Perceptual Deficits/Neglect and Visual Scanning Strategies
Weinberg J, Diller L, Gordon WA, Gerstman LJ, Lieberman A, Lakin P, Hodges G, Ezrachi O. Visual scanning training effect on reading-related tasks in acquired right brain damage. Arch Phys Med Rehabil 1977; 58:479-486. Weinberg J, Diller L, Gordon WA, Gerstman LJ, Lieberman A, Lakin P, Hodges G, Ezrachi O. Training sensory awareness and spatial organization in people with right brain damage. Arch Phys Med Rehabil 1979; 60:491-496.
Author / Year Country PEDro score
Methods Outcome
Weinberg et al. 1977 USA 6 (RCT)
57 unilateral right brain damaged (RBD) patients due to stroke at least 4 weeks after onset of stroke were studied. Patients were randomly assigned to the experimental group receiving 20 hours of testing (1 hour/day for 4 weeks in reading, writing and calculation) or to the control group that received no testing between evaluations. In each group, patients were divided into severe and mild visual perceptual deficits. Both groups received occupational therapy as part of general rehabilitation.
RBD severe experimental patients showed significant improvement on WRAT, paragraph, arithmetic, copying, H- cancellation, C- & E-cancellation, picture completion, digit span, DSS ( and confront. RBD mild experimental patients significantly improved on WRAT, H-cancellation, C- & E-cancellation, face matching, digit span and impersistence, p=0.05. RBD mild control patients improved on face counting, picture completion and object assembly. RBD severe control patients demonstrated no significant improvement on any of the outcome measures. Experimental group improved significantly more than the control group, especially patients within the experimental group with more severe deficits.
Weinberg et al. 1979 USA 6 (RCT)
53 stroke patients, at least 4 weeks post stroke with right unilateral brain damage were randomly assigned to receive either 1-hour treatment, 5 days a week for 4 weeks of occupational and physical therapy (C) or to receive 15 hours of tracking target practice, searching for lights on board, cancellation of stimuli and practice in reading and 5 hours of training in sensory awareness and training in spatial organisation over 4 weeks (SC).
Those with severe brain damage receiving SC demonstrated significant improvement in 24 of 26 psychological test scores. Those with mild brain damage in the experimental group exceeded those in the control group on 3 of 26 measures and those with severe brain damage in the SC group exceeded those in the control group on 15 of the 26 measures.
Weinberg et al. 1979

127
Weinberg et al. 1977
Stroke patients who received visual perceptual training for visual perceptual difficulties improved significantly more in the treatment group when compared to control.
Test Improvement in Patients with Visual Perceptual Difficulty:
Experimental vs. Control Group
4%
0%
58%
92%
0% 20% 40% 60% 80% 100%
Severe
Mild
Typ
e o
f V
isu
al
Perc
ep
tual
Dif
ficu
lty
% of Scores Showing Improvement from Pre- to Post-Testing
Control
Experiment
al
Test Improvement in Patients with Visual Perceptual Difficulty:
Experimental vs. Control Group
55%
65%
17%
11%
0% 10% 20% 30% 40% 50% 60% 70%
Severe
Mild
Typ
e o
f V
isu
al
Perc
ep
tual
Dif
ficu
lty
% of Patients Improving on at Least 3 of 4 Tests
Control
Experiment
al
Study name Subgroup within study Outcome Statistics for each study Std diff in means and 95% CI
Std diff Standard Lower Upper
in means error Variance limit limit Z-Value p-Value
Weinberg et al., 1977 Mild WRAT 0.515 0.372 0.138 -0.213 1.244 1.386 0.166
Weinberg et al., 1977 Severe WRAT 1.625 0.464 0.215 0.716 2.534 3.503 0.000
0.950 0.290 0.084 0.381 1.518 3.273 0.001
-8.00 -4.00 0.00 4.00 8.00
Weinberg et al., 1977
Meta Analysis

128
Importance: These early studies by Weinberg et al. demonstrated a dramatic improvement associated with perceptual training (visual scanning, sensory awareness and spatial organization) in individuals with visual perceptual deficits following right-sided stroke. Improvements were most significant for individuals with severe deficits.
Study name Subgroup within study Outcome Statistics for each study Std diff in means and 95% CI
Std diff Standard Lower Upper
in means error Variance limit limit Z-Value p-Value
Weinberg et al., 1979 Mild Arithmetic 1.854 0.444 0.197 0.983 2.724 4.173 0.000
Weinberg et al., 1979 Mild Bisect line left 0.772 0.385 0.148 0.017 1.527 2.005 0.045
Weinberg et al., 1979 Mild Bisect lines right 1.155 0.401 0.161 0.369 1.942 2.878 0.004
Weinberg et al., 1979 Mild Body midline left 0.373 0.375 0.140 -0.362 1.107 0.994 0.320
Weinberg et al., 1979 Mild Body midline right 0.571 0.379 0.144 -0.172 1.315 1.507 0.132
Weinberg et al., 1979 Mild C and E cancellation 1.128 0.400 0.160 0.344 1.912 2.820 0.005
Weinberg et al., 1979 Mild Confrontation 0.371 0.375 0.140 -0.364 1.105 0.989 0.323
Weinberg et al., 1979 Mild Copying 0.944 0.392 0.153 0.176 1.712 2.409 0.016
Weinberg et al., 1979 Mild Digit span backward 0.574 0.379 0.144 -0.169 1.317 1.514 0.130
Weinberg et al., 1979 Mild Digit span foreward 0.829 0.387 0.150 0.070 1.588 2.140 0.032
Weinberg et al., 1979 Mild Digit span total 0.941 0.392 0.153 0.174 1.709 2.404 0.016
Weinberg et al., 1979 Mild DSS left 0.425 0.376 0.141 -0.312 1.161 1.130 0.258
Weinberg et al., 1979 Mild DSS right 0.425 0.376 0.141 -0.312 1.161 1.131 0.258
Weinberg et al., 1979 Mild DSS total 0.533 0.378 0.143 -0.208 1.274 1.409 0.159
Weinberg et al., 1979 Mild Face count 1.432 0.416 0.173 0.616 2.249 3.439 0.001
Weinberg et al., 1979 Mild Face match 1.158 0.402 0.161 0.371 1.945 2.884 0.004
Weinberg et al., 1979 Mild H cancellation 1.651 0.430 0.185 0.808 2.495 3.838 0.000
Weinberg et al., 1979 Mild Impersistence 1.128 0.400 0.160 0.344 1.912 2.819 0.005
Weinberg et al., 1979 Mild Impersistence nonvisual 0.473 0.377 0.142 -0.266 1.211 1.255 0.210
Weinberg et al., 1979 Mild Impersistence visual 1.732 0.436 0.190 0.878 2.586 3.976 0.000
Weinberg et al., 1979 Mild Object assembly 1.296 0.409 0.167 0.495 2.097 3.171 0.002
Weinberg et al., 1979 Mild Paragraph 0.247 0.373 0.139 -0.484 0.978 0.662 0.508
Weinberg et al., 1979 Mild Picture completion 0.479 0.377 0.142 -0.260 1.217 1.270 0.204
Weinberg et al., 1979 Mild Shoulder midline left 1.189 0.403 0.162 0.399 1.979 2.950 0.003
Weinberg et al., 1979 Mild Shoulder midline right 1.731 0.436 0.190 0.877 2.584 3.973 0.000
Weinberg et al., 1979 Mild WRAT 0.789 0.386 0.149 0.033 1.546 2.046 0.041
Weinberg et al., 1979 Severe Arithmetic 3.029 0.607 0.369 1.838 4.219 4.987 0.000
Weinberg et al., 1979 Severe Bisect line left 2.287 0.535 0.287 1.238 3.337 4.271 0.000
Weinberg et al., 1979 Severe Bisect lines right 0.477 0.427 0.183 -0.360 1.315 1.118 0.264
Weinberg et al., 1979 Severe Body midline left 0.218 0.423 0.179 -0.611 1.047 0.516 0.606
Weinberg et al., 1979 Severe Body midline right 1.097 0.450 0.203 0.214 1.980 2.436 0.015
Weinberg et al., 1979 Severe C and E cancellation 2.703 0.574 0.330 1.577 3.829 4.706 0.000
Weinberg et al., 1979 Severe Confrontation 0.341 0.425 0.180 -0.491 1.173 0.804 0.421
Weinberg et al., 1979 Severe Copying 3.036 0.608 0.370 1.844 4.228 4.993 0.000
Weinberg et al., 1979 Severe Digit span backward 1.606 0.481 0.232 0.663 2.549 3.338 0.001
Weinberg et al., 1979 Severe Digit span foreward 0.377 0.425 0.181 -0.456 1.210 0.887 0.375
Weinberg et al., 1979 Severe Digit span total 1.253 0.459 0.210 0.354 2.152 2.731 0.006
Weinberg et al., 1979 Severe DSS left 1.001 0.446 0.199 0.127 1.875 2.246 0.025
Weinberg et al., 1979 Severe DSS right 0.816 0.438 0.192 -0.042 1.674 1.863 0.062
Weinberg et al., 1979 Severe DSS total 5.501 0.899 0.808 3.739 7.263 6.119 0.000
Weinberg et al., 1979 Severe Face count 1.998 0.511 0.261 0.996 2.999 3.911 0.000
Weinberg et al., 1979 Severe Face match 3.123 0.617 0.381 1.914 4.333 5.060 0.000
Weinberg et al., 1979 Severe H cancellation 2.818 0.586 0.343 1.669 3.966 4.810 0.000
Weinberg et al., 1979 Severe Impersistence 1.383 0.466 0.218 0.468 2.297 2.964 0.003
Weinberg et al., 1979 Severe Impersistence nonvisual 0.314 0.424 0.180 -0.517 1.145 0.740 0.459
Weinberg et al., 1979 Severe Impersistence visual 1.489 0.473 0.224 0.561 2.416 3.146 0.002
Weinberg et al., 1979 Severe Object assembly 1.736 0.490 0.241 0.775 2.697 3.539 0.000
Weinberg et al., 1979 Severe Paragraph 0.099 0.422 0.178 -0.728 0.926 0.235 0.814
Weinberg et al., 1979 Severe Picture completion 1.208 0.456 0.208 0.314 2.102 2.648 0.008
Weinberg et al., 1979 Severe Shoulder midline left 2.043 0.514 0.265 1.034 3.051 3.970 0.000
Weinberg et al., 1979 Severe Shoulder midline right 0.849 0.439 0.193 -0.011 1.710 1.935 0.053
Weinberg et al., 1979 Severe WRAT 2.603 0.565 0.319 1.496 3.710 4.609 0.000
1.064 0.060 0.004 0.947 1.182 17.736 0.000
-4.00 -2.00 0.00 2.00 4.00
Weinberg et al., 1979
Meta Analysis

129
Visual Perceptual Deficits/Neglect and Visual Scanning Strategies
Paolucci S, Antonucci G, Guariglia C, Magnotti L, Pizzamiglio L, Zoccolotti P. Facilitatory effect of neglect rehabilitation on the recovery of left hemiplegic stroke patients: a cross-over study. J Neurol 1996; 243:308-314.
Author / Year Country PEDro score
Methods Outcome
Paolucci et al. 1996 Italy 6 (RCT)
59 right hand dominant, right sided stroke patients, onset 2 to 6 months were studied. Patients received treatment for neglect in 5 X 1 hour sessions per week over 8 weeks (immediate treatment) and then general cognitive treatment 3 X 1 hr sessions per week over 8 weeks (delayed treatment). Patients were randomized to which treatment they would receive first and then were crossed over with the second treatment. Specific training included visual scanning, reading and copying, copying of line drawings, and description of a scene.
Improvement was noted in both delayed and immediate treatment groups on Rivermead Mobility Index, Barthel Index, Canadian Neurological Scale, Letter Cancellation Test, Barrage Test, Wundt-Jastrow Area Illusion Test, and Sentence Reading Test.
Importance: Treatment of neglect with specific training including visual scanning resulted in sginficant improvement on a number of functional outcomes.

130
Trunk Rotation and Visual Scanning Wiart L, Come AB, Debelleix X, Petit H, Joseph PA, Mazaux JM, Barat M. Unilateral neglect syndrome rehabilitation by trunk rotation and scanning training.Arch Phys Med Rehabil 1997;78:424-429.
Author / Year Country PEDro score
Methods Outcome
Wiart et al. 1997 France 4 (RCT)
22 stroke patients with recent stroke of less than 3 months onset who exhibited severe unilateral neglect syndrome with line bisection > 11% of right deviation, line cancellation > 2% of right deviation and line cancellation > 2 left omission (LO) and Bell test of > 6 LO. Patients were randomized to either and experimental or to a control group. Experimental group received 1 hour a day for 20 days of the Bon Saint Come method (use of a device with attached pointer which required trunk rotation to complete scanning tasks) followed by 2 to 3 hours of traditional rehabilitation (1 to 2 hours of PT and 1 hour of OT). Control group received 3 to 4 hours of traditional rehabilitation.
All 4 test results - line bisection, line cancellation, bell test, and change in Functional Independence Measure improved significantly more in the experimental group relative to the control group at 30 and 60 days.
Stroke patients with unilateral neglect who received treatment encouraging trunk rotation did better than a control group who received traditional rehabilitation.
Importance: Although several observational studies have reported positive effects associated with trunk rotation in the treatment of neglect, the study by Wiart et al. (1997) is the sole RCT to examine the use of trunk rotation as part of a treatment intervention to improve neglect. The Bon Saint Come method, which incorporates trunk rotation with visual scanning, demonstrated positive effects on spatial neglect and functional ability. Given the positive effects associated with trunk rotation, further study of the use of trunk rotation as a treatment intervention is indicated.
Qualitative Outcome of Unilateral Neglect Syndrome
5
1
2
6
4
2
0
6
1
0
1
2
3
4
5
6
7
Experimental Group Control Group Experimental Group Only
Study 1 Study 2
Nu
mb
er
of
Pati
en
ts
Remission
Improvement
No Change

131
Activation Strategy for Visual Neglect Kalra L, Perez I, Gupta S, Wittink M. The influence of visual neglect on stroke rehabilitation. Stroke 1997; 28:1386-1391.
Author / Year Country PEDro score
Methods Outcome
Kalra et al. 1997 UK 7 (RCT)
50 stroke patients with partial anterior circulation infarctions and visual neglect identified by a comprehensive assessment were randomly assigned to receive either therapy aimed to restoring normal tone, movement patterns and motor activity or to receive therapy aimed at integrating attentional and motor functions using the limb activation approach.
Significant improvement was noted on body image and cancellation subtest of the (RPAB) Rivermead Perceptual Assessment Battery at 12 weeks in favour of the treatment group receiving spatial cuing via limb activation.
Comparison of Patients in Spatiomotor Cueing Group and Conventional Therapy Group
The duration of hospitalization was significantly less in patients assigned to receive spatial cueing during treatment (42 vs. 66 days, p=0.001). In addition, the authors reported that on average, patients in the intervention group spent less time in physiotherapy compared to the control group (17.1 +/- 4.9 hrs vs. 22.6 +/- 8.0 hrs in the control group, p=0.01).
0
20
40
60
80
Length of Stay
Nu
mb
er
of
Days
0
5
10
15
20
25
Time spent inphysiotherapy
Ho
urs
Intervention
Control
Outcome and Therapy Use: Patients With or Without Perceptual Deficits
p=.01
p=.01
p=.0001
p=.01
0
10
20
30
40
50
60
70
BADL* at Discharge Length of Hospital Stay
(days)
Physiotherapy Time per
Patient (hr)
Occupational Therapy
Time per Patient (hr)
Outcome/Therapy Type
* Barthel Index of activities of daily living
Va
lue
No Perceptual Deficits
Perceptual Deficits

132
Importance: The largest of 3 studies examining the effectiveness of limb activation strategies, the study by Kalra et al. (1997) demonstrated that spatiomotor cuing during motor activity resulted in improved performance on assessments of visual neglect, reductions in time spent in physiotherapy and length of hospital stay when compared to patients receiving conventional therapy alone.
Study name Subgroup within study Statistics for each study Odds ratio and 95% CI
Odds Lower Upper
ratio limit limit Z-Value p-Value
Kalra et al., 1997 Discharge Home 0.771 0.377 1.576 -0.713 0.476
Kalra et al., 1997 Discharge Institution 1.081 0.518 2.255 0.207 0.836
Kalra et al., 1997 Mortality 3.307 0.533 20.497 1.285 0.199
0.998 0.609 1.636 -0.006 0.995
0.1 0.2 0.5 1 2 5 10
Kalra et al., 1997
Meta Analysis

133
Activation Strategy for Visual Neglect Robertson IH, McMillan TM, MacLeod E, Edgeworth J, Brock D. Rehabilitation by limb activation training reduces left-sided motor impairment in unilateral neglect patients: A single-blind randomised control trial. Neuropyschological Rehabilitation 2002; 12:439-454.
Author / Year Country PEDro score
Methods Outcome
Robertson et al. 2002 Ireland 6 (RCT)
40 patients with right hemisphere strokes were randomly allocated to perceptual training group (PT) or limb activation treatment (LAT) with PT (LAT+PT). The PT group received perceptual training on visuoperceptual puzzles that required scanning to the left. The LAT+PT: received the same training as PT but also had a timer that emitted tone when a left movement was not performed by left wrist, leg or shoulder within a set time period. Both groups received 12 sessions of 45 minutes duration over a 12-week period. Patients were assessed at intake, post-training and 3, 6 and 18 to 24 months post-training.
Time by treatment condition interaction significant for Motricity Index. Improvement up to 24 months in LAT+PT group with little change in PT group over time.
Patients with right hemispheric strokes who received limb activation therapy + physiotherapy did better on the motricity index than those who received just physiotherapy at 24 months.
Comparing Outcomes of Assessment up to 18-24 Months:
Experimental vs. Control Group
p=.009*
NS
NS
NSNS
NS
0
10
20
30
40
50
60
70
80
Barthel Index CB Rating Scale
of Neglect
Motricity Index Barthel Index CB Rating Scale
of Neglect
Motricity Index
At Intake At 18-24 Months Post-TrainingOutcome Measure
*a statistically significant time by treatment condition effect
Sco
re
Experimental
Control

134
Importance: Limb activation is based on the idea that any movement of the contralesional side may function as a motor stimulus activating the right hemisphere and improving neglect. While limb activation appears to have a positive impact on visual neglect, little data is available with regard to the effect of treatment on functional activities or the duration of effect. Robertson et al. (2002) reported improvement (as assessed by the Motricity Index) at 24 months following training via limb activation suggesting durability of treatment.
Study name Outcome Statistics for each study Std diff in means and 95% CI
Std diff Standard Lower Upper
in means error Variance limit limit Z-Value p-Value
Robertson et al., 2002 BI 0.059 0.317 0.100 -0.562 0.680 0.186 0.852
Robertson et al., 2002 CB 0.385 0.320 0.102 -0.241 1.011 1.205 0.228
Robertson et al., 2002 MI 0.417 0.320 0.102 -0.210 1.044 1.302 0.193
0.285 0.184 0.034 -0.075 0.646 1.551 0.121
-2.00 -1.00 0.00 1.00 2.00
Meta Analysis

135
Prisms Rossi PW, Khegfets S, Reding MJ. Fresnel prisms improve visual perception in stroke patients with homonymous hemianopsia or unilateral visual neglect. Neurology 1990; 40:1597-1599.
Author, Year Country
PEDro Score
Methods Outcomes
Rossi et al. 1990 USA 4 (RCT)
39 stroke patients with homonymous hemianopsia (HHA) or unilateral visual neglect (UVN) in an inpatient stroke rehabilitation unit were studied. Patients demonstrated best corrected visual acuity > 20/200 and were able to comprehend and co-operate with visual field assessment. Patients were randomly assigned to a treatment (prism) or to a non-treatment group. Treatment patients received special glasses with 15 diopter plastic press on Fresnel prisms. Visual perception and ADL were assessed at baseline (similar results) and at 2 and 4 weeks.
At 4 weeks, the prism group had significant improvement in Motor-free Visual Perceptual Test scores, line bisection, line cancellation and the Tangent Screen Exam relative to baseline and control. At 4 weeks, the prism treated group had significant improvement in the Harrington Flocks Visual Screen relative to baseline compared to the control group. No significant difference between the two groups in Barthel ADL index was evident. Treatment with Fresnel prisms improved visual perception test scores but not ADL function in stroke patients with HHA and UVN.
Importance: Treatment with Fresnel prisms improved visual perception test scores but not ADL function in stroke patients with homonymous hemianopsia and unilateral visual neglect.
Study name Outcome Statistics for each study Std diff in means and 95% CI
Std diff Standard Lower Upper
in means error Variance limit limit Z-Value p-Value
Rossi et al., 1990 HFVS 0.329 0.323 0.105 -0.304 0.963 1.019 0.308
Rossi et al., 1990 Line Bisection 0.823 0.334 0.112 0.168 1.479 2.462 0.014
Rossi et al., 1990 Line cancellation 0.731 0.332 0.110 0.081 1.381 2.205 0.027
Rossi et al., 1990 MVPT 0.624 0.329 0.108 -0.020 1.269 1.898 0.058
0.622 0.165 0.027 0.300 0.945 3.778 0.000
-2.00 -1.00 0.00 1.00 2.00
Meta Analysis

136
Prisms Mizuno K, Tsuji T, Takebayashi T, Fujiwara T, Hase K, Liu M. Prism Adaptation Therapy Enhances Rehabilitation of Stroke Patients With Unilateral Spatial Neglect: A Randomized, Controlled Trial. Neurorehabil Neural Repair. 2011 Oct; 25(8):711-20.
Author, Year Country
PEDro Score
Methods Outcomes
Mizuno et al. 2011 Japan 7 (RCT)
34 patients with unilateral spatial neglect (classified as severe vs. mild) were allocated to a treatment or control condition. Patients within the treatment group wore prisms that shifted their visual field 12 deg to the right and underwent pointing intervention. The control group participated in the same program wearing neutral plastic glasses. Intervention consisted of 20 minute sessions, 2 times a day, 5 days a week for 2 weeks. Outcome measures were the Behavioral Inattention Test (conventional: BIT-C; behavioural: BIT-B), the Catherine Bergego Scale (CBS) and the FIM. Assessments were administered before intervention, directly after intervention and at discharge. Authors report a length of stay for the prism group of 127.2 ± 42.2. Based on the reported length of stay, days between onset and intervention as well as the 2 week intervention period, time between end of intervention and discharge ranged between 50.1-97.9 days.
In patients with mild neglect, there was a significant difference between the prism and control group in the change BIT-C scores from baseline to discharge (p<0.05). This significant difference was not seen in the entire patient group overall, or those with severe neglect. In addition, no significant difference was found between groups during any period of time in any level of impairment on the BIT-B or CBS. However, patients with mild neglect that underwent prism treatment had a significantly greater increase in FIM scores than the control group (p<0.01).
Importance: Patient with mild neglect and treated with prisms showed improvement in neglect and FIM scores when compared to controls.
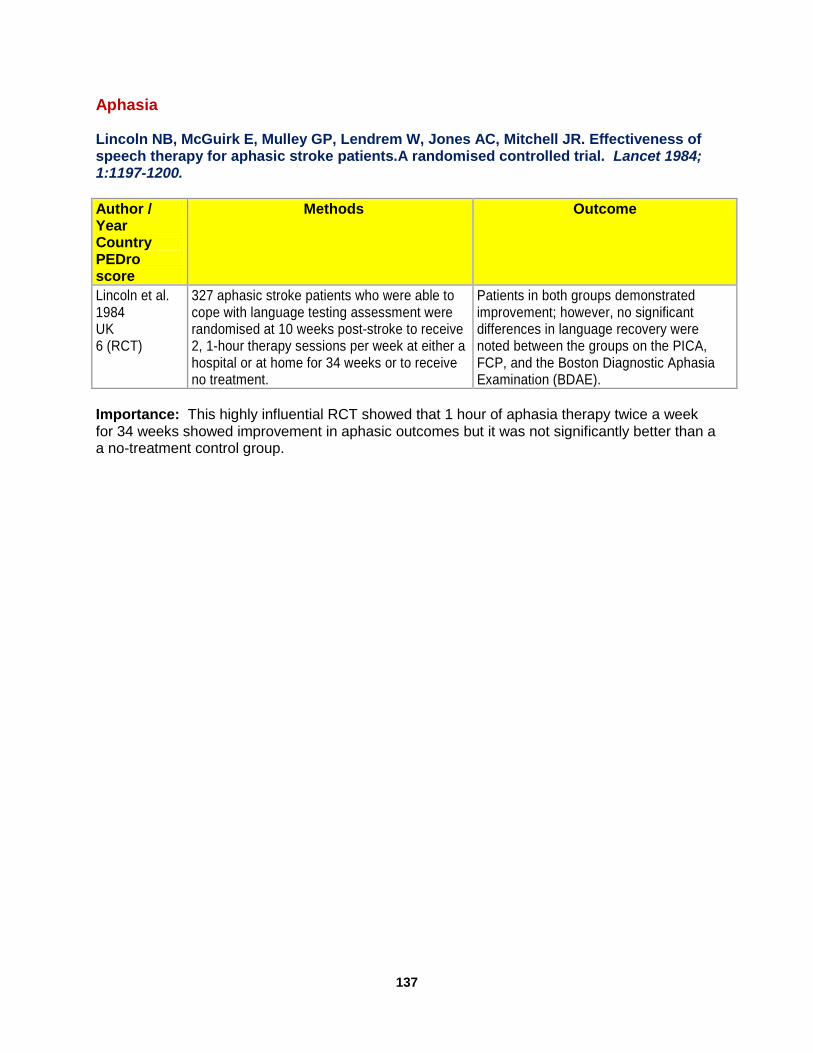
137
Aphasia Lincoln NB, McGuirk E, Mulley GP, Lendrem W, Jones AC, Mitchell JR. Effectiveness of speech therapy for aphasic stroke patients.A randomised controlled trial. Lancet 1984; 1:1197-1200.
Author / Year Country PEDro score
Methods Outcome
Lincoln et al. 1984 UK 6 (RCT)
327 aphasic stroke patients who were able to cope with language testing assessment were randomised at 10 weeks post-stroke to receive 2, 1-hour therapy sessions per week at either a hospital or at home for 34 weeks or to receive no treatment.
Patients in both groups demonstrated improvement; however, no significant differences in language recovery were noted between the groups on the PICA, FCP, and the Boston Diagnostic Aphasia Examination (BDAE).
Importance: This highly influential RCT showed that 1 hour of aphasia therapy twice a week for 34 weeks showed improvement in aphasic outcomes but it was not significantly better than a a no-treatment control group.

138
Intensity of Aphasia Therapy Bhogal K, Teasell R, Speechley M. Intensity of aphasia therapy, impact on recovery. Stroke 2003; 34(4):987-993.
Author / Year Country PEDro score
Methods Outcome
Bhogal et al. 2003 Canada No Score
A systematic review to explore how the intensity of aphasia therapy (speech and language therapy) is associated with aphasia recovery in stroke patients. Intensity was determined by length (weeks), hours per week, and total hours of therapy. Searched for candidate articles on MEDLINE that were published between 1975 and 2002. Primary outcome measures were the PICA, FCP, and Token Test, and Pearson’s correlation coefficient was used to assess the relationship between intensity and outcome of therapy.
Ten studies met the inclusion criteria which established a sample of 864 stroke patients. Hours of therapy per week (p=.001, p=.027), and total hours of therapy (p<.001) were both significantly correlated with improvement on the PICA and Token Test, whereas total length of therapy was found to be inversely correlated (p=.003) with change in PICA scores, suggesting that therapy lasting longer (in weeks) was less intense.
In those studies with a positive impact on aphasia recovery, patients received an average of 8.8 hrs/week for 11.2 weeks (total 98.4 hours). In those studies with a no impact on stroke recovery, patients received an average of 2 hrs/week for 22.9 weeks (total 43.6 hours).
Average Characteristics of Aphasia Therapy Associated with either a
Positive or Negative Impact on Recovery
(according to the PICA* FCP** or Token Test)
8.8
2
22.9
11.2
43.6
98.4
1
10
100
Positive Negative
Impact of Therapy
*Porch Index of Communicative Abilities
**Functional Communication Profile
Mean
Valu
es A
cro
ss S
tud
ies
Hours per Week
Therapy Length (Weeks)
Total Hours of Therapy

139
Importance: An examination of intensity of treatment and mean change scores undertaken by Bhogal et al. (2003) showed significant positive treatment effects for a mean of 8.8 hours of therapy per week for 11.2 weeks versus negative studies that provided approximately 2 hours per week for 22.9 weeks. Hours of therapy provided in a week and total number of hours of therapy were significantly correlated with greater improvement on both the PICA and the Token Test while total length of therapy (i.e. time) was inversely correlated with mean change in PICA scores. Bhogal et al (2003) concluded that intense therapy over a short amount of time could improve outcomes of speech and language therapy for stroke patients with aphasia.
Study name Subgroup within study Outcome Statistics for each study Std diff in means and 95% CI
Std diff Standard Lower Upper
in means error Variance limit limit Z-Value p-Value
Bhogal et al., 2003 Outcome Measures PICA 6.638 0.179 0.032 6.287 6.989 37.078 0.000
Bhogal et al., 2003 Outcome Measures Token Test 3.484 0.114 0.013 3.262 3.707 30.690 0.000
Bhogal et al., 2003 Therapy Measures Hours (per week) 6.102 0.167 0.028 5.774 6.430 36.497 0.000
Bhogal et al., 2003 Therapy Measures Length (weeks) 5.488 0.154 0.024 5.187 5.790 35.663 0.000
Bhogal et al., 2003 Therapy Measures Total (hrs) 3.194 0.108 0.012 2.982 3.406 29.494 0.000
4.410 0.061 0.004 4.291 4.529 72.742 0.000
-8.00 -4.00 0.00 4.00 8.00
Bhogal et al., 2003
Meta Analysis

140
Trained Volunteers Treating Aphasia Marshall RC, Wertz RT, Weiss DG, Aten JL, Brookshire RH, Garcia-Bunuel L, Holland AL, Kurtzke JF, LaPointe LL, Milianti FJ. Home treatment for aphasic patients by trained nonprofessionals. J Speech Hear Disord 1989; 54:462-470.
Author / Year Country PEDro score
Methods Outcome
Marshall et al. 1989 USA 5 (RCT)
This study involved 121 males who were 2 to 12 weeks post onset from a single left hemisphere thrombosis infarct resulting in aphasia. Patients were randomized to receive home therapy treatment given by a wife, friend or relative, treatment by speech-language pathologist or treatment by speech-language pathologist deferred for 12 weeks. Therapy was provided for 8 to 10 hours a week for 12 weeks.
At 12 weeks, the SLP group showed significantly more improvement than deferred group. Improvements noted in home treatment group not differ from SLP group. At 24 weeks deferred treated group caught up to other 2 groups and no significant differences between groups was noted.
Patients who received home therapy given by a family member (home treatment) did better than patients who received no treatment (deferred group).
Importance: Language therapy delivered by trained non-professionals (wife, friend or relative) in the home may be just as effective in improving language outcomes as therapy delivered by a trained speech-language professional.
Mean Improvement for Deferred and Home Treatment Groups:
12 Weeks after Study Commencement
Note: No significant
differences found
between groups
(p>.05)
0 5 10 15 20 25 30
Overall PICA‡
CADL† Score
RCBA** Score
Token Test Score
CPM* Score
Ou
tco
me M
easu
re
Mean Improvement in Score
*Coloured Progressive Matrices; **Reading Comprehension Battery for Aphasia;
†Communicative Abilities in Daily Living; ‡Porch Index of Communicative Ability
Deferred Treatment
Home Treatment

141
Supported Conversation for Aphasia Kagan A, Black SE, Duchan JF, Simmons-Mackie N, Square P. Training volunteers as conversation partners using “supported conversation for adults with aphasia” (SCA): A controlled trial. Journal of Speech, Language and Hearing Research 2001; 44:624-637.
Author / Year Country PEDro score
Methods Outcome
Kagan et al. 2001 Canada & USA 6 (RCT)
Study included 40 stroke patients with moderate-to-severe aphasia and volunteers at an aphasia centre. Volunteers were randomly assigned to either receive a workshop training session designed to teach them how to acknowledge and reveal the competence of adults with aphasia through supported conversation (SCA) or were assigned to be exposed to aphasia by watching a video that told stories of patients with aphasia and their families. There were also given opportunity to interact with aphasia patients. Patients were randomly assigned to volunteers.
SCA trained volunteers scored higher than controls on rating of acknowledging competence and revealing competence of their aphasic partners. Patients assigned to trained volunteers scored higher on social and message exchange skills than did patients assigned to control volunteers.
Volunteers trained in supported conversation were more competent than those who had not undergone training.
Pre- and Post-test Volunteer Scores: Training vs. No Training
NS
NS
p<.001 p<.001
0
0.5
1
1.5
2
2.5
3
Time 1 Time 2 Time 1 Time 2
Acknowledge Competence Reveal Competence
(M)SCA* Component
*(M )SCA = M easure of Supported Conversation for Adults with Aphasia
M(S
CA
)* S
co
re
Training
No Training

142
Importance: Training conversation or communication partners within the aphasic individual’s own setting promotes access to conversation for the aphasic individual. The SCA technique (Kagan et al. 2001) is an effective tool used to teach communication partners skills they can use to promote conversation.
Study name Subgroup within study Outcome Statistics for each study Std diff in means and 95% CI
Std diff Standard Lower Upper
in means error Variance limit limit Z-Value p-Value
Kagan et al., 2001 Acknowledge competence (M)SCA 1.197 0.343 0.118 0.524 1.870 3.487 0.000
Kagan et al., 2001 Reveal competence (M)SCA 3.726 0.523 0.274 2.701 4.751 7.124 0.000
1.959 0.287 0.082 1.396 2.522 6.825 0.000
-8.00 -4.00 0.00 4.00 8.00
Kagan et al., 2001
Meta Analysis

143
Treatment of Word-Retrieval Deficits in Aphasia Rehabilitation Doesborgh SJC, van de Sandt-Koenderman MWE, Dippel DW, van Harskamp F, Koustall PJ, Visch-Brink EG.Effects of semantic treatment on verbal communication and linguistic processing in aphasia after stroke.A randomized controlled trial. Stroke 2004; 35: 141-146.
Author, Year Country
Pedro Score
Methods
Outcome
Doesborg et al. 2004 Netherlands 8 (RCT)
55 stroke patients demonstrating semantic and phonological deficits were randomly assigned to receive either semantic treatment focused on interpretation of written words, sentences and text or to a control group treatment that focused on sound structure. Treatment started at 3 to 5 months post stroke onset and last until 10 to 12 months post-onset. Patients’ received 40 to 60 hours of individual treatment.
After semantic treatment, patients significantly improved on the Semantic Association Test. Patients receiving sound structure treatment improved significantly on phonological measures. All patients significantly improved on the Amsterdam Nijmegen Everyday Language Test. However no significant differences were noted between groups. The authors’ hypothesis that semantic treatment has more effect at the activities level (verbal communication) than phonological treatment was refuted.
Importance: Semantic-based treatments improved stroke patients’ semantic deficits and phonological-based treatments improved phonological measures. Both groups improved on language testing but there was no difference between the two groups.
Study name Outcome Statistics for each study Std diff in means and 95% CI
Std diff Standard Lower Upper
in means error Variance limit limit Z-Value p-Value
Doesborgh et al., 2004 ANELT-A 0.096 0.295 0.087 -0.483 0.674 0.324 0.746
0.096 0.295 0.087 -0.483 0.674 0.324 0.746
-2.00 -1.00 0.00 1.00 2.00
Doesborgh et al., 2004
Meta Analysis

144
Treatment of Word-Retrieval Deficits in Aphasia Rehabilitation de Jong-Hagelstein M, van de Sandt-Koenderman WM, Prins ND, Dippel DW, Koudstaal PJ, Visch-Brink EG. Efficacy of early cognitive-linguistic treatment and communicative treatment in aphasia after stroke: a randomised controlled trial (RATS-2). J Neurol Neurosurg Psychiatry 2011; 82(4):399-404.
Author, Year Country
Pedro Score
Methods
Outcome
De Jong-Hagelstein et al. 2011 The Netherlands 8 (RCT)
75 stroke patients with aphasia were randomized to receive either cognitive-linguistic treatment (CLT), consisting of a semantic treatment program (BOX) and a phonological treatment program (FIKS), or the control treatment, a communicative treatment using verbal and non-verbal strategies such as PACE, role playing and conversational coaching. Assessments were performed at baseline, 3 months, and 6 months post stroke and included the Semantic Association Test (SAT), Semantic Association with low image-ability words (PALPA), Semantic Word Fluency, Nonword repetition Task (PALPA), Auditory Lexical Decision (PALPA), Letter Fluency, Amsterdam-Nijmegen Everyday Language Test (ANELT), the Aachen Aphasia Test, and the Modified Rankin Scale. Treatment was applied 2-5 hours per week for 6 months (or until recovered) and began at least 3 weeks post-stroke.
Individuals assigned to the CLT group demonstrated significantly better scores on fluency tasks (semantic fluency at 3 months, 95% CI 0.4 to 0.6, p<0.05 and letter fluency at 6 months, 95% CI 0.3 to 0.6, p<0.05) than those in the control group. There were no other significant difference between groups on any other measures at 3 or 6 months post stroke. In addition, there was no between-group difference in proportion of patients demonstrating an improvement of ≥ 7 points on the ANELT-A.
Importance: Patients who received a cognitive-linguistic treatment program consisting of semantic and phonological treatments did better on fluency tasks only then a control group using communicative treatment using verbal and non-verbal strategies.

145
Medical Complications Aspiration and Silent Aspiration Terre R, Mearin F. Oropharyngeal dysphagia after the acute phase of stroke: predictors of aspiration. Neurogastroenterol Motil 2006; 18(3):200-205. Behavioural Intervention for Dysphagia Carnaby G, Hankey GJ, Pizzi J. Behavioural intervention for dysphagia in acute stroke: a randomised controlled trial. Lancet Neurol 2006; 5(1):31-37. Enteral Tube Feeding for Dysphagia FOOD Trial Dennis MS, Lewis SC, Warlow C. Effect of timing and method of enteral tube feeding for dysphagic stroke patients (FOOD): a multicentre randomised controlled trial. Lancet 2005; 365:764-772. Electrical Stimulation for Post-Stroke Dysphagia Jayasekeran V, Singh S, Tyrrell P, Michou E, Jefferson S, Mistry S, Gamble E, Rothwell J, Thompson D, Hamdy S. Adjunctive functional pharyngeal electrical stimulation reverses swallowing disability after brain lesions. Gastroenterology 2010; 138:1737-1746. Xia W, Zheng C, Lei Q, Tang Z, Hua Q, Zhang Y et al. Treatment of post-stroke dysphagia by vitalstim therapy coupled with conventional swallowing training. J Huazhong Univ Sci Technolog Med Sci 2011; 31(1):73-76. Deep Venous Thrombosis Prevention Enoxaparin to Prevent DVT Sherman DG, Albers GW, Bladin C et al. The efficacy and safety of enoxaparin versus unfractionated heparin for the prevention of venous thromboembolism after acute ischaemic stroke (PREVAIL Study): an open-label randomised comparison. Lancet. 2007; 369:1347-1355. Graduted Compression Stocking to Reduce the Risk of DVT CLOTS Dennis M, Sandercock PA, Reid J, Graham C, Murray G, Venables G, Rudd A, Bowler G. Effectiveness of thigh-length graduated compression stockings to reduce the risk of deep vein thrombosis after stroke (CLOTS trial 1): a multicentre, randomised controlled trial. Lancet 2009;373:1958-1965.

146
Aspiration and Silent Aspiration Terre R, Mearin F. Oropharyngeal dysphagia after the acute phase of stroke: predictors of aspiration. Neurogastroenterol Motil 2006; 18(3):200-205.
Author / Year Country PEDro score
Methods Outcome
Terre & Mearin 2006 Spain No Score
138 consecutive patients admitted to a rehabilitation hospital recovering from a severe, first-ever strokes were evaluated clinically and through videofluoroscopy. Evaluations were conducted a mean of 3 months following stroke
Dysphagia was clinically suspected in 64 (46%) of patients. Clinical examination showed that 44% had impaired gag reflex, 47% coughed during oral feeding, and 13% demonstrated changes in voice after swallowing. 42 (30%) patients demonstrated pharyngeal aspiration on VMBS. Of these, 21 (50%) were episodes of silent aspiration.
Importance: 3 months post severe stroke 30% of stroke patients still demonstrated pharyngeal aspiration and half of those were silent aspirators.

147
Behavioural Intervention for Dysphagia Carnaby G, Hankey GJ, Pizzi J. Behavioural intervention for dysphagia in acute stroke: a randomised controlled trial. Lancet Neurol 2006; 5(1):31-37.
Author / Year Country PEDro score
Methods Outcome
Carnaby et al. 2006 USA 8 (RCT)
306 patients with clinical dysphagia admitted to hospital with acute stroke were randomly assigned to receive usual care (n=102), standard low-intensity intervention (n=102), or standard high-intensity intervention and dietary prescription (n=102). Treatment continued for up to a month. The primary outcome measure was survival free of an abnormal diet at 6 months
Of patients randomly allocated usual care, 56% (57/102) survived at 6 months free of a modified diet compared with 64% (65/102) allocated to standard (low-intensity) swallowing therapy and 70% (71/102) patients who received high-intensity swallowing therapy. Compared with usual care and low-intensity therapy, high-intensity therapy was associated with an increased proportion of patients who returned to a normal diet (p=0.04) and recovered swallowing (p=0.02) by 6 months.
High intensity swallowing therapy was associated with a greater percentage of patients who returned to a normal diet.
Importance: Stroke patients with clinical dysphagia who received high intensity swallowing therapy were more likely to return to a normal diet or recover their swallowing at 6 months when compared to standard or low-intensity swallowing therapy.
0.65
0.7
0.75
0.8
0.85
0.9
(%)
Figure 15.3 Percentage of Patients Achieving Normal Diets at 6 Months
p=0.46

148
Enteral Tube Feeding for Dysphagia FOOD Trial Dennis MS, Lewis SC, Warlow C. Effect of timing and method of enteral tube feeding for dysphagic stroke patients (FOOD): a multicentre randomised controlled trial. Lancet 2005; 365:764-772.
Author / Year Country PEDro score
Methods Outcome
FOOD Trial 2005 UK 7 (RCT)
321 acute stroke patients, from 47 hospitals in 11 countries, were randomized to receive either a PEG (n=162) or NG feeding tube (n=159) within 3 days of enrolment into the study. Death and poor outcome (defined as a Modified Rankin Score of 4-5) was assessed at 6 months.
Feeding with a PEG tube was associated with an increase in the absolute risk of death or poor outcome of 7.8% (p=0.05). There was no difference in the incidence of pneumonia between the groups. There were more gastrointestinal bleeds among patients in the NG group (18 vs. 5, p=0.005), but more pressure sores among patients in the PEG group (12 vs. 4, p=0.04). Only 48% of patients allocated to treatment in the PEG group actually received the treatment within 3 days.
FOOD trial showing patients who received a PEG had significantly poorer outcomes than patients who received an NG tube.
48.0%
81.0%
49.0%
89.0%
0.0%
20.0%
40.0%
60.0%
80.0%
100.0%
Death Death/Poor Outcome
NG vs. PEG Tube Feeding on Stroke Outcome
NG PEG
p=ns p=0.05

149
Importance: Preliminary results from two small trials suggested that naso-gastric tubes was the preferred method of feeding patients enterally following stroke. This large, international trial was designed to be the definitive study with respect to the enteral feeding route.
Study name Outcome Statistics for each study Odds ratio and 95% CI
Odds Lower Upper
ratio limit limit Z-Value p-Value
FOOD Trial, 2005 death or poor outcome 1.039 0.671 1.611 0.173 0.862
1.039 0.671 1.611 0.173 0.862
0.1 0.2 0.5 1 2 5 10
Favours A Favours B
FOOD Trial, 2005
Meta Analysis

150
Electrical Stimulation for Post-Stroke Dysphagia Jayasekeran V, Singh S, Tyrrell P, Michou E, Jefferson S, Mistry S, Gamble E, Rothwell J, Thompson D, Hamdy S. Adjunctive functional pharyngeal electrical stimulation reverses swallowing disability after brain lesions. Gastroenterology 2010; 138:1737-1746.
Author / Year Country PEDro score
Methods Outcome
Jayasekeran et al. 2010 UK 8 (RCT)
50 acute dysphagic stroke patients were assigned randomly to receive either active or sham pharyngeal electrical stimulation (PES) once daily for 3 days. (n = 28). The primary end point was the reduction of airway aspiration at 2 weeks post intervention assessed using VFS. Additional outcomes included scores on a Dysphagia Severity Rating (DSR) rating scale.
Patients who received the active form of PES experienced significantly fewer episodes of aspiration, greater improvement in DSR and remained in hospital for a shorter period of time compared with patients who received sham treatment.
Importance: Acute dysphagic stroke patients who received pharyngeal electrical stimulation (PES) had less episodes of airway aspiration on VFS 2 weeks post intervention as well as an improved Dysphagia Severity Rating (DSR) scale score when compared to a sham PES group.

151
Electrical Stimulation for Post-Stroke Dysphagia Xia W, Zheng C, Lei Q, Tang Z, Hua Q, Zhang Y et al. Treatment of post-stroke dysphagia by vitalstim therapy coupled with conventional swallowing training. J Huazhong Univ Sci Technolog Med Sci 2011; 31(1):73-76.
Author / Year Country PEDro score
Methods Outcome
Xia et al. 2011 China 4 (RCT)
120 patients with post-stroke dysphagia were randomly assigned to one of 3 groups: 1) conventional swallowing therapy group, 2) electrical stimulation (ES) with the VitalStim therapy group, and 3) VitalStim therapy plus conventional swallowing therapy group. Treatments with ES were given twice a day for 230 min each, 5 days a week for 4 weeks. Swallowing function was evaluated by using the Standardized Swallowing Assessment (SSA).
SSA scores before and after treatment were: Conventional-40.9 to 30.1, ES-38.7 to 29.6, ES + Conventional-39.5 to 21.4. The scores were significantly greater in the VitalStim therapy plus conventional swallowing training group than in the conventional swallowing training group and VitalStim therapy group, but no significant difference existed between conventional swallowing therapy group and VitalStim therapy group.
Importance: In patients with post-stroke dysphagia swallowing scores improved significantly more with VitalStim therapy + conventional swallowing training than either treatments alone; there was no difference between VitalStem therapy and conventional swallowing training groups.

152
Deep Venous Thrombosis Prevention Enoxaparin to Prevent DVT Sherman DG, Albers GW, Bladin C et al. The efficacy and safety of enoxaparin versus unfractionated heparin for the prevention of venous thromboembolism after acute ischaemic stroke (PREVAIL Study): an open-label randomised comparison. Lancet 2007; 369:1347-1355.
Author / Year Country PEDro score
Methods Outcome
Sherman et al. 2007 PREVAIL 7 RCT
1,762 patients with acute ischemic stroke unable to walk were randomized to receive either LMWH 40 mg enoxaparin once daily (n=844) or 5,000 U UFH twice daily (n=878) for 10 days. Open-label study.
The incidence of symptomatic DVT was 1 in the LMWH group and 4 in the UFH group at the end of 14 days (p=0.18). There were fewer incidences of asymptomatic DVT in the LMWH group (66 vs. 114, p<0.0001). The occurrence of any bleeding events was similar between groups.
Importance: Acute immobile stroke patients treated with enoxaparin (a low molecular weight heparin) had fewer asymptomatic DVTs than a unfractionated heparin (5000 units q12h) group.
Study name Outcome Statistics for each study Odds ratio and 95% CI
Odds Lower Upper
ratio limit limit Z-Value p-Value
PREVAIL Study Efficacy 0.515 0.374 0.708 -4.079 0.000
PREVAIL study Safety 0.978 0.692 1.384 -0.124 0.902
0.691 0.547 0.874 -3.085 0.002
0.1 0.2 0.5 1 2 5 10
Favours Enoxaparin Favours Unfractionated heparin
Meta Analysis

153
Graduted Compression Stocking to Reduce the Risk of DVT CLOTS Dennis M, Sandercock PA, Reid J, Graham C, Murray G, Venables G, Rudd A, Bowler G. Effectiveness of thigh-length graduated compression stockings to reduce the risk of deep vein thrombosis after stroke (CLOTS trial 1): a multicentre, randomised controlled trial. Lancet 2009;373:1958-1965.
Author / Year Country PEDro score
Methods Outcome
CLOTS (1) 2009 UK 8 (RCT)
2,518 patients, admitted to hospital within 1 week of an acute stroke and who were immobile were enrolled from 64 centres in the UK, Italy, and Australia. Patients randomized to either routine care plus thigh-length GCS (n=1256) or to routine care plus avoidance of GCS (n=1262). Doppler ultrasound of both legs was performed at about 7-10 days and, when practical, again at 25-30 days after enrolment. The primary outcome was the occurrence of symptomatic or asymptomatic DVT in the popliteal or femoral veins.
DVT occurred in 126 (10.0%) patients allocated to thigh-length GCS and in 133 (10.5%) allocated to avoid GCS, resulting in a non-significant absolute reduction in risk of 0.5% (95% CI -1.9% to 2.9%). Adverse effects (skin breakdown, necrosis, ulcers) were significantly more common in the GCS group.
CLOTS (2) 2010 UK 6 (RCT)
3,114 acute, immobile stroke patients from 112 centres were randomized to 1552 patients to wear thigh-length stockings (n=1552) or below-knee stockings (1562) while they were in the hospital, in addition to routine routine care, which could have included early mobilization, anticoagulants etc. The primary outcome measure was symptomatic or asymptomatic proximal DVT, assessed by compression duplex ultrasonography at either first (days 7-10) or on a second scan at day 30.
The incidence of proximal DVT within 30 days was significantly higher in the below-knee stocking group compared with the above knee group (8.8% vs. 6.3%, p=0.008). The associated odds reduction was 31% (CI, 9% to 47%). Seventy-five percent of patients in both groups wore the stockings for 30 days or until they were discharged, died, or regained mobility.
Study name Statistics for each study Odds ratio and 95% CI
Odds Lower Upper ratio limit limit Z-Value p-Value
CLOTS trial 0.947 0.732 1.224 -0.419 0.675
0.947 0.732 1.224 -0.419 0.675
0.1 0.2 0.5 1 2 5 10
Favours GCS Favours No GCS
Meta Analysis

154
Importance: Acute immobile stroke patients treated with thigh length graduated compression stockings (GCS) had the same incidence of proximal DVTs while the GCS group suffered a higher number of adverse effects. Later comparison of below knee GCS to full thigh length GCS found that the latter had a lower incidence of DVTs.

155
Psychosocial Interventions in Stroke Rehabilitation
Frequency of Depression Post Stroke Hackett ML, Yapa C, Parag V, Anderson CS. Frequency of depression after stroke: a systematic review of observational studies. Stroke 2005; 36:1330-1340. Medications for Treating Post-Stroke Depression Methylphenidate and Depression Post Stroke Grade C, Redford B, Chrostowski J, Toussaint L, Blackwell B. Methylphenidate in early poststroke recovery: a double-blind, placebo-controlled study. Arch Phys Med Rehabil 1998; 79:1047-1050. Heterocyclics and SSRIs Treating Post Stroke Depression Robinson RG, Schultz SK, Castillo C, Kopel T, Kosier JT, Newman RM, Curdue K, Petracca G, Starkstein SE. Nortriptyline versus fluoxetine in the treatment of depression and in short-term recovery after stroke: a placebo-controlled, double-blind study. Am J Psychiatry 2000; 157:351-359.
Delayed Benefits of SSRIs Post Stroke Fruehwald S, Gatterbauer E, Rehak P, Baumhackl U.Early fluoxetine treatment of post-stroke depression.A three month double-blind placebo-controlled study with an open-label long-term follow up. J Neurol 2003; 250:347-351. Murray V, von Arbin M, Bartfai A, et al. Double-blind comparison of sertraline and placebo in stroke patients with minor depression and less severe major depression. J Clin Psychiatry 2005; 66:708-716.
Prozac Use in Motor Recovery Post Stroke Chollet F, Tardy J, Albucher JF, Thalamus C, Berard E, Lamy C, et al. Floxetine for motor recovery after acute ischaemic stroke (FLAME): a randomized placebo-controlled trial. Lancet Neurol 2011; 10(2):123-130. Social Support Intervention Post Stroke Friedland JF, McColl M. Social support intervention after stroke: results of a randomized trial. Arch Phys Med Rehabil 1992; 73:573-581. Social Support from a Stroke Nurse Burton C, Gibbon B. Expanding the role of the stroke nurse: a pragmatic clinical trial. J Adv Nurs 2005; 52:640-650.

156
Training Caregivers Post Stroke Kalra L, Evans A, Perez I, et al. Training carers of stroke patients: randomised controlled trial. BMJ 2004; 328:1099. Mant J, Carter J, Wade DT, Winner S. Family support for stroke: a randomised controlled trial. Lancet 2000; 356:808-813. Driving Mazer BL, Sofer S, Korner-Bitensky N, Gelinas I, Hanley J and Wood-Dauphinee S. Effectiveness of a visual attention retraining program on the driving performance of clients with stroke. Arch Phys Med Rehabil 2003; 84:541-550.

157
Frequency of Depression Post Stroke Hackett ML, Yapa C, Parag V, Anderson CS. Frequency of depression after stroke: a systematic review of observational studies. Stroke 2005; 36:1330-1340.
Author / Year Country PEDro score
Methods Outcome
Hackett et al. 2005 Worldwide No Score
A systematic review of observational studies to determine estimates of the frequency of depressive symptoms after stroke. Searched for candidate articles published between 1977 and 2002.
Fifty-one studies met the eligibility criteria and yielded a pooled estimate of 33% for depression among stroke survivors.
Data collected from 51 observational studies found that an estimated 33% of stroke survivors exhibit depression at any one time following a stroke.
Importance: Based on data collected from 51 observational studies in community, hospital and rehabilitation-based settings, the authors reported an estimated 33% of stroke survivors exhibit depressive symptoms at some time following stroke (i.e. acute, medium term or long-term follow-up). Post-stroke depression may have a negative impact on functional recovery and social activity and has also been associated with cognitive impairment and increased mortality.
26%
28%
30%
32%
34%
36%
Fre
qu
en
cy
(%
)
Acute Medium-term Long-term
Phase of Stroke Recovery
Frequency of Depression after Stroke across
Observational Studies (Pooled Estimates)
Population
Hospital
Rehabilitation
Sub-total

158
Methylphenidate and Depression Post Stroke Grade C, Redford B, Chrostowski J, Toussaint L, Blackwell B. Methylphenidate in early poststroke recovery: a double-blind, placebo-controlled study. Arch Phys Med Rehabil 1998; 79:1047-1050.
Author / Year Country PEDro score
Methods Outcome
Grade et al. 1998 USA 7 (RCT)
A double blind RCT of 21 stroke patients comparing the efficacy of methylphenidate during stroke rehabilitation. Patients were randomized to receive either 5mg in the morning & 30mg before bedtime of methylphenidate or a placebo treatment.
Patients receiving methylphenidate scored lower on HAM-D (p=0.028) and the Zung scale (p=0.055). Significant improvement was also reported in patients receiving methylphenidate on the motor FIM (p=0.32). While scores on the FMA were higher in the treatment group, they did not reach significance (p=0.075).
RCT demonstrating patients treated with methylphenidate were significantly less depressed based on the Hamilton Depression Rating Scale but not the Zung Self Rating Depression Scale.
Outcome Measures:
MMSE=Mini-Mental
State Exam
FMS=Fugl-Meyer Scale
M-FIM=Functional
Independence Measure
p=.028
p=.055
p=.032
p>.05
ZDS=Zung Self-Rating
Depression Scale
HAM-D=Hamilton
Depression Rating Scale
p>.5
0 20 40 60 80 100 120
Score
HAM-D
ZDS
M-FIM
FMS
MMSE
Ou
tco
me M
easu
re
Improvement Scores on Outcome Measures:
Treatment vs. Placebo Group
Placebo
Methyphenidate
Study name Outcome Statistics for each study Std diff in means and 95% CI
Std diff Standard Lower Upper
in means error Variance limit limit Z-Value p-Value
Grade et al. 1998 HAM-D 1.044 0.466 0.217 0.132 1.957 2.243 0.025
1.044 0.466 0.217 0.132 1.957 2.243 0.025
-4.00 -2.00 0.00 2.00 4.00
Favours Placebo Favours Methylphenidate
Meta Analysis

159
Importance: This RCT demonstrated that methylphenidate significantly improves depression scores.

160
Heterocyclics and SSRIs Treating Post Stroke Depression Robinson RG, Schultz SK, Castillo C, Kopel T, Kosier JT, Newman RM, Curdue K, Petracca G, Starkstein SE. Nortriptyline versus fluoxetine in the treatment of depression and in short-term recovery after stroke: a placebo-controlled, double-blind study. Am J Psychiatry 2000; 157:351-359.
Author / Year Country PEDro score
Methods Outcome
Robinson et al. 2000 USA & Argentina 8 (RCT)
Double blind, placebo controlled randomized crossover trial of 104 patients. Patients randomly assigned to either fluoxetine (10mg/day gradually increased to 40 mg/day) or nortriptyline (dose of 25 mg/day gradually increased to 100 mg/day) or identical placebo given over 12 weeks. Patients received 12 weeks of active treatments and cross-over for 12 weeks of placebo treatment.
A significant time-by-treatment interaction was found on the repeated measure analysis of variance of the mean Hamilton Depression Scale score. Nortriptyline treated group showed significantly greater improvement on the HDRS than the other 2 groups. Nortriptyline produced a significantly higher rate than fluoxetine or placebo in treating post-stroke depression, in improving anxiety symptoms and in improving recovery of activities of daily living as measured by the FIM.
RCT demonstrating that Nortriptyline was significantly more successful in treating depression than fluoxetine or a placebo.
Importance: This study compared a heterocyclic antidepressant with a serotonin reuptake inhibitor and found nortriptyline (a heterocyclic drug) to be more effective than the serotonin reuptake inhibitor fluoxetine. It was observed that nortriptyline improved the Hamilton
p=.002*
p=.05**
NS†
0102030405060708090
100
Su
cc
es
s R
ate
(%
)
Nortriptyline(1) Fluoxetine(2) Placebo(3)
Treatment
Treatment Success Rates
*Between (1) and (2); **Between (1) and (3);†Between (2) and (3)

161
Depression Scale scores significantly more so than fluoxetine and/or placebo. In addition, the response rate of nortriptyline was significantly greater than both fluoxetine and placebo.

162
Delayed Benefits of SSRIs Post Stroke Fruehwald S, Gatterbauer E, Rehak P, Baumhackl U.Early fluoxetine treatment of post-stroke depression.A three month double-blind placebo-controlled study with an open-label long-term follow up. J Neurol 2003; 250:347-351.
Author / Year Country PEDro score
Methods Outcome
Fruehwald et al. 2003 Austria 9 (RCT)
54 patients suffering from moderate to severe post-stroke depression were randomized within 2 weeks of stroke to either treatment with fluoxetine or to placebo control.
Significant improvement was seen in both groups within 4 weeks; however no advantage of fluoxetine was noted at this time. Beck Depression Inventory scores of patients treated with fluoxetine decreased until the follow-up at 12 weeks whereas the scores increased in the placebo group. At long-term follow up, 18 months after inclusion, patients treated who had been treated with fluoxetine were significantly less depressed than placebo treated patients.
In this RCT, fluoxetine was not more effective than placebo in treating post stroke depression.
Before and After Depression Scores: Treatment vs. Placebo Group
NS NS
NSNS
Outcome M easures:
HDS=Hamilton
Depression Scale
SSS=Scandinavian
Stroke Scale
BDI=Beck's Depression
Inventory
CGI=Clinical Global
Impression
p<.05
p<.05
NS
p<.05
0
10
20
30
40
50
60
HDS SSS BDI CGI HDS SSS BDI CGI
Initial 18 Weeks
Outcome Measure
Sco
re
Fluoxetine
Placebo

163
This data is from Table 2 in the study and encompasses month 0 and pre data and month 18 as post data.
Importance: Although both the treatment group and control group experienced improvements in the first 6 weeks following stroke, treatment with the SSRI (fluoxetine) was associated with long-term reduction in depression (18 months).

164
Sertraline in the Treatment of Post-Stroke Depression Murray V, von Arbin M, Bartfai A, et al. Double-blind comparison of sertraline and placebo in stroke patients with minor depression and less severe major depression. J Clin Psychiatry 2005; 66:708-716.
Author / Year Country PEDro score
Methods Outcome
Murray et al. 2005 Sweden 9 (RCT)
123 stroke patients with either a major or minor depressive episode (defined according to the DSM-IV) were assigned to either the treatment or placebo conditions. 62 patients received sertraline (50 – 100 mg/day) and 61 received a matching placebo. Primary study outcome was change in MADRS score from baseline to weeks 6 and 26.
Both groups demonstrated significant improvements over the study period. There were no significant between group differences on the primary study outcomes whether the patient was diagnosed with major or minor depression. There was a significant difference between groups favouring treatment identified on the Emotional Distress Scale (p<0.05). Improvement in global quality of life was greater for those patients treated with sertraline at week 26 than for those patients in the control group (p<0.05).
Treatment with sertraline was not associated with greater improvement in depression when compared to placebo.
Mean MADRS* Scores at 26 Weeks of Treatment:
Setraline vs. Placebo Group
8.4
11.5
12.6
11.1
0 2 4 6 8 10 12 14
Major Depressive
Episode
Minor Depressive
Episode
Dep
ressiv
e C
ate
go
ry
Mean Score at 26 Weeks
*M ontgomery-Asberg Depression Rating Scale
Note: No significant differences were found between groups.
Setraline Placebo

165
Importance: Although treatment with the SSRI, sertraline, was not associated with greater improvement in depression outcomes than no treatment, use of sertraline was associated with reduced emotional distress and improved global quality of life.
Study name Subgroup within study Outcome Statistics for each study Std diff in means and 95% CI
Std diff Standard Lower Upper
in means error Variance limit limit Z-Value p-Value
Murray et al. 2005 Major Depressive MADRS score at 26 wks 0.071 0.230 0.053 -0.380 0.523 0.310 0.756
Murray et al. 2005 Major Depressive MADRS score at 6 wks 0.078 0.230 0.053 -0.373 0.530 0.340 0.734
Murray et al. 2005 Minor Depressive MADRS score at 6 wks 0.261 0.295 0.087 -0.316 0.839 0.886 0.375
Murray et al. 2005 Minor Depressive MARDS score at 26 wks 0.361 0.296 0.087 -0.219 0.941 1.221 0.222
0.164 0.128 0.016 -0.087 0.416 1.279 0.201
-4.00 -2.00 0.00 2.00 4.00
Favours Placebo Favours Sertraline
Meta Analysis

166
Prozac Use in Motor Recovery Post Stroke Chollet F, Tardy J, Albucher JF, Thalamus C, Berard E, Lamy C, et al. Fluoxetine for motor recovery after acute ischaemic stroke (FLAME): a randomized placebo-controlled trial. Lancet Neurol 2011; 10(2):123-130.
Author / Year Country PEDro score
Methods Outcome
Chollet et al. 2011 (FLAME) France 9 (RCT)
118 hemiplegic patients from 9 stroke centres in France who had experienced an ischemic stroke within 5-10 days and with Fugl-Meyer motor scale (FMMS) scores of 55 or less were included. Patients with existing depression or who were taking antidepressants were excluded. Patients were randomly assigned, to receive fluoxetine (20 mg once per day, orally, n=59) or placebo for 3 months starting (n=59). All patients received physiotherapy. The primary outcome measure was the change on the FMMS between day 0 and day 90 after the start of the study drug. Secondary outcomes included modified Rankin Scale scores (mRS) and NIHSS scores.
Total FMMS improvement at day 90 was significantly greater in the fluoxetine group (adjusted mean 34.0 points than in the placebo group (24.3 points; p=0.003). The increases in the upper limb FMMS sub scores were also significantly greater in patients in the fluoxetine group. There were no differences in NIHSS scores at day 90 between groups. A greater proportion of patients in the fluoxetine group had mRS score of 0-2 compared with those in the placebo group (15 vs. 9, p=0.021) after adjusting for age, history of stroke and baseline mRS scores. The frequency of incident depression was higher in the placebo group (17 vs. 4, p=0.002).
In this study the data is form Table 2 (pre data) and Table 3 (post data) and Table 4 (secondary post data).
Importance: This highly unique study compared acute stroke patients treated with Prozac for 3 months to a placebo and found less depression in the intervention group along with improvement in the Fugl-Meyer score as well as the modified Rankin score.

167
Social Support Intervention Post Stroke Friedland JF, McColl M. Social support intervention after stroke: results of a randomized trial. Arch Phys Med Rehabil 1992; 73:573-581.
Author / Year Country PEDro score
Methods Outcome
Friedland and McColl 1992 Canada 5 (RCT)
88 patients randomized to receive either Social Support Intervention (SSI) program consisting of between 6 and 12 sessions that involved the subjects and/or members of their supportive system or to receive no specific intervention, although they were free to engage in any supportive relationships or groups available to them.
SSI scores favoured intervention group on scale of quantity of professional relationships, quality of professional relationships and quality of community relationships after the first assessment.
Importance: Social support intervention was associated with improvements in both professional and community relationships. This was the only study identified that examined the effect of intervention on social support networks.
Study name Outcome Statistics for each study Mean and 95% CI
Standard Lower Upper
Mean error Variance limit limit Z-Value p-Value
Friedland et al., 1992 GHQ (Time 1) 4.025 0.419 0.175 3.205 4.845 9.615 0.000
Friedland et al., 1992 GHQ (Time 2) 4.667 0.533 0.284 3.622 5.712 8.756 0.000
Friedland et al., 1992 GHQ (Time 3) 3.652 0.507 0.257 2.658 4.646 7.199 0.000
4.087 0.276 0.076 3.546 4.628 14.799 0.000
-8.00 -4.00 0.00 4.00 8.00
Friedland et al., 1992
Meta Analysis

168
Social Support from a Stroke Nurse Burton C, Gibbon B. Expanding the role of the stroke nurse: a pragmatic clinical trial. J Adv Nurs 2005; 52:640-650.
Author / Year Country PEDro score
Methods Outcome
Burton and Gibbon 2005 UK 7 (RCT)
176 inpatients with stroke were recruited from 2 district hospitals. Patients were randomly assigned to receive either extended stroke nurse follow-up post discharge (n=87) or usual care (n=89). Intervention included a single visit from a stroke nurse within 2 days following discharge to plan further follow-up. Subsequent follow-up/visits were determined according to need. Average number of contacts was 3. Contact was maintained for an average of 2 months. Control group participants received no further contact from the stroke nurse following discharge. Assessments included the Barthel Index, Nottingham Health Profile, Beck Depression Inventory, Frenchay Activities Index and the Caregiver Strain Index at 3 and 12 months post stroke.
Patients in the intervention group were less likely to experience deterioration on the BI when compared to the control group (p=0.049) over 12 months. Intervention patients experienced greater improvement in perceived health than control patients (NHP, p=0.039). At 3 and 12 months, patients in the intervention group reported lower levels of emotional distress (p=0.01, p=0.037) and social isolation (p=0.045 and p=0.002) than the control group. At 3 months, caregivers of intervention patients reported lower levels of stress than caregivers of control patients (p=0.045). This difference was no longer apparent at the 12 month assessment period.
Outcome Measures at 3 and 12 Months after Randomization:
Experimental vs. Control Group
* * *
*
p=.045 * * *
p=.012
*
Outcome Measures:
BI=Barthel Index
BDI=Beck Depression
Inventory
FAI=Frenchay Activity
Index
NHP=Nottingham
Health Profile
CSI=Caregiver Strain
Index
0
20
40
60
80
100
120
140
160
180
200
BI BDI FAI NHP CSI BI BDI FAI NHP CSI
3 Months 12 Months
Outcome Measure*Non-significant p-value
Sc
ore
Control
Experimental

169
Importance: Patients involved in the Forster and Young (1996) study who had received the specialist nursing intervention, reported that they had received a valuable and individualized service that provided them with practical help, information and social support through the interest and encouragement of the visiting nurse (Dowswell et al. 1997). This large study by Burton and Gibbon (2005) provided evidence that post-discharge nursing support is associated with improved health status, reduced emotional distress and social isolation for patients as well as reduced stress for caregivers.

170
Caregiver Training Kalra L, Evans A, Perez I, et al. Training carers of stroke patients: randomised controlled trial. BMJ 2004; 328:1099.
Author / Year Country PEDro score
Methods Outcome
Kalra et al. 2004 UK 7 (RCT)
300 carers of stroke patients were randomised to intervention or control conditions. Participants in the control group received training in basic nursing and techniques to facilitate basic personal care. Outcomes assessed included cost to health and social services systems, caregiving burden, functional status of both patient and carer (BI and FAI), psychological state, quality of life, and patient’s institutionalization or mortality at one year post stroke.
Care costs for patients whose caregivers received training were lower than for those whose carers were untrained (p=0.001). Training was associated with less caregiver burden (p=0.0001), anxiety (p=0.0001), depression (p=0.0001) as well as improved quality of life (p=0.001). Mortality, institutionalization and functional status of the patient were not associated with caregiver training. Training was associated with lower levels of patient anxiety (p<0.0001) and depression (p<0.0001). Patients of trained carers also reported higher quality of life than those whose caregivers had not been part of the training intervention (p=0.009).
Those stroke caregivers who received formal training had improved scores for depression, anxiety and quality of life for both the stroke patients and their caregivers when compared to a control group.
Patient and Caregiver Health Outcomes at 1 Year: Caregiver
Trained vs. Not Trainedp=.0001
p=.0001p=.0001
p=.009
p=.0001
p=.0001
1
10
100
Anxie
ty
Depre
ssio
n
Qualit
y o
f
Life
(Euro
Qol)
Anxie
ty
Depre
ssio
n
Qualit
y o
f
Life
(Euro
Qol)
Patient Outcomes Caregiver Outcomes
Outcome Measure
Sco
re
Trained
Not Trained

171
In this study we excluded the data that utilized medians (Median Frenchay Activities Index, hospital depression and anxiety and EuroQol). Also the data provided will not match the reported p value as it is displayed in an odds ratio.
Importance: This study is important because it demonstrates that specific skills training appears to have a positive influence on both caregiver and patient outcomes, and was consistently associated with a reduction in depression. In particular, providing caregivers with hands-on, practical training in basic nursing and personal care assistance resulted in improved outcomes for both the caregiver and patient on a range of outcomes including depression, anxiety and quality of life.
Study name Subgroup within studyOutcome Statistics for each study Odds ratio and 95% CI
Odds Lower Upper ratio limit limit Z-Value p-Value
Kalra et al. 2004 Patients BI @ 12 months 1.582 1.000 2.504 1.959 0.050
Kalra et al. 2004 Patients BI @ 3 months 1.941 1.220 3.087 2.802 0.005
Kalra et al. 2004 Patients Institutionalisation @ 12 months 0.320 0.064 1.611 -1.382 0.167
Kalra et al. 2004 Patients Institutionalisation @ 3 months 0.423 0.127 1.406 -1.404 0.160
Kalra et al. 2004 Patients Mortality @ 12 months 0.985 0.473 2.051 -0.040 0.968
Kalra et al. 2004 Patients Mortality @ 3 months 0.986 0.380 2.557 -0.029 0.977
Kalra et al. 2004 Patients Mortality or Institutionalisation @ 12 months 0.781 0.400 1.525 -0.723 0.469
Kalra et al. 2004 Patients Mortality or Institutionalisation @ 3 months 0.686 0.323 1.455 -0.983 0.325
Kalra et al. 2004 Patients mRS @ 12 months 1.051 0.653 1.693 0.205 0.838
Kalra et al. 2004 Patients mRS @ 3 months 1.538 0.975 2.426 1.851 0.064
Kalra et al., 2004 Caregivers Caregiver Burden @ 12 months 2.284 1.507 3.462 3.894 0.000
Kalra et al., 2004 Caregivers Caregiver Burden @ 3 months 2.284 1.507 3.462 3.894 0.000
1.473 1.253 1.732 4.696 0.000
0.1 0.2 0.5 1 2 5 10
No Training Training
Kalra et al. 2004
Meta Analysis

172
Family Support for Stroke Mant J, Carter J, Wade DT, Winner S. Family support for stroke: a randomised controlled trial. Lancet 2000; 356:808-813.
Author / Year Country PEDro score
Methods Outcome
Mant et al. 2000 UK 8 (RCT)
Single blind trial of 520 patients and carers randomized to receive either family-support care with the use of an information package or usual post-stroke care.
Carers in the intervention group had significantly better Frenchay activity indices, and SF-36 scores of energy, health, pain and physical function. Carers of the intervention group were more satisfied with their understanding of stroke, its causes, and how to prevent another stroke. A further analysis of this study based on data collected at one year post stroke (Mant et al. 2000) demonstrated no evidence of benefit to the stroke patients. Patients with greater contact with the family support organizer were more likely to be followed up. Benefits to carers seen at 6 months (Mant et al. 2000) persisted at one year, although this was no longer significant (Mant et al. 2005).
Patients and their caregivers who received family support care had significantly better Frenchay activity indices, and SF-36 scores of energy, health, pain and physical function.
Importance: Information provision and/or education have a generally positive effect on a variety of outcomes (such as health related quality of life and extended activities of daily living) for patients and their families. Information provision alone appears to have the most limited effect. However, the addition of either a family support worker may increase the positive effects associated with the provision of information materials, particularly for carers.
Caregiver Outcomes at 6 Months:
Significant Differences between Family Support and Control Groups
p=.03
p=.02
p=.004
p=.03
p=.025
p=.02
p=.01
0 10 20 30 40 50 60 70 80 90 100
Frenchay Activity Indices
SF-36* Energy
SF-36* Mental Health
SF-36* Pain
SF-36* Physical Function
SF-36* General Health Perception
Qol** (Dartmouth Co-op Chart)
Ou
tco
me M
easu
re
Median Score
Control
Family Support
*Short form 36 ** Quality of LIfe
**Quality of life
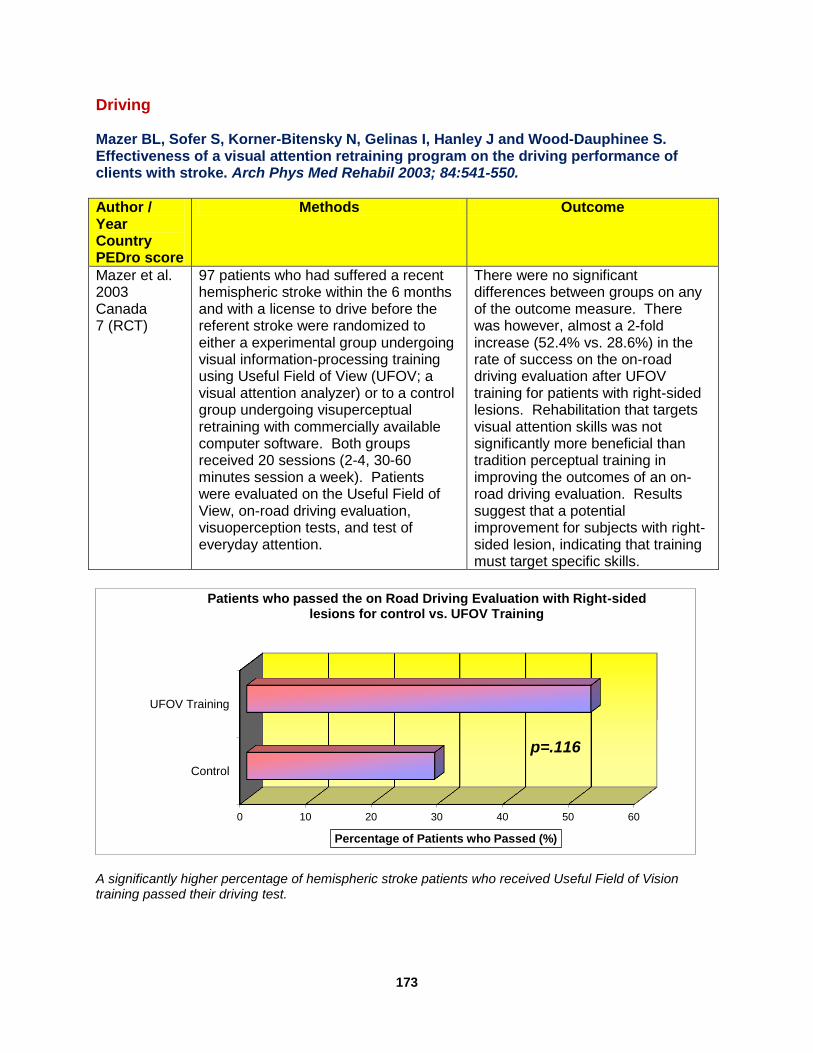
173
Driving Mazer BL, Sofer S, Korner-Bitensky N, Gelinas I, Hanley J and Wood-Dauphinee S. Effectiveness of a visual attention retraining program on the driving performance of clients with stroke. Arch Phys Med Rehabil 2003; 84:541-550.
Author / Year Country PEDro score
Methods Outcome
Mazer et al. 2003 Canada 7 (RCT)
97 patients who had suffered a recent hemispheric stroke within the 6 months and with a license to drive before the referent stroke were randomized to either a experimental group undergoing visual information-processing training using Useful Field of View (UFOV; a visual attention analyzer) or to a control group undergoing visuperceptual retraining with commercially available computer software. Both groups received 20 sessions (2-4, 30-60 minutes session a week). Patients were evaluated on the Useful Field of View, on-road driving evaluation, visuoperception tests, and test of everyday attention.
There were no significant differences between groups on any of the outcome measure. There was however, almost a 2-fold increase (52.4% vs. 28.6%) in the rate of success on the on-road driving evaluation after UFOV training for patients with right-sided lesions. Rehabilitation that targets visual attention skills was not significantly more beneficial than tradition perceptual training in improving the outcomes of an on-road driving evaluation. Results suggest that a potential improvement for subjects with right-sided lesion, indicating that training must target specific skills.
A significantly higher percentage of hemispheric stroke patients who received Useful Field of Vision training passed their driving test.
0 10 20 30 40 50 60
Control
UFOV Training
p=.116
Percentage of Patients who Passed (%)
Patients who passed the on Road Driving Evaluation with Right-sided lesions for control vs. UFOV Training

174
Importance: Driving represents both independence and a return to life within the community.While both attention training and traditional visuoperceptual retraining may result in improved performance of on-road driving evaluations for individuals who have experienced stroke, in general, individuals with right-sided stroke, may derive increased benefit from training that targets specific skills.
Study name Subgroup within study Outcome Statistics for each study Std diff in means and 95% CI
Std diff Standard Lower Upper in means error Variance limit limit Z-Value p-Value
Mazer et al. 2003 Driv ing Evaluation Group 0.155 0.252 0.063 -0.338 0.649 0.618 0.537
Mazer et al. 2003 Driv ing Evaluation Left Side -0.275 0.340 0.116 -0.942 0.393 -0.807 0.420
Mazer et al. 2003 Driv ing Evaluation Right Side 0.450 0.311 0.097 -0.159 1.059 1.447 0.148
Mazer et al. 2003 TEA Elevator counting 0.200 0.219 0.048 -0.229 0.629 0.913 0.361
Mazer et al. 2003 TEA Elevator counting with distraction 0.166 0.219 0.048 -0.263 0.595 0.757 0.449
Mazer et al. 2003 TEA Elevator counting with reversal 0.235 0.219 0.048 -0.194 0.665 1.074 0.283
Mazer et al. 2003 TEA Map search (1 min) 0.097 0.219 0.048 -0.332 0.525 0.442 0.659
Mazer et al. 2003 TEA Map search (2 min) 0.086 0.219 0.048 -0.342 0.515 0.395 0.693
Mazer et al. 2003 TEA Telephone search 0.170 0.219 0.048 -0.259 0.599 0.777 0.437
Mazer et al. 2003 TEA Telephone search while counting 0.052 0.219 0.048 -0.376 0.480 0.237 0.813
Mazer et al. 2003 TEA Visual elevator 0.051 0.219 0.048 -0.378 0.479 0.231 0.817
Mazer et al. 2003 TEA Visual elevator (timing) 0.025 0.218 0.048 -0.403 0.453 0.116 0.908
Mazer et al. 2003 Visuoperception Bells (s) 0.534 0.220 0.048 0.103 0.964 2.429 0.015
Mazer et al. 2003 Visuoperception Charron (s) 0.193 0.216 0.047 -0.231 0.617 0.892 0.372
Mazer et al. 2003 Visuoperception Double cancellation (s) 0.317 0.217 0.047 -0.108 0.743 1.461 0.144
Mazer et al. 2003 Visuoperception Errors, Bells 0.191 0.216 0.047 -0.233 0.615 0.883 0.377
Mazer et al. 2003 Visuoperception Errors, Charron 0.044 0.216 0.047 -0.379 0.468 0.206 0.837
Mazer et al. 2003 Visuoperception Errors, double cancellation 0.034 0.216 0.047 -0.389 0.458 0.159 0.873
Mazer et al. 2003 Visuoperception Errors, road map 0.109 0.216 0.047 -0.315 0.532 0.503 0.615
Mazer et al. 2003 Visuoperception Errors, s ingle cancellation 0.095 0.216 0.047 -0.328 0.518 0.440 0.660
Mazer et al. 2003 Visuoperception Errors, TMT-A 0.108 0.216 0.047 -0.315 0.532 0.500 0.617
Mazer et al. 2003 Visuoperception Errors, TMT-B 0.000 0.216 0.047 -0.423 0.423 0.000 1.000
Mazer et al. 2003 Visuoperception MVPT score 0.023 0.216 0.047 -0.400 0.446 0.108 0.914
Mazer et al. 2003 Visuoperception MVPT score norm 0.032 0.216 0.047 -0.391 0.456 0.150 0.881
Mazer et al. 2003 Visuoperception MVPT time 0.345 0.217 0.047 -0.081 0.771 1.585 0.113
Mazer et al. 2003 Visuoperception MVPT time norm 0.372 0.218 0.047 -0.055 0.798 1.707 0.088
Mazer et al. 2003 Visuoperception Reaction time 1 0.721 0.223 0.050 0.284 1.158 3.236 0.001
Mazer et al. 2003 Visuoperception Reaction time 2 0.425 0.218 0.048 -0.003 0.853 1.946 0.052
Mazer et al. 2003 Visuoperception Reaction time 3 0.301 0.217 0.047 -0.124 0.727 1.387 0.165
Mazer et al. 2003 Visuoperception Road maps (s) 0.251 0.217 0.047 -0.174 0.676 1.157 0.247
Mazer et al. 2003 Visuoperception Single cancellation 0.253 0.217 0.047 -0.172 0.677 1.165 0.244
Mazer et al. 2003 Visuoperception TMT-A (s) 0.300 0.217 0.047 -0.125 0.726 1.382 0.167
Mazer et al. 2003 Visuoperception TMT-B (s) 0.188 0.216 0.047 -0.236 0.612 0.868 0.385
0.193 0.039 0.001 0.117 0.269 4.985 0.000
-2.00 -1.00 0.00 1.00 2.00
Computerized Training UFOV Training
Mazer et al. 2003
Meta Analysis
![The Elements of Stroke Rehabilitation - EBRSR 6... · The Elements of Stroke Rehabilitation pg. 1 of 44 EBRSR [Evidence-Based Review of Stroke Rehabilitation] 6 ... rehabilitation](https://img.dokumen.tips/doc/110x75/5f09ef647e708231d429361a/the-elements-of-stroke-rehabilitation-6-the-elements-of-stroke-rehabilitation.jpg)