Embed Size (px)
Citation preview
Implementing Value Capture for Transport Infrastructure
1
Implementing Value Capture for Transport
Infrastructure
Applicability for South-East Queensland
November 2016
Prepared by
Jonathon Clark-Jones, Nicholas Harvey, Filip Milosavljevic & Preeti Singh
Under Guidance of
Flavio Menezes
Implementing Value Capture for Transport Infrastructure
2
Title
Implementing Value Capture for Transport Infrastructure
Applicability for South-East Queensland
Authors
Jonathon Clark-Jones, Nicholas Harvey, Filip Milosavljevic, and Preeti Singh: under the supervision of
Flavio Menezes
Disclaimer
Report completed as part of coursework for Bachelor of Economics at the University of Queensland
(ECON3900: Project Based Learning), under the supervision of Professor Flavio Menezes.
It may not be used or relied upon by any other person or entity outside of the purposes of this course.
No warranty is given to any other person as to the accuracy of any of the information, data or opinions
expressed herein.
The work and opinions expressed in this report are those of the Authors.
Photo credit for cover page: David Ansen, edited.
Implementing Value Capture for Transport Infrastructure
3
Contents
Contents .................................................................................................................................................. 3
Executive Summary ................................................................................................................................. 6
1.0. Context ........................................................................................................................................ 8
2.0. Economics of Value Generation ................................................................................................ 11
3.0. Case Study: London Crossrail .................................................................................................... 17
4.0. Methods for Evidence-based Value Capture Policy .................................................................. 23
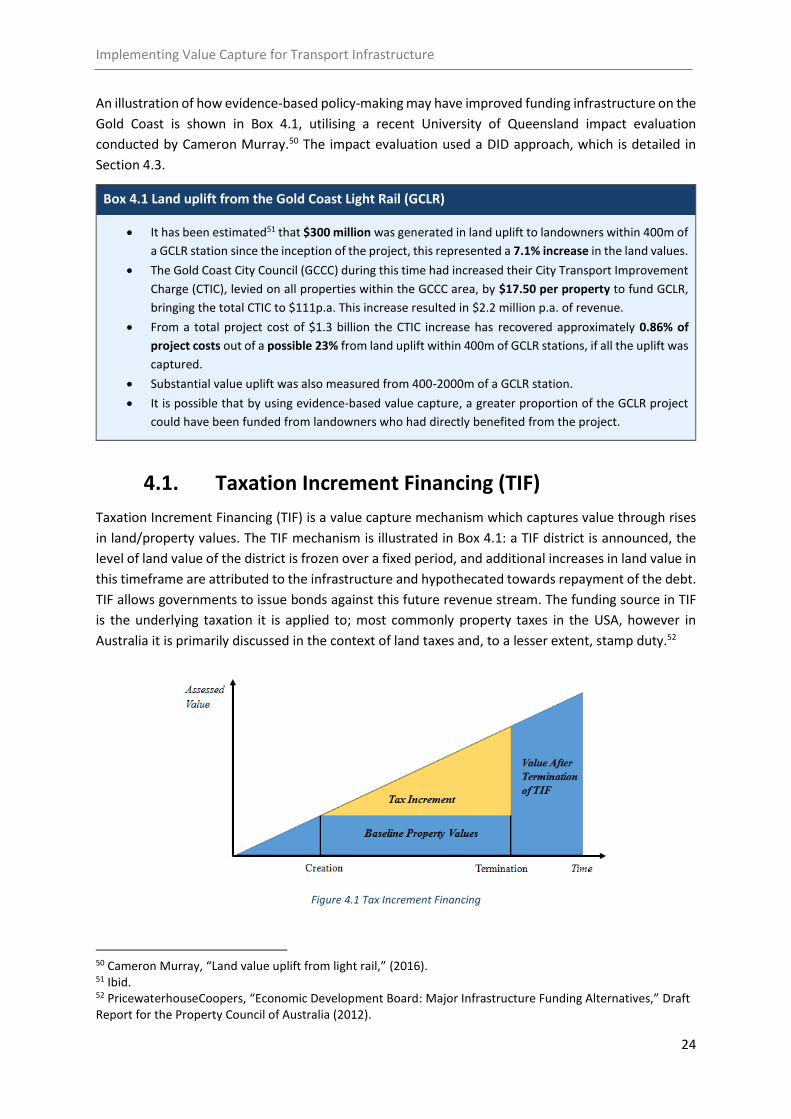
4.1. Taxation Increment Financing (TIF) ...................................................................................... 24
4.2. Hedonic Price Models (HPM) Approach ............................................................................... 26
4.3. Difference-in-Differences (DID) approach ............................................................................ 28
5.0. Options for Value Capture ........................................................................................................ 30
5.1. Ex-Ante vs. Ex-Post Methods ................................................................................................ 30
5.2. Analysis of Capture Methods ................................................................................................ 31
5.3. Negotiated Beneficiary Contributions .................................................................................. 31
5.4. Land Auctions ........................................................................................................................ 31
5.5. Land Taxes ............................................................................................................................. 33
5.6. Policy Options for Council Rates ........................................................................................... 33
5.7. Worked Example: Cross River Rail Project ............................................................................ 35
6.0. Conclusions ............................................................................................................................... 37
References ............................................................................................................................................ 38
TABLE OF BOXES
Box 1.1 Funding vs. Financing ................................................................................................................. 8
Box 1.2 How Government Already Captures Value ................................................................................ 9
Box 2.1 - Benefits of Accessibility to EPOIs ........................................................................................... 11
Box 3.1 Statutory Authority .................................................................................................................. 17
Box 3.2 What is a successful tax?.......................................................................................................... 19
Box 4.1 Land uplift from the Gold Coast Light Rail (GCLR) ................................................................... 24
Box 4.2 Hedonic Pricing Models ........................................................................................................... 26
Box 4.3 Endogeneity in Econometric Models ....................................................................................... 29
Implementing Value Capture for Transport Infrastructure
4
Box 5.1 Development Opportunities for Land Auction......................................................................... 32
Box 5.2 Land Auction Design ................................................................................................................. 32
Box 5.3 Example of Value Capture Flat Tax .......................................................................................... 34
TABLE OF FIGURES
Figure 1.1 Percentage of Operating Costs Covered by Fares.................................................................. 9
Figure 1.2 Public transport users by personal income in Sydney ......................................................... 10
Figure 2.1 Demand Mechanism for Land Value Uplift .......................................................................... 12
Figure 2.2 Relationship between Value Uplift and Distance to Station ................................................ 12
Figure 2.3 Marginal Benefit of Accessibility .......................................................................................... 13
Figure 2.4 Distance to EPOI vs. Value Uplift ......................................................................................... 14
Figure 2.5 Residential vs. Commercial Value Uplift .............................................................................. 14
Figure 2.6 Theoretical Value Curve from Transit Infrastructure ........................................................... 15
Figure 2.7 Empirical Evidence: Time Dependence of Value Uplift - Perth, Australia ........................... 16
Figure 3.1 London Crossrail Route Map ................................................................................................ 17
Figure 3.2 Crossrail funding structure .................................................................................................. 18
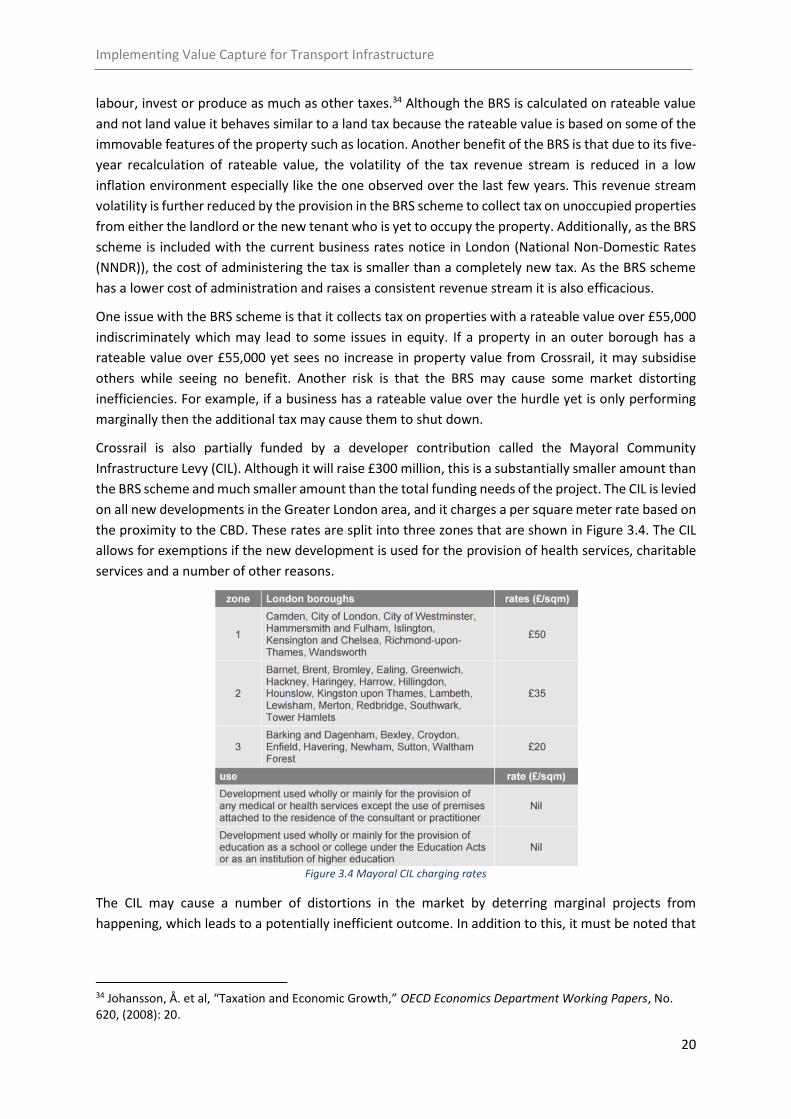
Figure 3.3 Crossrail Limited’s Stakeholders .......................................................................................... 18
Figure 3.4 Mayoral CIL charging rates ................................................................................................... 20
Figure 3.5 Density and Percentage of Project Funded Relationship .................................................... 22
Figure 4.1 Tax Increment Financing ...................................................................................................... 24
Figure 4.2 TIF in Chicago ....................................................................................................................... 25
Figure 4.3 Application of Hedonic Price Indices to Forecast Future Value ........................................... 27
Figure 4.4 DID Method .......................................................................................................................... 28
Figure 4.5 Application of Difference-in-Differences Approach to Measure Future Value ................... 29
Figure 5.1 Potential Value Catchment Areas ........................................................................................ 35
TABLE OF TABLES
Table 2.1 Empirical Research: Effect of Distance to Station on Property Value Uplift ......................... 13
Table 2.2 Empirical Evidence: Residential vs. Commercial Land .......................................................... 15
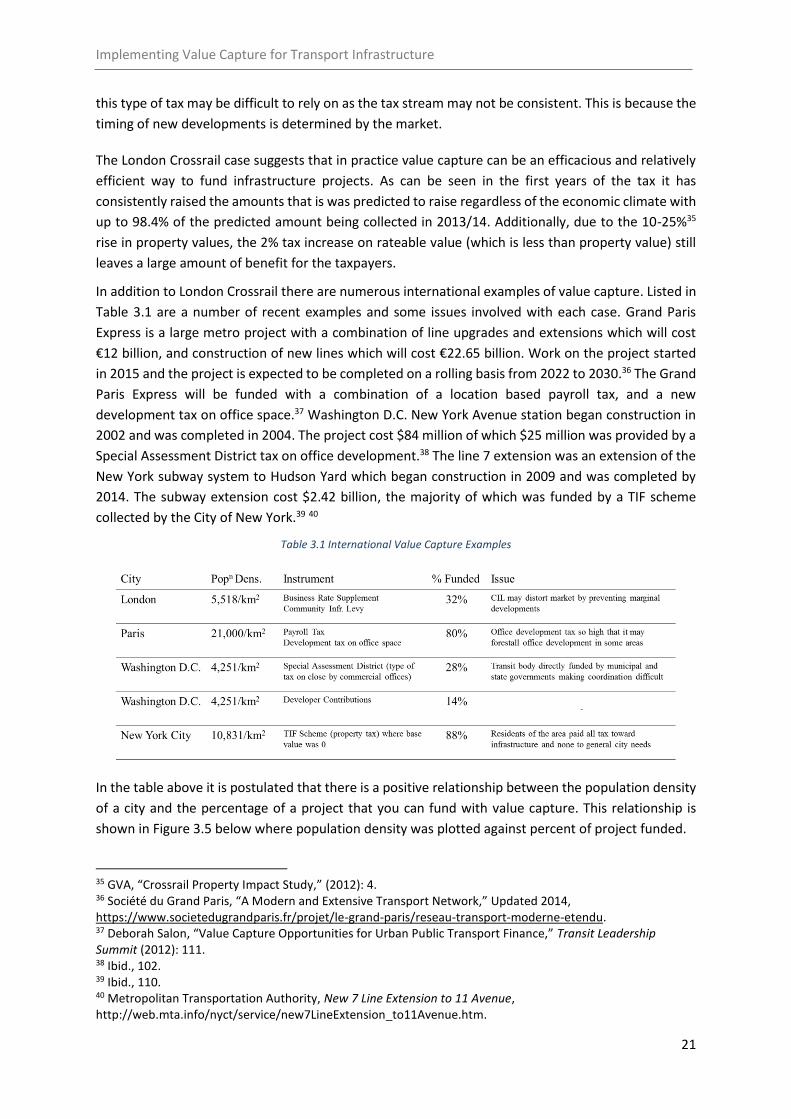
Table 3.1 International Value Capture Examples .................................................................................. 21
Table 3.2 BRS Scheme Applied to Brisbane .......................................................................................... 22
Table 5.1 Catchment Characteristics .................................................................................................... 35
Table 5.2 Summary of Worked Example ............................................................................................... 36
Implementing Value Capture for Transport Infrastructure
5
ABBREVIATIONS
BCC – Brisbane City Council
BRS – Business Rates Supplement
BRT – Bus Rapid Transit
CIL – Community Infrastructure Levy
CRR – Cross River Rail
CTIC – City Transport Improvement Charge
DfT – Department for Transport
DID – Difference-in-Differences
EPOI – Economic Point of Interest
GCCC – Gold Coast City Council
HPM – Hedonic Price Model
MBA – Marginal Benefit of Accessibility
NNDR – National Non-Domestic Rates
OVB – Omitted Variable Bias
SEQ – South-East Queensland
TfL – Transport for London
TIF – Tax Increment Financing
Implementing Value Capture for Transport Infrastructure
6
Executive Summary
A practical path for implementing value capture in South-East Queensland has remained largely
unexamined despite its popularity as a solution to fund infrastructure in Australia. Our contribution to
the discourse is a framework examining how transport infrastructure generates value to land as well
as an analysis of international approaches of value capture. In this report we make the case for
evidence-based value capture policy, introduce methods to measure value accrual, and options to
capture it.
We have developed a framework of how transport infrastructure generates value to land. This can aid
the policy maker in understanding how benefit is accrued, and aims to assist in delivering a targeted
value capture solution. Value uplift due to transport infrastructure is equal to the added benefit of
accessibility to an economic point of interest (EPOI). This definition allows us to infer several
theoretical concepts regarding value uplift. First, is that value uplift increases as land gets closer to the
station. This relationship does not hold in the immediate proximity of the station as negative effects
of transport infrastructure lower value uplift. Second, is the notion that an additional connection will
generate less value uplift in an area that is well-connected (i.e. very accessible to EPOIs) than a poorly-
connected area. Third, is the concept that for a given project, land further from an EPOI will see greater
value uplift than land closer to the EPOI. Lastly, commercial property will experience greater value
uplift than residential, however this uplift will be more concentrated around the access point.
We then consider a case study to demonstrate how value capture has worked in practice, whether it
has been successful, and what lessons can be applied to Brisbane. We chose London Crossrail for the
case study as it is a well-recognised project that uses a common method of conducting value capture.
London Crossrail uses a combination of a rates uplift (the Business Rate Supplement Scheme (BRS))
and developer taxes (the Mayoral Community Infrastructure Levy and Developer Contributions) to
fund approximately 32% of the project capital. The BRS Scheme will provide the majority of the
funding, raising £4.1 billion of the capital cost. We show that the London case uses the principle of
collecting a small amount from a large group and does so efficaciously and efficiently.
We then look at additional international examples of value capture and the issues surrounding each
case. Using these cases, we can postulate that a positive relationship exists between the population
density of a city and the percent of a project that you can fund with value capture. Using Brisbane City
Council rates, we apply London’s Crossrail BRS scheme to Brisbane. We find that the same tax could
only raise up to 2% of Cross River Rail’s funding needs. Hence, a more sophisticated approach is
needed to fund a significant amount of Cross River Rail.
Exploring these more refined approaches we found that if governments have access to information
about where value is generated, they can design evidence-based policy that will be more effective and
equitable. The challenge in using evidence-based policy-making for value capture is isolating and
estimating the effect that infrastructure has had on land values. The most frequently used ‘impact
evaluation’ techniques assess the impact of transportation infrastructure on property/land values
with Hedonic Price Models, and more recently with Difference-in-Differences Estimators. The
Difference-in-Differences estimator can be used to measure what effect a project has had on different
parties, in different locations, and when the value has been seen. Hedonic Pricing models can measure
and predict value uplift, however, they do not observe the timing of value accrual. There is no ‘one
Implementing Value Capture for Transport Infrastructure
7
size fits all’ solution to impact evaluation for value capture, however, with an understanding of the
techniques and their strengths and limitations, we can decide which is most applicable to the data,
objectives and specifics of the project.
We then discuss Taxation Increment Financing (TIF), a mechanism which has frequently been
discussed within the context of value capture. It has the benefit of being useful when impact
evaluations are not possible as it does not involve measuring value accrual. However, in TIF, all value
uplift is attributed to the infrastructure and does not isolate its effect. TIF use has slowed in recent
years, and its effectiveness has been called into question. Projects using TIF have often failed to
generate employment, business and real estate activity; as a result, municipalities have seen fiscal
strain as the burden of the debt has fallen on them. This report also addresses the misconception that
TIF will add additional revenue and diversify funding sources. Only by introducing/increasing tax rates
can revenue rise, as TIF simply allocates a portion of revenue to repayment of the debt.
We then consider the different policy options available to capture value uplift. We categorise these
options as either ex-ante methods, where the value is captured at the implementation of the tax or
an ex-post tax where the value is collected over a specified life. We consider the merits of each method
and find that by broadening the tax base of an ex-post land tax, it has the potential to recover a much
larger percentage of a project’s cost than ex-ante methods. With the aim of only capturing a
proportion of the total value uplift, a land tax scheme has the potential to recover a significant
percentage of a project’s cost while also leaving benefit for landowners. By using a worked example
with land value uplift of 3-7% around the Cross River Rail project, we suggest the combination of a
lump sum charge applied to the network and a special flat rate applied to certain landowners could
generate $33.5m-$45.1m annually. By implementing this strategy over a thirty-year timeframe, we
show that 14.5%-19.5% of the total project cost could be recovered while still leaving substantial
benefit to landowners.
Implementing Value Capture for Transport Infrastructure
8
1.0. Context
In Australia, cities contribute nearly 80% of national GDP1, and the World Bank estimates that human
capital accounts for more of Australia’s wealth than double that of produced and natural wealth
combined.2 There is significant pressure for transport infrastructure that will sustain and grow output
into the future. Estimates indicate that the four largest Australian cities will need to accommodate 5.9
million more people in the next 20 years, and with 4 out of 5 projects on the 2016 Infrastructure
Australia high priority list aimed at easing urban congestion 3, the need for transport infrastructure is
rising.
Citibank and Infrastructure Partnerships Australia estimates Australia’s infrastructure funding deficit
at approximately $700 billion4, and Infrastructure Australia states, “… under current arrangements,
governments do not have sufficient headroom on their budgets to fund the level of infrastructure
required.”5 This is indicative of the growing pressure to reshape current funding models. See Box 1.1
for the distinction between funding and financing.
Infrastructure that will support the growth of Australian cities will require funding mechanisms that
are adequately diversified and reliable to meet future challenges and opportunities. Value capture has
become prominent in the funding conversation as an innovative solution. Despite this, Menezes
makes the argument that value capture is a not an innovative solution, and can be considered a time-
tested source of funding8. Value capture has been used in Australia since the 1920s in the form of
betterment taxes and improvement levies. Using betterment taxes, the New South Wales
Government was able to fund a third of the total cost of the Sydney Harbour Bridge.9
1 The Department of Infrastructure and Transport, “Our Cities, Our Future- A national urban policy for a productive, sustainable and liveable future”, (2011). 2 World Bank, “The Changing Wealth of Nations: Measuring Sustainable Development in the New Millennium Washington D.C”, (2011): 27. 3 Infrastructure Australia, “Australian Infrastructure Plan”, (2016). 4 PricewaterhouseCoopers, “Funding Australia’s Infrastructure”, (2014). 5 Infrastructure Australia, “Infrastructure Finance and Funding Reform”- Report by Infrastructure Finance Working Group (IFWG) (2012). 6 Roy, M, “Alternative Funding and Financing Mechanisms for Rail Projects: Summary and Relevance for Freight Rail Projects”, CPCS (2015). 7 Terrill, M, “Roads to riches: Better transport infrastructure”, Grattan Institute (2016). 8 Flavio Menezes, “Time-tested Ways to Fund Infrastructure,” Presentation, 2nd Annual QLD Infrastructure Projects Conference (2016). 9 Prosper Australia Research Institute, “Value Capture- a historical perspective”.
Box 1.1 Funding vs. Financing
Funding refers to the sources of revenue being used to pay for infrastructure. It reflects who ultimately pays
for the infrastructure to be built and maintained over its lifetime. Public transport fares are a funding source
which directly charges the users of the project. However, most funding for public transport infrastructure
comes from the community through general taxation.6
Financing refers to the financial tools that can be used to pay for the infrastructure (i.e. bonds, equity, capital
leasing).7
Implementing Value Capture for Transport Infrastructure
9
Value capture is a funding tool that aims to capture benefits of public infrastructure, to then use these
benefits to fund the project. Some of the benefits of infrastructure are already captured by
government, such as increased revenue from income taxes, decreased welfare spending, as well as
revenue from transport fares (see Box 1.2). Additionally, value accrues to private parties such as land
owners, which government is able to capture through rates and land tax.
There are two major limitations with using existing land taxation for value capture. Firstly, while there
is an increase in tax revenue this increase is not always allocated to infrastructure funding. Secondly,
only a small percentage of value uplift is able to be captured.
Box 1.2 How Government Already Captures Value
Government currently captures some of the benefits of transport infrastructure, however, these revenue
streams are not directly used to fund transport infrastructure projects. Benefits due to increased
employment and education opportunities are captured through increases in income tax revenue, as well
as decreases in welfare payments. Similarly, increased opportunities for consumption and leisure are
captured through increases in GST revenue.
More directly is how Government recoups some of the benefits of public transport by fare-box revenue,
and road usage through tolls. Additionally, a portion of land value uplift is captured through land taxes.
Current methods for funding infrastructure have been criticised as being inequitable.10 This inequity
arises from the entire set of taxpayers subsidising a transport infrastructure project, even though only
a small portion of them will see benefit. Infrastructure Australia has stated that this imbalance
between the user and the taxpayer should be fairer and that direct users should make a greater
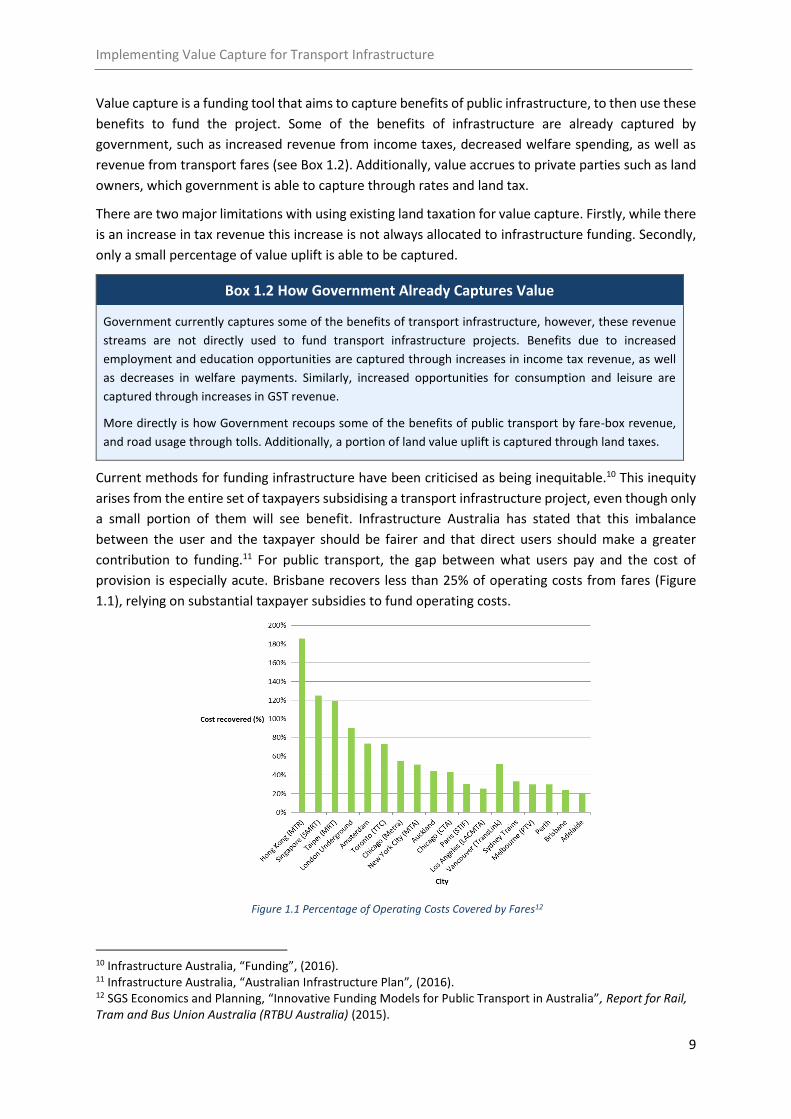
contribution to funding.11 For public transport, the gap between what users pay and the cost of
provision is especially acute. Brisbane recovers less than 25% of operating costs from fares (Figure
1.1), relying on substantial taxpayer subsidies to fund operating costs.
Figure 1.1 Percentage of Operating Costs Covered by Fares12
10 Infrastructure Australia, “Funding”, (2016). 11 Infrastructure Australia, “Australian Infrastructure Plan”, (2016). 12 SGS Economics and Planning, “Innovative Funding Models for Public Transport in Australia”, Report for Rail, Tram and Bus Union Australia (RTBU Australia) (2015).
Implementing Value Capture for Transport Infrastructure
10
Therefore, for infrastructure built in Brisbane, taxpayers generally fully fund the capital costs of
infrastructure and the majority of the operating costs. Project costs for the Brisbane Cross River Rail
total $5.4b, of which 50% comprise capital costs and 44% comprise operating costs.
However, if public transport fares were to rise in order to fund a greater percentage of an
infrastructure project, there would be two major limitations; affordability, and the flow-on effects of
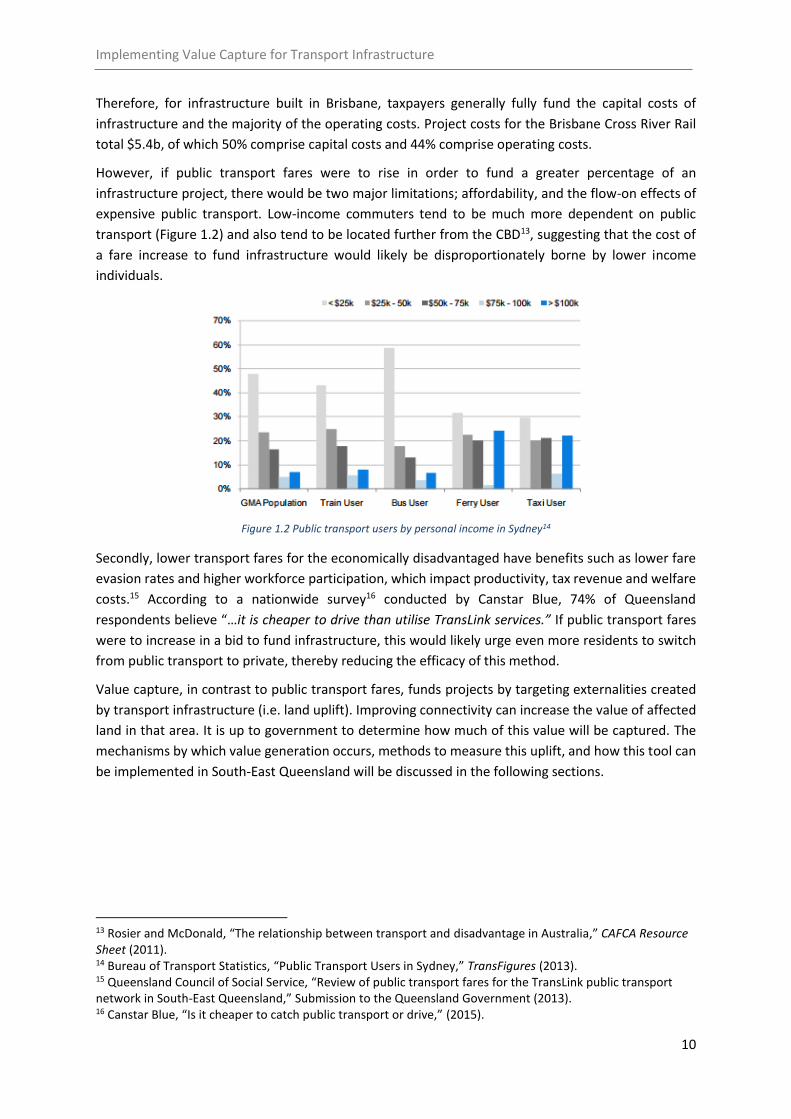
expensive public transport. Low-income commuters tend to be much more dependent on public
transport (Figure 1.2) and also tend to be located further from the CBD13, suggesting that the cost of
a fare increase to fund infrastructure would likely be disproportionately borne by lower income
individuals.
Figure 1.2 Public transport users by personal income in Sydney14
Secondly, lower transport fares for the economically disadvantaged have benefits such as lower fare
evasion rates and higher workforce participation, which impact productivity, tax revenue and welfare
costs.15 According to a nationwide survey16 conducted by Canstar Blue, 74% of Queensland
respondents believe “…it is cheaper to drive than utilise TransLink services.” If public transport fares
were to increase in a bid to fund infrastructure, this would likely urge even more residents to switch
from public transport to private, thereby reducing the efficacy of this method.
Value capture, in contrast to public transport fares, funds projects by targeting externalities created
by transport infrastructure (i.e. land uplift). Improving connectivity can increase the value of affected
land in that area. It is up to government to determine how much of this value will be captured. The
mechanisms by which value generation occurs, methods to measure this uplift, and how this tool can
be implemented in South-East Queensland will be discussed in the following sections.
13 Rosier and McDonald, “The relationship between transport and disadvantage in Australia,” CAFCA Resource Sheet (2011). 14 Bureau of Transport Statistics, “Public Transport Users in Sydney,” TransFigures (2013). 15 Queensland Council of Social Service, “Review of public transport fares for the TransLink public transport network in South-East Queensland,” Submission to the Queensland Government (2013). 16 Canstar Blue, “Is it cheaper to catch public transport or drive,” (2015).
Implementing Value Capture for Transport Infrastructure
11
2.0. Economics of Value Generation
This section intends to provide a theoretical framework for how transport infrastructure adds value
to land. This will allow projects to be assessed on a case-by-case basis for the potential gains they may
be capable of providing, and whether value capture will be suitable.
An analysis of how value is generated also allows the policy maker to deliver a more targeted value
capture solution. This is achieved by looking at how value uplift is distributed to different parties,
depending on a range of variables. These include the proximity to the transport access point, the
location of the project, and the land use of the site.
This distributional analysis may have applications for use in cost-benefit analysis for the infrastructure
project. Estimated value uplift, based on this theoretical framework and measurement techniques
(see section 4.0. can be derived and used to evaluate whether the infrastructure provides enough
benefits to outweigh its costs.
It is necessary to establish some first principles in order to analyse value capture. First, the demand
for transport infrastructure is a derived demand, where true demand arises from a need for
accessibility to economic points of interest (EPOI) (see Box 2.1). Benefit is accrued to those that
directly utilise the infrastructure, as well as those that can benefit from network improvements the
transport infrastructure may provide.
Box 2.1 - Benefits of Accessibility to EPOIs
EPOIs host employment and education opportunities, as well as centres for leisure and
consumption. Improving accessibility to EPOIs with infrastructure benefits its direct users, as well
as the wider network.
Direct users are benefitted through increased opportunities for education, employment, and
leisure, and/or decreased travel time to these destinations. Transport infrastructure can also
benefit the broader network by decreasing pollution and easing congestion.
It is also important to recognise that value capture is already undertaken by government. Benefits of
infrastructure are able to be recaptured directly through user charges, and inadvertently through
increased tax revenue. This report will be focussed on the latter, more specifically, on the value
accrued to land owners.
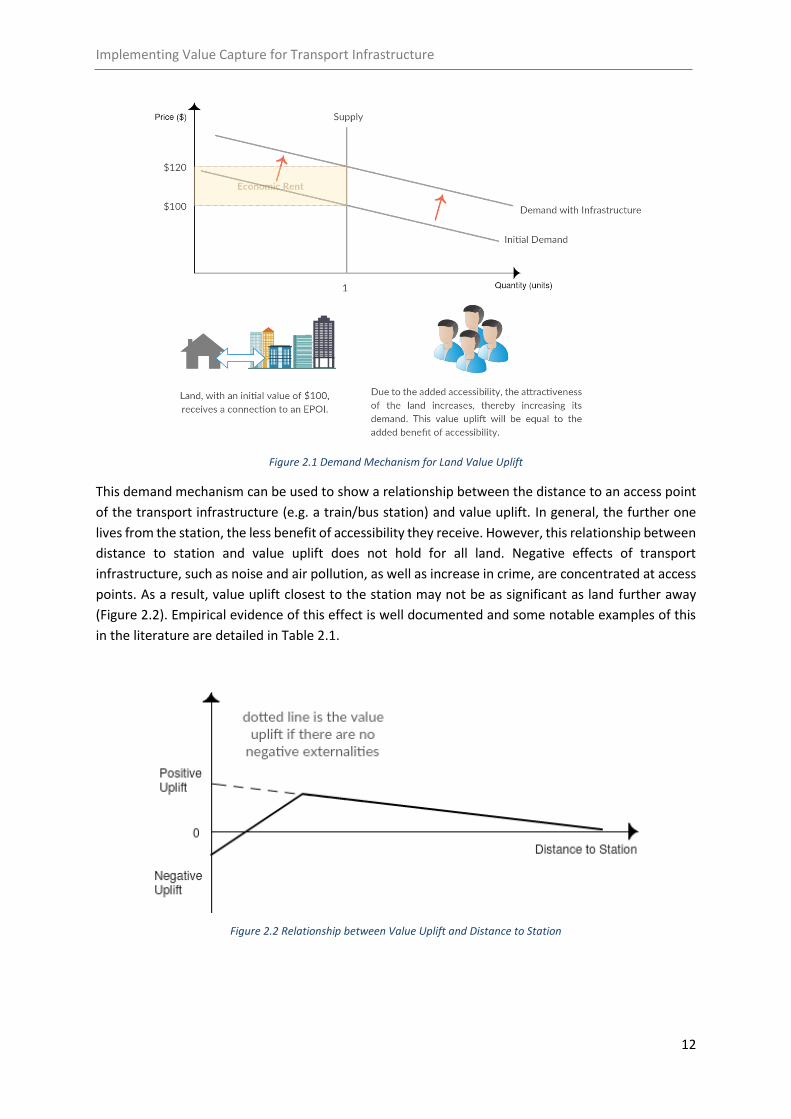
Infrastructure projects, through the demand mechanism seen in Figure 2.1, create a value uplift on
land. This demand mechanism recognises that the demand for land is partially driven by how well
connected it may be to the user’s EPOIs, and that users will be willing to pay for this added
accessibility. Therefore, this value increase, leaving all other things equal, will be equivalent to the
perceived added benefit of accessibility that the transport infrastructure provides. It is this benefit
that a value capture mechanism aims to recapture.
Implementing Value Capture for Transport Infrastructure
12
Figure 2.1 Demand Mechanism for Land Value Uplift
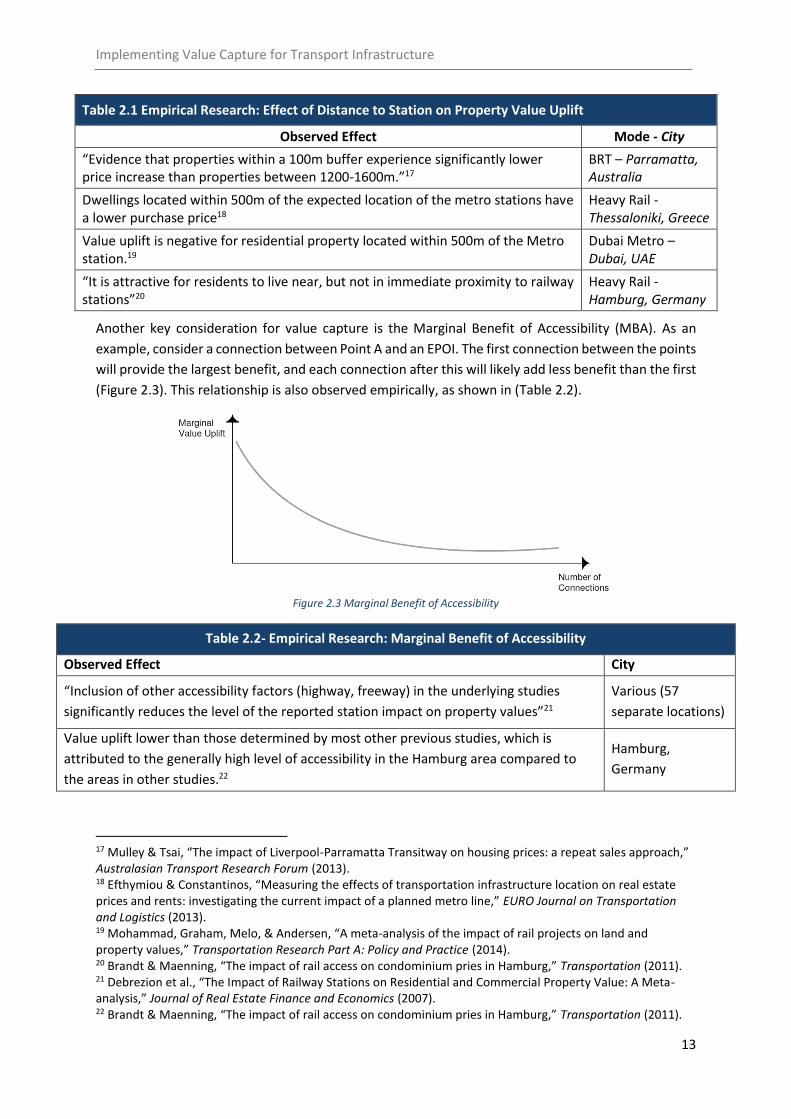
This demand mechanism can be used to show a relationship between the distance to an access point
of the transport infrastructure (e.g. a train/bus station) and value uplift. In general, the further one
lives from the station, the less benefit of accessibility they receive. However, this relationship between
distance to station and value uplift does not hold for all land. Negative effects of transport
infrastructure, such as noise and air pollution, as well as increase in crime, are concentrated at access
points. As a result, value uplift closest to the station may not be as significant as land further away
(Figure 2.2). Empirical evidence of this effect is well documented and some notable examples of this
in the literature are detailed in Table 2.1.
Figure 2.2 Relationship between Value Uplift and Distance to Station
Implementing Value Capture for Transport Infrastructure
13
Table 2.1 Empirical Research: Effect of Distance to Station on Property Value Uplift
Observed Effect Mode - City
“Evidence that properties within a 100m buffer experience significantly lower price increase than properties between 1200-1600m.”17
BRT – Parramatta, Australia
Dwellings located within 500m of the expected location of the metro stations have a lower purchase price18
Heavy Rail - Thessaloniki, Greece
Value uplift is negative for residential property located within 500m of the Metro station.19
Dubai Metro – Dubai, UAE
“It is attractive for residents to live near, but not in immediate proximity to railway stations”20
Heavy Rail -Hamburg, Germany
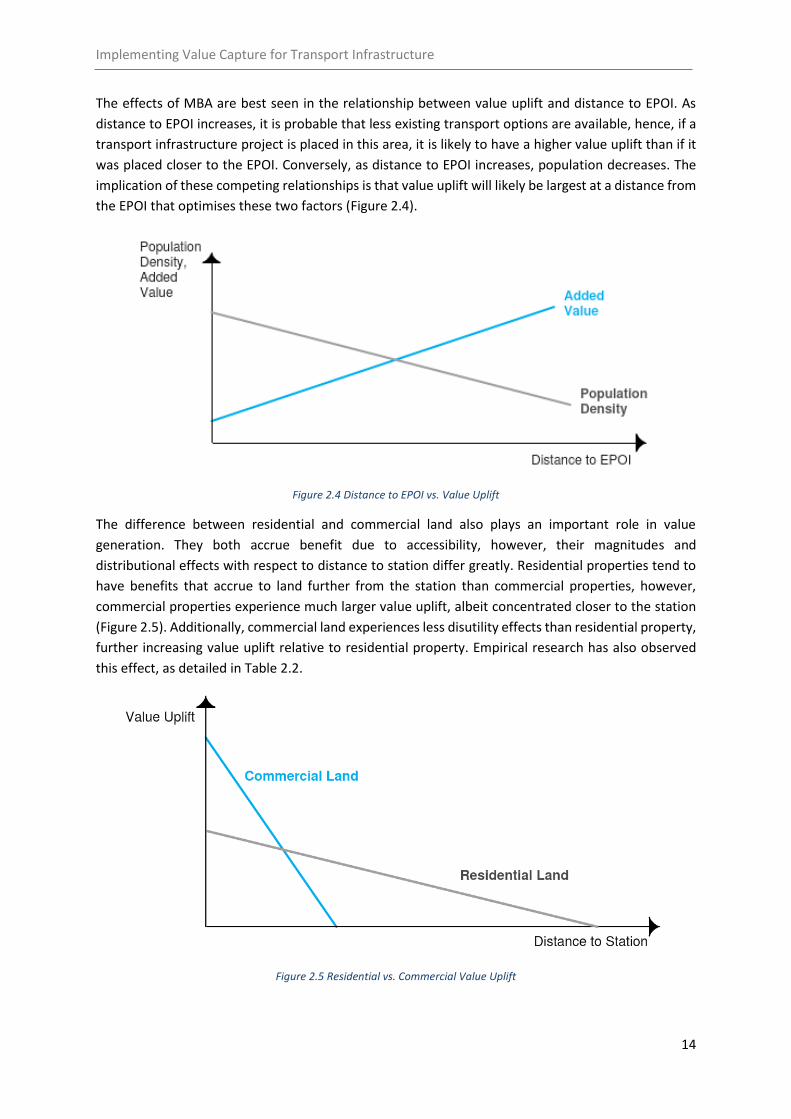
Another key consideration for value capture is the Marginal Benefit of Accessibility (MBA). As an
example, consider a connection between Point A and an EPOI. The first connection between the points
will provide the largest benefit, and each connection after this will likely add less benefit than the first
(Figure 2.3). This relationship is also observed empirically, as shown in (Table 2.2).
Figure 2.3 Marginal Benefit of Accessibility
Table 2.2- Empirical Research: Marginal Benefit of Accessibility
Observed Effect City
“Inclusion of other accessibility factors (highway, freeway) in the underlying studies
significantly reduces the level of the reported station impact on property values”21
Various (57
separate locations)
Value uplift lower than those determined by most other previous studies, which is
attributed to the generally high level of accessibility in the Hamburg area compared to
the areas in other studies.22
Hamburg,
Germany
17 Mulley & Tsai, “The impact of Liverpool-Parramatta Transitway on housing prices: a repeat sales approach,” Australasian Transport Research Forum (2013). 18 Efthymiou & Constantinos, “Measuring the effects of transportation infrastructure location on real estate prices and rents: investigating the current impact of a planned metro line,” EURO Journal on Transportation and Logistics (2013). 19 Mohammad, Graham, Melo, & Andersen, “A meta-analysis of the impact of rail projects on land and property values,” Transportation Research Part A: Policy and Practice (2014). 20 Brandt & Maenning, “The impact of rail access on condominium pries in Hamburg,” Transportation (2011). 21 Debrezion et al., “The Impact of Railway Stations on Residential and Commercial Property Value: A Meta-analysis,” Journal of Real Estate Finance and Economics (2007). 22 Brandt & Maenning, “The impact of rail access on condominium pries in Hamburg,” Transportation (2011).
Implementing Value Capture for Transport Infrastructure
14
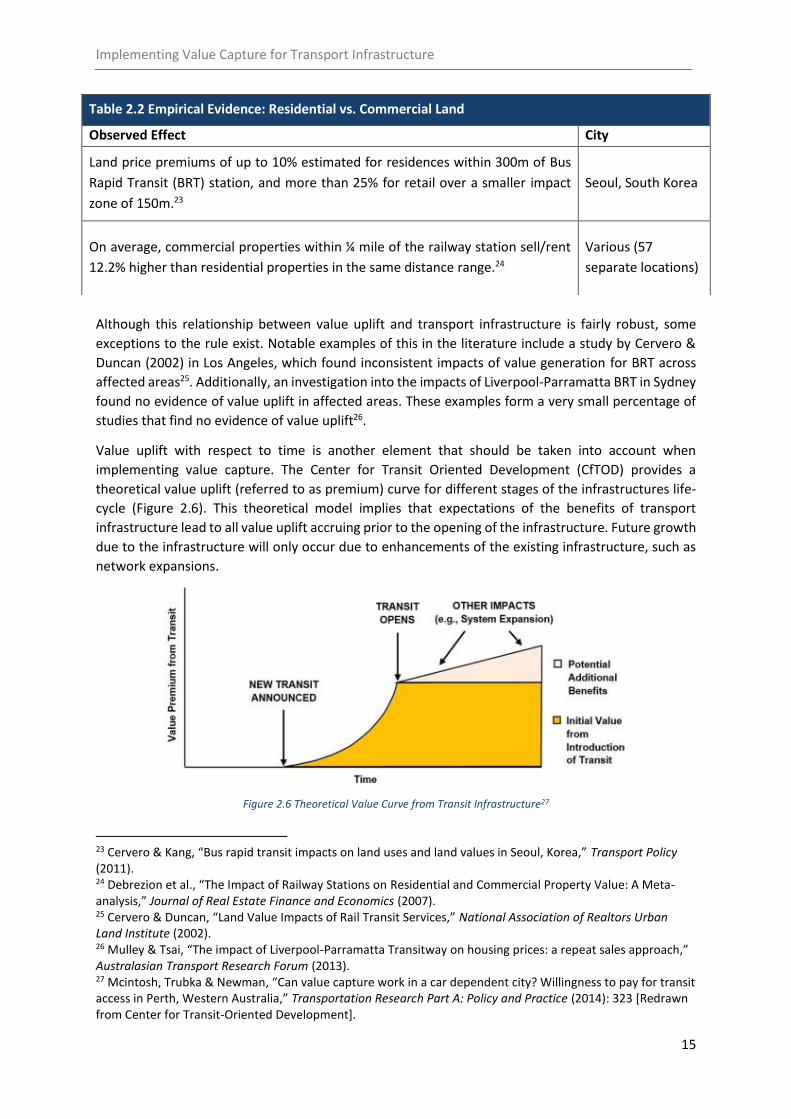
The effects of MBA are best seen in the relationship between value uplift and distance to EPOI. As
distance to EPOI increases, it is probable that less existing transport options are available, hence, if a
transport infrastructure project is placed in this area, it is likely to have a higher value uplift than if it
was placed closer to the EPOI. Conversely, as distance to EPOI increases, population decreases. The
implication of these competing relationships is that value uplift will likely be largest at a distance from
the EPOI that optimises these two factors (Figure 2.4).
Figure 2.4 Distance to EPOI vs. Value Uplift
The difference between residential and commercial land also plays an important role in value
generation. They both accrue benefit due to accessibility, however, their magnitudes and
distributional effects with respect to distance to station differ greatly. Residential properties tend to
have benefits that accrue to land further from the station than commercial properties, however,
commercial properties experience much larger value uplift, albeit concentrated closer to the station
(Figure 2.5). Additionally, commercial land experiences less disutility effects than residential property,
further increasing value uplift relative to residential property. Empirical research has also observed
this effect, as detailed in Table 2.2.
Figure 2.5 Residential vs. Commercial Value Uplift
Implementing Value Capture for Transport Infrastructure
15
Although this relationship between value uplift and transport infrastructure is fairly robust, some
exceptions to the rule exist. Notable examples of this in the literature include a study by Cervero &
Duncan (2002) in Los Angeles, which found inconsistent impacts of value generation for BRT across
affected areas25. Additionally, an investigation into the impacts of Liverpool-Parramatta BRT in Sydney
found no evidence of value uplift in affected areas. These examples form a very small percentage of
studies that find no evidence of value uplift26.
Value uplift with respect to time is another element that should be taken into account when
implementing value capture. The Center for Transit Oriented Development (CfTOD) provides a
theoretical value uplift (referred to as premium) curve for different stages of the infrastructures life-
cycle (Figure 2.6). This theoretical model implies that expectations of the benefits of transport
infrastructure lead to all value uplift accruing prior to the opening of the infrastructure. Future growth
due to the infrastructure will only occur due to enhancements of the existing infrastructure, such as
network expansions.
Figure 2.6 Theoretical Value Curve from Transit Infrastructure27
23 Cervero & Kang, “Bus rapid transit impacts on land uses and land values in Seoul, Korea,” Transport Policy (2011). 24 Debrezion et al., “The Impact of Railway Stations on Residential and Commercial Property Value: A Meta-analysis,” Journal of Real Estate Finance and Economics (2007). 25 Cervero & Duncan, “Land Value Impacts of Rail Transit Services,” National Association of Realtors Urban Land Institute (2002). 26 Mulley & Tsai, “The impact of Liverpool-Parramatta Transitway on housing prices: a repeat sales approach,” Australasian Transport Research Forum (2013). 27 Mcintosh, Trubka & Newman, “Can value capture work in a car dependent city? Willingness to pay for transit access in Perth, Western Australia,” Transportation Research Part A: Policy and Practice (2014): 323 [Redrawn from Center for Transit-Oriented Development].
Table 2.2 Empirical Evidence: Residential vs. Commercial Land
Observed Effect City
Land price premiums of up to 10% estimated for residences within 300m of Bus
Rapid Transit (BRT) station, and more than 25% for retail over a smaller impact
zone of 150m.23
Seoul, South Korea
On average, commercial properties within ¼ mile of the railway station sell/rent
12.2% higher than residential properties in the same distance range.24
Various (57
separate locations)
Implementing Value Capture for Transport Infrastructure
16
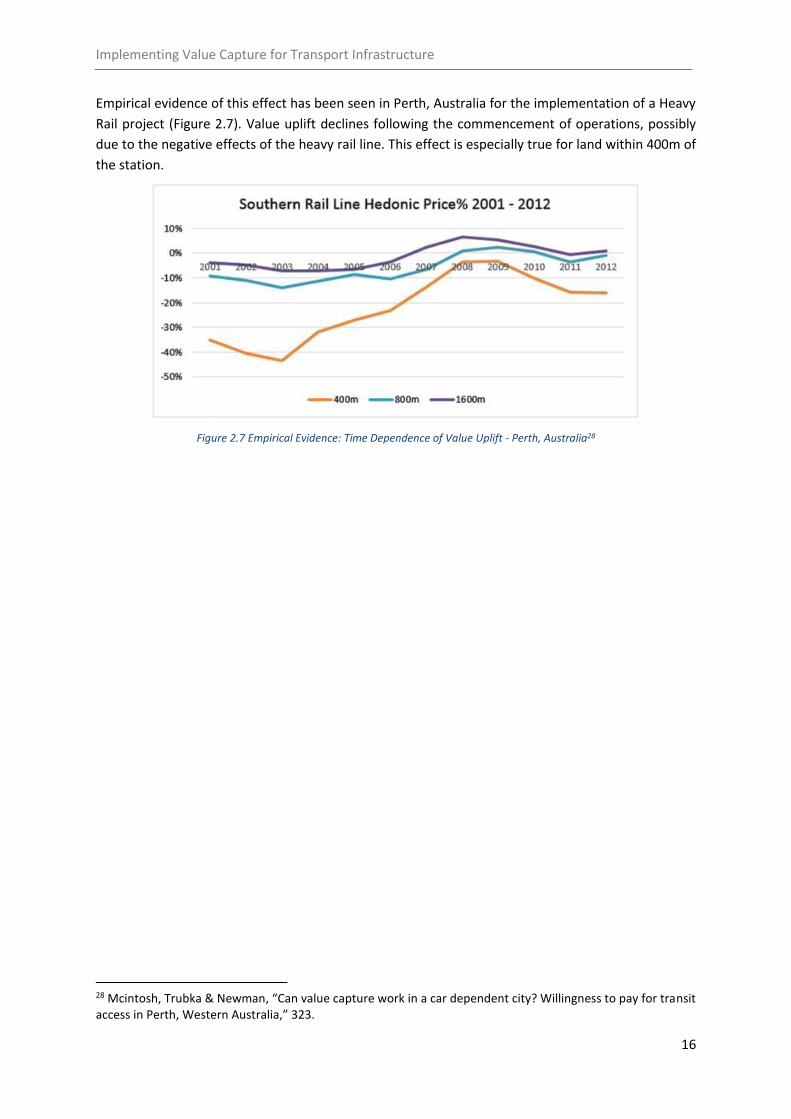
Empirical evidence of this effect has been seen in Perth, Australia for the implementation of a Heavy
Rail project (Figure 2.7). Value uplift declines following the commencement of operations, possibly
due to the negative effects of the heavy rail line. This effect is especially true for land within 400m of
the station.
Figure 2.7 Empirical Evidence: Time Dependence of Value Uplift - Perth, Australia28
28 Mcintosh, Trubka & Newman, “Can value capture work in a car dependent city? Willingness to pay for transit access in Perth, Western Australia,” 323.
Implementing Value Capture for Transport Infrastructure
17
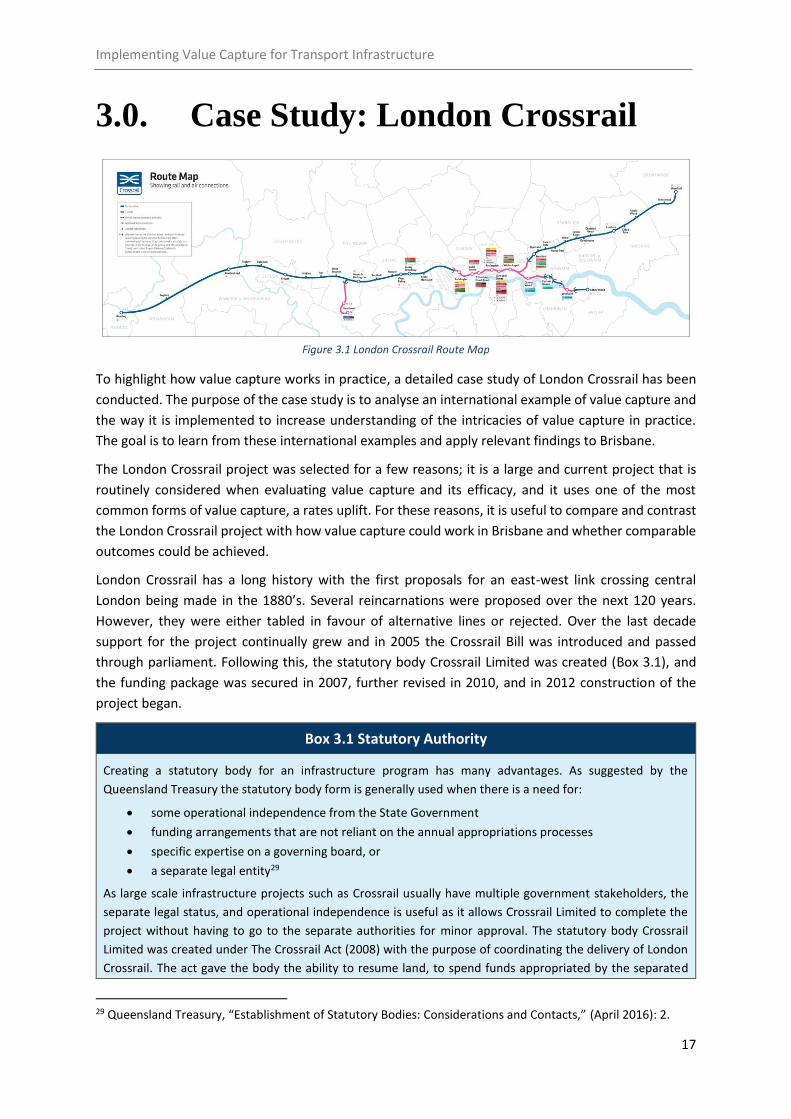
3.0. Case Study: London Crossrail
Figure 3.1 London Crossrail Route Map
To highlight how value capture works in practice, a detailed case study of London Crossrail has been
conducted. The purpose of the case study is to analyse an international example of value capture and
the way it is implemented to increase understanding of the intricacies of value capture in practice.
The goal is to learn from these international examples and apply relevant findings to Brisbane.
The London Crossrail project was selected for a few reasons; it is a large and current project that is
routinely considered when evaluating value capture and its efficacy, and it uses one of the most
common forms of value capture, a rates uplift. For these reasons, it is useful to compare and contrast
the London Crossrail project with how value capture could work in Brisbane and whether comparable
outcomes could be achieved.
London Crossrail has a long history with the first proposals for an east-west link crossing central
London being made in the 1880’s. Several reincarnations were proposed over the next 120 years.
However, they were either tabled in favour of alternative lines or rejected. Over the last decade
support for the project continually grew and in 2005 the Crossrail Bill was introduced and passed
through parliament. Following this, the statutory body Crossrail Limited was created (Box 3.1), and
the funding package was secured in 2007, further revised in 2010, and in 2012 construction of the
project began.
Box 3.1 Statutory Authority
Creating a statutory body for an infrastructure program has many advantages. As suggested by the
Queensland Treasury the statutory body form is generally used when there is a need for:
some operational independence from the State Government
funding arrangements that are not reliant on the annual appropriations processes
specific expertise on a governing board, or
a separate legal entity29
As large scale infrastructure projects such as Crossrail usually have multiple government stakeholders, the
separate legal status, and operational independence is useful as it allows Crossrail Limited to complete the
project without having to go to the separate authorities for minor approval. The statutory body Crossrail
Limited was created under The Crossrail Act (2008) with the purpose of coordinating the delivery of London
Crossrail. The act gave the body the ability to resume land, to spend funds appropriated by the separated
29 Queensland Treasury, “Establishment of Statutory Bodies: Considerations and Contacts,” (April 2016): 2.
Implementing Value Capture for Transport Infrastructure
18
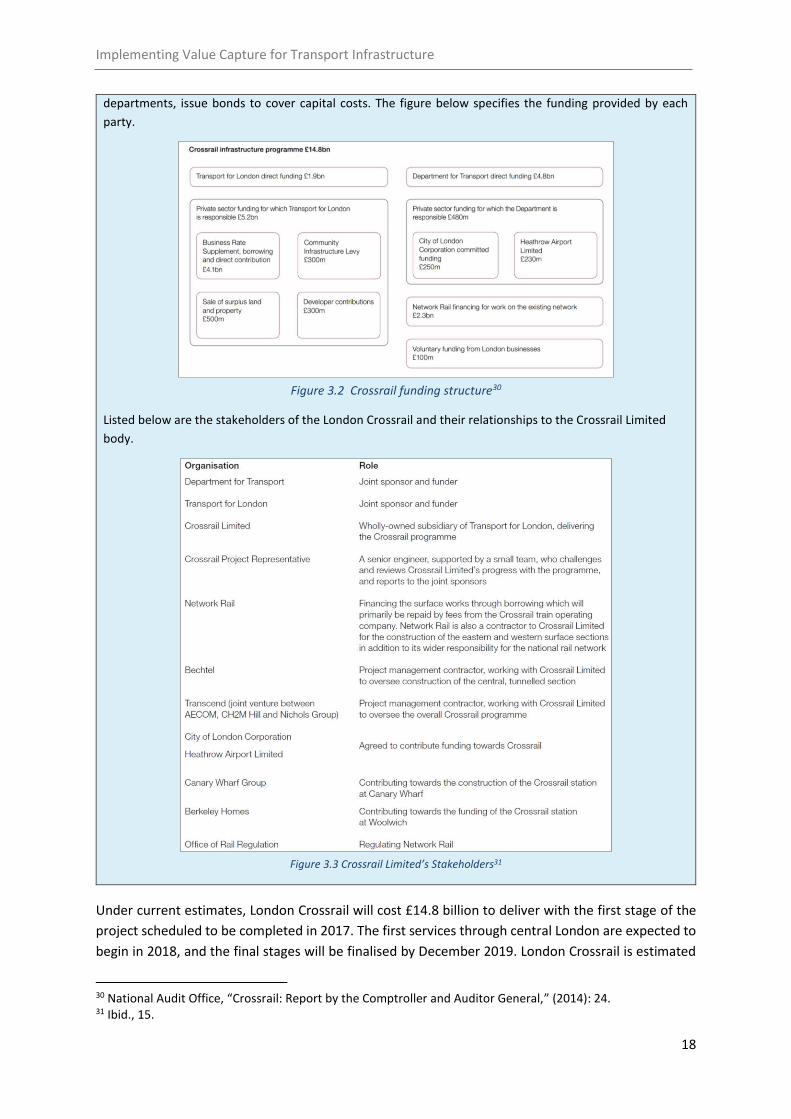
departments, issue bonds to cover capital costs. The figure below specifies the funding provided by each
party.
Figure 3.2 Crossrail funding structure30
Listed below are the stakeholders of the London Crossrail and their relationships to the Crossrail Limited
body.
Figure 3.3 Crossrail Limited’s Stakeholders31
Under current estimates, London Crossrail will cost £14.8 billion to deliver with the first stage of the
project scheduled to be completed in 2017. The first services through central London are expected to
begin in 2018, and the final stages will be finalised by December 2019. London Crossrail is estimated
30 National Audit Office, “Crossrail: Report by the Comptroller and Auditor General,” (2014): 24. 31 Ibid., 15.
Implementing Value Capture for Transport Infrastructure
19
to increase central London’s rail capacity by 10% while reducing the congestion at many of London’s
key underground stations. It is currently the largest infrastructure project in Europe with over 10,000
employees working on 40 construction sites throughout London.32
London Crossrail has used a combination of value capture mechanisms to fund £4.8 billion of the
project costs, which equate to approximately 32% of the projects funding needs. These include a
Business Rate Supplement scheme, a Mayoral Community Infrastructure Levy, and Developer
Contributions. It is important to note that while it is not expressly recognised as such, London has also
used a form of ex-ante value capture through the sale of surplus land and property (this concept is
discussed further in section 5).
London’s primary form of value capture for Crossrail is the Business Rates Supplement (BRS) Scheme.
The BRS scheme is a form of rates uplift that will raise £4.1 billion in funds which represent the majority
of funds being contributed from value capture. The BRS scheme is a 2% tax on commercial properties
in each of the 32 Burroughs of London with a rateable value over £55,000. The rateable value of a
property is the value that the owner would receive if they leased out the property today and it is re-
evaluated by the council every five years. With the current £55,000 hurdle, only the top 20% of
London’s commercial properties are liable to pay the BRS. The BRS scheme began in 2010 and will
have a life of 30-years, with the possibility of an early termination if the funding needs are met before
the life of the tax is reached.33
Box 3.2 What is a successful tax?
Efficiency
An efficient tax is one that raises revenue while minimizing the distortions on the decisions of agents within
a market resulting in a deadweight loss. Some taxes such as stamp duty grossly distort the investment
decisions of interested parties by disincentivising the sale of property.
Equity
While a particular tax option may be efficient, it may fall heavily on lower-income earners who may find it
hard to meet payments even with a windfall gain in land-rent. This is a particularly important criterion to
assess because the intention of infrastructure projects is to create a public good. The principle of value
capture is to help fund this public good through taxing excess economic rent, not creating a large tax burden
on lower-income earners.
Efficacy
The final and often the most important criterion for policy makers is whether a tax is efficacious. This criterion
considers whether a tax will be easy to implement (i.e. low administrative cost) and whether it can raise a
predictable and consistent amount of funds for the infrastructure project.
The BRS has several benefits which make it both a efficacious and relatively efficient (see Box 3.2) tax
scheme when compared to the other value capture mechanisms used for Crossrail. The BRS only takes
a small amount from a large pool of businesses across London’s 32 Burroughs which means there is
only a small cost for each party. As suggested by Johansson, A. et al (2008) taxes on land and property
are argued to be more efficient than other taxes because they do not affect agents’ decisions to supply
32 Crossrail Limited, “Crossrail in Numbers,” (2016), http://www.crossrail.co.uk/news/crossrail-in-numbers#. 33 Greater London Authority, “Intention to levy a business rate supplement to finance the Greater London Authority’s contribution to the Crossrail project: Final Prospectus,” (2010).
Implementing Value Capture for Transport Infrastructure
20
labour, invest or produce as much as other taxes.34 Although the BRS is calculated on rateable value
and not land value it behaves similar to a land tax because the rateable value is based on some of the
immovable features of the property such as location. Another benefit of the BRS is that due to its five-
year recalculation of rateable value, the volatility of the tax revenue stream is reduced in a low
inflation environment especially like the one observed over the last few years. This revenue stream
volatility is further reduced by the provision in the BRS scheme to collect tax on unoccupied properties
from either the landlord or the new tenant who is yet to occupy the property. Additionally, as the BRS
scheme is included with the current business rates notice in London (National Non-Domestic Rates
(NNDR)), the cost of administering the tax is smaller than a completely new tax. As the BRS scheme
has a lower cost of administration and raises a consistent revenue stream it is also efficacious.
One issue with the BRS scheme is that it collects tax on properties with a rateable value over £55,000
indiscriminately which may lead to some issues in equity. If a property in an outer borough has a
rateable value over £55,000 yet sees no increase in property value from Crossrail, it may subsidise
others while seeing no benefit. Another risk is that the BRS may cause some market distorting
inefficiencies. For example, if a business has a rateable value over the hurdle yet is only performing
marginally then the additional tax may cause them to shut down.
Crossrail is also partially funded by a developer contribution called the Mayoral Community
Infrastructure Levy (CIL). Although it will raise £300 million, this is a substantially smaller amount than
the BRS scheme and much smaller amount than the total funding needs of the project. The CIL is levied
on all new developments in the Greater London area, and it charges a per square meter rate based on
the proximity to the CBD. These rates are split into three zones that are shown in Figure 3.4. The CIL
allows for exemptions if the new development is used for the provision of health services, charitable
services and a number of other reasons.
Figure 3.4 Mayoral CIL charging rates
The CIL may cause a number of distortions in the market by deterring marginal projects from
happening, which leads to a potentially inefficient outcome. In addition to this, it must be noted that
34 Johansson, Å. et al, “Taxation and Economic Growth,” OECD Economics Department Working Papers, No. 620, (2008): 20.
Implementing Value Capture for Transport Infrastructure
21
this type of tax may be difficult to rely on as the tax stream may not be consistent. This is because the
timing of new developments is determined by the market.
The London Crossrail case suggests that in practice value capture can be an efficacious and relatively
efficient way to fund infrastructure projects. As can be seen in the first years of the tax it has
consistently raised the amounts that is was predicted to raise regardless of the economic climate with
up to 98.4% of the predicted amount being collected in 2013/14. Additionally, due to the 10-25%35
rise in property values, the 2% tax increase on rateable value (which is less than property value) still
leaves a large amount of benefit for the taxpayers.
In addition to London Crossrail there are numerous international examples of value capture. Listed in
Table 3.1 are a number of recent examples and some issues involved with each case. Grand Paris
Express is a large metro project with a combination of line upgrades and extensions which will cost
€12 billion, and construction of new lines which will cost €22.65 billion. Work on the project started
in 2015 and the project is expected to be completed on a rolling basis from 2022 to 2030.36 The Grand
Paris Express will be funded with a combination of a location based payroll tax, and a new
development tax on office space.37 Washington D.C. New York Avenue station began construction in
2002 and was completed in 2004. The project cost $84 million of which $25 million was provided by a
Special Assessment District tax on office development.38 The line 7 extension was an extension of the
New York subway system to Hudson Yard which began construction in 2009 and was completed by
2014. The subway extension cost $2.42 billion, the majority of which was funded by a TIF scheme
collected by the City of New York.39 40
Table 3.1 International Value Capture Examples
In the table above it is postulated that there is a positive relationship between the population density
of a city and the percentage of a project that you can fund with value capture. This relationship is
shown in Figure 3.5 below where population density was plotted against percent of project funded.
35 GVA, “Crossrail Property Impact Study,” (2012): 4. 36 Société du Grand Paris, “A Modern and Extensive Transport Network,” Updated 2014, https://www.societedugrandparis.fr/projet/le-grand-paris/reseau-transport-moderne-etendu. 37 Deborah Salon, “Value Capture Opportunities for Urban Public Transport Finance,” Transit Leadership Summit (2012): 111. 38 Ibid., 102. 39 Ibid., 110. 40 Metropolitan Transportation Authority, New 7 Line Extension to 11 Avenue, http://web.mta.info/nyct/service/new7LineExtension_to11Avenue.htm.
Implementing Value Capture for Transport Infrastructure
22
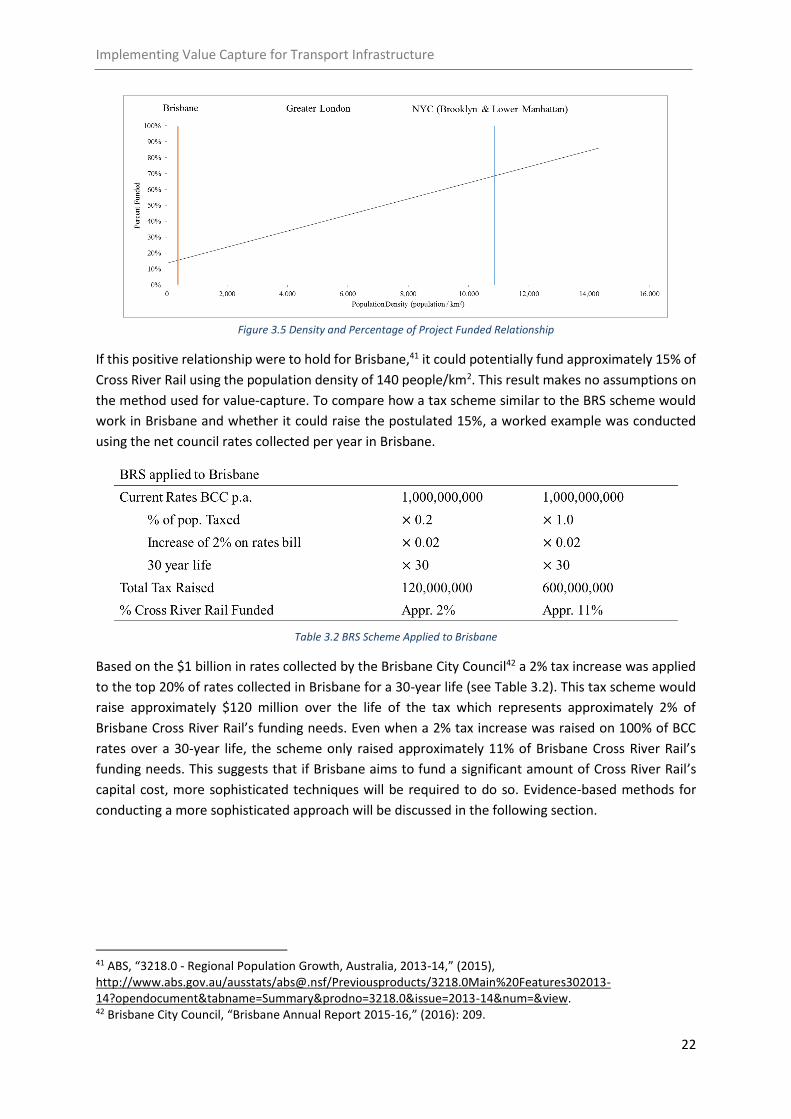
Figure 3.5 Density and Percentage of Project Funded Relationship
If this positive relationship were to hold for Brisbane,41 it could potentially fund approximately 15% of
Cross River Rail using the population density of 140 people/km2. This result makes no assumptions on
the method used for value-capture. To compare how a tax scheme similar to the BRS scheme would
work in Brisbane and whether it could raise the postulated 15%, a worked example was conducted
using the net council rates collected per year in Brisbane.
Table 3.2 BRS Scheme Applied to Brisbane
Based on the $1 billion in rates collected by the Brisbane City Council42 a 2% tax increase was applied
to the top 20% of rates collected in Brisbane for a 30-year life (see Table 3.2). This tax scheme would
raise approximately $120 million over the life of the tax which represents approximately 2% of
Brisbane Cross River Rail’s funding needs. Even when a 2% tax increase was raised on 100% of BCC
rates over a 30-year life, the scheme only raised approximately 11% of Brisbane Cross River Rail’s
funding needs. This suggests that if Brisbane aims to fund a significant amount of Cross River Rail’s
capital cost, more sophisticated techniques will be required to do so. Evidence-based methods for
conducting a more sophisticated approach will be discussed in the following section.
41 ABS, “3218.0 - Regional Population Growth, Australia, 2013-14,” (2015), http://www.abs.gov.au/ausstats/[email protected]/Previousproducts/3218.0Main%20Features302013-14?opendocument&tabname=Summary&prodno=3218.0&issue=2013-14&num=&view. 42 Brisbane City Council, “Brisbane Annual Report 2015-16,” (2016): 209.
Implementing Value Capture for Transport Infrastructure
23
4.0. Methods for Evidence-based
Value Capture Policy
As discussed in the Case Study, existing international approaches to value capture may not achieve
similar outcomes in SEQ and to achieve future funding goals a more refined approach could be utilised.
A more sophisticated approach to value capture would measure and target value uplift where it
occurs. If governments have access to information about where value has been generated they are
able to design policy such that it will be more effective and equitable.
Utilising more information in policy is part of a broader push towards ‘evidence-based policy-making’.
While this is not a new concept, it has come into recent prominence as an important and
uncontroversial measure in improving public policy.43 In the context of value capture policy, it would
be highly advantageous to know: where value has accrued, how much uplift there has been, and which
parties have seen the greatest benefit.
The challenge in using evidence-based policy-making for value capture is estimating the effect that
infrastructure has had on land values. This can be done by undertaking an ‘impact evaluation’ which
seeks to provide methods to monitor and evaluate a policy. Monitoring and evaluating provide sets of
tools which can improve the quality, efficiency and effectiveness of reforms.44 Impact evaluations can
be categorised into two broad types:45
Ex post impact evaluation which gathers evidence about the impacts of a project
Ex ante impact evaluation forecasts likely impacts
The most frequently used in the context of assessing the impact of public mass transportation (PMT) has been hedonic price models (HPM) and, more recently the Difference- in-Differences (DID) estimator.46 The DID estimator is a type of ex post impact evaluation which measures changes in land values and isolates the effect infrastructure has had on them. On the other hand, the HPM approach can be used for both ex ante and ex post to either measure the impact infrastructure and other variables have had, or to forecast their future value if it were to be built. In addition to PMT impacts assessments for housing prices, both approaches have been used to estimate the effects of rail and highways on housing as well as commercial property47, vacant land48 and apartment values49, indicating that the approaches to value capture are robust enough for use on vastly different infrastructure projects. This section will also discuss Taxation Increment Financing (TIF), which can be seen as an ex post value capture mechanism. However, in TIF, all value uplift is attributed to the infrastructure and therefore is not an impact evaluation.
43 Gary Banks AO, “Challenges of evidence-based policy-making” - Commissioner’s forward, Australian Public Service Commission, (2009). 44 Gertler et al., “Impact Evaluation in Practice,” The World Bank (2007) 45 Rogers et al., “Choosing appropriate designs and methods for impact evaluation,” Office of the Chief Economist (2015). 46 Dubé et al., “A spatial Difference-in-Differences estimator to evaluate the effect of change in public mass transit systems on house prices,” Transport Research Part B (2014): 24-40. 47 Mohammed et al., “A meta-analysis of the impact of rail projects on land and property values,” Transportation Research Part A 50 (2013): 158–170. 48 Knaap et al., “Do plans matter? The effects of light rail plans on land values in station areas,” (2001). 49 Pan and Zhang, “Rail transit impacts on land use: evidence from Shanghai, China,” Journal of the Transportation Research Board 2048 (1) (2008): 16–25.
Implementing Value Capture for Transport Infrastructure
24
An illustration of how evidence-based policy-making may have improved funding infrastructure on the
Gold Coast is shown in Box 4.1, utilising a recent University of Queensland impact evaluation
conducted by Cameron Murray.50 The impact evaluation used a DID approach, which is detailed in
Section 4.3.
Box 4.1 Land uplift from the Gold Coast Light Rail (GCLR)
It has been estimated51 that $300 million was generated in land uplift to landowners within 400m of
a GCLR station since the inception of the project, this represented a 7.1% increase in the land values.
The Gold Coast City Council (GCCC) during this time had increased their City Transport Improvement
Charge (CTIC), levied on all properties within the GCCC area, by $17.50 per property to fund GCLR,
bringing the total CTIC to $111p.a. This increase resulted in $2.2 million p.a. of revenue.
From a total project cost of $1.3 billion the CTIC increase has recovered approximately 0.86% of
project costs out of a possible 23% from land uplift within 400m of GCLR stations, if all the uplift was
captured.
Substantial value uplift was also measured from 400-2000m of a GCLR station.
It is possible that by using evidence-based value capture, a greater proportion of the GCLR project
could have been funded from landowners who had directly benefited from the project.
4.1. Taxation Increment Financing (TIF)
Taxation Increment Financing (TIF) is a value capture mechanism which captures value through rises
in land/property values. The TIF mechanism is illustrated in Box 4.1: a TIF district is announced, the
level of land value of the district is frozen over a fixed period, and additional increases in land value in
this timeframe are attributed to the infrastructure and hypothecated towards repayment of the debt.
TIF allows governments to issue bonds against this future revenue stream. The funding source in TIF
is the underlying taxation it is applied to; most commonly property taxes in the USA, however in
Australia it is primarily discussed in the context of land taxes and, to a lesser extent, stamp duty.52
Figure 4.1 Tax Increment Financing
50 Cameron Murray, “Land value uplift from light rail,” (2016). 51 Ibid. 52 PricewaterhouseCoopers, “Economic Development Board: Major Infrastructure Funding Alternatives,” Draft Report for the Property Council of Australia (2012).
Implementing Value Capture for Transport Infrastructure
25
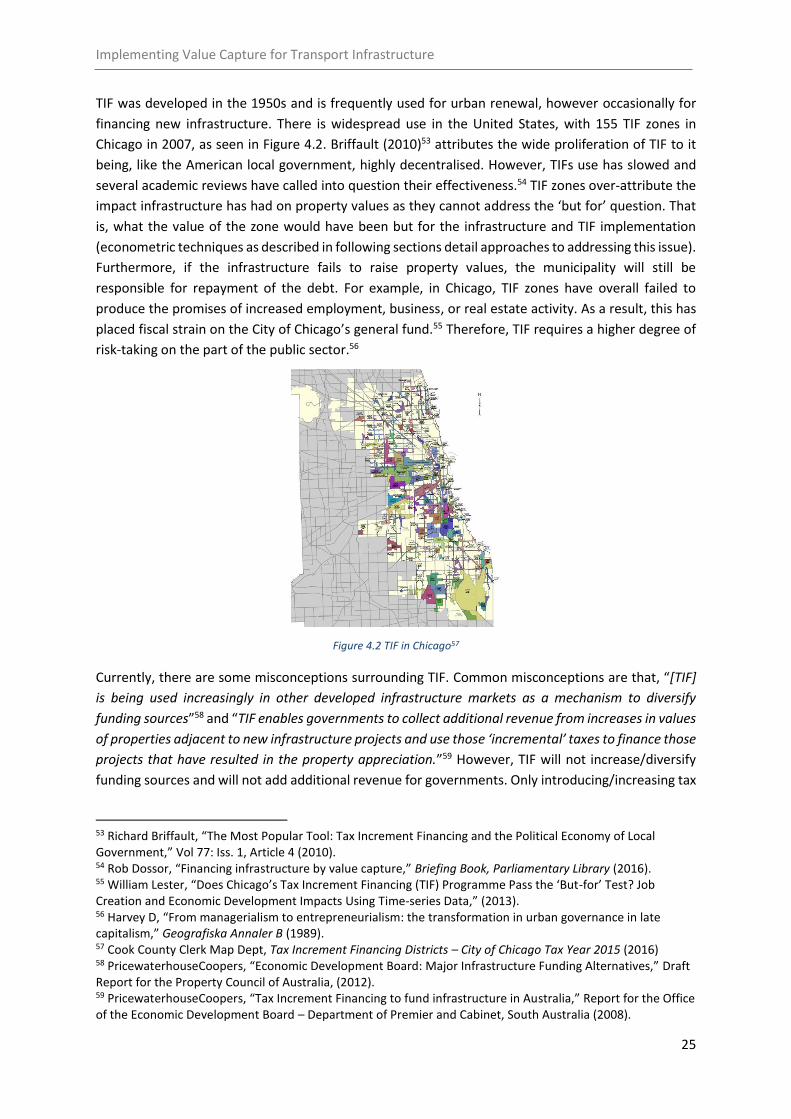
TIF was developed in the 1950s and is frequently used for urban renewal, however occasionally for
financing new infrastructure. There is widespread use in the United States, with 155 TIF zones in
Chicago in 2007, as seen in Figure 4.2. Briffault (2010)53 attributes the wide proliferation of TIF to it
being, like the American local government, highly decentralised. However, TIFs use has slowed and
several academic reviews have called into question their effectiveness.54 TIF zones over-attribute the
impact infrastructure has had on property values as they cannot address the ‘but for’ question. That
is, what the value of the zone would have been but for the infrastructure and TIF implementation
(econometric techniques as described in following sections detail approaches to addressing this issue).
Furthermore, if the infrastructure fails to raise property values, the municipality will still be
responsible for repayment of the debt. For example, in Chicago, TIF zones have overall failed to
produce the promises of increased employment, business, or real estate activity. As a result, this has
placed fiscal strain on the City of Chicago’s general fund.55 Therefore, TIF requires a higher degree of
risk-taking on the part of the public sector.56
Figure 4.2 TIF in Chicago57
Currently, there are some misconceptions surrounding TIF. Common misconceptions are that, “[TIF]
is being used increasingly in other developed infrastructure markets as a mechanism to diversify
funding sources”58 and “TIF enables governments to collect additional revenue from increases in values
of properties adjacent to new infrastructure projects and use those ‘incremental’ taxes to finance those
projects that have resulted in the property appreciation.”59 However, TIF will not increase/diversify
funding sources and will not add additional revenue for governments. Only introducing/increasing tax
53 Richard Briffault, “The Most Popular Tool: Tax Increment Financing and the Political Economy of Local Government,” Vol 77: Iss. 1, Article 4 (2010). 54 Rob Dossor, “Financing infrastructure by value capture,” Briefing Book, Parliamentary Library (2016). 55 William Lester, “Does Chicago’s Tax Increment Financing (TIF) Programme Pass the ‘But-for’ Test? Job Creation and Economic Development Impacts Using Time-series Data,” (2013). 56 Harvey D, “From managerialism to entrepreneurialism: the transformation in urban governance in late capitalism,” Geografiska Annaler B (1989). 57 Cook County Clerk Map Dept, Tax Increment Financing Districts – City of Chicago Tax Year 2015 (2016) 58 PricewaterhouseCoopers, “Economic Development Board: Major Infrastructure Funding Alternatives,” Draft Report for the Property Council of Australia, (2012). 59 PricewaterhouseCoopers, “Tax Increment Financing to fund infrastructure in Australia,” Report for the Office of the Economic Development Board – Department of Premier and Cabinet, South Australia (2008).
Implementing Value Capture for Transport Infrastructure
26
rates can increase revenue, as TIF simply allocates a portion of revenue to repayment of the debt.
However, new and increased taxes are generally not included in TIF and it has been called ‘tax
allocation financing’ which reflects that it is more related to hypothecation.60
Australian governments have had a general aversion to tax revenue hypothecation.61 Hypothecation
of petrol and diesel excises was discontinued in 1959, partly because hypothecation was deemed to
be unsound from a public finance policy perspective.62 This is due to the potential inefficiencies
hypothecation can create in allocating funding for other government services. Additionally, it may
reduce incentives to pursue efficient pricing policies for public transport fares and road use charges.63
TIF could be most applicable in scenarios where an econometric technique, as described in Sections
4.2, is not possible due to data limitations or other issues. (A discussion of endogeneity in econometric
models can be seen in Box 4.3).
4.2. Hedonic Price Models (HPM) Approach
In general, more sophisticated studies on value uplift have relied on hedonic pricing models and a
smaller subset of hedonic price models have incorporated spatial variation and spatial correlation
between variables, which has provided models with significantly stronger predictive power. HPM is a
multiple regression which examines the impacts of a number of attributes on land value/property
price.64 Cervero and Duncan (2001)65 state that HPM is the best method available to identify effects
on house prices associated with factors such as proximity to transportation facilities. This is from Gauss
Markov theorem which states an OLS (such as a HPM) will be the best linear unbiased estimator, if
correctly specified. The structure of HPM can be seen in Box 4.2.
Box 4.2 Hedonic Pricing Models
The structure of a hedonic pricing model is generally of the following structure:
𝒚𝑖𝑡 = 𝛽0 +𝑫𝑖𝑡𝛿 + 𝑿𝑖𝑡𝛽 + 𝜖𝑖𝑡
D represents time fixed effects
𝑋 includes the explanatory variables which include descriptors such as age of a property, number of
bedrooms, distance from a train station etc.
𝛽 is the hedonic price of the separate characteristics
𝛿 is a vector which can be used to build a general price index
60 Read Stapleton, “Tax Increment Financing: Comparing Approaches in Northwest States,” Quarterly & Urban Development Journal (2009): 34-49. 61 PricewaterhouseCoopers, “Tax Increment Financing to fund infrastructure in Australia,” Report for the Property Council of Australia (2008). 62 Richard Webb, “Petrol and Diesel Excises,” Research Paper, Economics, Commerce and Industrial Relations Group (2000). 63 Chan et al., “Public Infrastructure Financing: An International Perspective,” Productivity Commission Staff Working Paper (2009). 64 Karley Densmore and Corinne Mulley, “Accessibility and residual land value uplift: Identifying spatial variations in the accessibility impacts of a bus transitway,” Working paper (2012). 65 Cervero R, Duncan M, “Rail transit’s value added: effect of proximity to light and commuter rail transit on commercial land values in Santa Clara county California,” (2001).
Implementing Value Capture for Transport Infrastructure
27
According to Rambaldi and Rao (2011),66 commonly used hedonic models fail to account for changing
consumer preferences over the characteristics being tested and do not typically take into account the
role of locational characteristics. For, example the value of an observation is influenced by the value
of the neighbouring observations (i.e. land/property) and in turn it influences surrounding
observations, this phenomenon is known as spatial autocorrelation. Rambaldi and Rao (2011) propose
the use of time-varying hedonic models with spatial autocorrelation to impute a house price index,
which can be used to predict and understand causes and variations in housing prices. To obtain a more
accurate estimator these models allow for a spatial autoregressive specification of the dependant
variable. The method to construct the spatial autocorrelation weights matrix has been detailed
extensively in literature.67 It entails defining relationships between the observations in the study. For
example, if there are n observations, a weights matrix could be the inverse distance squared between
all observations, creating an 𝑛 × 𝑛 matrix.68
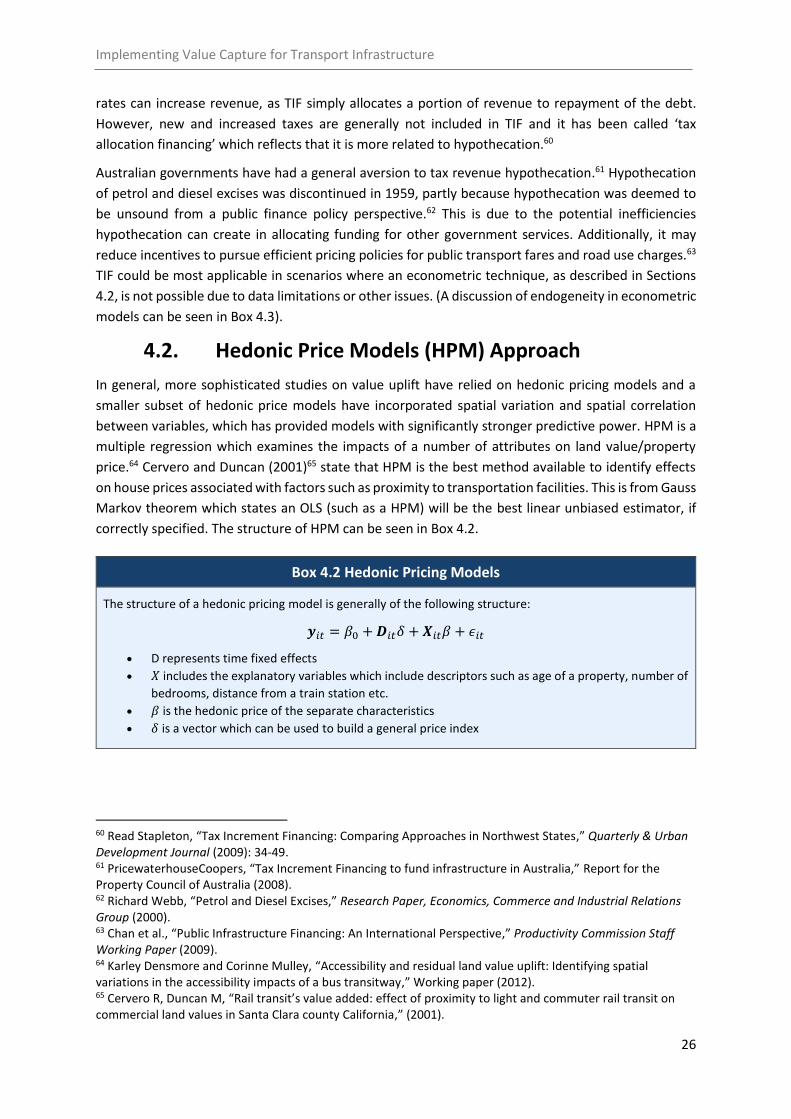
Once a model has been developed, it can be used to form a prediction on the expected change in
value of property/land values as a result of an infrastructure project. This may not be realised
immediately, and further research is required into the rate of value accumulation. This represents one
weakness of the HPM, relative to the DID estimator which can estimate the timing of the uplift.
The predicted value can be used as the basis for the capture amount (i.e. a portion of the predicted
rise in value taxed over 5 years). An illustration of HPM estimations of changes in future value of land
as a result of infrastructure can be seen by the black line in Figure 4.3, contrasted against theoretical
actual changes in land values due to infrastructure shown in red:
Figure 4.3 Application of Hedonic Price Indices to Forecast Future Value
Hedonic models can have strong predictive power, which means they are very useful for scenarios
where it is important to predict the rise in value prior to the implementation of the infrastructure
project. For example, if an estimate of the cost recuperated is required for the financing of the
infrastructure or the government wishes to advise the residents of the levels of capture prior to its
construction. While HPM will be the best estimator when correctly specified, they are more
66 Alicia Rambaldi and Prasada Rao, “Hedonic Predicted House Price Indices Using Time-Varying Hedonic Models with Spatial Autocorrelation,” Discussion Papers Series 432, University of Queensland (2011). 67 Jean Dubé and Diègo Legros, “Spatial Econometrics and Spatial Data Pooled over Time: Towards an Adapted Modelling Approach,” (2011). 68 Gunaratna et al., “Spatial Autocorrelation,” Recuperado el 2.
Per
cen
tag
e ch
an
ge
in la
nd
va
lue
as
a r
esu
lt o
f in
fra
stru
ctu
re
Implementing Value Capture for Transport Infrastructure
28
susceptible69 to endogeneity problems, notably, omitted variable bias. Endogeneity problems of
econometric models are discussed in Box 4.3.
4.3. Difference-in-Differences (DID) approach
Due to the difficulties created by omitted variable bias in hedonic price models, there has been a
recent emphasis placed on development of a Difference-in-Differences (DID) estimator for the effect
of public transport infrastructure on house prices.70 The DID approach controls for the possible
omission of variables correlated with the infrastructure descriptors. The DID estimator aims to
measure the effect of a change on the dependent variable (land value) by comparing the difference in
the level of this variable before and after a given critical date, between treatment group(s) and control
group(s). Within the context of value capture, the treatment group is an area which has seen a larger
benefits due to infrastructure relative to other areas. This difference between the trend of land values
of the city and the measured outcome in the treatment group(s) is the impact effect of the
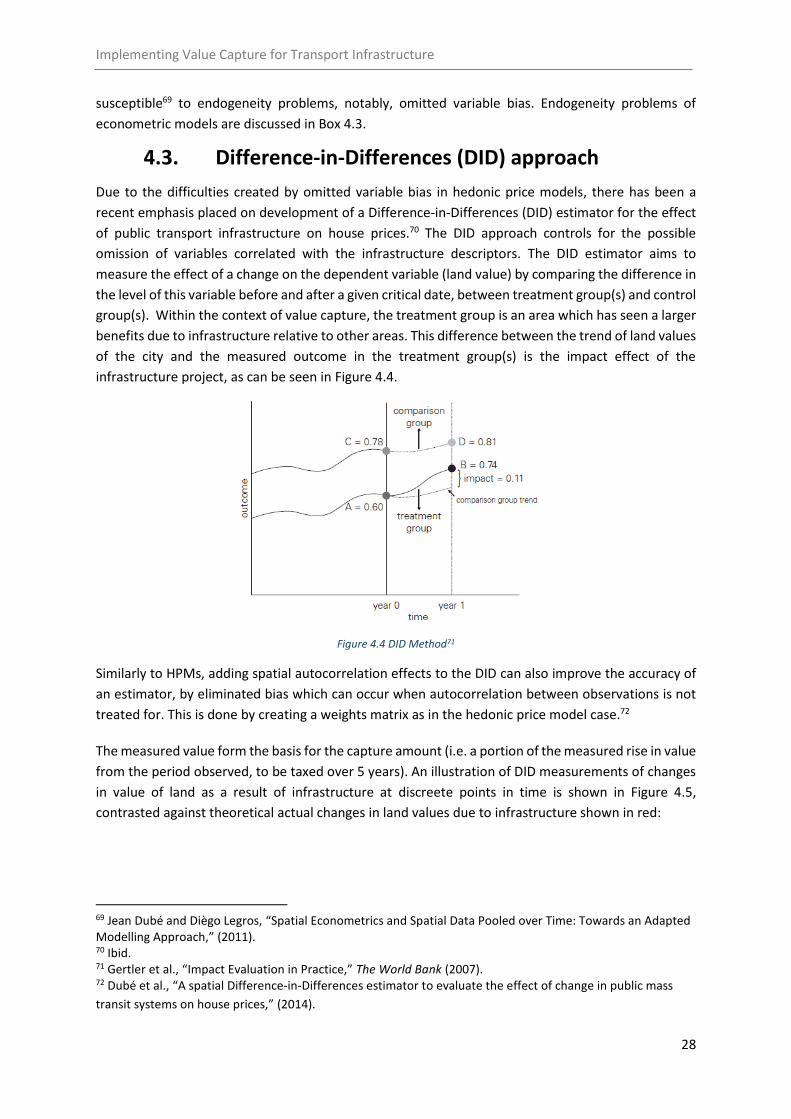
infrastructure project, as can be seen in Figure 4.4.
Figure 4.4 DID Method71
Similarly to HPMs, adding spatial autocorrelation effects to the DID can also improve the accuracy of
an estimator, by eliminated bias which can occur when autocorrelation between observations is not
treated for. This is done by creating a weights matrix as in the hedonic price model case.72
The measured value form the basis for the capture amount (i.e. a portion of the measured rise in value
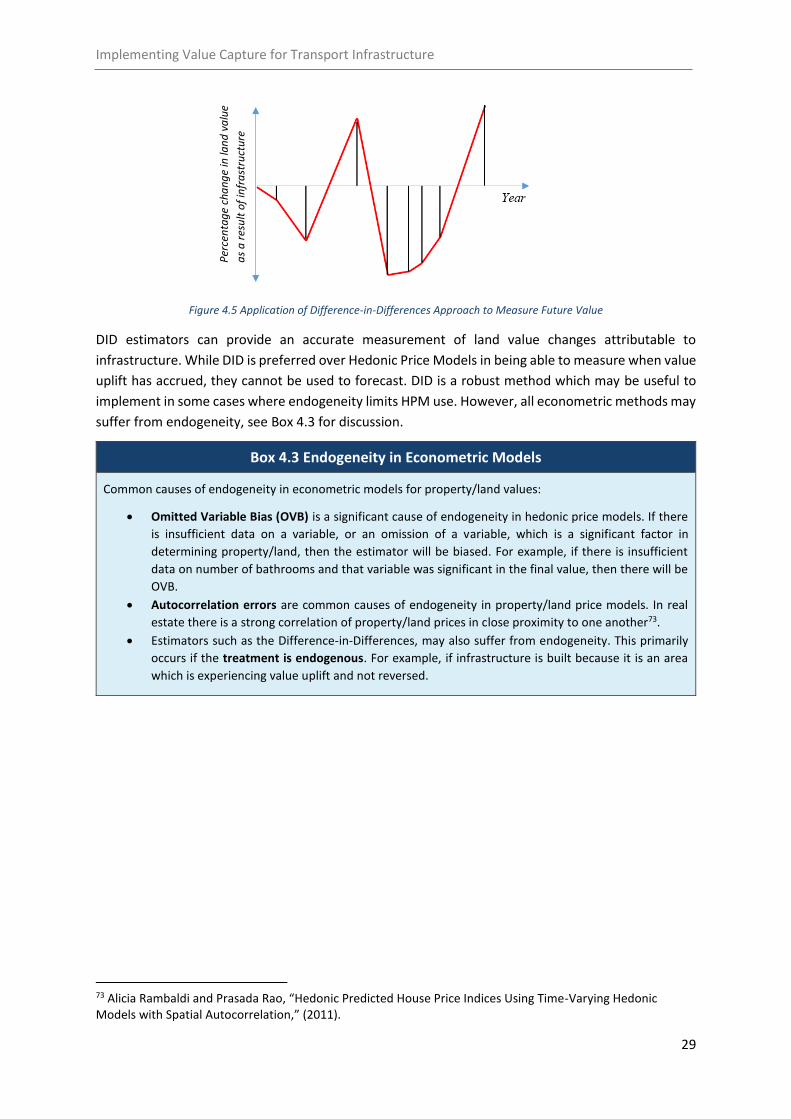
from the period observed, to be taxed over 5 years). An illustration of DID measurements of changes
in value of land as a result of infrastructure at discreete points in time is shown in Figure 4.5,
contrasted against theoretical actual changes in land values due to infrastructure shown in red:
69 Jean Dubé and Diègo Legros, “Spatial Econometrics and Spatial Data Pooled over Time: Towards an Adapted Modelling Approach,” (2011). 70 Ibid. 71 Gertler et al., “Impact Evaluation in Practice,” The World Bank (2007). 72 Dubé et al., “A spatial Difference-in-Differences estimator to evaluate the effect of change in public mass
transit systems on house prices,” (2014).
Implementing Value Capture for Transport Infrastructure
29
Figure 4.5 Application of Difference-in-Differences Approach to Measure Future Value
DID estimators can provide an accurate measurement of land value changes attributable to
infrastructure. While DID is preferred over Hedonic Price Models in being able to measure when value
uplift has accrued, they cannot be used to forecast. DID is a robust method which may be useful to
implement in some cases where endogeneity limits HPM use. However, all econometric methods may
suffer from endogeneity, see Box 4.3 for discussion.
Box 4.3 Endogeneity in Econometric Models
Common causes of endogeneity in econometric models for property/land values:
Omitted Variable Bias (OVB) is a significant cause of endogeneity in hedonic price models. If there
is insufficient data on a variable, or an omission of a variable, which is a significant factor in
determining property/land, then the estimator will be biased. For example, if there is insufficient
data on number of bathrooms and that variable was significant in the final value, then there will be
OVB.
Autocorrelation errors are common causes of endogeneity in property/land price models. In real
estate there is a strong correlation of property/land prices in close proximity to one another73.
Estimators such as the Difference-in-Differences, may also suffer from endogeneity. This primarily
occurs if the treatment is endogenous. For example, if infrastructure is built because it is an area
which is experiencing value uplift and not reversed.
73 Alicia Rambaldi and Prasada Rao, “Hedonic Predicted House Price Indices Using Time-Varying Hedonic Models with Spatial Autocorrelation,” (2011).
Per
cen
tag
e ch
an
ge
in la
nd
va
lue
as
a r
esu
lt o
f in
fra
stru
ctu
re
Implementing Value Capture for Transport Infrastructure
30
5.0. Options for Value Capture
Throughout history, governments have implemented varying forms of value capture strategies and
policies to help recover the cost of public infrastructure development. The Victorian Government used
value capture as early as 1926, when they applied the ‘Railway Betterment Rate’, an area based charge
to landowners within one mile from the train-line after it was extended from Darling to Glen
Waverley.74 While the general concept of using the unearned economic rent generated by a project
to contribute to its funding is the same, using modern measurement techniques and applying the
concepts of value generation, contemporary value capture schemes can be implemented in a much
more effective way.
Understanding and measuring value uplift gives policy makers the ability to implement value capture
mechanisms that directly target unearned economic rent. Applying a tax like the ‘Railway Betterment
Tax’, without this information, risks creating an inefficiency by over or under charging landowners.
Although measurements of value uplift can be used to implement a more considered capture
strategy, there are inaccuracies in any model and limits to the scope of a study. This requires policy
makers to consider the efficacy of strategies, case by case. In the following section some options for
value capture policy are evaluated in the context of South-East Queensland.
5.1. Ex-Ante vs. Ex-Post Methods
Value capture strategies can be separated into two types, ex-ante and ex-post. Ex-ante taxation
methods collect the amount upon the implementation of the tax while ex-post taxation methods
collect the value over a specified lifetime.75
Ex-ante value capture methods aim to capture value uplift that is a result of the market anticipating
the future benefit that a project will provide. The two mechanisms that are analysed further in Section
5.2, land auctions and beneficiary contributions, both aim to collect revenue during the initial phases
of the project. This means that revenue can contribute to the funding of the initial capital costs.
Another advantage of ex-ante strategies is that they are relatively easy to implement compared to an
ex-post land taxation method. Unlike ex-post methods, ex-ante methods generally do not require the
development of additional legislation, and because administration costs of an ex-ante methods are
relatively smaller than those of an ex-post method. For example, a land auction or major beneficiary
contribution process may only result in dealing with a small number of private entities over the course
of a few years. However, a land taxation value capture scheme may deal with thousands of individual
landowners for a much longer timeframe.
Ex-post value capture methods are applied for a pre specified life and capture the value uplift
retroactively. To use these ex-post methods, you need to separate out the effects that are not
attributed to the infrastructure such as general price growth or other unrelated policy changes. If
measurement is done with precision ex-post methods can lead to more equitable outcomes.
74 Prosper Australia, “Value Capture – a historical perspective,” 75 Marleen Brans and John Turnpenny, “The context and use of ex ante evaluation within governments,” (2016).
Implementing Value Capture for Transport Infrastructure
31
5.2. Analysis of Capture Methods
There are numerous options available for value capture. This report has not examined use of stamp
duty and developer contributions due to their identification in the Henry Tax Review as being
distortionary/inefficient. The capital gains tax (CGT) has also not been examined as the exemptions
and discounts which apply to the tax would limit its efficacy. Lastly, betterment taxes were not
analysed. While the Henry Tax Review states that they are an attractive taxation tool,76 betterment
taxes have seen a long history of failure in implementation, potentially due to reluctance of
landowners to sell land for development and become liable for the tax.77 As a result, this section will
focus on three value capture options: negotiated beneficiary contributions, land auctions, and land
taxes. These options will be evaluated for their efficacy and applicability in South-East Queensland.
5.3. Negotiated Beneficiary Contributions
Negotiated beneficiary contributions refer to the payments or contributions from private entities that
will see direct benefit from an infrastructure project. These private entities include large shopping
centres, airports, casinos, theme parks, and other large privately owned complexes. Payment by these
beneficiaries can be negotiated on the increased patronage or turnover that the transport
infrastructure adds through accessibility.78
By dealing with single entities, this method can be relatively simple to implement since it does not
require negotiations amongst multiple parties. However, there are issues that can arise regarding the
negotiation of payment. If the private party is convinced that a project will go ahead regardless of
their payments, it is unlikely that they will negotiate a fair price.79
5.4. Land Auctions
Government can capture value uplift through the sale or lease of publicly owned land that is within
the vicinity of new transport infrastructure projects. Most large projects either use land resumption
schemes or utilise state owned land for development. By implementing a strategy to sell the
development rights of unused land, or specifically integrating development options into the project
(see Box 5.1), the uplift can be captured by allowing the market value the land through an auction.
A privately negotiated contract between a seller and single buyer may reach the same outcome as an
auction would, however, this is not guaranteed.80 In contrast, by utilising competition between
bidders, an auctions final selling price should be reflective of the true market value. In order for land
auctions to be effective, they must be well designed (see Box 5.2).
76 Australian Treasury, “Australia’s Future Tax System,” (2009). 77 Nigel Stapledon (2016) Value Capture and Transport Infrastructure – Public Policy Issues- Presentation for the 2016 UNSW Real Estate Symposium 78 Infrastructure Victoria, “Value Capture – Options, Challenges and Opportunities for Victoria,” Policy Paper (2016). 79 Tanya Alfredson and Azeta Cungu, “Negotiation Theory and Practice: A Review of the Literature,” Report for the Food and Agriculture Organization of the United Nations, FAO (2016) 80 Guhan Subramanian, “Negotiation? Auction? A Deal Maker’s Guide,” Harvard Business Review: December 2009 Issue (2009)
Implementing Value Capture for Transport Infrastructure
32
Box 5.1 Development Opportunities for Land Auction
The following development options can be integrated into the project design in order to maximise
value captured by an auction.
Rezoning of Land
Value uplift of a transport infrastructure project is strongly correlated with the density of the
surrounding area.81 If current zoning restricts developers to low or medium density land use,
rezoning may increase value uplift in the area.82 Rezoning may not be suitable in scenarios where it
does not fit into a broader city plan, or if demand for high density residential is low.
Transit Oriented Development (TOD)
Transit Oriented Development refers to the development of mixed-use community precinct along
public transport nodes. By integrating an infrastructure project’s design with plans for high-density
residential or commercial precincts, opportunity for value capture can be created through
auctioning land and air rights at the TODs.
The Milton Residences, completed in 2015, is the first TOD under the Queensland Governments
South-East Queensland Regional Plan (SEQRP) adjoining the Milton train station in Brisbane. While
this development was not used as a value capture method, the same design principle in conjunction
with auctions for development rights, could be applied to future projects.83
Box 5.2 Land Auction Design
An efficient auction uses competition between bidders which will result in the sale of the asset at
its true market value. In order for this to occur, the auction must be undertaken appropriately. The
analysis that follows refers to Klemperer’s suggestions for auction design.
A reserve price should be set to cover the risk of inadequate competition at the auction. This price
should be set at the minimum amount the auctioneer is willing to accept, and should be optimised
so that they will be indifferent between selling in this period or the next. This gives the seller security
that even if the reserve price is not met, they will not suffer a loss by holding onto the land.
Bidders should be made aware that the land on auction will be receiving new transport
infrastructure, and that there will be opportunities to further develop the area. Additionally, during
the auction, prices should be publicly and transparently determined by open competition.
Auctions should be designed so as not to deter bidders. Given an appropriate reserve price, an
auction with too few bidders will still be efficient, however, will likely result in a lower sell price
than if more bidders participated. Bidders may not enter the auction if the cost of entry is too high,
for example, if the bidders are required to submit very detailed development programs.
81 Nigel Stapledon, “Value Capture and Transport Infrastructure – Public Policy Issues,” Presentation, UNSW Real Estate Symposium (2016). 82 Ibid. 83 Brisbane-Australia, “The Milton Residences – FKP,” (2016) http://www.brisbane-australia.com/the-milton-
apartments.html
Implementing Value Capture for Transport Infrastructure
33
5.5. Land Taxes
As land cannot be relocated or reduced in supply, value uplift translated to land prices can be taxed
without creating market distortions.84 Because of this, land is a suitable medium to apply an ex-post
capture tax to. The Henry Tax Review states that land tax is one of the most efficient means of raising
revenue and alterations to the existing structure is possible with little efficiency costs.85
One of the main benefits of implementing a value capture scheme using land taxation is the ability to
target the unearned economic rent received by a large group of individual landowners. A state land
tax is currently used in Queensland, however, exemptions apply for the majority of residential
properties.86 This reduces the efficiency of the tax because the supply of taxable land is no longer fixed
given that the landowners can change the purpose of the land to receive exemptions.87 To achieve a
more efficient state land tax would mean significant restructuring of the current system.88 Local
government rates are also a form of land tax and, because local government land rates are applied to
all properties, a value capture scheme can reduce legislative and administration costs by being
combined with current rates notices.
Increases in land value caused by uplift will be partially captured through existing land rates, however
this will only be a very small proportion. In the Brisbane City Council (BCC), these rates range from
0.3103% of the total unimproved value of the land for Category 1 Principal Residential properties
which account for over 65% of the total sites in the BCC,89 to 1.80% for some inner city commercial
properties.90
Under current land rates, landowners retain the majority of windfall gains caused by infrastructure
projects. By applying special rates or charges to these landowners, a larger proportion of the unearned
economic rent can be captured.
5.6. Policy Options for Council Rates
Local councils in Queensland apply a ‘special rate or charge’ levied on specific land which receives
benefit from the provision of a service, facility or activity.91 South-East Queensland Councils already
use these charges to fund infrastructure, thereby conducting value capture. For example the Gold
Coast City Council ‘City Transport Improvement Charge’, which is levied on all rateable land.92 The levy
could be applied as a lump sum ‘charge’ or as a ‘special rate’ and the optimal choice in the design of
the levy would depend on the individual circumstances within which it is being applied and the
information on where and to whom value uplift occurs.
84 Australian Treasury, “Australia’s Future Tax System,” (2009): 48. 85 Ibid., 48. 86 Queensland Government, “Exemptions from Land Tax,” Last Updated September 2016, https://www.qld.gov.au/environment/land/tax/calculation/exemptions/. 87 Australian Treasury, “Australia’s Future Tax System,” (2009): 250. 88 Nigel Stapledon, “Value Capture and Transport Infrastructure – Public Policy Issues,” Presentation, UNSW Real Estate Symposium (2016). 89 Brisbane City Council, “How Rates Are Calculated,” Last Updated August 2016, https://www.brisbane.qld.gov.au/about-council/council-information-rates/rates-payments/how-rates-are-calculated. 90 Brisbane City Council, “2014-2015 Annual Plan and Budget,” (2015). 91 Department of Infrastructure, Local Government and Planning, “Rates and charges,” (2016). 92 City of Gold Coast, “Revenue Statement and Resolution of Rates and Charges 2014-2015,” (2014).
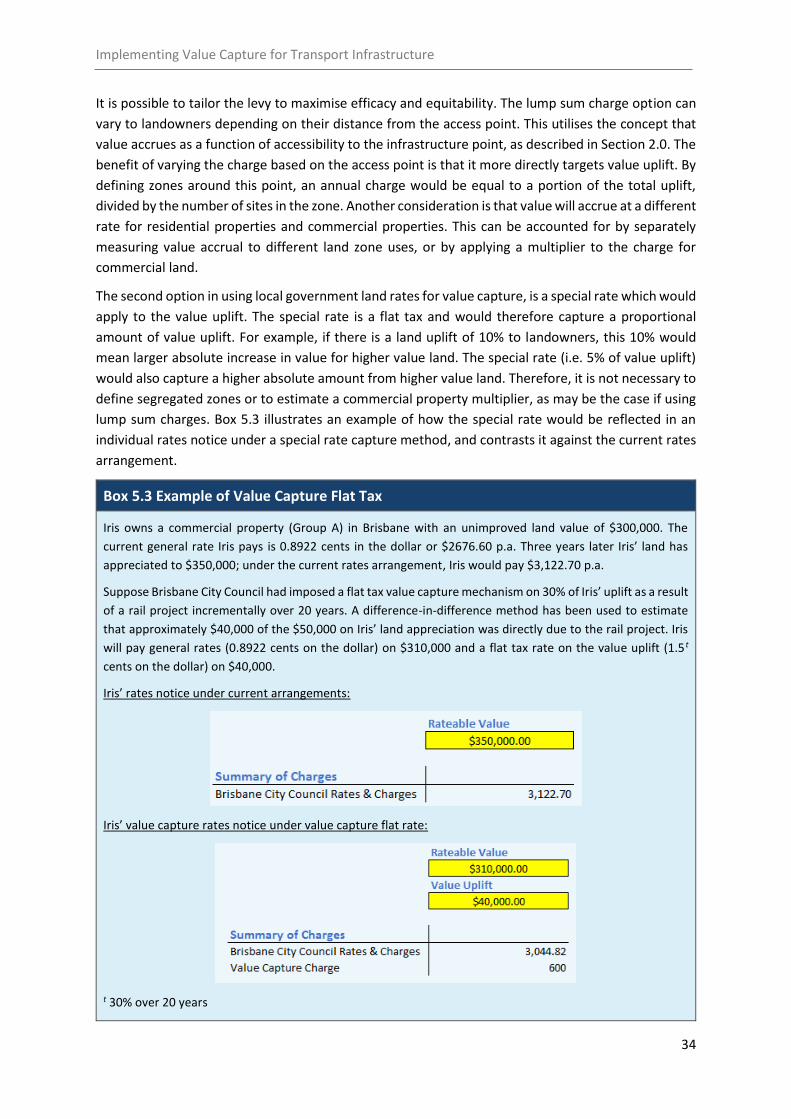
Implementing Value Capture for Transport Infrastructure
34
It is possible to tailor the levy to maximise efficacy and equitability. The lump sum charge option can
vary to landowners depending on their distance from the access point. This utilises the concept that
value accrues as a function of accessibility to the infrastructure point, as described in Section 2.0. The
benefit of varying the charge based on the access point is that it more directly targets value uplift. By
defining zones around this point, an annual charge would be equal to a portion of the total uplift,
divided by the number of sites in the zone. Another consideration is that value will accrue at a different
rate for residential properties and commercial properties. This can be accounted for by separately
measuring value accrual to different land zone uses, or by applying a multiplier to the charge for
commercial land.
The second option in using local government land rates for value capture, is a special rate which would
apply to the value uplift. The special rate is a flat tax and would therefore capture a proportional
amount of value uplift. For example, if there is a land uplift of 10% to landowners, this 10% would
mean larger absolute increase in value for higher value land. The special rate (i.e. 5% of value uplift)
would also capture a higher absolute amount from higher value land. Therefore, it is not necessary to
define segregated zones or to estimate a commercial property multiplier, as may be the case if using
lump sum charges. Box 5.3 illustrates an example of how the special rate would be reflected in an
individual rates notice under a special rate capture method, and contrasts it against the current rates
arrangement.
Box 5.3 Example of Value Capture Flat Tax
Iris owns a commercial property (Group A) in Brisbane with an unimproved land value of $300,000. The
current general rate Iris pays is 0.8922 cents in the dollar or $2676.60 p.a. Three years later Iris’ land has
appreciated to $350,000; under the current rates arrangement, Iris would pay $3,122.70 p.a.
Suppose Brisbane City Council had imposed a flat tax value capture mechanism on 30% of Iris’ uplift as a result
of a rail project incrementally over 20 years. A difference-in-difference method has been used to estimate
that approximately $40,000 of the $50,000 on Iris’ land appreciation was directly due to the rail project. Iris
will pay general rates (0.8922 cents on the dollar) on $310,000 and a flat tax rate on the value uplift (1.5 t
cents on the dollar) on $40,000.
Iris’ rates notice under current arrangements:
Iris’ value capture rates notice under value capture flat rate:
t 30% over 20 years
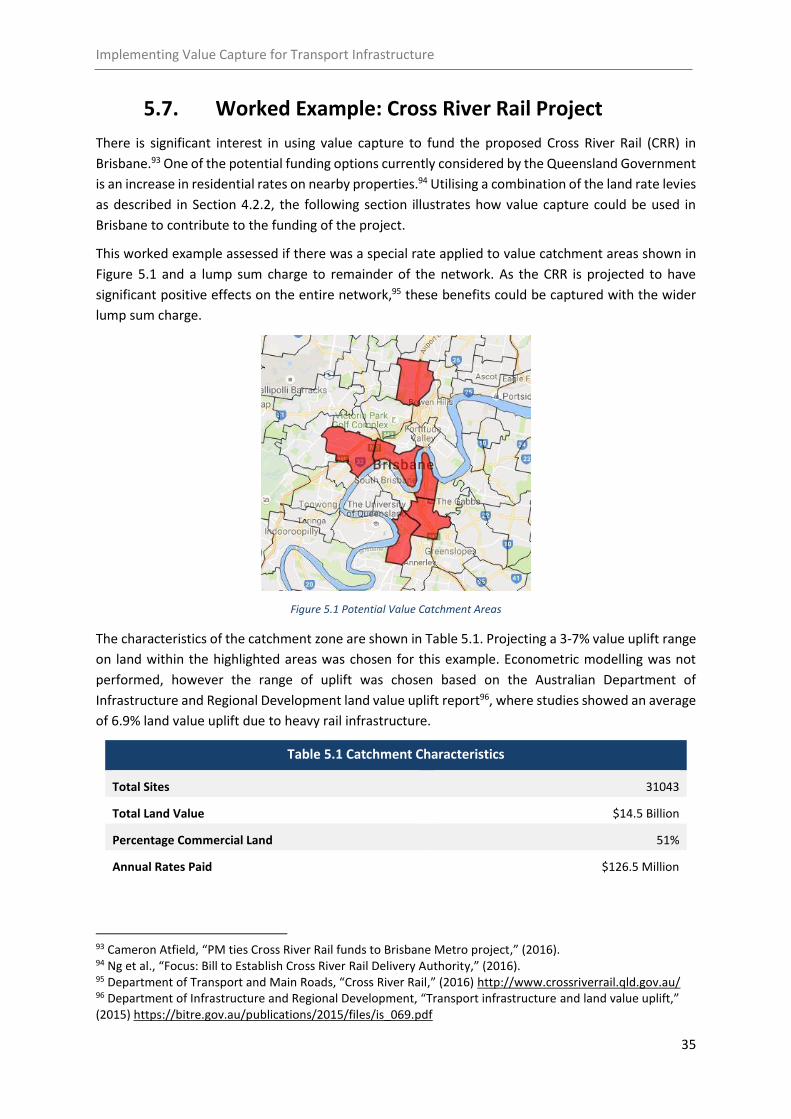
Implementing Value Capture for Transport Infrastructure
35
5.7. Worked Example: Cross River Rail Project
There is significant interest in using value capture to fund the proposed Cross River Rail (CRR) in
Brisbane.93 One of the potential funding options currently considered by the Queensland Government
is an increase in residential rates on nearby properties.94 Utilising a combination of the land rate levies
as described in Section 4.2.2, the following section illustrates how value capture could be used in
Brisbane to contribute to the funding of the project.
This worked example assessed if there was a special rate applied to value catchment areas shown in
Figure 5.1 and a lump sum charge to remainder of the network. As the CRR is projected to have
significant positive effects on the entire network,95 these benefits could be captured with the wider
lump sum charge.
Figure 5.1 Potential Value Catchment Areas
The characteristics of the catchment zone are shown in Table 5.1. Projecting a 3-7% value uplift range
on land within the highlighted areas was chosen for this example. Econometric modelling was not
performed, however the range of uplift was chosen based on the Australian Department of
Infrastructure and Regional Development land value uplift report96, where studies showed an average
of 6.9% land value uplift due to heavy rail infrastructure.
Table 5.1 Catchment Characteristics
Total Sites 31043
Total Land Value $14.5 Billion
Percentage Commercial Land 51%
Annual Rates Paid $126.5 Million
93 Cameron Atfield, “PM ties Cross River Rail funds to Brisbane Metro project,” (2016). 94 Ng et al., “Focus: Bill to Establish Cross River Rail Delivery Authority,” (2016). 95 Department of Transport and Main Roads, “Cross River Rail,” (2016) http://www.crossriverrail.qld.gov.au/ 96 Department of Infrastructure and Regional Development, “Transport infrastructure and land value uplift,” (2015) https://bitre.gov.au/publications/2015/files/is_069.pdf
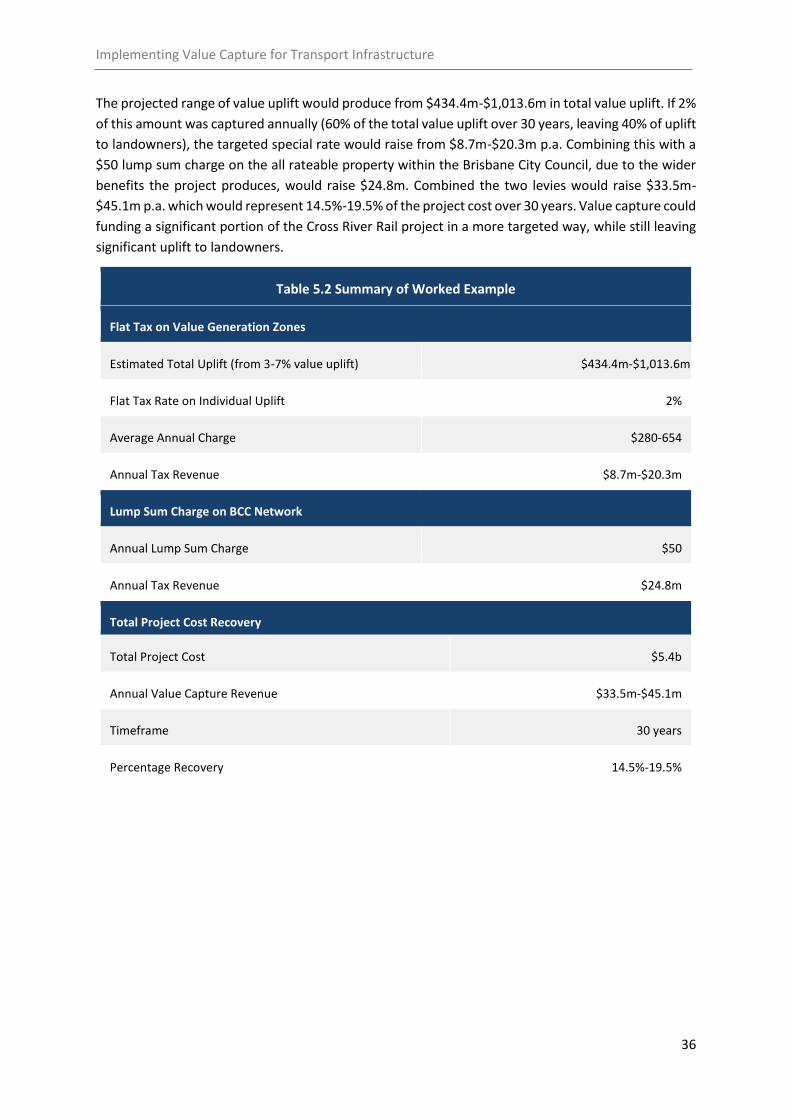
Implementing Value Capture for Transport Infrastructure
36
The projected range of value uplift would produce from $434.4m-$1,013.6m in total value uplift. If 2%
of this amount was captured annually (60% of the total value uplift over 30 years, leaving 40% of uplift
to landowners), the targeted special rate would raise from $8.7m-$20.3m p.a. Combining this with a
$50 lump sum charge on the all rateable property within the Brisbane City Council, due to the wider
benefits the project produces, would raise $24.8m. Combined the two levies would raise $33.5m-
$45.1m p.a. which would represent 14.5%-19.5% of the project cost over 30 years. Value capture could
funding a significant portion of the Cross River Rail project in a more targeted way, while still leaving
significant uplift to landowners.
Table 5.2 Summary of Worked Example
Flat Tax on Value Generation Zones
Estimated Total Uplift (from 3-7% value uplift) $434.4m-$1,013.6m
Flat Tax Rate on Individual Uplift 2%
Average Annual Charge $280-654
Annual Tax Revenue $8.7m-$20.3m
Lump Sum Charge on BCC Network
Annual Lump Sum Charge $50
Annual Tax Revenue $24.8m
Total Project Cost Recovery
Total Project Cost $5.4b
Annual Value Capture Revenue $33.5m-$45.1m
Timeframe 30 years
Percentage Recovery 14.5%-19.5%
Implementing Value Capture for Transport Infrastructure
37
6.0. Conclusions
Whilst value capture has recently emerged as a popular funding mechanism for transport
infrastructure, it is not a new concept, and it is certainly not the “magic bullet” some claim it to be. In
fact, Government already captures value that is created by infrastructure through their current
taxation schemes. Despite these existing methods, there has been significant pressure to diversify the
current methods of funding infrastructure, as well as strengthen the beneficiary-pays model, in order
to address the current identified funding gap.
Prior to implementing value capture, it is crucial to place an emphasis on understanding how value is
generated, and to recognise the concepts at play in land value uplift. The primary concept is that value
uplift on land due to the transport infrastructure will be equal to the benefit of added accessibility the
infrastructure provides. This concept allows for a distributional analysis of value uplift across all the
beneficiaries of infrastructure, which in turn allows the policy maker to deliver a targeted value
capture strategy.
A popular international example of value capture is the London Crossrail project. This method
collected a small amount from a large group, and funded a large percentage of the Crossrail project.
When this concept was applied to Brisbane in the context of the Cross River Rail project, it was found
that it would only fund approximately 2% of the project. This suggests that more sophisticated
methods than London’s broad-brush technique will be required to successfully implement value
capture in South-East Queensland.
Utilising more information in policy is part of a broader push towards ‘evidence-based policy-making’.
The challenge in using evidence-based policy for value capture is estimating the effect that
infrastructure has had on land values. This can be done by undertaking an ‘impact evaluation’ which
seeks to provide methods to monitor and evaluate a policy. The two methods used for impact
evaluation are the HPM and DID estimator which both have merits and weaknesses that dictate how
they can be used. When these methods are not possible to implement, TIF could be used as an
alternative.
A range of policies were then compared to see how a government could potentially capture estimated
uplift. A worked example for how value capture could work in South-East Queensland was applied to
the proposed Brisbane Cross River Rail project. A combination of a broad- based lump sum charge and
a targeted special flat rate tax implemented over a 30-year period could raise 15-20% of the projects
cost, assuming a 3-7% land value uplift in affected areas. This shows that a sophisticated approach to
value capture in South-East Queensland could fund a significant amount of Cross River Rail while
leaving substantial benefits to landowners.
Implementing Value Capture for Transport Infrastructure
38
References
ABS, “3218.0 - Regional Population Growth, Australia, 2013-14,” (2015),
http://www.abs.gov.au/ausstats/[email protected]/Previousproducts/3218.0Main%20Features3020
13-14?opendocument&tabname=Summary&prodno=3218.0&issue=2013-14&num=&view.
Alicia Rambaldi and Prasada Rao, “Hedonic Predicted House Price Indices Using Time-Varying
Hedonic Models with Spatial Autocorrelation,” Discussion Papers Series 432, University of
Queensland (2011).
Australian Treasury, “Australia’s Future Tax System,” (2009).
Brandt & Maenning, “The impact of rail access on condominium pries in Hamburg,” Transportation
(2011).
Brisbane City Council, “2014-2015 Annual Plan and Budget,” (2015).
Brisbane City Council, “Brisbane Annual Report 2015-16,” (2016): 209.
Brisbane City Council, “How Rates Are Calculated,” Last Updated August 2016,
https://www.brisbane.qld.gov.au/about-council/council-information-rates/rates-
payments/how-rates-are-calculated.
Bureau of Transport Statistics, “Public Transport Users in Sydney,” TransFigures (2013).
Cameron Atfield, “PM ties Cross River Rail funds to Brisbane Metro project,” (2016).
Cameron Murray, “Land value uplift from light rail,” (2016).
Canstar Blue, “Is it cheaper to catch public transport or drive,” (2015).
Cervero & Duncan, “Land Value Impacts of Rail Transit Services,” National Association of Realtors
Urban Land Institute (2002).
Cervero & Kang, “Bus rapid transit impacts on land uses and land values in Seoul, Korea,” Transport
Policy (2011).
Cervero R, Duncan M, “Rail transit’s value added: effect of proximity to light and commuter rail
transit on commercial land values in Santa Clara county California,” (2001).
Chan et al., “Public Infrastructure Financing: An International Perspective,” Productivity Commission
Staff Working Paper (2009).
City of Gold Coast, “Revenue Statement and Resolution of Rates and Charges 2014-2015,” (2014).
Cook County Clerk Map Dept, Tax Increment Financing Districts – City of Chicago Tax Year 2015
(2016)
Crossrail Limited, “Crossrail in Numbers,” (2016), http://www.crossrail.co.uk/news/crossrail-in-
numbers#.
Deborah Salon, “Value Capture Opportunities for Urban Public Transport Finance,” Transit
Leadership Summit (2012): 111.
Debrezion et al., “The Impact of Railway Stations on Residential and Commercial Property Value: A
Meta-analysis,” Journal of Real Estate Finance and Economics (2007).
Department of Infrastructure and Regional Development, “Transport infrastructure and land value
uplift,” (2015) https://bitre.gov.au/publications/2015/files/is_069.pdf
Department of Infrastructure, Local Government and Planning, “Rates and charges,” (2016).
Department of Transport and Main Roads, “Cross River Rail,” (2016)
http://www.crossriverrail.qld.gov.au/
Dubé et al., “A spatial Difference-in-Differences estimator to evaluate the effect of change in public
mass transit systems on house prices,” (2014).
Implementing Value Capture for Transport Infrastructure
39
Efthymiou & Constantinos, “Measuring the effects of transportation infrastructure location on real
estate prices and rents: investigating the current impact of a planned metro line,” EURO
Journal on Transportation and Logistics (2013).
Flavio Menezes, “Time-tested Ways to Fund Infrastructure,” Presentation, 2nd Annual QLD
Infrastructure Projects Conference (2016).
Gary Banks AO, “Challenges of evidence-based policy-making” - Commissioner’s forward, Australian
Public Service Commission, (2009).
Gertler et al., “Impact Evaluation in Practice,” The World Bank (2007).
Greater London Authority, “Intention to levy a business rate supplement to finance the Greater
London Authority’s contribution to the Crossrail project: Final Prospectus,” (2010).
Guhan Subramanian, “Negotiation? Auction? A Deal Maker’s Guide,” Harvard Business Review:
December 2009 Issue (2009)
Gunaratna et al., “Spatial Autocorrelation,” Recuperado el 2.
GVA, “Crossrail Property Impact Study,” (2012): 4.
Harvey D, “From managerialism to entrepreneurialism: the transformation in urban governance in
late capitalism,” Geografiska Annaler B (1989).
Infrastructure Australia, “Australian Infrastructure Plan”, (2016).
Infrastructure Australia, “Australian Infrastructure Plan”, (2016).
Infrastructure Australia, “Funding”, (2016).
Infrastructure Australia, “Infrastructure Finance and Funding Reform”- Report by Infrastructure
Finance Working Group (IFWG) (2012).
Infrastructure Victoria, “Value Capture – Options, Challenges and Opportunities for Victoria,” Policy
Paper (2016).
Jean Dubé and Diègo Legros, “Spatial Econometrics and Spatial Data Pooled over Time: Towards an
Adapted Modelling Approach,” (2011).
Johansson, Å. et al, “Taxation and Economic Growth,” OECD Economics Department Working Papers,
No. 620, (2008): 20.
Karley Densmore and Corinne Mulley, “Accessibility and residual land value uplift: Identifying spatial
variations in the accessibility impacts of a bus transitway,” Working paper (2012).
Knaap et al., “Do plans matter? The effects of light rail plans on land values in station areas,” (2001).
Marleen Brans and John Turnpenny, “The context and use of ex ante evaluation within
governments,” (2016).
Mcintosh, Trubka & Newman, “Can value capture work in a car dependent city? Willingness to pay
for transit access in Perth, Western Australia,” Transportation Research Part A: Policy and
Practice (2014): 323 [Redrawn from Center for Transit-Oriented Development].
Metropolitan Transportation Authority, New 7 Line Extension to 11 Avenue,
http://web.mta.info/nyct/service/new7LineExtension_to11Avenue.htm.
Mohammad, Graham, Melo, & Andersen, “A meta-analysis of the impact of rail projects on land and
property values,” Transportation Research Part A: Policy and Practice (2014).
Mulley & Tsai, “The impact of Liverpool-Parramatta Transitway on housing prices: a repeat sales
approach,” Australasian Transport Research Forum (2013).
National Audit Office, “Crossrail: Report by the Comptroller and Auditor General,” (2014): 24.
Ng et al., “Focus: Bill to Establish Cross River Rail Delivery Authority,” (2016).
Nigel Stapledon, “Value Capture and Transport Infrastructure – Public Policy Issues,” Presentation,
UNSW Real Estate Symposium (2016).
Implementing Value Capture for Transport Infrastructure
40
Pan and Zhang, “Rail transit impacts on land use: evidence from Shanghai, China,” Journal of the
Transportation Research Board 2048 (1) (2008): 16–25.
PricewaterhouseCoopers, “Economic Development Board: Major Infrastructure Funding
Alternatives,” Draft Report for the Property Council of Australia (2012).
PricewaterhouseCoopers, “Funding Australia’s Infrastructure”, (2014).
PricewaterhouseCoopers, “Tax Increment Financing to fund infrastructure in Australia,” Report for
the Office of the Economic Development Board – Department of Premier and Cabinet, South
Australia (2008).
Prosper Australia Research Institute, “Value Capture- a historical perspective”.
Prosper Australia, “Value Capture – a historical perspective,” https://www.prosper.org.au/land-
value-capture/value-capture-a-historical-perspective/.
Queensland Council of Social Service, “Review of public transport fares for the TransLink public
transport network in South-East Queensland,” Submission to the Queensland Government
(2013).
Queensland Government, “Exemptions from Land Tax,” Last Updated September 2016,
https://www.qld.gov.au/environment/land/tax/calculation/exemptions/.
Queensland Treasury, “Establishment of Statutory Bodies: Considerations and Contacts,” (April
2016): 2.
Read Stapleton, “Tax Increment Financing: Comparing Approaches in Northwest States,” Quarterly &
Urban Development Journal (2009): 34-49.
Richard Briffault, “The Most Popular Tool: Tax Increment Financing and the Political Economy of
Local Government,” Vol 77: Iss. 1, Article 4 (2010).
Richard Webb, “Petrol and Diesel Excises,” Research Paper, Economics, Commerce and Industrial
Relations Group (2000).
Rob Dossor, “Financing infrastructure by value capture,” Briefing Book, Parliamentary Library (2016).
Rogers et al., “Choosing appropriate designs and methods for impact evaluation,” Office of the Chief
Economist (2015).
Rosier and McDonald, “The relationship between transport and disadvantage in Australia,” CAFCA
Resource Sheet (2011).
Roy, M, “Alternative Funding and Financing Mechanisms for Rail Projects: Summary and Relevance
for Freight Rail Projects”, CPCS (2015).
SGS Economics and Planning, “Innovative Funding Models for Public Transport in Australia”, Report
for Rail, Tram and Bus Union Australia (RTBU Australia) (2015).
Société du Grand Paris, “A Modern and Extensive Transport Network,” Updated 2014,
https://www.societedugrandparis.fr/projet/le-grand-paris/reseau-transport-moderne-
etendu.
Tanya Alfredson and Azeta Cungu, “Negotiation Theory and Practice: A Review of the Literature,”
Report for the Food and Agriculture Organization of the United Nations, FAO (2016)
Terrill, M, “Roads to riches: Better transport infrastructure”, Grattan Institute (2016).
The Department of Infrastructure and Transport, “Our Cities, Our Future- A national urban policy for
a productive, sustainable and liveable future”, (2011).
William Lester, “Does Chicago’s Tax Increment Financing (TIF) Programme Pass the ‘But-for’ Test?
Job Creation and Economic Development Impacts Using Time-series Data,” (2013).
World Bank, “The Changing Wealth of Nations: Measuring Sustainable Development in the New
Millennium Washington D.C”, (2011): 27.