Embed Size (px)
Citation preview
Construction and Building Materials 59 (2014) 78–84
Contents lists available at ScienceDirect
Construction and Building Materials
journal homepage: www.elsevier .com/locate /conbui ldmat
Impact of vertical porosity distribution on the permeability of perviousconcrete
http://dx.doi.org/10.1016/j.conbuildmat.2014.02.0340950-0618/� 2014 Elsevier Ltd. All rights reserved.
⇑ Corresponding author. Address: 104 Holtzendorff Hall, Clemson, SC 29634, USA.Tel.: +1 (864) 245 5046; fax: +1 (864) 656 2670.
E-mail address: [email protected] (W.D. Martin III).
William D. Martin III a,⇑, Nigel B. Kaye b, Bradley J. Putman b
a General Engineering, Clemson University, Clemson, SC 29634, USAb Glenn Department of Civil Engineering, Clemson University, Clemson, SC 29634, USA
h i g h l i g h t s
� Vertical permeability distribution calculated from vertical porosity distribution.� Revised form of porosity–permeability relationship proposed.� Effective permeability calculated from vertical permeability distribution.� Effective permeability correlates to actual better than existing methods.� Minimum permeability (therefore porosity) in distribution tends to control.
a r t i c l e i n f o
Article history:Received 29 October 2013Received in revised form 13 February 2014Accepted 14 February 2014Available online 14 March 2014
Keywords:Porous pavementPervious concretePorosityPermeabilityHydraulic conductivity
a b s t r a c t
Though the presence of a vertical porosity distribution in porous pavements has been recognized, theimpact of this distribution on the permeability of the pavement has not been considered. This researchinvestigates the impact of a vertical porosity distribution on the overall permeability of pervious con-crete. First, an unimpaired porosity–permeability relationship was generated using pervious concretespecimens which had uniform porosity throughout. This relationship was then used in conjunction withthe vertical porosity distribution of surface compacted pervious concrete specimens to generate a verticalpermeability distribution. An effective permeability value was used to summarize the overall behavior ofthe permeability distribution and was shown to have a much better correlation with the actual perme-ability of the specimens than the permeability predicted using the average porosity of the specimen.Additionally, an analysis of the relationship between the permeability distribution and the effectivepermeability showed that the minimum permeability (and therefore minimum porosity) tends to havethe largest impact on the effective permeability.
� 2014 Elsevier Ltd. All rights reserved.
1. Introduction
Porous pavements provide a number of hydrologic benefitsincluding reducing runoff quantity, increasing ground waterrecharge, and improving runoff quality. However, for these benefitsto be realized, the pavement must be functioning hydraulically asdesigned. That is, the pavement should be achieving its designhydraulic conductivity or permeability. A typical indicator for thepermeability of the pavement is its porosity. A number of studieshave looked at this relationship for pervious concrete and the indi-vidual studies have often represented this data with an exponen-tial relationship [1–5], though when the results from multiple
studies are combined it is clear that there is significant variationin this behavior (Fig. 1).
Neithalath et al. [6] recognized that there were more factors in-volved in the prediction of the permeability than just the porosity.They incorporated the characteristic pore diameter and connectiv-ity to try to improve the permeability prediction of a pervious con-crete mixture. However, like the other studies, they assumed thatthe concrete specimens had a uniform porosity. It has been shownthat compaction of pervious concrete, in the lab and in the field,creates a vertical porosity distribution within the lab specimensand field pavement [7–9]. In the five studies included in Fig. 1,vibration, rodding, tamping with a Proctor hammer, and fieldcompactions were all used as compaction methods. Therefore,the assumption of uniform porosity in the specimens is likelyincorrect. These porosity distributions can impact the overallpermeability of the specimen and be a source of variability in Fig. 1.

0
1E-09
2E-09
3E-09
4E-09
10 15 20 25 30 35
Per
mea
bilit
y (m
2 )
Porosity (%)
Low et al. 2008 Montes and Haselbach 2006Neithalath 2004 Wang et al. 2006Sumanasooriya and Neithalath 2011 Expon. (Cumulative)
Fig. 1. Collection of permeability as a function of porosity data from five studies [1–5].
W.D. Martin III et al. / Construction and Building Materials 59 (2014) 78–84 79
In certain circumstances, the compaction of the pavement cancause the porosity to decrease so much that the pavement be-comes completely sealed at certain depths. Surface sealing hasbeen seen in the field [10] and has been attributed to poor mixtureproportions and over-compaction. In the lab, this has also been re-corded for high paste mixtures [4]. For a pavement that has surfacesealing, the average porosity of the pavement may fall within anacceptable range where a good permeability would be predicted,however, because of the sealed layer, the infiltration of the pave-ment is zero. This is an extreme case of the effect of a verticalporosity distribution on the permeability, but it illustrates the po-tential error in using a pavements’s average porosity to predict itspermeability.
The objectives of this study were to better quantify the impactof a vertical porosity distribution on the permeability of a porouspavement and to utilize this knowledge to improve the predictionof a pervious concrete mixture’s permeability from its measuredporosity.
2. Experimental methods
2.1. Mixture proportions
Four pervious concrete mixtures were used to investigate the impact of avertical porosity distribution on the permeability of a porous pavement. Twelvecompacted cylinders were made from each of the four mixtures shown in Table 1;six were used to find the vertical porosity distribution using image analysis [8] andthe other six to measure the vertical permeability profile using hydraulic conductiv-ity testing. The primary differences between the four mixtures were the maximumaggregate size and gradation.
Cylinders, 15.2 cm (6 in.) tall and 15.2 cm (6 in.) in diameter, were used as thisis a common thickness of pervious concrete and simulating the porosity distribu-tion over this height would closely approximate an over-consolidated pavement.Multiple studies have found that compacting a 30.4 cm (12 in.) cylinder in two lifts
Table 1Mixture proportions and aggregate gradations used for four sets of pervious concretespecimens.
Mixture 1 Mixture 2 Mixture 3 Mixture 4
Water/cement 0.30 0.30 0.30 0.30Cement/aggregate 0.25 0.28 0.28 0.28
Percent Passing, %25 mm (100) 100 100 100 10019 mm (3/400) 100 100 100 9812.5 mm (1/200) 100 100 100 689.5 mm (3/800) 100 50 50 394.75 mm (#4) 29 15 10 52.36 mm (#8) 4 5 2 21.18 mm (#16) 2 3 – –0.15 mm (#100) 1 – – –
and compacting each layer with 10 blows of the Proctor hammer creates cylindersthat replicate the average in situ properties of field placed concrete [11,12], but inthe field, the specimen is only compacted in a single lift, which is a likely cause ofthe vertical porosity distribution. To replicate the surface compaction, the concretewas mixed and placed in one lift and was compacted with 20 blows of a standardProctor hammer.
When the first mixture was compacted (Mixture 1), the above compaction pro-cedure was used. However, even though the mixture was compacted in one lift, themold did not have an extension collar when the specimen was compacted, so con-crete was added to the top of the specimen during compaction to keep the mold asclose to full as possible. This technique produced satisfactory surface compaction.However, it was found that adding a collar and initially overfilling the mold, so thatno mixture needed to be added during compaction, produced a more pronouncedporosity distribution. Because this second compaction method is closer to fieldplacement and exaggerates the porosity distribution, it was used for the other threemixtures. Additionally, two reference cylinders from each mixture were cast thathad no compaction.
2.2. Porosity measurement
To measure the porosity of the specimens volumetrically, the Corelok� vacuumsealing machine was used in accordance with ASTM D7063 [13]. The cylinder wasvacuum sealed inside a bag having a mass, B, and then weighed submerged under-water both sealed, E, and unsealed, C. The porosity, U, was found as
U ¼ SG2� SG1SG2
� 100 ð1Þ
Bulk Specific Gravity ¼ SG1 ¼ AB� E� B�A
FT
ð2Þ
Apparent Specific Gravity ¼ SG2 ¼ AB� C � B�A
FT1
ð3Þ
where FT and FT1 are the apparent specific gravity of the plastic vacuum bag whensealed and unsealed, respectively.
2.3. Permeability measurement
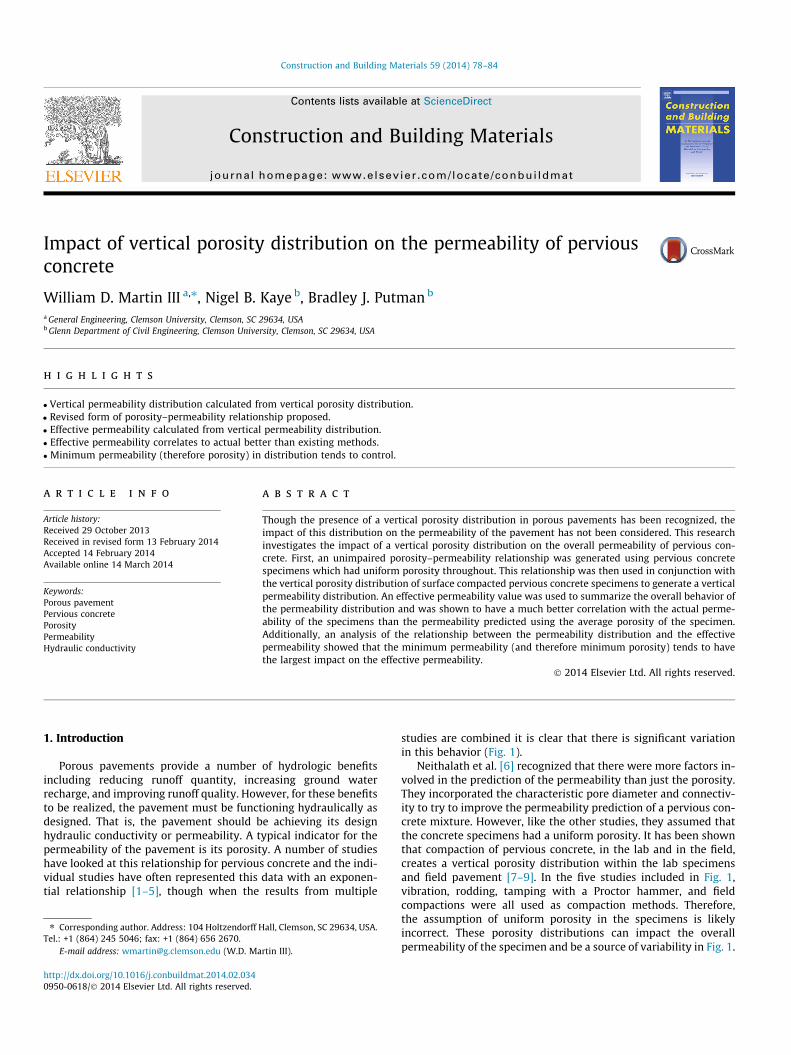
To quantify the impact of the porosity distribution on the permeability of thepavement, the hydraulic conductivity of all 12 cylinders in each set was measuredusing a modified falling head procedure based on ASTM D 5856 [14]. The permeam-eter apparatus is shown in Fig. 2. The hydraulic conductivity, K, was thentransformed into permeability, k, using
k ¼ Klqg
ð4Þ
where l is the dynamic viscosity of water, q is the density of water, and g is theacceleration due to gravity. The term permeability here is used to mean the intrinsicpermeability which is a material property independent of the fluid material proper-ties and is used in the Darcy equation for porous media flow.
2.4. Experimental porosity and permeability distribution measurement
After the overall porosity and permeability were measured for the samples, thevertical porosity and permeability distributions were measured. However, due toincompatible test procedures, six of the 12 specimens for each mixture were testedfor porosity and the other six specimens for permeability.
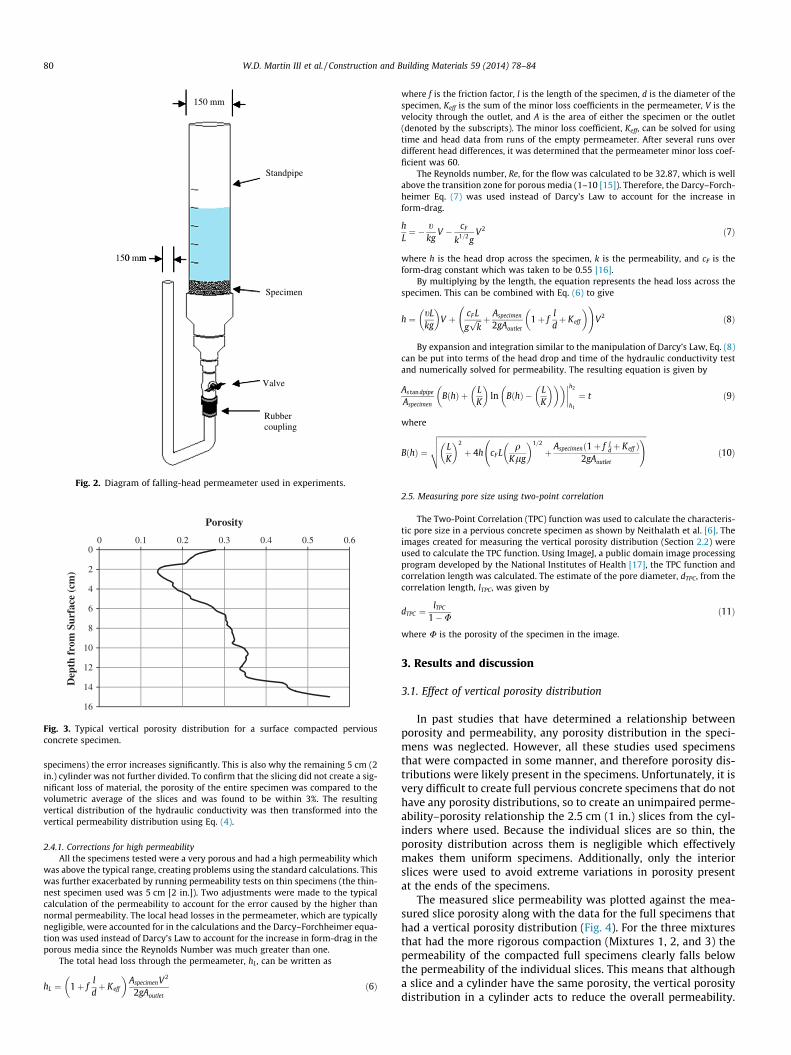
The vertical porosity distribution was measured using the image analysis tech-nique described in Martin III et al. [8]. This method involves cutting the specimen inhalf vertically, painting and scanning the cut faces, and analyzing the scannedimages to produce a vertical distribution of the porosity. A typical porosity distribu-tion generated with this method is shown in Fig. 3.
The six cylinders that were not sliced vertically for image analysis porositymeasurement underwent further hydraulic conductivity tests to establish the ver-tical variation in permeability. In this series of tests, 2.5 cm (1 in.) slices were cutfrom the top of the cylinders, using a diamond tipped concrete saw, and the hydrau-lic conductivity was then measured for the remaining lower section of the cylinder.Once four 2.5 cm (1 in.) slices had been removed from each cylinder the hydraulicconductivity of each slice can be calculated using
LKcylinder
¼ Lslice
Ksliceþ Lcylinder2
Kcylinder2ð5Þ
where K is the hydraulic conductivity and L is the length of the respective element.The subscripts indicate the full specimen, ‘cylinder’, the slice, ‘slice’, and the truncatedspecimen, ‘cylinder2’.
This procedure was used because it was impractical to test a 2.5 cm (1 in.) slicein the permeameter used in this study. This is due to both the design of the perme-ameter and the fact that as the time for each run decreases (as it will for short
1500 mmm
150 mm
Valve
Standpipe
Specimen
Rubcou
ber pling
Fig. 2. Diagram of falling-head permeameter used in experiments.
0
2
4
6
8
10
12
14
16
0 0.1 0.2 0.3 0.4 0.5 0.6
Dep
th f
rom
Sur
face
(cm
)
Porosity
Fig. 3. Typical vertical porosity distribution for a surface compacted perviousconcrete specimen.
80 W.D. Martin III et al. / Construction and Building Materials 59 (2014) 78–84
specimens) the error increases significantly. This is also why the remaining 5 cm (2in.) cylinder was not further divided. To confirm that the slicing did not create a sig-nificant loss of material, the porosity of the entire specimen was compared to thevolumetric average of the slices and was found to be within 3%. The resultingvertical distribution of the hydraulic conductivity was then transformed into thevertical permeability distribution using Eq. (4).
2.4.1. Corrections for high permeabilityAll the specimens tested were a very porous and had a high permeability which
was above the typical range, creating problems using the standard calculations. Thiswas further exacerbated by running permeability tests on thin specimens (the thin-nest specimen used was 5 cm [2 in.]). Two adjustments were made to the typicalcalculation of the permeability to account for the error caused by the higher thannormal permeability. The local head losses in the permeameter, which are typicallynegligible, were accounted for in the calculations and the Darcy–Forchheimer equa-tion was used instead of Darcy’s Law to account for the increase in form-drag in theporous media since the Reynolds Number was much greater than one.
The total head loss through the permeameter, hL, can be written as
hL ¼ 1þ fldþ Keff
� �AspecimenV2
2gAoutletð6Þ
where f is the friction factor, l is the length of the specimen, d is the diameter of thespecimen, Keff is the sum of the minor loss coefficients in the permeameter, V is thevelocity through the outlet, and A is the area of either the specimen or the outlet(denoted by the subscripts). The minor loss coefficient, Keff, can be solved for usingtime and head data from runs of the empty permeameter. After several runs overdifferent head differences, it was determined that the permeameter minor loss coef-ficient was 60.
The Reynolds number, Re, for the flow was calculated to be 32.87, which is wellabove the transition zone for porous media (1–10 [15]). Therefore, the Darcy–Forch-heimer Eq. (7) was used instead of Darcy’s Law to account for the increase inform-drag.
hL¼ � t
kgV � cF
k1=2gV2 ð7Þ
where h is the head drop across the specimen, k is the permeability, and cF is theform-drag constant which was taken to be 0.55 [16].
By multiplying by the length, the equation represents the head loss across thespecimen. This can be combined with Eq. (6) to give
h ¼ tLkg
� �V þ cF L
gffiffiffikp þ Aspecimen
2gAoutlet1þ f
ldþ Keff
� � !V2 ð8Þ
By expansion and integration similar to the manipulation of Darcy’s Law, Eq. (8)can be put into terms of the head drop and time of the hydraulic conductivity testand numerically solved for permeability. The resulting equation is given by
As tan dpipe
AspecimenBðhÞ þ L
K
� �ln BðhÞ � L
K
� �� �� �����h2
h1
¼ t ð9Þ
where
BðhÞ ¼
ffiffiffiffiffiffiffiffiffiffiffiffiffiffiffiffiffiffiffiffiffiffiffiffiffiffiffiffiffiffiffiffiffiffiffiffiffiffiffiffiffiffiffiffiffiffiffiffiffiffiffiffiffiffiffiffiffiffiffiffiffiffiffiffiffiffiffiffiffiffiffiffiffiffiffiffiffiffiffiffiffiffiffiffiffiffiffiffiffiffiffiffiffiffiffiffiffiffiffiffiffiffiffiffiffiffiffiffiffiffiffiffiLK
� �2
þ 4h cF Lq
Klg
� �1=2
þAspecimenð1þ f l
dþ Keff Þ2gAoutlet
!vuut ð10Þ
2.5. Measuring pore size using two-point correlation
The Two-Point Correlation (TPC) function was used to calculate the characteris-tic pore size in a pervious concrete specimen as shown by Neithalath et al. [6]. Theimages created for measuring the vertical porosity distribution (Section 2.2) wereused to calculate the TPC function. Using ImageJ, a public domain image processingprogram developed by the National Institutes of Health [17], the TPC function andcorrelation length was calculated. The estimate of the pore diameter, dTPC, from thecorrelation length, lTPC, was given by
dTPC ¼lTPC
1�Uð11Þ
where U is the porosity of the specimen in the image.
3. Results and discussion
3.1. Effect of vertical porosity distribution
In past studies that have determined a relationship betweenporosity and permeability, any porosity distribution in the speci-mens was neglected. However, all these studies used specimensthat were compacted in some manner, and therefore porosity dis-tributions were likely present in the specimens. Unfortunately, it isvery difficult to create full pervious concrete specimens that do nothave any porosity distributions, so to create an unimpaired perme-ability–porosity relationship the 2.5 cm (1 in.) slices from the cyl-inders where used. Because the individual slices are so thin, theporosity distribution across them is negligible which effectivelymakes them uniform specimens. Additionally, only the interiorslices were used to avoid extreme variations in porosity presentat the ends of the specimens.
The measured slice permeability was plotted against the mea-sured slice porosity along with the data for the full specimens thathad a vertical porosity distribution (Fig. 4). For the three mixturesthat had the more rigorous compaction (Mixtures 1, 2, and 3) thepermeability of the compacted full specimens clearly falls belowthe permeability of the individual slices. This means that althougha slice and a cylinder have the same porosity, the vertical porositydistribution in a cylinder acts to reduce the overall permeability.

W.D. Martin III et al. / Construction and Building Materials 59 (2014) 78–84 81
This difference is not as clear for Mixture 1, possibly as a result ofthe less effective (concentrated) compaction method or the higherporosity of these specimens. To confirm this, the porosity–perme-ability data from specimens of the same mixture proportionswhich underwent the more rigorous compaction was also plottedin Fig. 4(a). These specimens were created as part of a differentstudy which is why this data is only used for comparison. Whiletheir permeability was definitely lower than the full cylinders cre-ated for this study, they were not as different from the slices as forthe other gradations which lead to the conclusion that both thecompaction method and mean porosity influence the impact of avertical porosity distribution on the permeability.
A power law function was fitted through the porosity–perme-ability data for the individual slices. For all but one of the mixturedesigns, the power law exponent is very close to four although thepre-factor varies significantly with gradation.
3.2. Permeability as a function of porosity
In past studies [6,18,19], it has been shown that permeability, k,(which is proportional to the hydraulic conductivity) can be repre-sented by
k ¼ 1226
� �vUl2 ð12Þ
where v is the pore connectivity factor, U is the porosity, and l is alength scale that Neithalath et al. [6] took to be the morphologicallydetermined value of pore sizes. Sumananooriya and Neithalath [20]have shown that the pore connectivity factor is linearly related toeffective pore size
v ¼ m1deff þ b1 ð13Þ
where m1 and b1 are functions of aggregate gradation. Similarly, thepore diameter, deff, found using the two-point correlation method asdescribed in Neithalath et al. [6], is also a linear function of theporosity
(a) (
(c) (
y = 2E-15x3.95
R² = 0.81
1.E-10
1.E-09
1.E-08
10 100
Per
mea
bilit
y (m
2 )
Porosity (%)
y = 5E-15x3.84
R² = 0.88
1.E-10
1.E-09
1.E-08
10 100
Per
mea
bilit
y (m
2 )
Porosity (%)
Fig. 4. Relationship between permeability and porosity for slices, compacted full cylinderespectively (which are in order of increasing aggregate size). The compacted cylinders frcompacted as described in the methods, but were not used for the additional destructiv
deff ¼ m2Uþ b2 ð14Þ
where m2 and b2 are functions of aggregate gradation. This linearrelationship was observed in the pervious concrete specimens pre-pared for this study as shown in Fig. 5. Physically, it makes sensethat, for a constant aggregate gradation, as the porosity of a mixtureincreases the diameter of the pores increases with it. As the poresgrow in size they will also interact and connect with more poresthereby increasing the pore connectivity factor.By combining Eqs.(12)–(14) and expanding
k ¼ 1226
� �m1m3
2U4 þm2
2ð3m1b2 þ b1ÞU3h
þm2b2ð3m1b2 þ 2b1ÞU2 þ b22ðm1b2 þ b1ÞU
ið15Þ
a fourth order polynomial in terms of porosity is obtained. The aver-age value of each parameter is given in Table 2 and was substitutedinto Eq. (15) giving
k ¼ 1226
� �ð3:584� 10�3 m2ÞU4 þ ð4:35� 10�4 m2ÞU3h
þð�2:6� 10�6 m2ÞU2 þ ð�3� 10�7 m2ÞUi
ð16Þ
Eq. (16) can then be used to establish which terms contribute mostsignificantly to the estimated permeability.
Fig. 6(a) shows a term by term plot of Eq. (15) over the range ofporosity values measured in the test specimens prepared for thisstudy. Although the behavior at lower porosities is difficult tosee, it is clear that the fourth order term begins to dominate abovea porosity of 20%.
When the same data is plotted on a log–log scale, Fig. 6(b), itbecomes much clearer that in the porosity range plotted (10–40%), the total permeability can be accurately approximated bythe fourth order term, even though its slope is slightly less thanfour. This is confirmed by experimental data in Fig. 4, where themedian exponent was 3.89. Therefore, above 10% porosity, the
b)
d)
y = 7E-14x3.03
R² = 0.90
1.E-10
1.E-08
10 100
1.E-09
Per
mea
bilit
y (m
2 )
Porosity (%)
y = 6E-15x3.94
R² = 0.87
1.E-10
1.E-09
1.E-08
10 100
Per
mea
bilit
y (m
2 )
Porosity (%)
rs, and un-compacted full cylinders. Figures (a–d) represent Mixtures 1, 2, 3, and 4om a different study shown in (a) are identical in mix design to mixture 1 and weree testing.

0
1
2
3
4
5
6
0 10 20 30 40 50
d T
PC
(mm
)
Porosity (%)
Mixture 1 Mixture 2 Mixture 3 Mixture 4
Fig. 5. Morphological pore diameter as measured using two-point correlation as afunction of porosity and gradation. The R2 values ranged from 0.85 to 0.95 with anaverage of 0.92.
Table 2Approximate value of each variable used to determine the scale of each term in Eq.(15). Variables m1 and b1 are estimated from Sumananooriya and Neithalath [20].
Variable Average value
m1 7000/mm2 0.008 mb1 �10b2 0.00008 m
y = 2.04E-15xR² = 8.19E-01
y = 2.84E-15xR² = 0.94y = 3.02E-15x
R² = 0.87
y = 5.10E-15xR² = 0.83
0
1E-09
2E-09
3E-09
4E-09
5E-09
0 500000 1000000 1500000 2000000
Per
mea
bilit
y (m
2 )
(Porosity [%])4
Mixture 1 Mixture 2 Mixture 3 Mixture 4
Fig. 7. Permeability as a function of porosity to the fourth.
y = 4.55E-09x + 1.52E-08R² = 0.77
0
1E-08
2E-08
3E-08
4E-08
5E-08
6E-08
7E-08
8E-08
0 5 10 15
a i1/2
Nominal Particle Diameter (mm)
Fig. 8. Relationship between coefficient ai and the average particle diameter of thegradation.
82 W.D. Martin III et al. / Construction and Building Materials 59 (2014) 78–84
permeability effectively scales on the porosity raised to the fourthpower, that is,
k � aiU4 ð17Þ
where ai is a function of the gradation used.The experimental data for the individual slices presented in
Fig. 4 was re-plotted as the permeability versus the porosity raisedto the fourth power in Fig. 7. Plotted in this form, the data is seen tobe approximately linear. The R2 values attained from fitting a linethrough the data (forced through the origin) ranged from 0.82 to0.94 with a mean of 0.864. It is, therefore, reasonable to approxi-mate the permeability of a homogeneous pervious concrete ofporosity U using Eq. (17) and an appropriate pre-factor ai.
The pre-factor, ai, in Eq. (17) is a function of the connectivityand the pore size. The pore size will vary depending on the irregu-larity of the aggregate shape and the size of the aggregate particles.Therefore, one would expect that ai would vary with aggregate gra-dation and increase with increasing nominal particle size. This isclearly seen in Fig. 8 which shows the calculated pre-factor fromthe linear fit in Fig. 7 plotted against the average particle diameter.
0.E+00
1.E-07
2.E-07
3.E-07
4.E-07
5.E-07
10 20 30 40
Per
mea
bilit
y, k
(m
2 )
Porosity (%)Full Eqn. 4th order term3rd order term 2nd order term1st order term
(a) (b
Fig. 6. Contribution from each term to the total permeability plotted as (a) linear–linearare given in Table 2. The first and second order terms plotted are the absolute value of
3.3. Vertical permeability distribution
Using the relationships between porosity and permeability, Eq.(17) and a measured vertical porosity profile (as found inHaselbach and Freeman [7] and Martin III et al. [8]), a vertical per-meability distribution can be calculated for a given aggregate gra-dation. A plot of the calculated vertical permeability distributionfor one specimen, along with measured values of the permeabilityfrom the falling head tests, is shown in Fig. 9. There is clearly goodagreement between the measured and predicted values and the re-sult indicates that the local permeability can vary significantly overthe specimen depth.
Per
mea
bilit
y, k
(m
2 )
1.E-10
1.E-09
1.E-08
1.E-07
1.E-06
10Porosity (%)
Full Eqn. 4th order term3rd order term 2nd order term1st order term
)
and (b) log–log. The values used to generate this are averages of the gradations andactual terms.

0
2
4
6
8
10
12
14
16
0.E+00 4.E-09 8.E-09
Dep
th (
cm)
Permeability (m2)
ExperimentalPredicted from SlicesPredicted from VPDAveraged VPD
Fig. 9. Distribution of experimental and predicted permeability over the depth of aspecimen. The predicted theoretical values use the experimental relationshipscalculated in Section 3.2 to estimate the permeability from the experimentallymeasured porosity. The averaged VPD data points transform the continuouspermeability distribution from VPD into discrete points to allow direct comparisonto the data from the slices.
y = 1.52xR² = 0.32
y = 0.37xR² = 0.64
y = 0.71xR² = 0.69
0
1E-09
2E-09
3E-09
4E-09
5E-09
0 2E-09 4E-09
Est
imat
ed P
erm
eabi
lity
(m2 )
Actual Permeability (m2)
Average Minimum Effective
Fig. 11. Using the average porosity, minimum porosity, and effective permeabilityto predict the experimental permeability of the specimens.
W.D. Martin III et al. / Construction and Building Materials 59 (2014) 78–84 83
Because this vertical permeability curve is representative of theactual permeability curve, it can be used to find an effective perme-ability for the specimen by integrating the head loss over the depthof the specimen
Lkeff¼X Li
ki¼Z L
0
1k
dL ð18Þ
where keff is the effective permeability for the specimen, L is thelength of specimen, and ki and Li are the permeability and length,respectively, of the incremental slices.
By utilizing the concept of the effective permeability, theimpact of the vertical porosity distribution on permeability canbe easily estimated. Three porosity distributions which matchthe porosity distributions common to surface compacted porouspavements were generated [7,8]. The three distributions variedonly in their mean porosity as shown in Fig. 10(a). The contributionof each slice to the effective permeability was then calculated,using the summation form of Eq. (18), and plotted in Fig. 10(b).The contributions from the slices for a distribution sum to one.
Two trends are apparent in Fig. 10. First, the minimum porosityin the distribution has the greatest impact on the effective perme-ability. Second, the relative importance of this minimum porosityincreases as the porosity decreases. These trends confirm theobservations made from Fig. 4 that the porosity distributionimpacts the permeability and that this impact increases as theporosity decreases.
0
2
4
6
8
10
12
14
16
Dep
th b
elow
sur
face
(c
m)
Porosity
Low
0 0.2 0.4 0.6
(a)
Fig. 10. Three typical porosity distributions for (a) low, medium, and high porosity specimThe lowest porosity slice has the largest impact on the effective permeability and the im
3.4. Effects of porosity distribution on permeability
Using the relationship between permeability and porosity, Eq.(17) determined from the uniform porosity specimens (seeSection 3.2), the permeability of each cylindrical specimen waspredicted in three ways: using the average porosity (found usingthe Corelok method), minimum porosity (found using the imageanalysis method), and the effective permeability (found using thevertical permeability distribution derived from the vertical poros-ity distribution and Eq. (17)). Because the effective permeabilitywas derived on a theoretical basis, it was expected that it wouldbe the best indicator of the actual permeability. The minimumporosity value was used because it was shown to have a strong im-pact on the effective permeability (Fig. 10(b)) and, therefore, mayhave a good correlation with the actual behavior. It was expectedthat using the average porosity of the specimens would producean overestimation of the permeability compared to experimentalresults because the porosity distribution reduces the permeability.The three predicted permeability values are plotted against themeasured cylinder permeability in Fig. 11.
The data in Fig. 11 shows that the calculated effective perme-ability did have the best fit to the experimental permeability withan R2 of 0.69. The prediction of the permeability using the mini-mum porosity was also comparatively high with an R2 of 0.64,while the predictions using the average porosity had the worstfit with an R2 of 0.32. This means that when a porous pavementhas a vertical porosity distribution due to compaction, it is criticalto incorporate that into the estimation of permeability for an accu-rate prediction.
This relationship could be further improved if the actual valuesof the connectivity were measured and used in Eq. (12) (similar toNeithalath et al. [6]) instead of using the approximations in Eq. (17).
Mid High
0
2
4
6
8
10
12
14
160 0.5 1
Dep
th b
elow
sur
face
(c
m)
Contribution of slice to effective permeability
(b)
ens and (b) each slice’s contributions to the effective permeability of the specimen.pact increases as the porosity decreases.

84 W.D. Martin III et al. / Construction and Building Materials 59 (2014) 78–84
4. Conclusions
Permeability–porosity relationships for four gradations of per-vious concrete were established using uniform porosity specimens,that is specimens that do not have a permeability distribution. Theconcepts of pore size and connectivity, which have been shown tobe important to the permeability of a pervious concrete pavement[6], were incorporated into the approximated relationship given byEq. (17). The relationships and pre-factors presented here are onlyvalid for the mixtures evaluated in this study. Further work wouldneed to be completed to establish standard permeability–porosityrelationships for other gradations or variations of design parame-ters such as cement content and water-to-cement ratio.
Using these permeability–porosity relationships and the verti-cal porosity distributions generated from surface compacted spec-imens, an accurate vertical permeability distribution within aspecimen was created and experimentally verified. From this, aneffective permeability was calculated which had a much highercorrelation with the actual permeability of the specimen than aprediction of the specimen’s permeability using only the averageporosity. Additionally, by analyzing the relationship between thepermeability distribution and effective permeability, it was foundthat the minimum permeability (and therefore minimum porosity)value of the distribution tends to have the largest impact on theoverall effective porosity.
It was shown that the accurate prediction of permeability usingmeasured porosity values requires knowledge of the verticalporosity distribution that is typically present in compacted pervi-ous concrete specimens. To ensure an accurate prediction of per-meability using pavement properties, the vertical porositydistribution must be considered. Current permeability–porosityrelationships that do not include the effects of a vertical porositydistribution should be revised to consider this.
If the vertical porosity distributions created by different com-paction methods were generalized, such as in Haselbach and Free-man [7], the effect of the porosity distribution could be used topredict the permeability without direct measurement. This wouldsimplify the process by using the more simply measured averageporosity, along with knowledge of the gradation and compaction,to calculate the permeability instead of having to directly measurethe vertical porosity distribution.
References
[1] Low K, Harz D, Neithalath N. Statistical characterization of the pore structureof enhanced porosity concretes. Concrete Technology Forum. Focus onSustainable Development; 2008.
[2] Montes F, Haselbach LM. Measuring hydraulic conductivity in perviousconcrete. Environ Eng Sci 2006;23:960–9.
[3] Neithalath N. Development and characterization of acoustically efficientcementitious materials. Ph.D. thesis. Purdue University; 2004.
[4] Sumanasooriya MS, Neithalath N. Pore structure features of pervious concretesproportioned for desired porosities and their performance prediction. CemConcr Compos 2011;33:778–87.
[5] Wang K, Schaefer VR, Kevern JT, Suleiman MT. Development of mix proportionfor functional and durable pervious concrete. In: Proceedings of the 2006NRMCA concrete technology forum—focus on pervious, concrete; 2006.
[6] Neithalath N, Sumanasooriya MS, Deo O. Characterizing pore volume, sizes,and connectivity in pervious concretes for permeability prediction. MaterCharact 2010;61:802–13.
[7] Haselbach LM, Freeman RM. Vertical porosity distributions in perviousconcrete pavement. ACI Mater J 2006;103.
[8] Martin III WD, Putman BJ, Kaye NB. Using image analysis to measure theporosity distribution of a porous pavement. Constr Build Mater2013;48:210–7.
[9] De Somer M, De Winne E. Method to establish the ‘‘porosity-depth’’distribution of porous concrete pavement using cylindrical 100 cm2 coressamples. In: Proceedings of the 8th international symposium on concreteroads, Lisbon, Portugal: AIPCR; 1998. p. 171–6.
[10] Putman BJ. Field performance of porous pavements in South Carolina. In:Proceedings of the 2010 South Carolina water resources conference, Columbia,SC; 2010. p. 4.
[11] Putman BJ, Neptune AI. Comparison of test specimen preparation techniquesfor pervious concrete pavements. Constr Build Mater 2011;25:3480–5.
[12] Rizvi R, Tighe SL, Henderson V, Norris J. Laboratory sample preparationtechniques for pervious concrete. In: TRB 88th annual meeting compendium ofpapers; 2009.
[13] ASTM D7063/D7063M. Standard test method for effective porosity andeffective air voids of compacted bituminous paving mixture samples. WestConshohocken, PA: ASTM International; 2011.
[14] ASTM D5856, 1995. Standard test method for measurement of hydraulicconductivity of porous material using a Rigid-Wall. Compaction-MoldPermeameter. West Conshohocken, PA: ASTM International; 2007.
[15] Bear J. Dynamics of fluids in porous media. Courier Dover Publications; 1988.[16] Ward JC. Turbulent flow in porous media. Proc Am Soc Civil Eng 1964;90:1–12.[17] National Institutes of Health. ImageJ; 2013.[18] Johnson DL, Koplik J, Schwartz LM. New pore-size parameter characterizing
transport in porous media. Phys Rev Lett 1986;57:2564–7.[19] Katz AJ, Thompson AH. Quantitative prediction of permeability in porous rock.
Phys Rev B Condensed Matter 1986;34:8179–81.[20] Sumanasooriya MS, Neithalath N. Stereology- and morphology-based pore
structure descriptors of enhanced porosity (pervious) concretes. ACI Mater J2009;106:429–38.