Embed Size (px)
Citation preview

Impact of R&D investments on the economic growth of the Czech
Republic – a recursively dynamic CGE approach
Zuzana Křístková, Czech University of Life Sciences in Prague
Abstract The paper investigates how results obtained with standard CGE models can be improved by
incorporating the effects of the R&D activities in a recursively-dynamic CGE model built for the
economy of the Czech Republic. The main objective of the paper is to quantify the impact of the R&D
activities on the long-term economic growth of the Czech Republic in the recursively dynamic CGE
framework. The effects of R&D investments are modelled via the accumulation of knowledge that is
treated as a specific production factor.
Main findings show that knowledge accumulation can contribute to higher economic growth, but the
impact of the dynamisation in the CGE model is very low. However, in terms of structural changes in
the economy, the omission of knowledge capitalization might underestimate the tertiary sector in the
longer run. The paper also investigates the efficiency of R&D investments and concludes that in the
longer run, the investments to capital goods are more efficient in reaching higher economic growth. In
the concluding chapter, related factors that may improve the impact of knowledge in the CGE model
are discussed.
Key words: R&D investments, CGE model, Czech Republic, knowledge accumulation, economic
growth.
1. Introduction Developed economies are facing a problem of declining competitiveness on a global scale. The
perspectives for sustaining the world economic leadership are associated with stimulating
technological progress through innovations and investments to R&D. This is a challenge for the
private sector but also for governments in prioritizing their policies in line with the goal of sustaining
the competitive advantage. Within the EU, the debates are often centred on the effective allocation of
subsidies from the EU budget, in which certain support of policies, such as the Common Agricultural
Policy, occupy a considerable part. However, the ideas of reallocation of the agricultural subsidies to
the prospective sectors of the economy such as the sector of Research and Development should be
supported with a thorough research, revealing possible impacts on the whole economy.
Computable General Equilibrium models provide appropriate instruments in assessing the ex-ante
impact of different policy scenarios. However, in the field of Research and Development, standard
CGE models do not capture properly the R&D effects, due to several reasons. First of all, the national
accounts usually do not explicitly involve the investments to R&D; second, the sector of R&D
included in the input-output tables does not capture all investments into Research and development.

Third and most important, the R&D activities are not capitalized properly in the CGE model to
stimulate the economic growth.
This paper investigates how results obtained with standard CGE models can be improved by
incorporating the effects of the R&D activities in a recursively-dynamic CGE model built for the
economy of the Czech Republic. The main objective of the paper is to quantify the impact of the R&D
activities on the long-term economic growth of the Czech Republic in the recursively dynamic CGE
framework. The paper is structured as follows: in the second section, a review of approaches to
modelling R&D investments in CGE models is provided, which is followed by the description of the
methodological approach applied in this paper. An overview of the expenditures on research and
development in the Czech Republic is provided in the fourth chapter. Fifth chapter includes the results
of the simulations. First of all, the economic growth predicted by a model with knowledge is compared
to a model without knowledge and the impact is also analysed concerning different initial knowledge
endowment levels. The second simulation concerns the efficiency of R&D investments, which is
compared to the efficiency of the physical investments. Finally, the model with knowledge is applied
to assess the impacts of an R&D stimulated shock on the economy. In particular, the impacts on GDP,
other macroeconomic variables and the value added are discussed.
Main findings show that knowledge accumulation can contribute to higher economic growth, but the
impact of the dynamisation in the CGE model is very low. However, in terms of structural changes in
the economy, the omission of knowledge capitalization might underestimate the tertiary sector in the
longer run. In the concluding chapter, the findings are put in perspective with the evidence of other
authors and related factors that may improve the impact of knowledge in the CGE model are
discussed.
2. Review of theoretical approaches for modelling R&D investments
The progress made in understanding the endogeneity of economic growth at the beginning of the
1990s raised the attention to incorporate the endogenous growth theories into the CGE models.
According to Zürn et al. (2007), Computable General Equilibrium (CGE) models are suitable to fulfil
the requirements on the instrument of the analysis regarding the sectoral, regional and chronological
dimension. This can be very useful considering that innovations are not restricted to certain industries
or certain areas of the economy but they include the economy as a whole. Furthermore, several authors
agree that the CGE models are especially appropriate for the top-down modelling of technical change
with a particular focus on the investments to R&D (Wang and Chen, 2006; Peace and Weyant, 2008).
One of the earliest contributions on implementing endogenous growth theory formalized by Romer
can be found in the work of Diao, Roe and Yeldan (1999) who incorporate imperfect competition and
forward-looking dynamization. As Gillingham, Newell and Pizer (2008) point out, “unfortunately,
theoretical models with continuous intermediate goods and abstract representations of blueprints are
not well-suited to match up to measurable real-world variables or technologies that most numerical
models attempt to represent”. Therefore, various recent practical applications of the R&D based theory

of economic growth have been performed in the recursively dynamic CGE framework. For instance,
Garau and Lecca (2009) estimate the impact of R&D subsidies on the region of Sardinia in a regional
CGE model with a recursive dynamization and perfect competition setting. The research and
development activities are incorporated through knowledge capital, which is treated as a specific
production factor. Contrary to original models, the authors also consider a depreciation of knowledge.
The main findings show that cross border spillovers could increase the long run rate of growth.
Yungchang et al. (2010) have applied an R&D-driven recursively dynamic CGE model to assess
whether the research and development should be financed by private or the public sector. The results
showed ambiguous findings; on one hand the public R&D investments have a positive effect on the
real wage, on the other hand they also bring certain negative crowding-out effects.
Endogenous growth theory based on the R&D has seen increasing applications in the field of climate
change modelling and environmental policy. The impacts of climate change can be mitigated via the
technological change brought by investments into the research and development, which can increase
the energy efficiency of the production. For instance Wang, Wang and Chen (2009) developed a
computable general equilibrium (CGE) model with an endogenous technological change for Chinese
climate change policy analysis. The technological change is introduced by creating a nested
production structure with knowledge capital derived from the R&D investments and other primary
factors (such as physical capital, labour or intermediate inputs) as imperfect substitutes on the highest
hierarchical level.
To add to the review of recent works, research on R&D investments and knowledge input has been
also carried out in the Institute of Energy Economics and Rational Use of Energy, Germany. Zürn et
al. (2007) applies global CGE model NEWAGE-W1 to estimate economic and environmental impacts
of R&D investments. The authors consider knowledge as a primary factor input into production
derived from the accumulation of the R&D investments, which are endogenously modelled as a part of
the utility maximization problem of the representative agent. Derived model is used for an interesting
application – to compare the efficiency of subsidizing direct knowledge, or R&D investments. Zürn et
al. (2007) shows that whereas direct input subsidy of knowledge provides benefits only from
knowledge reallocation, subsidizing investment to R&D is more efficient as it decreases relative price
of this activity as opposed to the alternatives of consumption and physical investment activity and it
leads to faster accumulation of knowledge.
Following recent approaches, this paper incorporates the R&D effects into the recursively dynamic
CGE model built for the economy of the Czech Republic. The necessity to construct a dynamic CGE
model for the Czech economy is supported by the fact that the Czech Republic as a small opened
economy is vulnerable to any external shocks that might have severe repercussions in longer time
horizons. For this reason, CGE models have gained popularity in the field of policymaking in the
Czech Republic, particularly in the field of natural resources and environment. In connection to
prepared environmental tax reform, the Czech ministry of environment has applied a dynamic CGE
1 (National European Worldwide Applied General Equilibrium Modeling System)
model for the quantification of environmental policy impact on macroeconomic aggregates (Pavel,
2008). The macroeconomic effects of the environmental taxation are further analysed in Ščasný, Píša,
Pollot et al. (2009) who apply structural macroeconometric E3M3 European model adjusted to the
Czech economy. In the structural equations, R&D investments to energetic sector are incorporated to
improve its energetic efficiency. Another CGE model applied in connection to natural resources is the
model developed at the Czech National Bank in cooperation with Netherlands Bureau of Policy
Analysis (Dybczak and van der Windt., 2008) which has been used for the predictions of the oil price
shocks effects on the Czech economy. Concerning fiscal policy, Hurník (2004) applies a non-
stochastic dynamic general equilibrium model to assess the impact of alternative fiscal consolidation
programs on the Czech economy.
Despite various uses and model alternatives as described above, the issue of R&D investments and
knowledge formation following the endogenous growth theory has not been sufficiently analysed in
the Czech Republic, at least not in the CGE framework. However, it should be noted that there is an
extensive research done on modelling the endogenous growth and knowledge accumulation using
other modelling approach, see for instance Kejak, Seiter and Vávra (2004) or Kejak and Vávra (2002),
who develop a two-sector endogenous growth model to assess the transitional behaviour after the EU
accession in the CEEC countries including the Czech Republic.
By explicit incorporation of knowledge as a production factor and R&D investments in the gross
capital formation this paper aims at contributing to the existing CGE model studies done in the Czech
Republic and to improve the understanding of the role of research and development activities in the
Czech economy. The description of the CGE model applied in this research, required data source for
the SAM construction and the main model modifications that incorporate investments to R&D are
described in the following chapter.
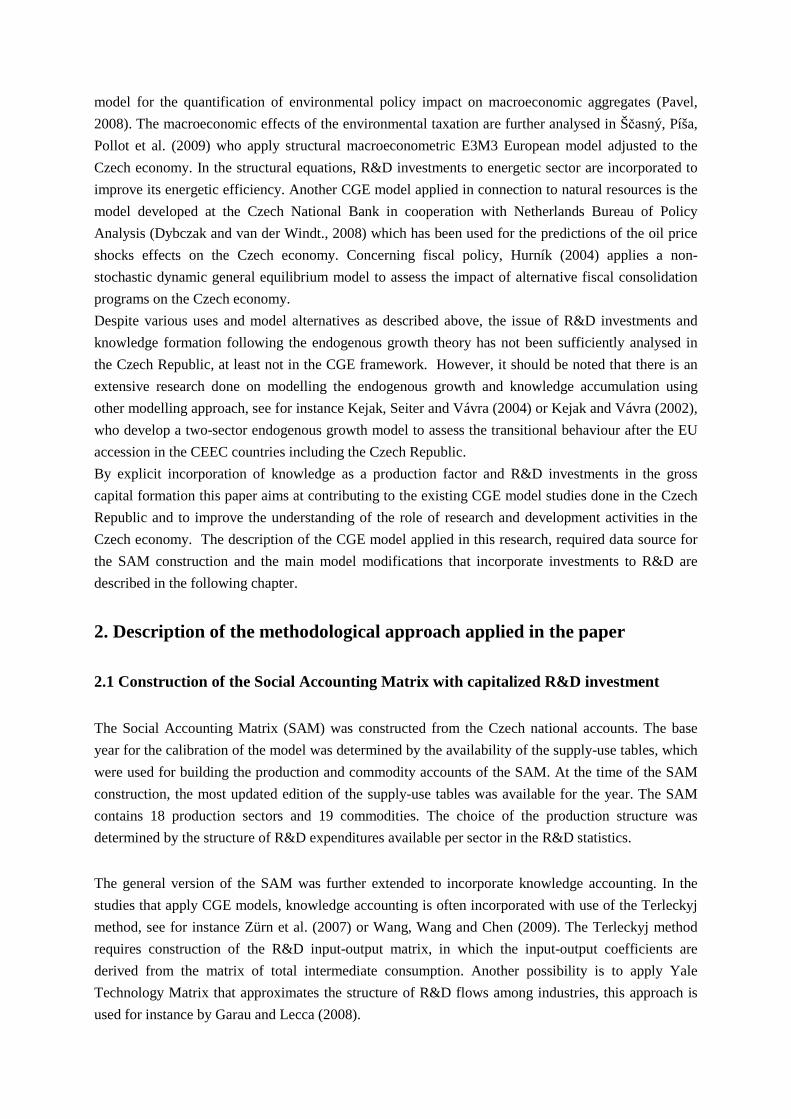
2. Description of the methodological approach applied in the paper
2.1 Construction of the Social Accounting Matrix with capitalized R&D investment
The Social Accounting Matrix (SAM) was constructed from the Czech national accounts. The base
year for the calibration of the model was determined by the availability of the supply-use tables, which
were used for building the production and commodity accounts of the SAM. At the time of the SAM
construction, the most updated edition of the supply-use tables was available for the year. The SAM
contains 18 production sectors and 19 commodities. The choice of the production structure was
determined by the structure of R&D expenditures available per sector in the R&D statistics.
The general version of the SAM was further extended to incorporate knowledge accounting. In the
studies that apply CGE models, knowledge accounting is often incorporated with use of the Terleckyj
method, see for instance Zürn et al. (2007) or Wang, Wang and Chen (2009). The Terleckyj method
requires construction of the R&D input-output matrix, in which the input-output coefficients are
derived from the matrix of total intermediate consumption. Another possibility is to apply Yale
Technology Matrix that approximates the structure of R&D flows among industries, this approach is
used for instance by Garau and Lecca (2008).

Parallel to the efforts of the CGE modellers to incorporate knowledge into SAM, there has been a
continuous progress of the Statistical Offices to properly capture the effects of Research and
Development in National Accounts. Following the SNA 1993 revision, the expenditures on R&D will
no longer be considered as a part of intermediate consumption (in case of private research) or
governmental consumption (in case of public research), but as a component of the gross fixed capital
formation. This process is commonly known as capitalization of Research and Development in the
SNA. As a part of the revision, the whole concept of the Research and Development is redefined.
Whereas the current version of SNA considers R&D predominantly as “activity carried out with the
aim to increase efficiency, productivity and future benefits” which is closely related to the concept
innovation, the definition of OECD included in the Frascati manual2 is broader – “R&D is a creative
work undertaken on a systematic basis in order to increase the stock of knowledge including
knowledge of man, culture society and the use of this stock of knowledge to devise new applications “
(OECD, 2003).
All the EU-member state Statistical offices are obliged to adopt the 1993 SNA/1995 ESA Revision
involving the R&D capitalization until 2014. Basically, there are two sources of data that can be used
for this R&D capitalization. First of all, R&D activity is recorded within the supply-use tables under
the NACE 72 production sector; however, this sector does not represent all R&D activities as it
excludes research carried out as a complementary activity in the departments of private businesses and
public institutions. The second R&D source can be obtained from the surveys based on Frascati
manual, which comprehensively captures all research activities in the domestic economy; however, it
is not fully consistent with the National Accounts. Thus, the process of capitalization requires
harmonizing the two data sources. Bridge tables that translate Frascati manual data (FM) to National
Accounts (SNA) are described in various sources, for instance see de Haan and van Rooijen-Horsten
(2004) for Netherlands, Salem and Siddiqi (2006) for Canada, Galindo-Rueda (2007) for UK, Robbins
for Australia (2005) and Daniels (2007) for Sweden. In this research, the Frascati manual data were
translated to the SNA format using bridge tables described in Ptáčková (2007) specifically for the
Czech Republic.
The SAM extension involved various steps. At first, private and public expenditures on R&D carried
out in the Czech Republic were obtained from the Frascati surveys for 2008 published by the Czech
Statistical Office (CSO, 2011). Consequently, Gross R&D production separately for private and public
research was derived following Equation 1, as for the public R&D production, operating surplus was
excluded. According to Equation 1, in order to derive values of R&D production consistent with SNA,
it is necessary to add depreciation and profit to the R&D expenditures obtained from the Frascati
surveys. As these components are normally not available, they must be estimated. In this case, the
depreciation of the R&D sector was estimated based on calculations made by the Czech Statistical
2 Frascati Manual contains proposed standard practice for surveys of Research and Development as initially agreed during OECD national R&D experts meeting in Frascati, Italy, 1963. The newest – sixth edition– was released in 2002.

Office (see Ptáčková, 2007). The operating surplus was estimated with use of the profitability ratio of
the R&D sector in the SNA, assuming thus that all R&D activities have a uniform profitability rate
approximated by the sector NACE 72. Net taxes on production were estimated as a sum of net taxes
paid by NACE 72 sector and the subsidies granted to private R&D sector by public sector, obtained
from the Frascati surveys.
R&D Gross production = Labour costs (FM) + Other current expenditures (FM) + Intermediate
consumption of R&D commodity by R&D sector (SNA NACE 72) + Consumption of Gross Fixed
Capital (estimate) + Operating Surplus (estimate) + Net taxes on production (estimate) – R&D
expenditures on Software (FM). (1)
The values of the R&D expenditures obtained from the Frascati manual and the translation to the SNA
is displayed in Table 1. Table 1 shows that harmonizing the Frascati manual data with SNA increases
R&D estimates by about 20%. Even stronger discrepancy is found out when comparing the R&D data
obtained from Frascati with the R&D values reported in the current version of SNA. As reported in
Figure 1, the gross production of R&D sector reached CZK 18 bln. in 2008, however, the surveys
from Frascati manual reported expenditures in the amount of CZK 53 bln. After harmonizing with
SNA standards, the final value of gross R&D production reaches CZK 65 bln., being more than 2.5
times higher than the original values in the supply-use tables. These results confirm that in the current
version of National Accounts, the size of the R&D sector is significantly underestimated. Therefore,
the SAM derived from the current SNA should be properly modified in order to avoid this bias.
Table 1: Estimation of Private R&D Gross Production (CZK mln.)
Private Research and
Development
Public Research and
Development
Domestic production of R&D commodity
Frascati
Manual
SNA
Modification
Frascati
Manual
SNA
Modification
Current Expenditures 30, 073 30 ,621 17, 875 18,210
Labour expenditures 12, 680 12, 680 9, 096 9, 096
Other expenditures 17, 393 17 ,941 8 ,779 9, 113
Capital expenditures 3, 413 2, 539
Land, buildings and constructions 490 973
Machinery, equipment, incl. software 2, 923 1, 566
Gross capital consumption 12,636 7, 511
Operating surplus 2,493
Taxes and subsidies on production -3,581
Software development 2,681
Gross domestic production 33, 486 39,487 20, 415 25,721
Source: author’s calculations

Figure 1: Comparison of total R&D gross production reported in SNA
and Frascati Manual in 2008 (mln. CZK)
17,956
53,901
65,208
0
10,000
20,000
30,000
40,000
50,000
60,000
70,000
SNA NACE 72 Frascati Manual SNA Modification
Source: author’s calculations
After obtaining a reliable size of the R&D domestic production, the balance of private and public
R&D commodity was calculated, based on equation 2. The split between public and private
commodity in case of imports and indirect taxes was performed based on their share in the domestic
production.
Total R&D resources = Total gross domestic R&D production (estimation above) + R&D imports
(SNA NACE 72) + indirect taxes (SNA NACE 72) (2)
Finally, the gross fixed capital formation (GFCF) of both R&D commodities was derived, following
equation 3:
R&D GFCF = Total R&D resources (estimated above) – R&D exports (SNA NACE 72) –
Intermediate consumption of R&D commodity by R&D sector (SNA NACE 72) – R&D stocks (SNA
NACE 72). (3)
Having obtained values of the gross R&D capital formation, its incorporation to the SAM was
performed. Technically, there are two ways of SAM modification:
���� Alternative of disaggregation: In the commodity account, investments to R&D are subtracted
from the intermediate consumption and added to the account of Gross fixed capital formation.
In the production account, the reduction of intermediate consumption is compensated by
increase of value added, which is attributable to knowledge. This is the principle of the
methods mentioned above, applied in Zürn et al. (2007) or Wang, Wang and Chen (2009).
���� Alternative of imputation: In this alternative, the investments to R&D are also newly
incorporated into the gross fixed capital formation account, but in order to maintain the
balance in the commodity account, the compensation is done via increase of domestic
production in the supply table. The advantage of this method is that it leaves the matrix of
intermediate consumption unchanged and omits the bias caused by an inaccurate estimation of
the input-output R&D flows.

It must be noted that both methods lead to an increase of GDP compared to the original state, from the
expenditure side it is attributed to the increase of investments, from the production side it is caused by
growth of value added3.
In this paper, the method of imputation was chosen, which is also in line with the preference of the
Czech Statistical Office. After the incorporation of R&D investments into the Gross capital formation
account, the gross production in each sector was increased proportionally. This increase was translated
partially to value added in form of knowledge and partially to the consumption of gross fixed capital.
Consequently, knowledge income was redistributed to households, firms and government in the
proportion of total capital income and further fully transmitted to the savings account. The impact of
the capitalization on the SAM is recorded in Figure 2, which displays a percentage change of gross
value added after the capitalization per sector. The strongest increase of value added is noticed in the
R&D sector (+31%), which participates significantly in the total R&D expenditures. However, value
added is also elevated in other sectors of the economy, mainly in car industry (+16%), education
(+8%), ICT, chemical and pharmaceutical sector (+6%). The effect on total gross value added is 1.7%
which gives the idea of the impact of R&D capitalization on the GDP.
Figure 2: Impact of R&D capitalization in the modified SAM on gross value added per sector
(% change against the original SAM)
0.0%
0.0%
0.1%
0.2%
0.2%
0.3%
0.4%
0.5%
0.5%
0.6%
0.9%
1.0%
1.7%
4.1%
5.8%
6.0%
8.4%
15.5%
31.0%
0% 5% 10% 15% 20% 25% 30% 35%
Transport
Electricity, gas and w ater
Agriculture, f ishing and forestry
Mining
Construction
Commerce, Accomodation and catering
Food and tobacco industry
Other services
Health and social care
Post and telecommunications
Banking and insurance
Other processing industry
Total economy
Machinery and equipment industry
Chemical and pharmaceutical industry
Actitivities in ICT
Education
Car industry
Research and Development
Source: author’s calculations
3 Furthermore, it should be added that for the public R&D commodity, the incorporation of public R&D expenditures to the gross fixed capital formation account should be accompanied with proportional reduction of the governmental consumption, as non-market R&D expenditures already included in the SNA.

The final SAM after capitalization is a matrix of 54x54 size. Compared to the original version, it is
extended for following accounts: (i) account of gross R&D investments, (ii) account of knowledge as a
new production factor in the value added per each production sector and (iii) account of knowledge
depreciation per each production sector.
2.2 Description of the CGE model with knowledge and R&D investments
In this research, national CGE model of the Czech economy built by the author is applied. The
production side of the economy is modelled following a standard CGE model structure (see Lofgren,
2002) and is described in detail in Křístková (2010,a). The model assumes that the total gross
production is a fixed factor Leontief combination of intermediate consumption and value added under
perfect competition and constant returns to scale, which can be expressed by a nested production
structure. Consumption behaviour of households is modelled with use of Stone-Geary utility function,
leading to the Linear Expenditure System.
Total supply in the market is represented by a composite commodity consisting of the bundle of
domestically produced goods supplied to domestic markets and imports. The composite commodity is
a result of two simultaneous forces in the model, first the intention of producer to find the most
profitable combination of supply between foreign and domestic markets, modelled with a Constant
Elasticity of Transformation (CET) function, and the intension of the consumer to find an optimal
combination of imported and domestically produced commodity, modelled with a CES Armington
function. Two non-domestic institutions are disaggregated between the EU and the Rest of the World
(RoW).
The CGE model considers six closure and factor market assumptions: i) supply of labour and land is
fixed; capital stock grows at the rate of net investments; ii) labour unemployed is allowed and
determined by the Phillips curve; iii) the model follows a standard macroeconomic balance of savings
and investment; iv) the closure of the governmental account is arranged by fixing a ratio of
governmental consumption to GDP; v) export and import prices are fixed; vi) both foreign sector
closures (for the EU and the RoW) assume fixed foreign savings and endogenously adjusting
exchange rates.
Several modifications were made to the original structure of the model in order to incorporate the
effects of research and development. First of all, as knowledge is regarded as a new production factor,
it must be incorporated into the production structure of the CGE model. Different alternatives can be
considered, which are mainly related to the role of knowledge in technological progress. In general,
the technological progress can increase productivity of capital, in this case it is regarded as Sollow
type of technological progress, or it can increase productivity of labour, i.e. the Harrod technological
progress. The technological process can also contribute to productivity growth of both production
factors, which is attributed to Hicks type of the technological progress. In case of knowledge, all
alternative ways of incorporating technological progress can be found in the CGE models. The
original work of Romer (1990) considers knowledge as a Harrod type, nevertheless the arrangements

of the Sollow type where knowledge is considered as a substitute of physical capital can be found in
other works too, see for instance Youngchan et al. (2010).
In this paper, Hicks type of technological progress is chosen for incorporation of knowledge. As
Gillingham, Newell and Pizer (2008) point out, “a Hicks-neutral knowledge stock is a common choice
for numerical models that include an economy-wide production function”, which is supported for
instance by Zürn et al. (2007) or Wang, Wang and Chen (2009) who adopt the same approach. By
incorporating knowledge following the Hicks-neutral technological progress it is assumed that with
increasing stock of knowledge, the productivity of all other production factors increases, which means
that with more knowledge there is less labour and capital required. Even though there is no sufficient
empirical evidence that could support the choice of this arrangement, this seems to be the most
plausible option with respect to the neutrality of knowledge in this type of technological progress and
with respect to its common adoption by other authors.
Scheme 1: Nested production structure used in the CGE model
The nested production structure used in the CGE model is provided in Scheme 1. On the higher level
of the nest, the value added is a combination of knowledge and capital-labour bundle using CES I
production function. Due to lack of empirical evidence, the elasticity of substitution between
knowledge and capital-labour was chosen σH = 2.0, which is close to Wang Wang and Chen (2009)
who apply σH = 2.5. On the lower nest, split between capital and labour is determined by the demand
equations derived from the CES II production function. The substitution elasticities between capital
and labour were taken over from the GTAP estimates (Dinamaran, 2006).
Instead of modelling R&D within a uniform representative production sector, it is assumed that all
production sectors carry out a complementary research activity, which is further distinguished between
private and public R&D. In this way, the R&D commodity has a role of a by-product, respecting cost
structure of each industry. As for the private commodity, the R&D production can be directly
determined from the surveys. In case of public commodity, it is not directly attributable per production
sector, but it can be derived based on the type of institution where the research is carried out. In this
work it is assumed that the research carried out for instance under the Ministry of Agriculture directly
stimulates knowledge in agriculture, analogically for other resort research. In case of the research
performed by the Czech Academy of Sciences, knowledge is attributed directly to the sector of R&D.
Value added i
Knowledge i Capital – Labour i
Capital i Labour i
CES I
CES II

Figure 3 shows the participation of each sector in production of both public and private R&D
commodities. It can be noted that there are four production sectors that are important in producing
public R&D commodity, which are the sectors of R&D itself, the sector of education, health care
sector and other services sector that involves activities of public administration, museums and
libraries. Majority of research is however performed in the private sector (60%), with the domination
of car and other processing industry. From the tertiary sector, ICT, banking and commerce are mostly
active in private research.
Figure 3: Production of R&D commodities per sector (mln. CZK)
3,984
4,518
7,953
9,630
5,329
11,090
13,151
1,699
2,143
1,084
1,006515
483
405
373
118
6
81
97
64
1,117
0 5000 10000 15000 20000
Transport
Electricity, gas and water
Mining
Agriculture, fishing and forestry
Food and tobacco industry
Construction
Health and social care
Post and telecommunications
Commerce, Accomodation and catering
Banking and insurance
Chemical and pharmaceutical industry
Other services
Actitivities in ICT
Other processing industry
Machinery and equipment industry
Car industry
Education
Research and Development
Private R&Dcommodity
Public R&Dcommodity
Source: author’s calculations
Further modification to the original model was carried out in the investment function. Total
investment resources (INVRES), which are determined by total savings and depreciation are distributed
between physical investments (INVT) and R&D investments (INVTRD) on the basis of the Cobb-
Douglas investment function, which maximizes bank’s investment utility subject to available
investment resources. Derived investment demand functions are displayed in equation 4 and 5. The
choice between investing in R&D or capital goods is determined by the total investment resources and
corresponding prices. PINVT and PINVTRD represent weighted average prices of both types of
investments, calculated from the composite commodity prices. Parameters αINVT and αINVT are
calibrated from the equation and represent a share of the respective investment type in total investment
resources. In the benchmark period (2008) the parameters are αINVT = 0.93 αINVT= 0.07, showing a
negligible share of R&D investments in total investment resources. In the following step, the demand

for individual investment goods is determined on the basis of fixed coefficients, calibrated from the
SAM.
PINVT
INVRESINVT INVT ⋅
=α
(4)
PINVTRD
INVRESINVTRD INVTRD ⋅
=α
(5)
The allocation of investments into the production sectors is crucial for capturing the R&D effects in
future periods. The CGE model follows a recursive form of dynamization, which is fully described in
Křístková (2010,b). The investment allocation function is modelled following the Tobin’s Q
specification as used by Lemelin or Thorbecke: ISδ
γ
=USCi
RKi
KSi
ISii (6)
where ISIi is the physical investment allocation per sector, KSi is capital stock per sector, and (RKi /
USCi) is the Tobin’s Q ratio where RKi represents the return to capital and USCi are the respective user
costs per sector. γi is a calibrated distribution parameter of the investment function, and parameter σIS
is the elasticity of substitution which indicates the response of investments to the change in the
Tobin’s q value.
Equation (7) specifies that the proportion of new investment allocation to the capital stock in each
sector (ISIi/KSi) is determined by the ratio of the return to capital and the respective sector’s user cost
of capital. Tobin’s Q theory indicates that if the Q ratio > 1, the particular sector will attract new
investments since the expected profit from unit of capital exceeds its costs, whereas if Q ratio <1, there
are pessimistic conditions for attracting new investments.
The allocation of R&D investments per sector (ISRDi) is arranged analogically to the physical
investments: ISδ
γ
=USCRDi
RHi
HSi
ISRDii , (7)
where HSi represents knowledge stock per sector i, RHi is the return to knowledge in the respective
sector, USCRDi are user costs of R&D capital. It is assumed that the elasticity of substitution is equal
in both Tobin Q functions and reaches value σIS = 2.5 4.
The calculation of return to capital follows the classical Return on Capital (ROC) calculation which is
adopted on the sector level:
i
iiiiiiii KS
HSPHLpldiffPLVAPVARK
⋅−⋅+−=
)1.(., (8)
where PVAi is the price of net value added in the i-th sector, VAi is net value added of the i-th sector,
PLi.(1+pldiffi) is the price index of labour adjusted for sector wage difference, Li is the number of
employees per sector i-th sector, HSi and PHi are stock of knowledge and knowledge price index
respectively. The return to knowledge is calculated analogically.
4 For more discussion on the value of the Tobin Q elasticity and the corresponding sensitivity analysis see Křístková (2010, b).

The modified version of the CGE model contains two dynamic equations, which provide link between
the amount of capital and knowledge stock in the current and following periods:
titiiti ISKSsdepKS ,,1, ).1( +−=+ , (9)
titiiti ISRDHSsdepHHS ,,1, ).1( +−=+ (10)
Equation 9 indicates that the amount of capital stock in the current period is determined by the
depreciated amount of capital stock in the previous period, raised by the physical investments.
Analogically, the stock of knowledge in the current period is determined by net R&D investments
carried out in the previous period (equation 10).
2.3 Scenario definition
The modifications introduced into the CGE model enable now to properly address the impact of R&D
investments on the Czech economy. More specifically, following research questions will be analysed:
1. What is the impact of the knowledge stock accumulation on the predicted economic growth in
the Czech Republic?
2. What is the efficiency of R&D investments compared to physical investments?
3. What would be the impact of a potential increase of EU policy driven R&D investments on
the macroeconomic behaviour and structural changes in the Czech economy?
In order to response the first research question, the CGE model was used in two different settings. In
the first setting that represents Model without knowledge, the economy grows only on basis of the
physical stock accumulation, which means that the dynamic knowledge stock equation (10) is
excluded from the model. The results of this model represent a provisional baseline, against which the
economic growth derived from the Model with knowledge that incorporates the dynamic knowledge
stock equation (10) is compared. The second and the third research questions are analysed only within
the Model with knowledge. Concerning the efficiency of R&D investments, the impact of different
investment mix on the GDP is analysed. The third research question investigates the impact of R&D
stimulating shock on the economy, induced by the EU policy aiming at supporting the expenditures on
research and development.
3. Overview of Research and Development expenditures in the Czech
Republic
In this section, an overview of the total expenditures on research and development in the past 10 years
is presented. This analysis is based on data provided by the Frascati manual surveys carried out by the
Czech Statistical Office.

3.1 Overview of total Gross Expenditures on Research and Development
The overview of total R&D expenditures and their structure according to the performing sector
provides Figure 4. In 2000, total gross expenditures (GERD) represented CZK 26 bln and at the end of
the analysed period, GERD reached CZK 55 bln, which is a two-fold increase. Also, the share of R&D
expenditures in GDP grew from 1.2% to 1.5%. It can be noted, that within 2007-2009, private research
stagnated, which can be attributed to the economic and financial crisis. Such development is not
observed in case of public research, where the increasing trend continued. Observing the structure of
R&D expenditures, it can be observed that private GERD participate in total R&D expenditures with a
stable share of 60%.
Figure 4: Overview of Gross R&D expenditures per performing sector (CZK mln.)
15,882 17,052 18,051 19,668 21,901 26,657
32,470 33,620 33,486 33,218 6,707 6,714 6,787
7,525 7,868
8,441
9,309 11,306 11,325 11,836
3,764 4,437 4,619 4,922
5,181
6,907
7,918 9,158 9,090 10,022
26,487 28,337 29,552
32,247 35,083
42,198
49,900 54,284 54,108
55,350
0
10,000
20,000
30,000
40,000
50,000
60,000
2000 2001 2002 2003 2004 2005 2006 2007 2008 2009
GERD Private GERD Government GERD Universities GERD NGO GERD Czech Republic
Data source: CZSO, Frascati Manual
Another point of view on the development of R&D expenditures provides Figure 5 where R&D
growth rates are compared with growth rates of GDP and Gross Investments. Periods of excessive
growth of R&D expenditures are noticed between 2002-2003 where GERD exceeded GDP growth by
4 percentage points and in the period 2004-2006, when R&D growth was even more than 10
percentage points above GDP growth. This development can be attributed to the accession of the
Czech Republic to the European Union in 2004. Observing growth of expenditures before and after the
EU accession, the highest increase can be attributed to university research (80% compared with pre-
accession level), whereas the lowest increase occurred in case of the governmental research (47%).
Private and NGO research was stimulated after EU accession by 72%.

Figure 5: Growth rates of GERD, GDP and Gross Fixed Capital Formation (calculated from current prices)
7%
4%
9% 9%
20%18%
0%
7%
5% 4%
-2%
8%
3%1%
6%
2%
7%2%
9%
10%8%
6%
9%
5%
-8%
-1%
12%
-10%
-5%
0%
5%
10%
15%
20%
25%
2001 2002 2003 2004 2005 2006 2007 2008 2009
GERD growth rate GDP growth rate GFCF growth rate
Data source: CZSO
3.2 Activities and areas of R&D
Another point of view on the expenditures on R&D provides Figure 6, where different R&D activities
are demonstrated. In 2000, more than 50% of total GERD was devoted to experimental research.
During the analysed period, the share of experimental research slightly decrease (45% in 2009), but it
still represents the most important research area. Contrary to that, the basic research has seen an
increasing share in total expenditures; whereas in 2000 basic research formed only 23% of GERD, in
2009 it was 31% and exceeded the participation of applied research, which remains at 25% share. This
development is closely related to the increasing activity of universities within the total research and
development.
Figure 6: Activities of Research and Development (CZK mln.)
6,181 7,092 7,181 8,095 9,251 11,952 14,630 16,152 16,288 16,918 6,694 7,085 8,320 9,662 9,992 11,123
12,011 13,803 14,350 13,310
13,612 14,159 14,052
14,489 15,839
19,123
23,259 24,329 23,470 25,122
0
10,000
20,000
30,000
40,000
50,000
60,000
2000 2001 2002 2003 2004 2005 2006 2007 2008 2009
Basic research Applied research Experimental research
Data source: CZSO, Frascati Manual
According to the Frascati survey, it can be further stated that a substantial part of the R&D in the
Czech Republic is performed in the area of technical sciences (almost 60%) (Figure 7). Other areas are

less significant, however it can be noted that after the EU accession in 2004, expenditures in medical
and social sciences are growing faster.
Figure 7: Areas of Research and Development (CZK mln.)
15,621 17,037 16,999 18,577 19,632 24,566 27,240
31,022 31,368 31,276 6,619 6,551 7,724
7,778 8,777
9,845 10,991
13,755 12,788 13,512
1,835 1,789 1,864 2,398
2,940
3,374
6,894
4,303 4,343 4,996
0
10,000
20,000
30,000
40,000
50,000
60,000
2000 2001 2002 2003 2004 2005 2006 2007 2008 2009
Technical sciences Natural sciences Medical sciences Social sciences and humanities Agricultural siences
Data source: CZSO, Frascati Manual
3.3 R&D in international comparison
Figure 8 provides a comparison of GERD share in GDP among selected European countries and
countries of OECD. From the group of countries, Finland reaches the highest share of R&D
expenditures (3.7%), which is double compared to Czech Republic (1.47%). Other EU-15 countries
report higher share as well, such as Germany (2.6%) or France (2.15%). The average EU-27 level is
still above the Czech Republic (1.81%), even larger is the gap with the average OECD standard
(2.3%). However, comparing to other newly accessed EU countries such as Hungary and Poland, the
GERD expenditures in the Czech Republic are relatively high.
Figure 8: Share of GERD in GDP in selected countries
3.35
2.452.19 2.15
1.74 1.82
1.21
0.790.64
3.73
2.64
2.33
2.021.81 1.75
1.47
1.00
0.61
0.00
0.50
1.00
1.50
2.00
2.50
3.00
3.50
4.00
Finland Germany OECD France EU 27 Netherlands CzechRepublic
Hungary Poland
2000 2008
Data source: CZSO, Frascati Manual

4. Simulation results
4.1 Impact of R&D capitalization on the dynamics of economic growth
In this chapter, the effect of knowledge accumulation driven by the R&D investments on the dynamics
of the economic growth is investigated. For this purpose, two models - one which includes knowledge
capitalization and one in which knowledge is omitted - are analysed and their macroeconomic
behaviour compared.
According to the endogenous growth theory, it is expected that the inclusion of knowledge will have a
positive impact on the economic growth. This hypothesis is confirmed observing development of
nominal GDP values in the two respective models (Figure 9). However, due to the inclusion of the
R&D investments into GDP in the initial period, the benchmark equilibrium states in the two models
slightly differ. Therefore, it is not possible to fully compare the two GDP indicators in their nominal
values, rather to assess their relative performance in form of growth rates.
Figure 9: Comparison of nominal GDP (CZK bln., c.p.) in models with and without knowledge
3,6893,626
3,670 3,718
4,0174,130
4,254
4,382
4,513
4,648
4,785
4,925
5,068
3,683 3,7273,776
3,974
4,174
4,347
4,485
4,625
4,769
4,915
5,065
5,217
3,747
3500
3700
3900
4100
4300
4500
4700
4900
5100
5300
5500
2008 2009 2010 2011 2012 2013 2014 2015 2016 2017 2018 2019 2020
Model w /o know ledge Model w ith know ledge
Source: author’s calculations GDP growth rates of both models are presented in Table 2. The development of GDP growth is
affected by the financial and economic crisis; in 2009 GDP declines by 4%, followed by a slow
growth in years 2010 and 2011. From 2012, the model without knowledge reports higher GDP growth
rates, but the dynamics of the model is soon slowed down. Contrary to that, GDP growth rates in
model with knowledge report lower revival in 2012 but already from 2013, they exceed growth rates
from model without knowledge.
Table 2: GDP growth rates of both models
t 2009 2010 2011 2012 2013 2014 2015 2016 2017 2018 2019 2020 Average
Model w/o knowledge -4.20% 2.30% 1.90% 5.27% 1.24% 1.19% 1.20% 1.19% 1.17% 1.15% 1.12% 1.09% 1.71%
Model with knowledge -4.20% 2.30% 1.90% 2.54% 3.43% 2.31% 1.37% 1.31% 1.29% 1.26% 1.23% 1.19% 1.83% Source: author’s calculations
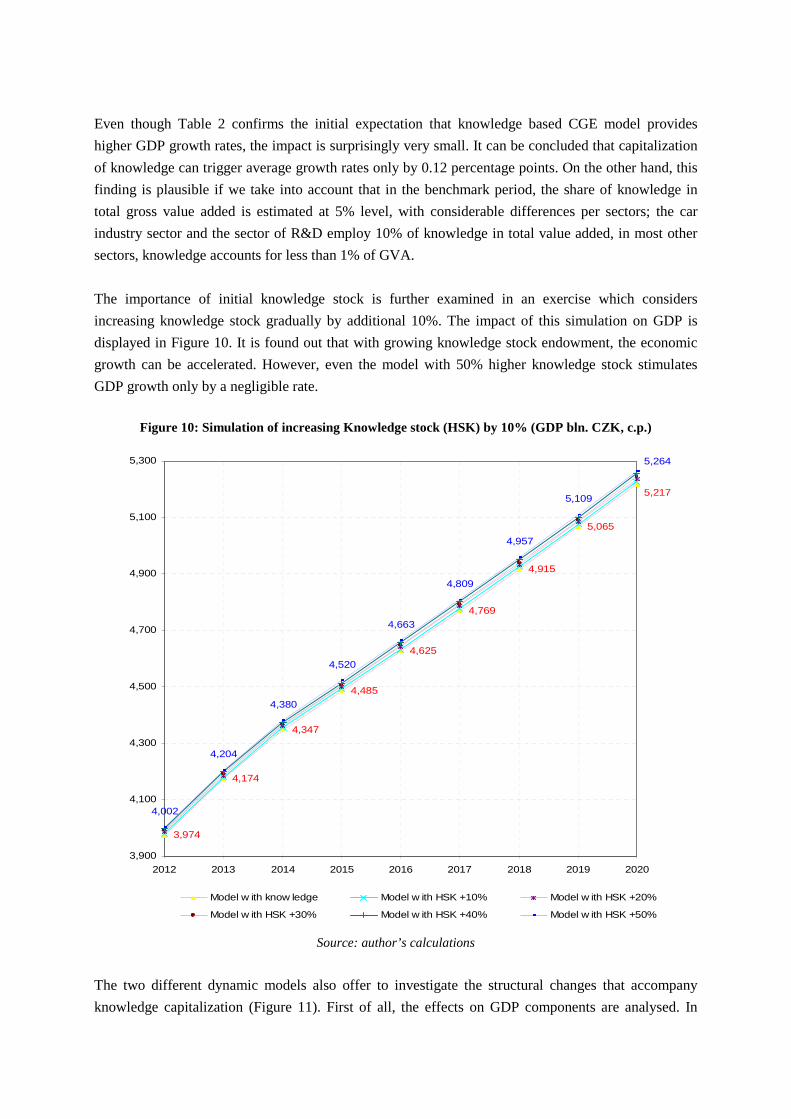
Even though Table 2 confirms the initial expectation that knowledge based CGE model provides
higher GDP growth rates, the impact is surprisingly very small. It can be concluded that capitalization
of knowledge can trigger average growth rates only by 0.12 percentage points. On the other hand, this
finding is plausible if we take into account that in the benchmark period, the share of knowledge in
total gross value added is estimated at 5% level, with considerable differences per sectors; the car
industry sector and the sector of R&D employ 10% of knowledge in total value added, in most other
sectors, knowledge accounts for less than 1% of GVA.
The importance of initial knowledge stock is further examined in an exercise which considers
increasing knowledge stock gradually by additional 10%. The impact of this simulation on GDP is
displayed in Figure 10. It is found out that with growing knowledge stock endowment, the economic
growth can be accelerated. However, even the model with 50% higher knowledge stock stimulates
GDP growth only by a negligible rate.
Figure 10: Simulation of increasing Knowledge stock (HSK) by 10% (GDP bln. CZK, c.p.)
3,974
4,174
4,347
4,485
4,625
4,769
4,915
5,065
4,002
4,204
4,380
4,520
4,663
4,809
4,957
5,1095,217
5,264
3,900
4,100
4,300
4,500
4,700
4,900
5,100
5,300
2012 2013 2014 2015 2016 2017 2018 2019 2020
Model w ith know ledge Model w ith HSK +10% Model w ith HSK +20%
Model w ith HSK +30% Model w ith HSK +40% Model w ith HSK +50%
Source: author’s calculations
The two different dynamic models also offer to investigate the structural changes that accompany
knowledge capitalization (Figure 11). First of all, the effects on GDP components are analysed. In

2008, the structure of GDP is almost identical in both models. In the process of knowledge and capital
accumulation, the structure of GDP is slightly changed. In 2020, model with knowledge has higher
share of investments and net exports compared to model without knowledge. It can be concluded that
including knowledge into the capital formation reduces the share of final consumption on account of
investments.
Figure 11: Impact of model dynamisation on GDP components
48.2% 48.2% 47.7%
20.7% 20.7%
26.7% 26.7%29.9%
48.9%
17.2%21.2%
25.3%
5.3%4.5%4.5%4.6%
-2%
8%
18%
28%
38%
48%
58%
Model w /o know ledge Model w ith know ledge Model w /o know ledge Model w ith know ledge
2008 2020
CONSUMPTION GOVCONS INVESTMENT NETEXPORT
Source: author’s calculations
The impact of different dynamisation forms compared in this paper is also analysed with respect to
structure of the economy. In the developed economies, the share of primary sector (agriculture and
mining) and secondary sector (processing industry and construction) is less significant compared to
the tertiary sector represented by services such as banking and commerce. In the most developed
economies, the accent is also put on the quaternary sector, which represents knowledge economy. This
sector includes education, health care, research and development and governmental services.
Figure 12: Structural changes in the economy under both types of models
4.8% 4.7% 4.7% 4.7%
36.0% 37.8% 38.4% 36.3%
30.6% 30.5% 30.0% 30.3%
28.6% 27.1% 26.9% 28.7%
0%
10%
20%
30%
40%
50%
60%
70%
80%
90%
100%
2008 2020 2008 2020
Model w /o know ledge Model w ith know ledge
Primary Secondary Terciary Quaternary
Source: author’s calculations Figure 12 shows how this structure develops over time under the two dynamic models. In case of
model without knowledge, the share of quaternary services slightly declines in favour of the secondary
sector. This is attributed to high representation of industrial goods in total investments. In particular,
the construction sector produces 50% of investment commodities, 23% is produced in the machinery
and equipment sector. On the other hand, in the model with knowledge, the tertiary and quaternary

services increase their share in value added at the expense of the secondary sector. This leads to the
conclusion that the CGE models which omit knowledge in their dynamisation slightly overestimate
growth of secondary sector over time, at the expense of services.
4.2 The efficiency of R&D investments vs. Physical Investments
The last finding on the positive effect of knowledge accumulation on the structure of the economy
leads to investigate another issue which is the efficiency of R&D investments. Hence, would it be
more desirable to invest to R&D commodities such as innovations, patents or research papers instead
of investing to capital goods such as constructions or machinery? Following simulation examines this
issue by varying the Cobb-Douglas parameter that indicates the share of R&D investments in total
investment resources. It should be pointed out, that in this exercise the increase of R&D investments is
at the expense of physical investments in order to maintain equilibrium between total investment
resources and their use. The results of the simulation are provided in Figure 13.
Figure 13: Static effects of different R&D investment shares on GDP (bln. CZK, c.p.)
3,744
3,745
3,747
3,748
3,7483,749
3,749 3,7493,748
3,748
3,747
3,743
3,744
3,745
3,746
3,747
3,748
3,749
3,750
Alpha IRD =0.05
Alpha IRD =0.06
Alpha IRD =0.07
Alpha IRD =0.8
Alpha IRD =0.9
Alpha IRD =0.10
Alpha IRD =0.11
Alpha IRD =0.12
Alpha IRD =0.13
Alpha IRD =0.14
Alpha IRD =0.15
Source: author’s calculations
The benchmark GDP level reaches CZK 3,747 bln, corresponding to Alpha IRD equal to 0.07. Figure
13 clearly demonstrates that a small increase of parameter alpha IRD and thus of the share of R&D
investments can have a positive effect on GDP. GDP continues to grow until it reaches a peak after
which too excessive level of R&D investments can be harmful for the economy. It can be noted that
the peak is exactly in the point that corresponds to the OECD level of R&D investments, measured as
a percentage of GDD. On the other hand, if the parameter Alpha IRD is reduced, a slight decline in
GDP can be expected.
Nevertheless, it is maybe more useful to analyse the efficiency of the R&D investments in the longer
run, and see if the static results hold also in the dynamic model. According to Figure 14, any increase
Actual share Share of R&D investments corresponding to OECD

of R&D investment share in the long run causes a decline of GDP. Therefore, there is a certain
contradiction between results of static and dynamic model. Whereas in the static model, certain
increase of R&D share can be positive for the economy, in the long run, any positive deviation from
this share can cause a GDP decline. The extreme case of AlphaIRD parameter reaching 0.15 shows
that GDP in 2020 would be 2.6 % points bellow baseline. Another extreme case is considered with
Alpha IRD= 0.04 in which the share of R&D investments is reduced5. In this case, GDP can reach
0.5% points more than baseline.
Figure 14: Dynamic effects of different R&D investment shares on GDP
Percentage deviation from baseline – AlphaIRD =0.07
-0.1% -0.1% -0.1% -0.1%0.1% 0.1% 0.2% 0.2% 0.3% 0.3% 0.4% 0.4% 0.5%
0.0% 0.0% 0.0% 0.0%
-1.0%-1.2%
-1.4%-1.6%
-1.8%-2.0%
-2.2%-2.4%
-2.6%-3.00%
-2.50%
-2.00%
-1.50%
-1.00%
-0.50%
0.00%
0.50%
1.00%
2008 2009 2010 2011 2012 2013 2014 2015 2016 2017 2018 2019 2020
Alpha IRD = 0.04 Alpha IRD = 0.05 Alpha IRD = 0.06 Alpha IRD = 0.07 Alpha IRD = 0.8 Alpha IRD = 0.9
Alpha IRD = 0.10 Alpha IRD = 0.11 Alpha IRD = 0.12 Alpha IRD = 0.13 Alpha IRD = 0.14 Alpha IRD = 0.15
Source: author’s calculations
This contradictory finding requires analysing the cause of the GDP decline under changing
proportions of investments in favour of R&D. Particularly, the structure of the economy is examined
under the two extreme cases, considering R&D investment share 15% and 4%. With the use of the
absolute deviations, value added per sector in final year of the analysed period is compared. The
results reported in Figure 15 leads to finding that there are substantial structural differences in the
economy under both extreme situations. Considering R&D investment share on 15% level, an
excessive increase of R&D sector (+44 bln.) and car industry (+19 bln) is reported. Except for the
machinery and chemical and pharmaceutical sector which also benefit from higher R&D investment
share, all other sectors of the economy have a smaller size compared to the model with lower R&D
investments. The strongest decline of value added can be observed in case of the construction sector (-
40 bln.) and the sector of other services (-30 bln.). Based on these findings it can be concluded that the
stimulation of R&D investments at the expense of the physical investments produces suboptimal
allocation of resources. Apparently, the major sectors producing R&D investment commodity such as
the R&D sector or the car industry cannot stimulate economic growth at the same extent as the other
sectors of the economy, namely the construction, other services or processing industry. One of the
5 The model cannot be run with simulations lower than alphaIRD=0.04.

reasons is a high specialization of particular sectors on production of capital goods for which even a
small decline in investment demand may negatively affect their production results. According to the
situation in 2008, such sector is for instance construction, where more than 50% of production is
designated for investment goods.
Figure 15: Absolute difference of value added in 2020 (bln. CZK, s.p.2008)
Alpha IRD=0.15 vs. Alpha IRD =0.04
-30.2
-26.5
-24.7
1.6
3.0
18.9
44.3
-38.8
-23.5
-7.4
-6.5
-6.2
-5.1
-3.7
-3.4
-3.2
-3.2
-2.8
-40 -30 -20 -10 0 10 20 30 40 50
Construction
Other services
Education
Other processing industry
Commerce, Accomodation and catering
Transport
Agriculture, f ishing and forestry
Mining
Electricity, gas and w ater
Health and social care
Actitivities in ICT
Food and tobacco industry
Banking and insurance
Post and telecommunications
Chemical and pharmaceutical industry
Machinery and equipment industry
Car industry
Research and Development
Source: author’s calculations
4.3 Impact of R&D stimulating shock on the economy
As the results of the previous chapter show, it is not possible to expect positive impact of R&D
investments if these are stimulated at the expense of the physical investments. Even though in short
term this might be beneficial, in the long term this trade off can decelerate the economic growth.
Therefore, in the last simulation, an exogenous R&D shock that directly increases the investment
resources for R&D goods is incorporated in the model and its impact on the economic growth is
calculated. In this exercise, it is assumed that in compliance with the EU Strategy 2020, there is an
inflow of the EU support to the Czech economy, which is directed to investment resources in R&D.
This simulation is produced in the benchmark period, and its short and long-term impacts are
analysed. In the simulation, the R&D investment resources increase by 25 bln. CZK, which raises the
total R&D investments in the Czech Republic to the OECD level, measured in terms of the share in
GDP. Furthermore, it is approximately the same amount as the total subsidies distributed to Czech
farmers from the EU Common Agricultural Policy budget. This gives the idea about the size of the

simulation, which is comparable to a size devoted to the support of a specific resort of the national
economy.
Figure 16 shows changes in GDP produced by the simulation. It can be noted that increasing foreign
investment resources for R&D can lead to a higher GDP level at the end of the analysed period
(1% increase)6.
Figure 16: Impact of R&D stimulating shock on GDP (bln. CZK, c.p. 2008)
3,974
4,174
4,347
4,485
4,625
4,769
4,915
5,065
5,217
4,237
4,372
4,512
4,655
4,801
4,951
5,103
5,258
4,113
3,800
4,000
4,200
4,400
4,600
4,800
5,000
5,200
2012 2013 2014 2015 2016 2017 2018 2019 2020
Baseline RD shock
Source: author’s calculations
Despite such a small impact on growth, for some particular sectors, the increase of R&D investment
resources can be important. As seen in Figure 17, production across all sectors of the economy is
stimulated, except for education. Sectors of construction and other services, which include also real
estate and recreation increase gross value added by 7% with respect to baseline, which are the sectors
with high capital stock accumulation. Notable stimulation of value added (+4% vs. baseline) is also
reached in sectors of R&D and car industry, which is explained by a high share of knowledge in their
value added. The remaining sectors are also better-off, particularly other services sectors, the primary
sectors such as mining and agriculture also to a lesser extent. Surprisingly, the sector of education
seems to be negatively hit by the R&D induced shock. This is explained by the fact that the R&D
stimulating shock leads to an increased demand for public and private R&D commodity, raising their
respective prices. Because public R&D commodity is partially produced by the education sector, this
price inflation is transmitted to other commodities produced by the education sector as well, which is
mainly the education commodity itself. As the education is predominantly consumed by government,
following the Cobb-Douglas consumption function, there is an immediate decrease of governmental
consumption and proportional reduction of the total aggregate demand for education. To summarize
6 Simulations concerning a parallel removal of subsidies in agriculture corresponding to the value of additional investment R&D resources showed no impact on the economic growth.

these effects, the decline of value added in education is a result of two contradictory forces, first the
R&D investment demand stimulating education sector in the production of research commodity,
second the decline of governmental demand reducing the outcome of education sector, which
overweighs the positive effect7.
Figure 16: Impact of R&D stimulating shock on Gross Value Added (c.p. 2008)
Absolute difference in bln. CZK
0.4
0.5
0.7
0.7
3.5
4.6
6.8
7.5
3.5
3.0
1.6
1.4
1.4
1.3
1.1
1.0
1.0
-0.9
-10.00 -8.00 -6.00 -4.00 -2.00 0.00 2.00 4.00 6.00 8.00 10.00
Education
Food and tobacco industry
Mining
Agriculture, f ishing and forestry
Chemical and pharmaceutical industry
Health and social care
Transport
Post and telecommunications
Machinery and equipment industry
Banking and insurance
Electricity, gas and w ater
Actitivities in ICT
Other processing industry
Car industry
Research and Development
Commerce, Accomodation and catering
Other services
Construction
Source: author’s calculations
Changes are also produced concerning the structure of GDP expenditures. Table 3 reports the
aggregate consumption, investments, exports and imports in the baseline and R&D shock scenario.
Values are reported in 2020 both in current prices and also in percentage and absolute differences. The
stimulation of R&D investments has the highest impact on investments which are directly linked to the
performed simulation. However, it can be also observed that the R&D simulation produces a notable
growth of imports, which acts negatively on the GDP. When analysing the import structure it is found
out, that the increase of imports is driven predominantly by five investment commodities, which are
the machinery and equipment, automobiles and other industrial goods, to a lesser extent the R&D
private commodity and the pharmaceuticals (Figure 17). This finding is closely linked to a high share
of imported commodities in total investment goods. Thus, any increase of investment demand is going
to require more imported commodities and will offset the positive effect on the GDP.
7 In 2020, 84% of total commodity production in the education sector is attributed to education; the remaining 14% is the R&D commodity. 75% of education services are consumed directly by government in 2020.

Regarding aggregate consumption and exports, the changes produced by the R&D simulation are
comparable and both are positive.
Table 3: Impact of R&D shock on GDP components (2020)
GDP components 2020 Baseline R&D CZK bln. (c.p.)
R&D shock CZK bln. (c.p.)
% Difference vs. Baseline
Absolute Diff. Vs. Baseline
CONSUMPTION 2,486 2,491 0.2% 5
GOVCONS 895 900 0.6% 5
INVESTMENT 1,561 1,615 3.4% 54
EXPORTS 3,927 3,932 0.1% 5
IMPORTS 3,652 3,680 0.8% 28
Source: author’s calculations
Figure 17: Five imported commodities with highest absolute increase vs. Baseline
(bln. CZK, c.p. 2008)
2.4
5.8
11.612.5
2.2
0
2
4
6
8
10
12
14
Chemicals andpharmaceuticals
Research andDevelopment
PRIVATE
Automobiles Other industrialgoods
Machinery andequipment
Source: author’s calculations
Finally, the impact on the situation of households is investigated (Table 4). It can be noted that the
stimulation of R&D investments can lead to a positive effect on labour market, the unemployment rate
decreases by 1.2%. Furthermore, the welfare of households measured by equivalent variation is
increased by 1.5% compared to baseline.
Table 4: Impact of R&D stimulating shock on households in 2020 (bln. CZK)
Baseline R&D R&D shock % Difference vs. Baseline
Unemployment (thous of workers) 273 270 -1.2%
Household Income (CZK bln.) 3774 3782 0.2%
Equivalent Variation (CZK bln.) 712 723 1.5%
Source: author’s calculations

5. Discussion and conclusions
This paper investigated the effect of R&D investments on the economic growth from two perspectives,
the methodological perspective and the economic perspective. From the methodological perspective,
the aim was to assess what would be the impact on results of a CGE model with R&D investments and
knowledge accumulation, compared to results of a CGE model without knowledge. From the
economic perspective, the aim was to analyse the role that R&D plays in the Czech economy and to
derive corresponding conclusions. In order to gain satisfactory insights, the R&D investments were
analysed with respect to their impact on GDP and other macroeconomic variables, furthermore with
respect to their efficiency compared to physical investments. Finally, the R&D effects were examined
in a scenario which leads to an increase of R&D investments to reach the OECD level.
With respect to the role of knowledge in the dynamisation of the CGE model, the paper showed that
there are only minor effects on the GDP compared to results of the model that excludes knowledge.
This finding is of course influenced by the length of the analysed period. In this paper, the model
provides solutions until 2020, if this period is extended the impacts could be more pronounced, as for
instance in Zürn et al. (2007) who derive 1.2% GDP effects in 2020 and 1.8% in 2030. Additional
analysis further showed that higher initial knowledge endowment can increase the role of knowledge
in the economic growth. Nevertheless, the importance of knowledge inclusion does not necessarily lay
in the dynamics of economic growth but rather in its effect on the structure of the economy. The
analysis showed that CGE model without knowledge overestimated the secondary sector in the longer
run, at the expense of services.
Regarding the efficiency of the R&D investments, it was concluded that investing more to R&D on
account of capital goods can bring positive effects only temporarily. From the longer run, the CGE
model shows that R&D investments are less efficient in producing value added compared to
investments to capital goods. This finding suggests that the effects of R&D are still not properly
captured in the presented CGE format and it confirms the necessity to carry out more thorough
research with the use of the firm-level data. Particularly, the econometric estimates would enable to
assess the effect of R&D investments on the companies´ Total Factor Productivity and determine the
type of technological progress. Furthermore, it seems that the model should also incorporate R&D
spill-over effects from abroad, which in case of the Czech Republic being a small opened economy
with a considerable share of FDI investments might be very relevant, as further analysed in Lejour and
Rojas-Romagosa (2008).
Despite its rather simplistic approach, the CGE model revealed some interesting insights into the role
of R&D investments in the Czech economy. It was found out that if R&D investments are stimulated
as a result of the EU efforts for smart and sustainable growth, positive effects on all GDP components
can be expected. Furthermore, these positive effects are translated across most of industries and
services. The negative impact on trade balance as a consequence of increased demand for imported
capital goods is offset by a reduced unemployment rate and higher consumer welfare.

Acknowledgement The results of this paper are part of a research grant of the Czech Science Foundation “ Evaluation of
Research and Development Effects on the Economic Growth of the Czech Republic with the Use of a
Computable General Equilibrium model“.
Contact information Ing. Zuzana Křístková, Ph.D. CZU - Faculty of Economics and Management, Department of Economics, Kamýcká 129, 165 00 Prague 6, Email: [email protected]
References
Czech Statistical Office (CSO): Research and Development Statistics, 2001 – 2009. Available at: http://www.czso.cz/csu/redakce.nsf/i/statistika_vyzkumu_a_vyvoje, Updated January 31, 2011.
Daniels, M.: Statistics Sweden Capitalising R&D, Yearbook on Productivity, Sweden Statistics, 2007. Diao, X., Roe, T., Yeldan, E.: Strategic policies and growth: an applied model of R&D-driven endogenous growth. Journal of Development Economics Vol. 60 _1999. 343–380. Dybczak, K., Voňka D., Van der Windt, N: The effect of Oil Price Shocks on the Czech Economy, Czech National Bank Working Paper Series 5, Prague, 2008, ISSN 1803-7070, pp 40. Garau, G., Lecca, P. Impact analysis of regional knowledge subsidy: a CGE approach. Working Papers CRENoS, 2008, 11. p. 36. ISBN 978-88-8464-471-5.
De Haan, M., Van Rooijen-Horsten, M.: Measuring R&D Output and Knowledge Capital Formation in Open Economies, Discussion paper 04009, Paper prepared for the 28th General Conference of the International Association for Research in Income and Wealth, Statistics Netherlands, 2004. ISSN: 1572-0314.
Dinamaran, B.: Global Trade, Assistance and Production. The GTAP 6 Data Base, Software documentation. Centre for Global Trade Analysis, Department of Agricultural University, Purdue University, December 2006. Galindo-Rueda, F.: Developing and R&D satellite account for the UK: a preliminary analysis. Economic & Labour Market Review, Volume 1, No 12, December 2007. Gillingham, K., Newell, R.G., Pizer, W.A.: Modelling endogenous technological change for climate policy analysis. Energy Economics 30 (2008) 2734–2753. Hurník J (2004): Fiscal Consolidation in General Equilibrium Framework (The Case of the Czech Republic). Prague Economic Papers, (2):142–158. Kejak M, Seiter S, Vávra D (2004): Accession Trajectories and Convergence: Endogenous Growth Perspective. Structural Change and Economic Dynamics, 15(1):13–46 (Elsevier).
Kejak M, Vávra D (2002): Factor Accumulation Story: any unfinished business? CERGE-EI Working Paper, no. 220.
Křístková, Z.(2010,a): Impact of the Common Agricultural Policy Reform on the Czech Economy, a General Equilibrium Approach. Paper presented at the International Conference on Economic Modelling, Ecomod, 2010. Křístková, Z.(2010b): „Approaches to the Dynamization of the CGE Model Applied to the Czech Republic”. Emerging Markets Finance & Trade / May–June 2010, Vol. 46, Supplement No. 1, pp. 59–82.

ISSN 1540 – 496X/2010. Lejour, A., Rojas-Romagosa, H..: International Spillovers of domestic reforms: The joint application of the Lisbon Strategy in the EU, Discussion Paper No 105, CPB Netherlands Bureau for Economic Policy Analysis, May 2008. ISBN 978-90-5833-355-1. OECD (2003), Frascati Manual 2002: Proposed Standard Practice for Surveys on Research and Experimental Development, OECD, Paris, 256 p. ISBN : 9789264199040 (PDF) Pavel, J.: Macroeconomic models of the impact of the environmental policy measures on the macroeconomic aggregates in the Czech Republic. Institute for economic and environmental policy (IEEP), Czech Republic, 2006. ISBN 80-86684-40-7, pp 186. Peace, J., Weyant, J.: Insights not numbers: the appropriate use of economic models. White paper of Pew Center on Global Climate Change, 2008. Ptáčková, Z.: Research and Development in the System of National Accounts. Statistika, 2007, No. 3., pages 232-248. Robbins, C.A.: Linking Frascati-based R&D Spending to the System of National Accounts, Paper prepared for the Conference of the Group on Measurement of Non-financial Assets (Canberra II), March 29th-April 1, 2005, Canberra, Australia. Romer, P. M.: Endogenous Technological Change. The Journal of Political Economy, Vol. 98, No. 5, 1990. Salem, M. and Siddiqi, Y. A Proposal for Treating Research and Development as Capital Expenditures in the Canadian SNA, Economic Analysis (EA) Research Paper Series, ISSN: 1703-0404, June 2006.
Ščasný, M., Píša, V., Pollott, H. et al: Analyzing Macroeconomic Effects of Environmental Taxation in the Czech Republic with the Econometric E3ME Model. Czech Journal of Economics and Finance, Vol. 59, Issue 5, Pages: 460-491, 2009.
Wang, C., Chen, J.,. Parameter uncertainty in CGE modeling of the macroeconomic impacts of carbon reduction in China. Tsinghua Science and Technology 11 (5), 2006, 617–624. Wang, K., Wang, C., Chen, J.: Analysis of the economic impact of different Chinese climate policy options based on a CGE model incorporating endogenous technological change. Energy Policy 37 (2009) 2930–2940. Yungchang J., B., Yih-Chyi Ch., Wei-Wen L. Chung-Min Yang: A dynamic general equilibrium model for public R&D investment in Taiwan. Economic Modelling, 27, 2010, 171–183. Zürn, M., Küster, R., Ellersdorfer, I., et al.: R&D investment and knowledge input in a technology oriented CGE model. Paper presented at EcoMod Conference on Energy and Environmental Modelling, Moscow, 2007.