Embed Size (px)
Citation preview
Impact of placer gold mine technology on water quality: a case study of Tuul river valley in the Zaamar goldfield, Mongolia
B. Byambaa & Y. Todo Graduate School of Frontier Science, The University of Tokyo, Japan
Abstract
The paper finds that placer gold mining operation has significant impact on the surface water quality, which varies from mine to mine depending on the types of gold recovery technologies applied. Only primitive gold recovery technologies are dominating in the Zaamar goldfield. We assume that the mines with foreign ownership have cleaner technologies with less impact on the water quality than the local ones. But results from the water quality measurement and surveys at the field show that mines with joint ownerships of Russian or Chinese companies in Zaamar area have more polluting technologies than the local smaller companies. Keywords: technology impact, placer gold mine, surface water quality, mine ownership, Zaamar goldfield, lower Tuul river basin.
1 Introduction
The mining industry is now being considered as a main source of the growth and development of Mongolia. It is significantly contributing to the economic and social development, and it is expected to be the main source of long-term growth. The International Monetary Fund (IMF) foresees a double-digit annual growth rate of the mining industry for years to come; the country’s GDP is expected to rise by as much as 10 percent per year, from the current $5 billion to $30 billion by 2020, as a result of outputs from mining alone. Meanwhile, per capita income is expected to quadruple from $3,000 in 2008 to $12,000 by 2015 (Economist [2]). In fact, the mining industry has direct impacts on the environment, in particular on the health of the country’s river systems (Senjim [11]). According to the latest surface water census made by the Ministry of Nature and Environment of Mongolia in 2007, 900 streams and small rivers have
Water Resources Management VI 309
www.witpress.com, ISSN 1743-3541 (on-line) WIT Transactions on Ecology and the Environment, Vol 145, © 2011 WIT Press
doi:10.2495/WRM110261
gone dry or have completely disappeared in the last 15 years as a cause of outdated gold extraction methods such as dredging and river diversion. It was also found that there is 13% loss in rivers and streams, 15% in springs, and 19% in lakes to compare with the previously conducted census in 2003 (Ministry of Nature and Environment of Mongolia [7]). The problem of water degradation is becoming more serious when it comes to the case of placer gold mines, which dominantly use water in their recovery procedures. Annually, 160-300 million cubic meters of water are consumed only for the placer gold mining, and that much of effluent water is discharged to the river (Janchivdorj [4]). Therefore, induced from the existing problems, this research aims to investigate the main factors of water quality deterioration caused by the placer gold mining activities. For this purpose, we conducted a fieldwork in Tuul river valley in the Zaamar goldfield in Tuv province, Mongolia in October 2010 and present findings and analysis from the field study.
2 Study area
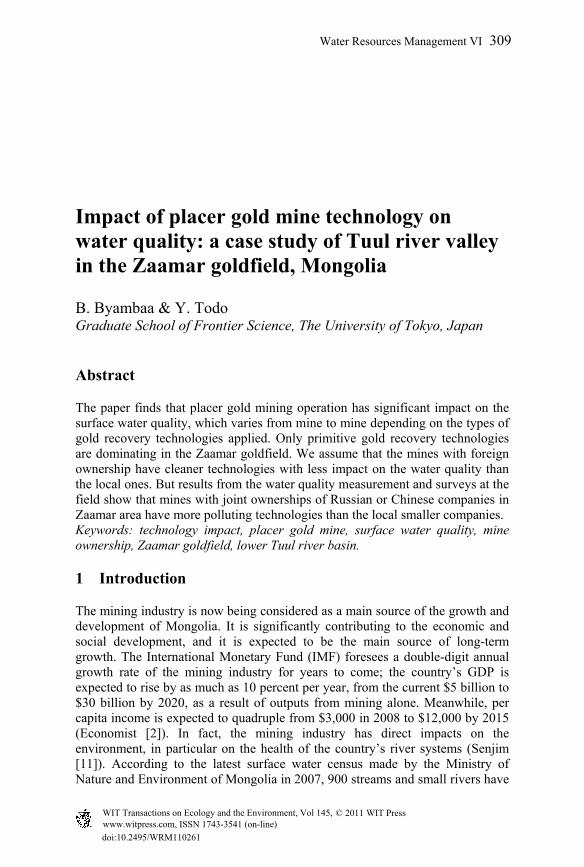
The Zaamar goldfield is located around 230 kilometers from the north western of Ulaanbaatar city and covers an area about 60 kilometers along the Tuul river basin, as Figure 1 indicates.
Figure 1: Tuul river basin, Zaamar goldfield circled in red (left) (WQMD [12]) (see online for colour version of this figure).
Tuul river valley in the Zaamar goldfield is selected as our study area for the following reasons. Firstly, the area is heavily invaded by placer gold mining activities, and its impacts on the river system are very significant since the water is the main method to recover the gold bearing sands and soils. As noted by the River Movement, in the frame of the “Gold” program launched by the Government in early 1990s, one third of the territories of Zaamar village (soum) were opened to gold mining licenses. In consequence, many of the region’s small rivers have been drying up because of the excessive and inefficient use of water in the extraction and recovery processes of the placer gold mining. Secondly, most of technologies applied in the placer gold mines in the Zaamar goldfield are outdated and placer operations of any size may drastically change the local water quality.
310 Water Resources Management VI
www.witpress.com, ISSN 1743-3541 (on-line) WIT Transactions on Ecology and the Environment, Vol 145, © 2011 WIT Press
3 Objective and methodology
Objective of the study is to assess the impact of the placer gold mine technology on the surface water quality and evaluate the determinants of technologies applied in the mines. Main methodology was a field study with mixed methods, water quality sampling, survey and observations. Field study was done to take water quality sampling at 15 points measuring the chemical concentrations of pollutants and survey for 7 mine managers in the Tuul river valley in the Zaamar goldfield in October 2010.
3.1 Water sampling and quality measurement
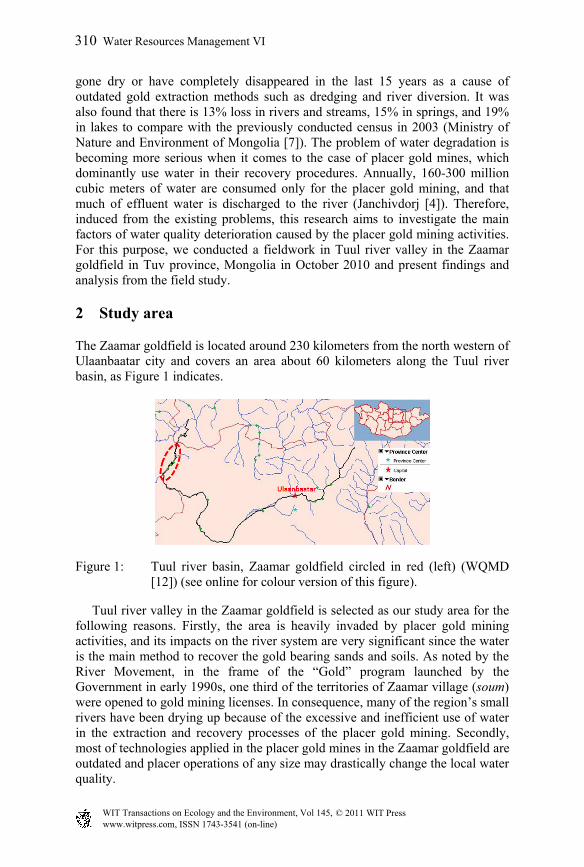
Water sampling sites were randomly selected along the river and were taken from 15 points in total including one point in the Tuul River water (TR) in the upper part of all the mines, 7 river waters (R1-R7), taken at the ponds in which the water is piped from the river and made ready for the mine recovery processes, and 7 discharge points (D1-D7), taken at the deposit lakes where the water after the recovery processes goes into and eventually discharged back to the river. Map 2 shows the locations of each sampling points. It should be noted here that each Ri corresponds to each Di as they refer to the same mine sites.
Figure 2: Location of sampling points. source: google earth. TR - Tuul river; Ri - river point; Di - discharge point.
We have measured the main chemical components in the surface water, as summarized in Table 1. Water environment (pH), temperature, dissolved oxygen (DO) and electric conductivity (EC) were measured by Horiba pH/Cond meter D-34 and YSI 55 MPS; chemical oxygen demand (COD), ammonium (NH4+), nitrate (NO3-), phosphorate (PO4-), cyanide (CN) and heavy metals (Cu, Zn, Mn, Cd, Ni) were measured with simple pack tests manufactured by Kyoritsu Chemical Check Lab Corp. All the samplings were collected using plastic beaker and analyzed twice in-situ. Also geographical information including coordination and altitude was collected using a GPS device (Garmin GPS map 60CSx).
Lower reach
Upper reach
www.witpress.com, ISSN 1743-3541 (on-line) WIT Transactions on Ecology and the Environment, Vol 145, © 2011 WIT Press
Water Resources Management VI 311
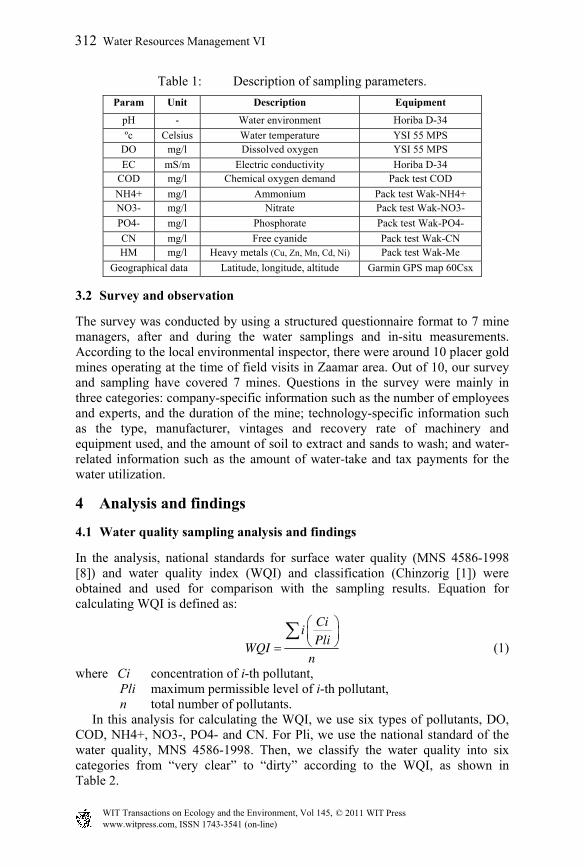
Table 1: Description of sampling parameters.
Param Unit Description Equipment
pH - Water environment Horiba D-34
ºc Celsius Water temperature YSI 55 MPS DO mg/l Dissolved oxygen YSI 55 MPS
EC mS/m Electric conductivity Horiba D-34 COD mg/l Chemical oxygen demand Pack test COD
NH4+ mg/l Ammonium Pack test Wak-NH4+ NO3- mg/l Nitrate Pack test Wak-NO3-
PO4- mg/l Phosphorate Pack test Wak-PO4-
CN mg/l Free cyanide Pack test Wak-CN HM mg/l Heavy metals (Cu, Zn, Mn, Cd, Ni) Pack test Wak-Me
Geographical data Latitude, longitude, altitude Garmin GPS map 60Csx
3.2 Survey and observation
The survey was conducted by using a structured questionnaire format to 7 mine managers, after and during the water samplings and in-situ measurements. According to the local environmental inspector, there were around 10 placer gold mines operating at the time of field visits in Zaamar area. Out of 10, our survey and sampling have covered 7 mines. Questions in the survey were mainly in three categories: company-specific information such as the number of employees and experts, and the duration of the mine; technology-specific information such as the type, manufacturer, vintages and recovery rate of machinery and equipment used, and the amount of soil to extract and sands to wash; and water-related information such as the amount of water-take and tax payments for the water utilization.
4 Analysis and findings
4.1 Water quality sampling analysis and findings
In the analysis, national standards for surface water quality (MNS 4586-1998 [8]) and water quality index (WQI) and classification (Chinzorig [1]) were obtained and used for comparison with the sampling results. Equation for calculating WQI is defined as:
Cii
PliWQI
n (1)
where Ci concentration of i-th pollutant, Pli maximum permissible level of i-th pollutant, n total number of pollutants.
In this analysis for calculating the WQI, we use six types of pollutants, DO, COD, NH4+, NO3-, PO4- and CN. For Pli, we use the national standard of the water quality, MNS 4586-1998. Then, we classify the water quality into six categories from “very clear” to “dirty” according to the WQI, as shown in Table 2.
312 Water Resources Management VI
www.witpress.com, ISSN 1743-3541 (on-line) WIT Transactions on Ecology and the Environment, Vol 145, © 2011 WIT Press
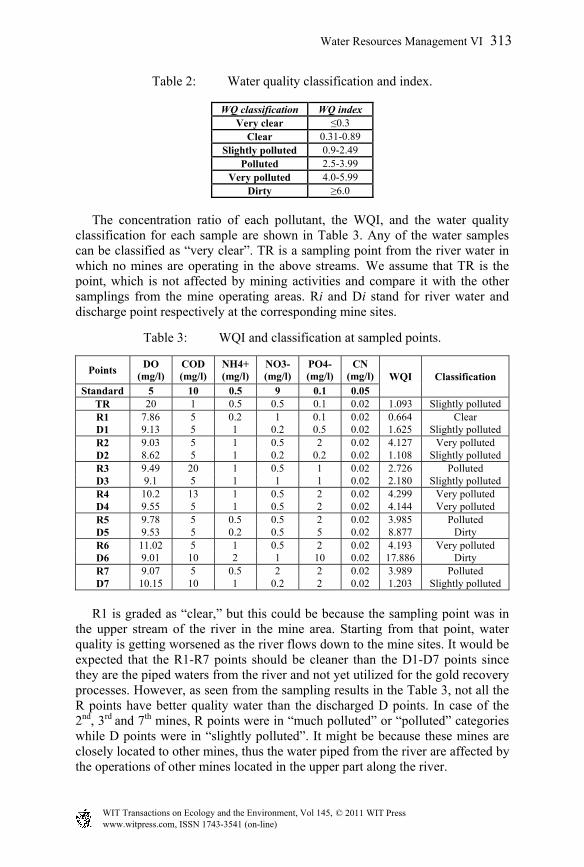
Table 2: Water quality classification and index.
WQ classification WQ indexVery clear ≤0.3
Clear 0.31-0.89 Slightly polluted 0.9-2.49
Polluted 2.5-3.99 Very polluted 4.0-5.99
Dirty ≥6.0
The concentration ratio of each pollutant, the WQI, and the water quality classification for each sample are shown in Table 3. Any of the water samples can be classified as “very clear”. TR is a sampling point from the river water in which no mines are operating in the above streams. We assume that TR is the point, which is not affected by mining activities and compare it with the other samplings from the mine operating areas. Ri and Di stand for river water and discharge point respectively at the corresponding mine sites.
Table 3: WQI and classification at sampled points.
Points DO
(mg/l) COD (mg/l)
NH4+ (mg/l)
NO3- (mg/l)
PO4- (mg/l)
CN (mg/l) WQI Classification
Standard 5 10 0.5 9 0.1 0.05 TR 20 1 0.5 0.5 0.1 0.02 1.093 Slightly polluted R1 7.86 5 0.2 1 0.1 0.02 0.664 Clear D1 9.13 5 1 0.2 0.5 0.02 1.625 Slightly polluted R2 9.03 5 1 0.5 2 0.02 4.127 Very polluted D2 8.62 5 1 0.2 0.2 0.02 1.108 Slightly polluted R3 9.49 20 1 0.5 1 0.02 2.726 Polluted D3 9.1 5 1 1 1 0.02 2.180 Slightly polluted R4 10.2 13 1 0.5 2 0.02 4.299 Very polluted D4 9.55 5 1 0.5 2 0.02 4.144 Very polluted R5 9.78 5 0.5 0.5 2 0.02 3.985 Polluted D5 9.53 5 0.2 0.5 5 0.02 8.877 Dirty R6 11.02 5 1 0.5 2 0.02 4.193 Very polluted D6 9.01 10 2 1 10 0.02 17.886 Dirty R7 9.07 5 0.5 2 2 0.02 3.989 Polluted D7 10.15 10 1 0.2 2 0.02 1.203 Slightly polluted
R1 is graded as “clear,” but this could be because the sampling point was in the upper stream of the river in the mine area. Starting from that point, water quality is getting worsened as the river flows down to the mine sites. It would be expected that the R1-R7 points should be cleaner than the D1-D7 points since they are the piped waters from the river and not yet utilized for the gold recovery processes. However, as seen from the sampling results in the Table 3, not all the R points have better quality water than the discharged D points. In case of the 2nd, 3rd and 7th mines, R points were in “much polluted” or “polluted” categories while D points were in “slightly polluted”. It might be because these mines are closely located to other mines, thus the water piped from the river are affected by the operations of other mines located in the upper part along the river.
Water Resources Management VI 313
www.witpress.com, ISSN 1743-3541 (on-line) WIT Transactions on Ecology and the Environment, Vol 145, © 2011 WIT Press
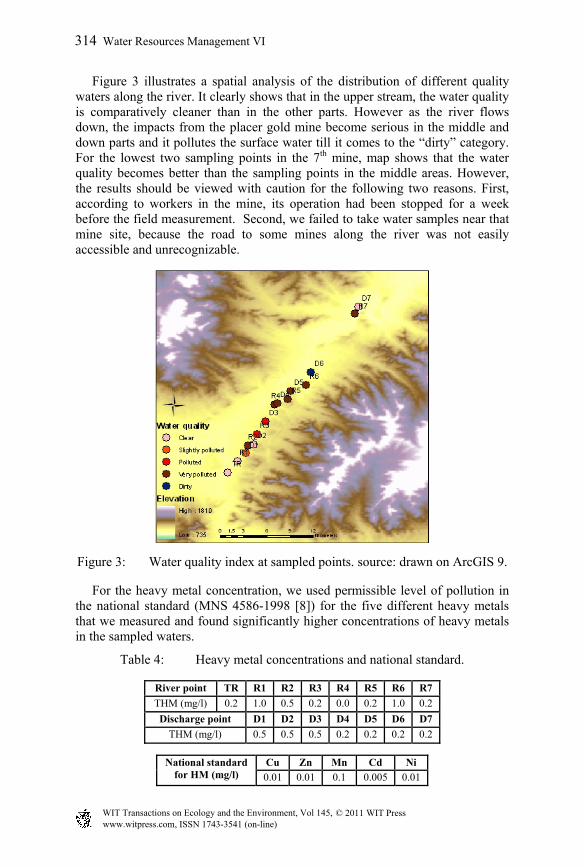
Figure 3 illustrates a spatial analysis of the distribution of different quality waters along the river. It clearly shows that in the upper stream, the water quality is comparatively cleaner than in the other parts. However as the river flows down, the impacts from the placer gold mine become serious in the middle and down parts and it pollutes the surface water till it comes to the “dirty” category. For the lowest two sampling points in the 7th mine, map shows that the water quality becomes better than the sampling points in the middle areas. However, the results should be viewed with caution for the following two reasons. First, according to workers in the mine, its operation had been stopped for a week before the field measurement. Second, we failed to take water samples near that mine site, because the road to some mines along the river was not easily accessible and unrecognizable.
Figure 3: Water quality index at sampled points. source: drawn on ArcGIS 9.
For the heavy metal concentration, we used permissible level of pollution in the national standard (MNS 4586-1998 [8]) for the five different heavy metals that we measured and found significantly higher concentrations of heavy metals in the sampled waters.
Table 4: Heavy metal concentrations and national standard.
River point TR R1 R2 R3 R4 R5 R6 R7
THM (mg/l) 0.2 1.0 0.5 0.2 0.0 0.2 1.0 0.2
Discharge point D1 D2 D3 D4 D5 D6 D7
THM (mg/l) 0.5 0.5 0.5 0.2 0.2 0.2 0.2
National standard for HM (mg/l)
Cu Zn Mn Cd Ni
0.01 0.01 0.1 0.005 0.01
314 Water Resources Management VI
www.witpress.com, ISSN 1743-3541 (on-line) WIT Transactions on Ecology and the Environment, Vol 145, © 2011 WIT Press
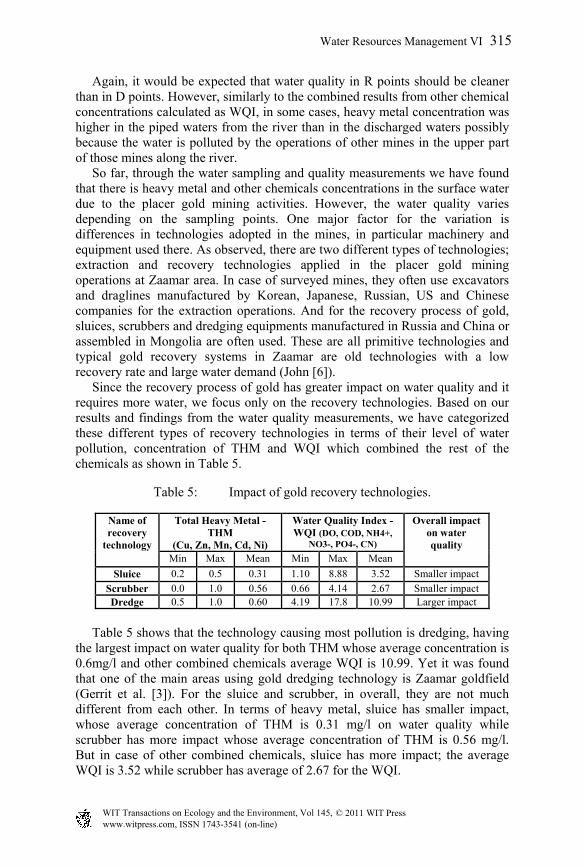
Again, it would be expected that water quality in R points should be cleaner than in D points. However, similarly to the combined results from other chemical concentrations calculated as WQI, in some cases, heavy metal concentration was higher in the piped waters from the river than in the discharged waters possibly because the water is polluted by the operations of other mines in the upper part of those mines along the river. So far, through the water sampling and quality measurements we have found that there is heavy metal and other chemicals concentrations in the surface water due to the placer gold mining activities. However, the water quality varies depending on the sampling points. One major factor for the variation is differences in technologies adopted in the mines, in particular machinery and equipment used there. As observed, there are two different types of technologies; extraction and recovery technologies applied in the placer gold mining operations at Zaamar area. In case of surveyed mines, they often use excavators and draglines manufactured by Korean, Japanese, Russian, US and Chinese companies for the extraction operations. And for the recovery process of gold, sluices, scrubbers and dredging equipments manufactured in Russia and China or assembled in Mongolia are often used. These are all primitive technologies and typical gold recovery systems in Zaamar are old technologies with a low recovery rate and large water demand (John [6]). Since the recovery process of gold has greater impact on water quality and it requires more water, we focus only on the recovery technologies. Based on our results and findings from the water quality measurements, we have categorized these different types of recovery technologies in terms of their level of water pollution, concentration of THM and WQI which combined the rest of the chemicals as shown in Table 5.
Table 5: Impact of gold recovery technologies.
Name of recovery
technology
Total Heavy Metal -THM
(Cu, Zn, Mn, Cd, Ni)
Water Quality Index -WQI (DO, COD, NH4+,
NO3-, PO4-, CN)
Overall impact on water quality
Min Max Mean Min Max Mean
Sluice 0.2 0.5 0.31 1.10 8.88 3.52 Smaller impact
Scrubber 0.0 1.0 0.56 0.66 4.14 2.67 Smaller impact Dredge 0.5 1.0 0.60 4.19 17.8 10.99 Larger impact
Table 5 shows that the technology causing most pollution is dredging, having the largest impact on water quality for both THM whose average concentration is 0.6mg/l and other combined chemicals average WQI is 10.99. Yet it was found that one of the main areas using gold dredging technology is Zaamar goldfield (Gerrit et al. [3]). For the sluice and scrubber, in overall, they are not much different from each other. In terms of heavy metal, sluice has smaller impact, whose average concentration of THM is 0.31 mg/l on water quality while scrubber has more impact whose average concentration of THM is 0.56 mg/l. But in case of other combined chemicals, sluice has more impact; the average WQI is 3.52 while scrubber has average of 2.67 for the WQI.
Water Resources Management VI 315
www.witpress.com, ISSN 1743-3541 (on-line) WIT Transactions on Ecology and the Environment, Vol 145, © 2011 WIT Press
4.2 Survey findings
Through the survey to the mine managers, we have evaluated the determinants of the adoptions of these technologies especially focusing on the ownership of the mines because we assume that variations in ownership status of mines significantly affect the adoption of various technologies. More precisely, we assume that jointly foreign owned mines have cleaner technology with less impact on water quality than the local ones. For the result, we found that scrubbers, which is defined as a technology with smaller impact on the water quality are mostly manufactured or assembled in Mongolia, and they are usually employed by middle scaled Mongolian owned companies, operating no longer than 4 years with 40-50 workers and few experts, while sluices which also have smaller impact on water quality are manufactured in Mongolia or in China and they are usually employed by both small and medium scaled who is operating for 1-2 years with 10-18 workers and 2-4 experts, Mongolian and Chinese jointly owned companies. Also there are few cases of Russian and Mongolian jointly owned bigger scaled mines that are operating for 12-20 years with 57-92 workers, applied sluice technology. In case of the dredge, the biggest polluter technology, it is usually applied by very large scaled and Russian jointly owned companies and they are operating for more than 20 years with 200-252 workers and 25-30 experts. Therefore, the results from the field study analysis did not support our initial hypothesis that mines jointly owned by the foreign companies tend to have cleaner technologies rather than the local mines since clean technology adoption requires much foreign investment and advanced high technology. On the contrary, results from the case study show that mines with joint ownerships with Russian or Chinese companies in Zaamar area are using more polluting technologies than the local smaller companies who have less impact on the water quality even though they tend to have longer years of operation and more number of experts.
5 Conclusion
In conclusion, we found that there is heavy metal and other chemicals concentrations in the surface water making it significantly polluted due to the extensive placer gold mining activities along the river. The water quality in the sampling points varies from mine to mine depending on the types of gold recovery technologies they applied. Three different types of gold recovery technologies, scrubber, sluice and dredge are the dominant in the Zaamar goldfield. It was our initial assumption that mines with foreign ownership has cleaner technologies with less impact on the water quality than the local ones. But result from the water quality measurements at 15 points in the field show that mines with joint ownerships with Russian or Chinese companies in Zaamar area have more polluting technologies than the local smaller companies. These impacts may depend on a variety of factors, such as duration of mines, technology vintage, the skill, knowledge and environmental commitment of the
316 Water Resources Management VI
www.witpress.com, ISSN 1743-3541 (on-line) WIT Transactions on Ecology and the Environment, Vol 145, © 2011 WIT Press
company. Since the placer gold mining industry naturally has the greatest possibility for negative impact on the water pollution, the adoption and application of advanced, clean and environment-friendly technologies would be the most crucial factor to minimize its technological impact on the water pollution.
Acknowledgements
The authors thank Huang Guangwei and Akiyama Tomohiro for their fundamental supports for sampling equipments and tools. Special thanks are given to Jambajamts. L, Enkhbat, Sarangerel and Oyuntuya for their assistance and arrangement with the mine companies. Moreover, authors are grateful for Tsagaanbaatar. B and Sergelen. Kh, for their technical support during the field study.
References
[1] Chinzorig, G., Surface water pollution in Mongolia, Ulaanbaatar, Admon Printing, pp. 7-8, 2009.
[2] Economist. Mongolia’s mining boom: No more nomads, October 21, 2010. http://www.economist.com/node/17312256
[3] Gerrit. B., Robin. G., Frank. M., Iain. B., Review of the gold dredges in Mongolia with comments on mitigation of environmental impacts. World Placer Journal, vol.1, pp. 90-106, 2000.
[4] Janchivdorj. L., Gold mining and water use. Geological Issues in Mongolia. Institute of Geology, Mongolian Academy of Sciences No.6, pp. 258-265, 2006.
[5] Jang. M. C., Ick. H. K., Janchivdorj. L., Bair. G., Chang. H. L., Sang. I. K., Integrated water management model on the Selenge river basin status survey and investigation (Phase I), 2009.
[6] John. F., Environmental problems of placer gold mining in the Zaamar Goldfield, Mongolia. World Placer Journal, vol.1, pp. 107-128, 2000.
[7] Ministry of Nature and Environment of Mongolia. Surface water census 2007, Ulaanbaatar Mongolia.
[8] National Center for Standard and Measurements. Water quality general requirements. MNS 4586:1998.
[9] National Center for Standard and Measurements. Guidance on quality assurance of Environmental water sampling and handling MNS ISO 5667-14:2000.
[10] Robin. G., Baatar. T., The Role of placer mining companies in the State-sponsored gold rush in Mongolia. World placer journal, vol.5, pp. 1-35, 2005.
[11] Senjim. B., Changes in river bed morphology and ecology – Tuul River, Mongolia. Geological Issues in Mongolia. Institute of Geology, Mongolian Academy of Sciences No.5, pp. 112-121, 2005.
Water Resources Management VI 317
www.witpress.com, ISSN 1743-3541 (on-line) WIT Transactions on Ecology and the Environment, Vol 145, © 2011 WIT Press
[12] Water quality monitoring database, Asia Foundation. 2009. http://www.mongolianriverresources.mn/wqmd/datasearch.php?lng=en#
[13] World Bank, Mongolia: A Review of Environmental and Social Impacts in the Mining Sector, 2005.
318 Water Resources Management VI
www.witpress.com, ISSN 1743-3541 (on-line) WIT Transactions on Ecology and the Environment, Vol 145, © 2011 WIT Press