Embed Size (px)
Citation preview
1 | P a g e
IMPACT CHEMICAL TREATMENTS OF SOME
BLENDED MICROFIBER CONSTRUCTION ON
APPEARANCE PROPERTIES
L. K. EL-Gabry1 , Sh. I. Amer
2
1 National Research Centre, Textile Division, Dokki, Cairo, Egypt
2 Spinning, weaving and knitting dept. Faculty of Applied Arts, Helwan University, Cairo, Egypt.
ABSTRACT
Different fabrics with various construction from polyester microfibers with 144 or 288 fibers /cross-section and cotton
ring spinning fibres are used to prepare eighteen samples according to a selected experimental natal design.
Hexanediol and sodium hydroxide solution were used in treatment on different fabrics. Many properties were
determined such as tensile Strength and Elongation %, Roughness, moisture regain % and loss in weight properties.
Then the treated fabrics as well as washing were dyed with Basic, Reactive and disperse dyestuffs. The dyeability of
untreated and treated fabrics and washing fastens was determined.
Key Words: Microfiber, Polyester /Cotton Fabrics, Different Construction, Disperse, Reactive And Basic
Dyes, 1, 6- Hexanediol, Sodium Hydroxide, Dyeability, Washing Fastens.
I INTRODUCTION
Synthetic fiber industry has been enforced to make developments due to the growing performance demand for textile
products. (1)
Polyester fiber becomes more popular due to its unique properties such as mechanical characteristics good
such as heat resistant, chemical inertness and good tensile strength. The micro polyesters have been more focal point in
research through the past decade because of its aesthetic and highly soft touch. (2, 3)
Microfibers are the fineness fibers
with below 0.1 tex. This is the general definition of microfibers, although Japan are already made with fiber fineness
below 0.01 tex. (4)
Some examples for microfiber application are sportswear, Medical wear, protective, and various
filter material, furnishings etc. It can be assumed that their use increases due to the characteristics of the aesthetic and
physical fabric. Microfibers offer a great variety of applications in fashion clothing owing to their additional softness,
drape, comfort and easy care properties. (5, 6)
Microfibers are used in a variety of fabrics, include coats, suits, suit jacket
blouses, dresses, wall coverings, upholstery, sleeping bags, tents, filters and toweling. (7)
Fabrics produced from
microfilaments are best due to their properties such as light weight, wind waterproofness and breathability. Textile
Tightly Produced from microfilament has a very compact structure due to the small dimensions of the pores between
fibers inside the Threads and yarns between themselves. These fabrics provide a very good resistance against the wind
for various end uses such as parachutes, sails, protective clothing and tents from the wind while serving lightweight
properties and high durability. (8)
Microfibers are most commonly found in polyester and nylon (9)
. At the start of the
2 | P a g e
development, the researchers searched intensively for suitable fields of application for their microfibers, since they had
not yet find in previous clothing and technical textile concepts. (10 - 12)
Hexanediol used as cross linking agents to improve the pilling properties of acrylic fabric. (13)
Polyester and their blend
with acrylic fabrics were treated with alcoholic sodium hydroxide solutions offer a possibility of dyeing the blend with
a cationic dye in one bath. (14)
FAST tests were carried out on treated polyester/ cotton fabric to illustrate the relation
between fabric construction and some treatments. (15)
Various type of enzymes used to improve the hydrophilicity of
several polyester fibers, this enzymes improve the water wetting and absorbent properties than alkaline hydrolysis. (16)
The hydrolysis of polyester fibers using various bases in non-aqueous and aqueous media was thoroughly investigated.
(17) The changes in the extent of attack were determined by the loss in weight. Sodium methoxide forms methyl ester end
groups during the interchange reaction with polyester, resulting in a more rapid loss in weight. (18)
The variation of the
dyeing properties of polyester fibers were always given in terms of structural changes by using a two – phase theory
involving crystalline and amorphous regions. (19)
Preselling and plasticization of polyester fibers promote its physico-
mechanical properties, (20)
moisture regain as well as its dyeability.
(21)
This work studies the effect of treatment with sodium hydroxide and1,6- Hexanediol on different construction of
microfiber polyester fabrics as well as its blends with cotton carded and compacted fibers. Some physical and
mechanical properties (moisture regain %, surface roughness, loss in weight, tensile strength and elongation) were
evaluated. The appearance properties such as the colour strength of dyed fabrics with suitable dyestuffs were estimate.
II EXPERIMENTAL
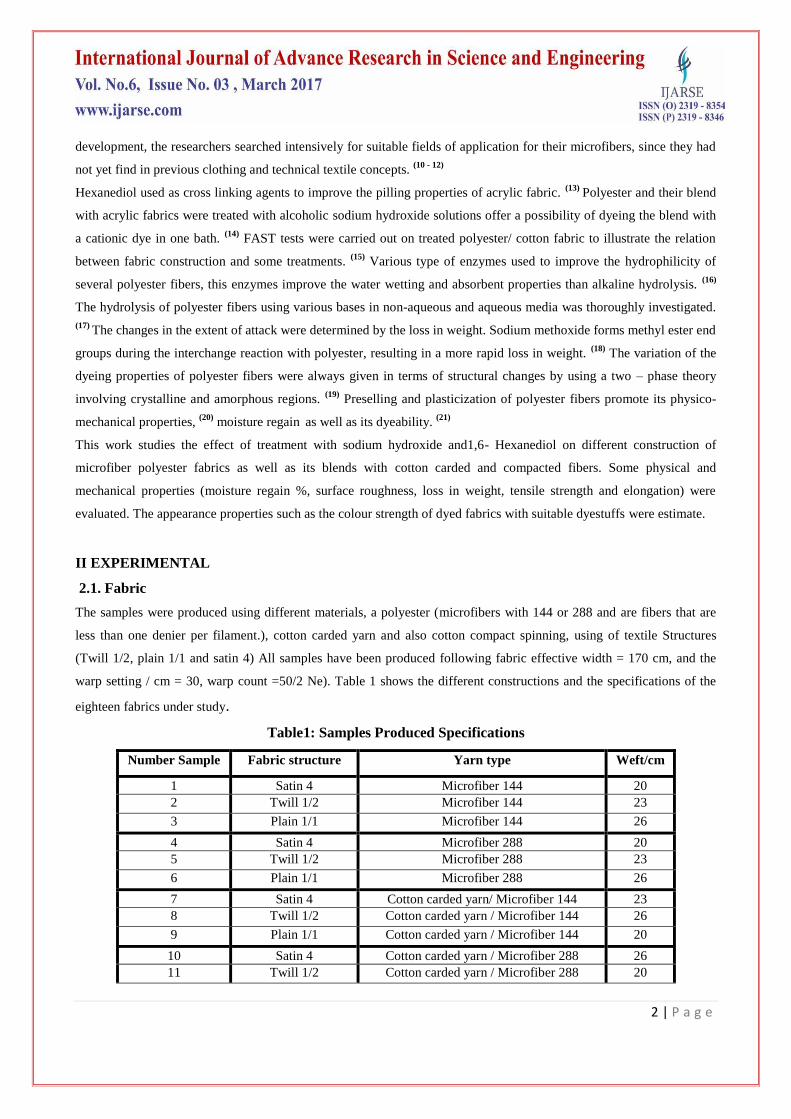
2.1. Fabric
The samples were produced using different materials, a polyester (microfibers with 144 or 288 and are fibers that are
less than one denier per filament.), cotton carded yarn and also cotton compact spinning, using of textile Structures
(Twill 1/2, plain 1/1 and satin 4) All samples have been produced following fabric effective width = 170 cm, and the
warp setting / cm = 30, warp count =50/2 Ne). Table 1 shows the different constructions and the specifications of the
eighteen fabrics under study.
Table1: Samples Produced Specifications
Weft/cm Yarn type Fabric structure Number Sample
20 Microfiber 144 Satin 4 1
23 Microfiber 144 Twill 1/2 2
26 Microfiber 144 Plain 1/1 3
20 Microfiber 288 Satin 4 4
23 Microfiber 288 Twill 1/2 5
26 Microfiber 288 Plain 1/1 6
23 Cotton carded yarn/ Microfiber 144 Satin 4 7
26 Cotton carded yarn / Microfiber 144 Twill 1/2 8
20 Cotton carded yarn / Microfiber 144 Plain 1/1 9
26 Cotton carded yarn / Microfiber 288 Satin 4 10
20 Cotton carded yarn / Microfiber 288 Twill 1/2 11
3 | P a g e
23 Cotton carded yarn / Microfiber 288 Plain 1/1 12
23 Cotton compact spinning/ Microfiber144 Satin 4 13
26 Cotton compact spinning/ Microfiber144 Twill 1/2 14
20 Cotton compact spinning/ Microfiber144 Plain 1/1 15
26 Cotton compact spinning/ Microfiber288 Satin 4 16
20 Cotton compact spinning/ Microfiber288 Twill 1/2 17
23 Cotton compact spinning/ Microfiber288 Plain 1/1 18
Warp/cm: 30
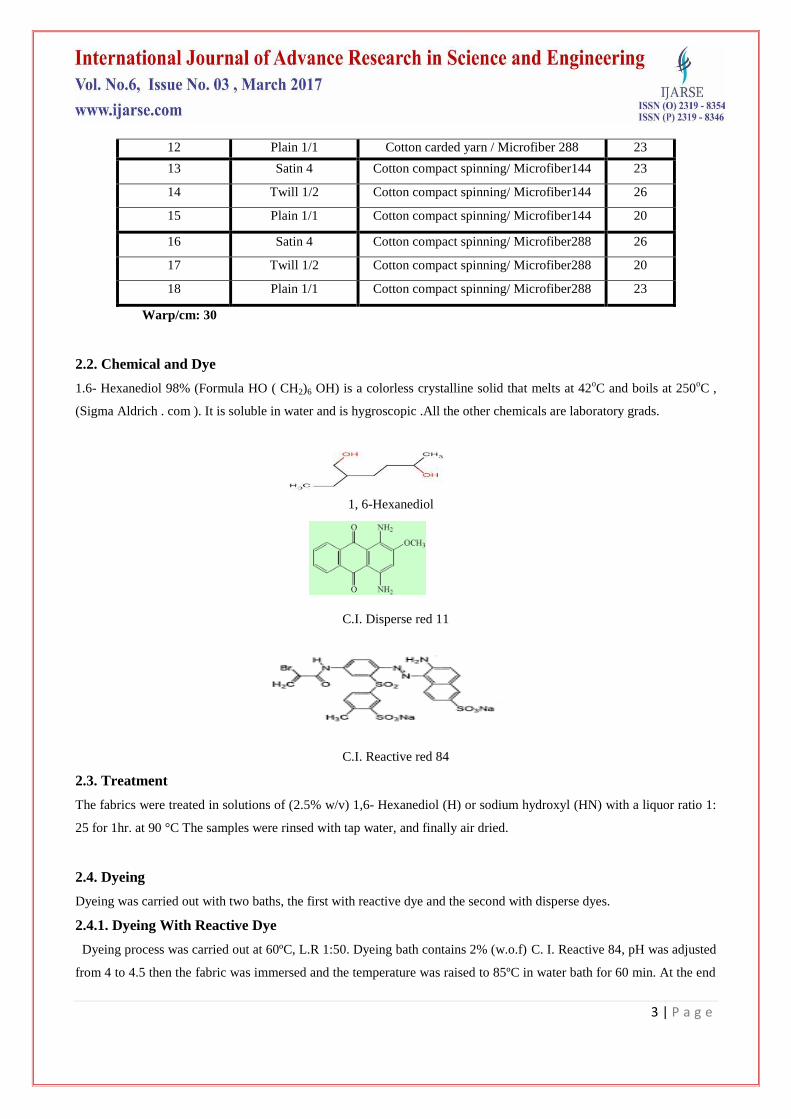
2.2. Chemical and Dye
1.6- Hexanediol 98% (Formula HO ( CH2)6 OH) is a colorless crystalline solid that melts at 42oC and boils at 250
oC ,
(Sigma Aldrich . com ). It is soluble in water and is hygroscopic .All the other chemicals are laboratory grads.
1, 6-Hexanediol
C.I. Disperse red 11
C.I. Reactive red 84
2.3. Treatment
The fabrics were treated in solutions of (2.5% w/v) 1,6- Hexanediol (H) or sodium hydroxyl (HN) with a liquor ratio 1:
25 for 1hr. at 90 °C The samples were rinsed with tap water, and finally air dried.
2.4. Dyeing
Dyeing was carried out with two baths, the first with reactive dye and the second with disperse dyes.
2.4.1. Dyeing With Reactive Dye
Dyeing process was carried out at 60ºC, L.R 1:50. Dyeing bath contains 2% (w.o.f) C. I. Reactive 84, pH was adjusted
from 4 to 4.5 then the fabric was immersed and the temperature was raised to 85ºC in water bath for 60 min. At the end
4 | P a g e
of dyeing, the dyed samples were rinsed with tap water and washing in a bath containing 2g/L non-ionic detergent
(Hostapal CV, Clariant) at 40 °C for 30 minutes. The fabrics were then rinsed and air dried.
2.4.2. Dyeing With Disperse Dye
The dye bath of C.I. Disperse Red 11 was prepared by pasted the dye with 1% acetic acid in hot water, then added 2g/l
of carrier. The dye bath was gradually heated to 100oC. The sample fabric was added to the bath and the dyeing
continued for 60 min., at liquor ratio 1:50. The dyed sample was thoroughly washed in warm and cold water and
airdried.
2.5. Measurements
2.5.1 Colour Strngth (INTENSITY) (K/S)
Color intensity of the prints (k/s) was measured at the wave length of the maximum absorbance using a SF600+-CT
Data colors spectrophotometer.
2.5.2 Moisture Regain
Measurements of moisture regain of the fabrics were performed using the standard ASTM method 2654–76 (West,
1981)17
. Moisture regain of the samples was calculated according to the following equation:
Moisture regain % =
2
21
W
WW x 100
Where W1: Weight of sample (gm) after saturation in the standard humidity atmosphere.
W2: Constant weight (gm) of dry sample.
2.5.3. Fabric Surface Roughness
Surface roughness of treated and untreated fabrics was measured according to JIS-94 standard using surface roughness
tester Model SE 1700∞ (Kosaka Laboratory Ltd. Japan).
2.5.4. Tensile Stregth and Elongation
The tensile strength and elongation of fabric before and after treatment are evaluated using a Instron Tensile Tester
(USA) according to ASTM D 76 Standard Specification for Textile Testing Machines. The average is taken for 10
samples (5x 20 cm).
III RESULTS AND DISCUSSION
3.1. Weight Loss
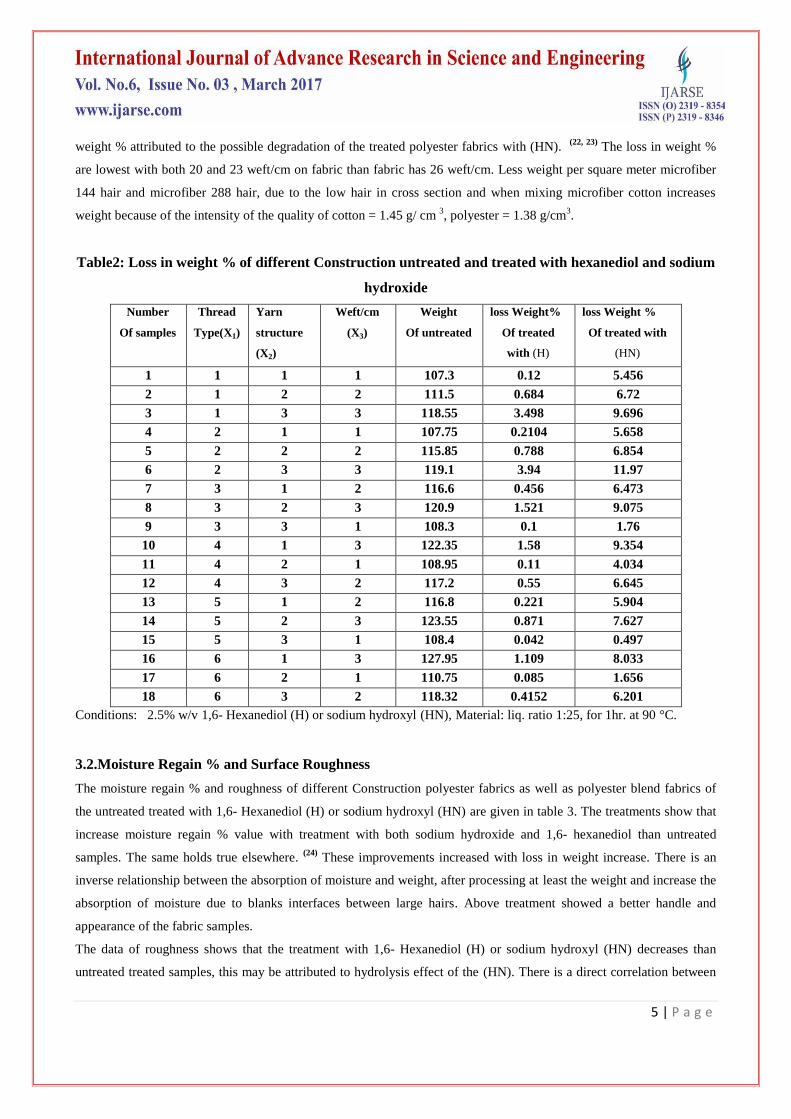
The data of the loss in weight % of different Construction polyester fabrics as well as polyester blend fabrics of the
untreated treated with 1,6- Hexanediol (H) or sodium hydroxyl (HN) are given in table 2. In significant loss in weight
% was found to increase with sodium hydroxyl (HN) treatment than the 1,6- Hexanediol (H) one, the increase loss in
5 | P a g e
weight % attributed to the possible degradation of the treated polyester fabrics with (HN). (22, 23)
The loss in weight %
are lowest with both 20 and 23 weft/cm on fabric than fabric has 26 weft/cm. Less weight per square meter microfiber
144 hair and microfiber 288 hair, due to the low hair in cross section and when mixing microfiber cotton increases
weight because of the intensity of the quality of cotton = 1.45 g/ cm 3, polyester = 1.38 g/cm
3.
Table2: Loss in weight % of different Construction untreated and treated with hexanediol and sodium
hydroxide
Number
Of samples
Thread
Type(X1)
Yarn
structure
(X2)
Weft/cm
(X3)
Weight
Of untreated
loss Weight%
Of treated
with (H)
loss Weight %
Of treated with
(HN)
1 1 1 1 107.3 0.12 5.456
2 1 2 2 111.5 0.684 6.72
3 1 3 3 118.55 3.498 9.696
4 2 1 1 107.75 0.2104 5.658
5 2 2 2 115.85 0.788 6.854
6 2 3 3 119.1 3.94 11.97
7 3 1 2 116.6 0.456 6.473
8 3 2 3 120.9 1.521 9.075
9 3 3 1 108.3 0.1 1.76
10 4 1 3 122.35 1.58 9.354
11 4 2 1 108.95 0.11 4.034
12 4 3 2 117.2 0.55 6.645
13 5 1 2 116.8 0.221 5.904
14 5 2 3 123.55 0.871 7.627
15 5 3 1 108.4 0.042 0.497
16 6 1 3 127.95 1.109 8.033
17 6 2 1 110.75 0.085 1.656
18 6 3 2 118.32 0.4152 6.201
Conditions: 2.5% w/v 1,6- Hexanediol (H) or sodium hydroxyl (HN), Material: liq. ratio 1:25, for 1hr. at 90 °C.
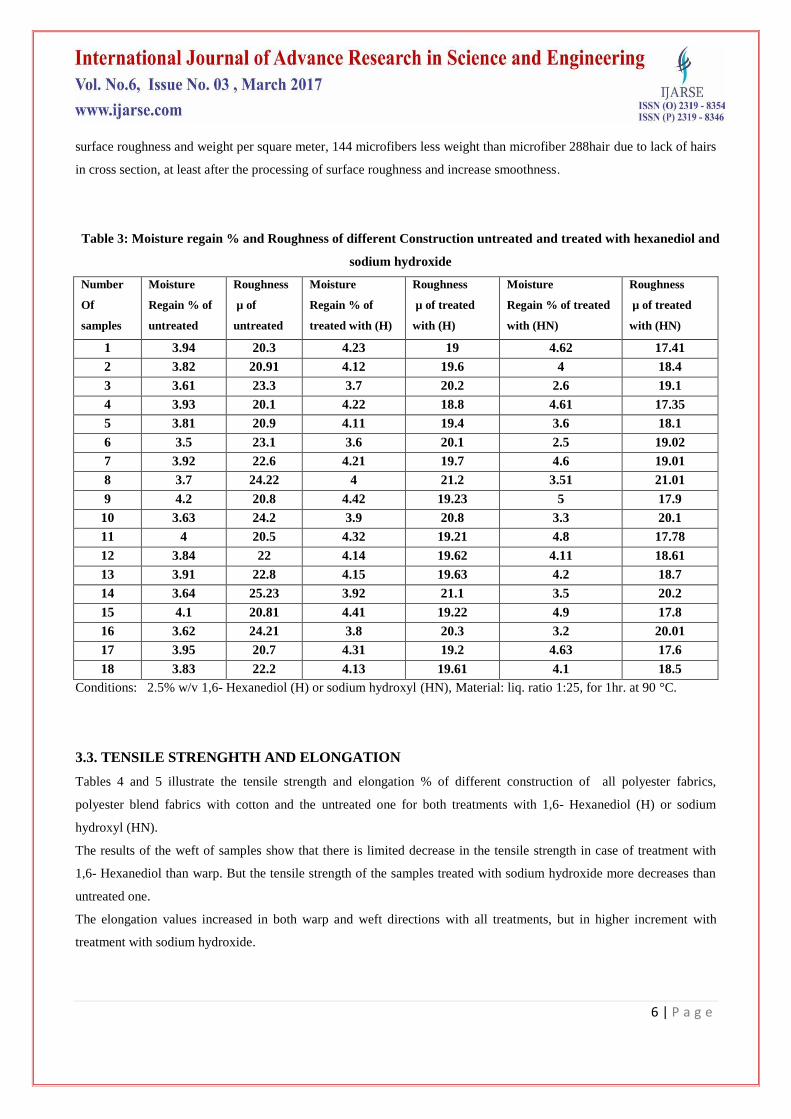
3.2.Moisture Regain % and Surface Roughness
The moisture regain % and roughness of different Construction polyester fabrics as well as polyester blend fabrics of
the untreated treated with 1,6- Hexanediol (H) or sodium hydroxyl (HN) are given in table 3. The treatments show that
increase moisture regain % value with treatment with both sodium hydroxide and 1,6- hexanediol than untreated
samples. The same holds true elsewhere. (24)
These improvements increased with loss in weight increase. There is an
inverse relationship between the absorption of moisture and weight, after processing at least the weight and increase the
absorption of moisture due to blanks interfaces between large hairs. Above treatment showed a better handle and
appearance of the fabric samples.
The data of roughness shows that the treatment with 1,6- Hexanediol (H) or sodium hydroxyl (HN) decreases than
untreated treated samples, this may be attributed to hydrolysis effect of the (HN). There is a direct correlation between
6 | P a g e
surface roughness and weight per square meter, 144 microfibers less weight than microfiber 288hair due to lack of hairs
in cross section, at least after the processing of surface roughness and increase smoothness.
Table 3: Moisture regain % and Roughness of different Construction untreated and treated with hexanediol and
sodium hydroxide
Number
Of
samples
Moisture
Regain % of
untreated
Roughness
µ of
untreated
Moisture
Regain % of
treated with (H)
Roughness
µ of treated
with (H)
Moisture
Regain % of treated
with (HN)
Roughness
µ of treated
with (HN)
1 3.94 20.3 4.23 19 4.62 17.41
2 3.82 20.91 4.12 19.6 4 18.4
3 3.61 23.3 3.7 20.2 2.6 19.1
4 3.93 20.1 4.22 18.8 4.61 17.35
5 3.81 20.9 4.11 19.4 3.6 18.1
6 3.5 23.1 3.6 20.1 2.5 19.02
7 3.92 22.6 4.21 19.7 4.6 19.01
8 3.7 24.22 4 21.2 3.51 21.01
9 4.2 20.8 4.42 19.23 5 17.9
10 3.63 24.2 3.9 20.8 3.3 20.1
11 4 20.5 4.32 19.21 4.8 17.78
12 3.84 22 4.14 19.62 4.11 18.61
13 3.91 22.8 4.15 19.63 4.2 18.7
14 3.64 25.23 3.92 21.1 3.5 20.2
15 4.1 20.81 4.41 19.22 4.9 17.8
16 3.62 24.21 3.8 20.3 3.2 20.01
17 3.95 20.7 4.31 19.2 4.63 17.6
18 3.83 22.2 4.13 19.61 4.1 18.5
Conditions: 2.5% w/v 1,6- Hexanediol (H) or sodium hydroxyl (HN), Material: liq. ratio 1:25, for 1hr. at 90 °C.
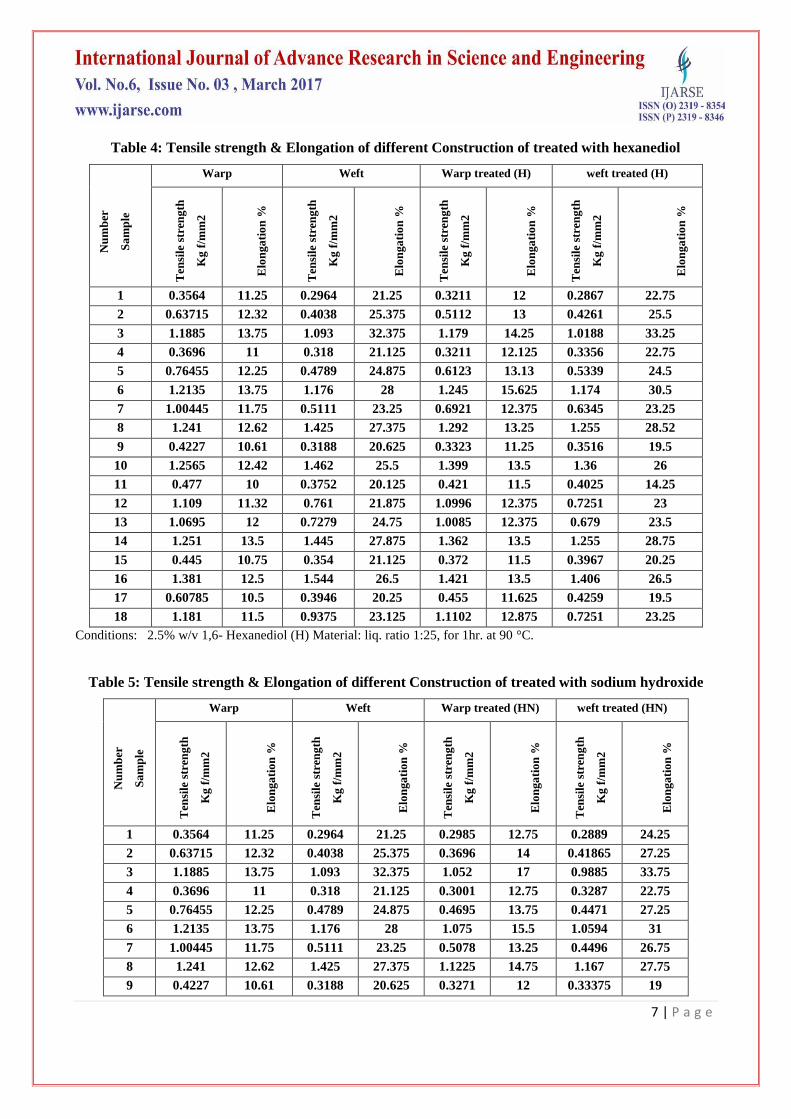
3.3. TENSILE STRENGHTH AND ELONGATION
Tables 4 and 5 illustrate the tensile strength and elongation % of different construction of all polyester fabrics,
polyester blend fabrics with cotton and the untreated one for both treatments with 1,6- Hexanediol (H) or sodium
hydroxyl (HN).
The results of the weft of samples show that there is limited decrease in the tensile strength in case of treatment with
1,6- Hexanediol than warp. But the tensile strength of the samples treated with sodium hydroxide more decreases than
untreated one.
The elongation values increased in both warp and weft directions with all treatments, but in higher increment with
treatment with sodium hydroxide.
7 | P a g e
Table 4: Tensile strength & Elongation of different Construction of treated with hexanediol
Nu
mb
er
Sa
mp
le
Warp Weft Warp treated (H) weft treated (H) T
ensi
le s
tren
gth
Kg
f/m
m2
Elo
nga
tio
n %
Ten
sile
str
eng
th
Kg
f/m
m2
Elo
nga
tio
n %
Ten
sile
str
eng
th
Kg
f/m
m2
Elo
nga
tio
n %
Ten
sile
str
eng
th
Kg
f/m
m2
Elo
nga
tio
n %
1 0.3564 11.25 0.2964 21.25 0.3211 12 0.2867 22.75
2 0.63715 12.32 0.4038 25.375 0.5112 13 0.4261 25.5
3 1.1885 13.75 1.093 32.375 1.179 14.25 1.0188 33.25
4 0.3696 11 0.318 21.125 0.3211 12.125 0.3356 22.75
5 0.76455 12.25 0.4789 24.875 0.6123 13.13 0.5339 24.5
6 1.2135 13.75 1.176 28 1.245 15.625 1.174 30.5
7 1.00445 11.75 0.5111 23.25 0.6921 12.375 0.6345 23.25
8 1.241 12.62 1.425 27.375 1.292 13.25 1.255 28.52
9 0.4227 10.61 0.3188 20.625 0.3323 11.25 0.3516 19.5
10 1.2565 12.42 1.462 25.5 1.399 13.5 1.36 26
11 0.477 10 0.3752 20.125 0.421 11.5 0.4025 14.25
12 1.109 11.32 0.761 21.875 1.0996 12.375 0.7251 23
13 1.0695 12 0.7279 24.75 1.0085 12.375 0.679 23.5
14 1.251 13.5 1.445 27.875 1.362 13.5 1.255 28.75
15 0.445 10.75 0.354 21.125 0.372 11.5 0.3967 20.25
16 1.381 12.5 1.544 26.5 1.421 13.5 1.406 26.5
17 0.60785 10.5 0.3946 20.25 0.455 11.625 0.4259 19.5
18 1.181 11.5 0.9375 23.125 1.1102 12.875 0.7251 23.25
Conditions: 2.5% w/v 1,6- Hexanediol (H) Material: liq. ratio 1:25, for 1hr. at 90 °C.
Table 5: Tensile strength & Elongation of different Construction of treated with sodium hydroxide
Nu
mb
er
Sa
mp
le
Warp Weft Warp treated (HN) weft treated (HN)
Ten
sile
str
eng
th
Kg
f/m
m2
Elo
nga
tio
n %
Ten
sile
str
eng
th
Kg
f/m
m2
Elo
nga
tio
n %
Ten
sile
str
eng
th
Kg
f/m
m2
Elo
nga
tio
n %
Ten
sile
str
eng
th
Kg
f/m
m2
Elo
nga
tio
n %
1 0.3564 11.25 0.2964 21.25 0.2985 12.75 0.2889 24.25
2 0.63715 12.32 0.4038 25.375 0.3696 14 0.41865 27.25
3 1.1885 13.75 1.093 32.375 1.052 17 0.9885 33.75
4 0.3696 11 0.318 21.125 0.3001 12.75 0.3287 22.75
5 0.76455 12.25 0.4789 24.875 0.4695 13.75 0.4471 27.25
6 1.2135 13.75 1.176 28 1.075 15.5 1.0594 31
7 1.00445 11.75 0.5111 23.25 0.5078 13.25 0.4496 26.75
8 1.241 12.62 1.425 27.375 1.1225 14.75 1.167 27.75
9 0.4227 10.61 0.3188 20.625 0.3271 12 0.33375 19
8 | P a g e
10 1.2565 12.42 1.462 25.5 1.1885 14.25 1.289 27.5
11 0.477 10 0.3752 20.125 0.3321 11.5 0.3393 16.75
12 1.109 11.32 0.761 21.875 1.0025 13 0.45625 25.25
13 1.0695 12 0.7279 24.75 0.9255 13.25 0.46985 27.25
14 1.251 13.5 1.445 27.875 1.151 14.75 1.328 30
15 0.445 10.75 0.354 21.125 0.3287 12.5 0.3548 20.5
16 1.381 12.5 1.544 26.5 1.251 14.5 1.3505 27.5
17 0.60785 10.5 0.3946 20.25 0.337 11.75 0.36645 17
18 1.181 11.5 0.9375 23.125 1.0065 13 0.7485 25.75
Conditions: 2.5% w/v sodium hydroxyl (HN), Material: liq. ratio 1:25, for 1hr. at 85°C.
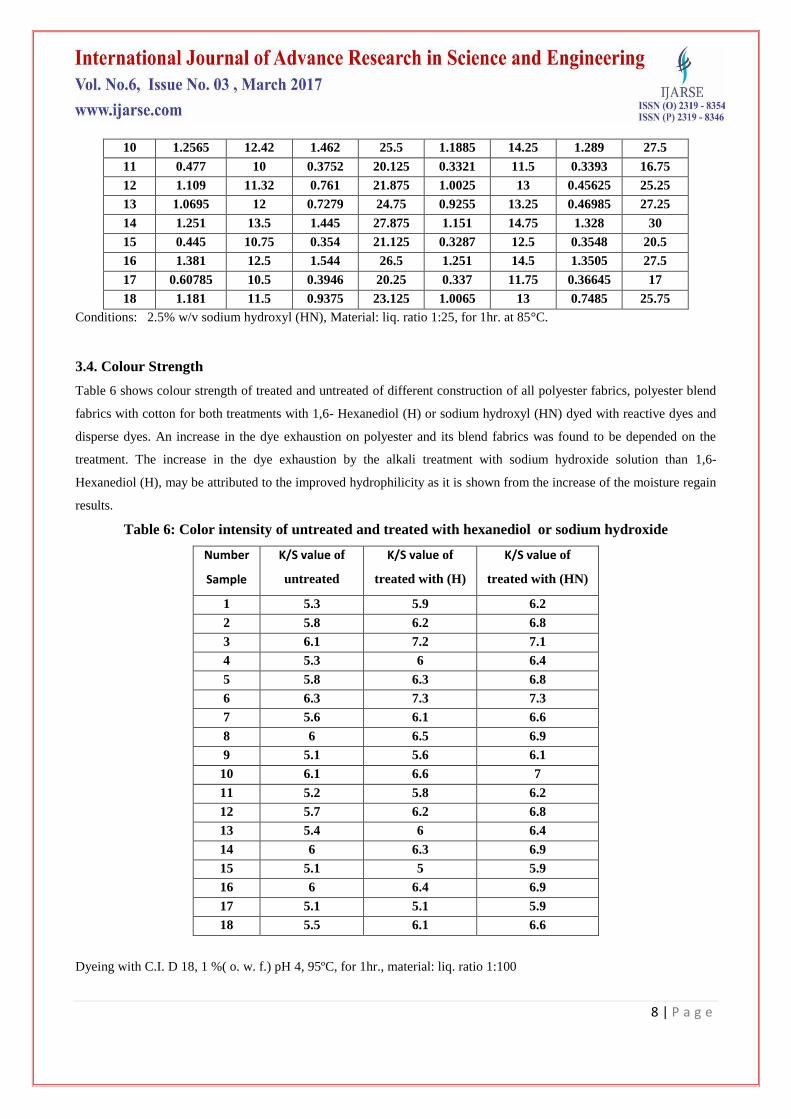
3.4. Colour Strength
Table 6 shows colour strength of treated and untreated of different construction of all polyester fabrics, polyester blend
fabrics with cotton for both treatments with 1,6- Hexanediol (H) or sodium hydroxyl (HN) dyed with reactive dyes and
disperse dyes. An increase in the dye exhaustion on polyester and its blend fabrics was found to be depended on the
treatment. The increase in the dye exhaustion by the alkali treatment with sodium hydroxide solution than 1,6-
Hexanediol (H), may be attributed to the improved hydrophilicity as it is shown from the increase of the moisture regain
results.
Table 6: Color intensity of untreated and treated with hexanediol or sodium hydroxide
Number
Sample
K/S value of
untreated
K/S value of
treated with (H)
K/S value of
treated with (HN)
1 5.3 5.9 6.2
2 5.8 6.2 6.8
3 6.1 7.2 7.1
4 5.3 6 6.4
5 5.8 6.3 6.8
6 6.3 7.3 7.3
7 5.6 6.1 6.6
8 6 6.5 6.9
9 5.1 5.6 6.1
10 6.1 6.6 7
11 5.2 5.8 6.2
12 5.7 6.2 6.8
13 5.4 6 6.4
14 6 6.3 6.9
15 5.1 5 5.9
16 6 6.4 6.9
17 5.1 5.1 5.9
18 5.5 6.1 6.6
Dyeing with C.I. D 18, 1 %( o. w. f.) pH 4, 95ºC, for 1hr., material: liq. ratio 1:100
9 | P a g e
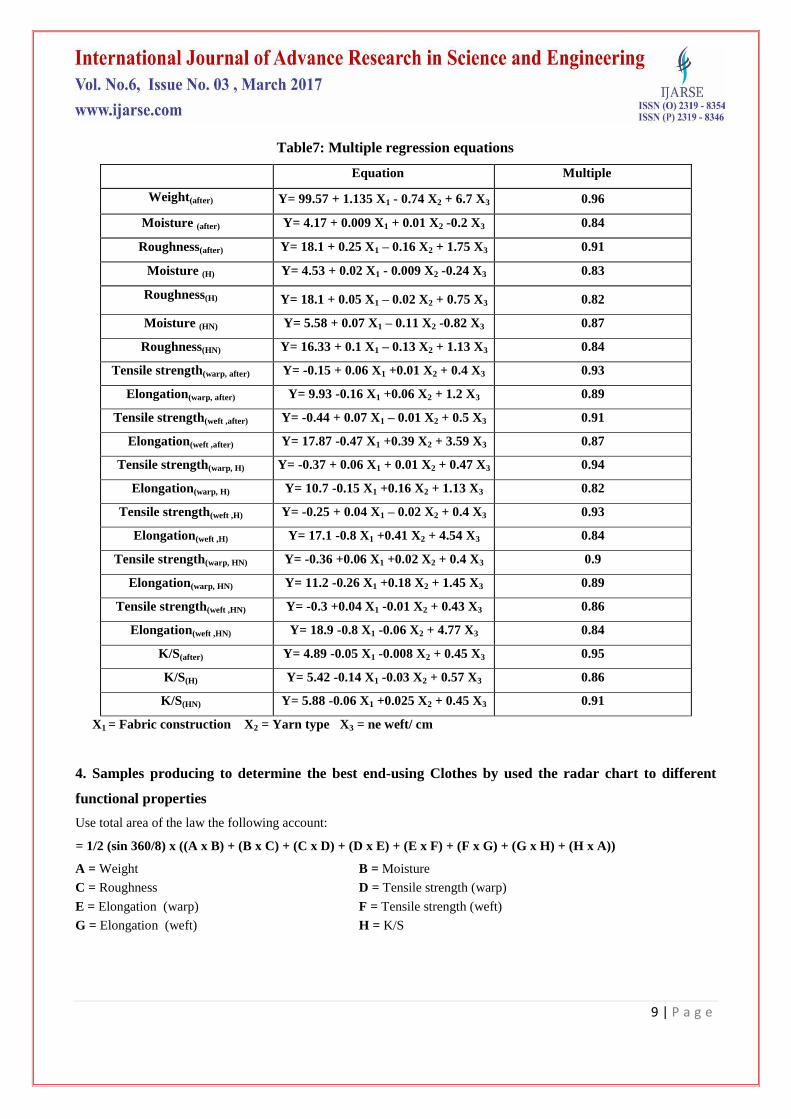
Table7: Multiple regression equations
Equation Multiple
Weight(after) Y= 99.57 + 1.135 X1 - 0.74 X2 + 6.7 X3 0.96
Moisture (after) Y= 4.17 + 0.009 X1 + 0.01 X2 -0.2 X3 0.84
Roughness(after) Y= 18.1 + 0.25 X1 – 0.16 X2 + 1.75 X3 0.91
Moisture (H) Y= 4.53 + 0.02 X1 - 0.009 X2 -0.24 X3 0.83
Roughness(H) Y= 18.1 + 0.05 X1 – 0.02 X2 + 0.75 X3 0.82
Moisture (HN) Y= 5.58 + 0.07 X1 – 0.11 X2 -0.82 X3 0.87
Roughness(HN) Y= 16.33 + 0.1 X1 – 0.13 X2 + 1.13 X3 0.84
Tensile strength(warp, after) Y= -0.15 + 0.06 X1 +0.01 X2 + 0.4 X3 0.93
Elongation(warp, after) Y= 9.93 -0.16 X1 +0.06 X2 + 1.2 X3 0.89
Tensile strength(weft ,after) Y= -0.44 + 0.07 X1 – 0.01 X2 + 0.5 X3 0.91
Elongation(weft ,after) Y= 17.87 -0.47 X1 +0.39 X2 + 3.59 X3 0.87
Tensile strength(warp, H) Y= -0.37 + 0.06 X1 + 0.01 X2 + 0.47 X3 0.94
Elongation(warp, H) Y= 10.7 -0.15 X1 +0.16 X2 + 1.13 X3 0.82
Tensile strength(weft ,H) Y= -0.25 + 0.04 X1 – 0.02 X2 + 0.4 X3 0.93
Elongation(weft ,H) Y= 17.1 -0.8 X1 +0.41 X2 + 4.54 X3 0.84
Tensile strength(warp, HN) Y= -0.36 +0.06 X1 +0.02 X2 + 0.4 X3 0.9
Elongation(warp, HN) Y= 11.2 -0.26 X1 +0.18 X2 + 1.45 X3 0.89
Tensile strength(weft ,HN) Y= -0.3 +0.04 X1 -0.01 X2 + 0.43 X3 0.86
Elongation(weft ,HN) Y= 18.9 -0.8 X1 -0.06 X2 + 4.77 X3 0.84
K/S(after) Y= 4.89 -0.05 X1 -0.008 X2 + 0.45 X3 0.95
K/S(H) Y= 5.42 -0.14 X1 -0.03 X2 + 0.57 X3 0.86
K/S(HN) Y= 5.88 -0.06 X1 +0.025 X2 + 0.45 X3 0.91
X1 = Fabric construction X2 = Yarn type X3 = ne weft/ cm
4. Samples producing to determine the best end-using Clothes by used the radar chart to different
functional properties
Use total area of the law the following account:
= 1/2 (sin 360/8) x ((A x B) + (B x C) + (C x D) + (D x E) + (E x F) + (F x G) + (G x H) + (H x A))
A = Weight B = Moisture
C = Roughness D = Tensile strength (warp)
E = Elongation (warp) F = Tensile strength (weft)
G = Elongation (weft) H = K/S
10 | P a g e
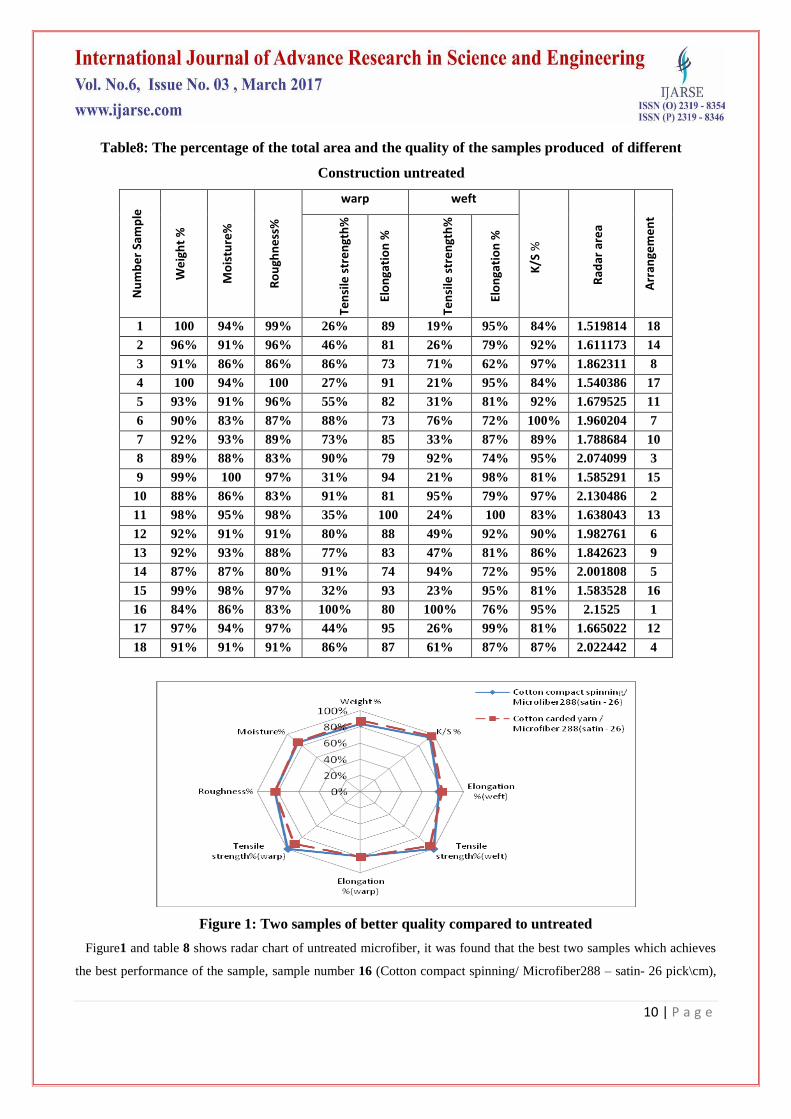
Table8: The percentage of the total area and the quality of the samples produced of different
Construction untreated
Nu
mb
er
Sam
ple
We
igh
t %
Mo
istu
re%
Ro
ugh
ne
ss%
warp weft
K/S
%
Rad
ar a
rea
Arr
ange
me
nt
Ten
sile
str
en
gth
%
Elo
nga
tio
n %
Ten
sile
str
en
gth
%
Elo
nga
tio
n %
1 100
%
94% 99% 26% 89
%
19% 95% 84% 1.519814 18
2 96% 91% 96% 46% 81
%
26% 79% 92% 1.611173 14
3 91% 86% 86% 86% 73
%
71% 62% 97% 1.862311 8
4 100
%
94% 100
%
27% 91
%
21% 95% 84% 1.540386 17
5 93% 91% 96% 55% 82
%
31% 81% 92% 1.679525 11
6 90% 83% 87% 88% 73
%
76% 72% 100% 1.960204 7
7 92% 93% 89% 73% 85
%
33% 87% 89% 1.788684 10
8 89% 88% 83% 90% 79
%
92% 74% 95% 2.074099 3
9 99% 100
%
97% 31% 94
%
21% 98% 81% 1.585291 15
10 88% 86% 83% 91% 81
%
95% 79% 97% 2.130486 2
11 98% 95% 98% 35% 100
%
24% 100
%
83% 1.638043 13
12 92% 91% 91% 80% 88
%
49% 92% 90% 1.982761 6
13 92% 93% 88% 77% 83
%
47% 81% 86% 1.842623 9
14 87% 87% 80% 91% 74
%
94% 72% 95% 2.001808 5
15 99% 98% 97% 32% 93
%
23% 95% 81% 1.583528 16
16 84% 86% 83% 100% 80
%
100% 76% 95% 2.1525 1
17 97% 94% 97% 44% 95
%
26% 99% 81% 1.665022 12
18 91% 91% 91% 86% 87
%
61% 87% 87% 2.022442 4
Figure 1: Two samples of better quality compared to untreated
Figure1 and table 8 shows radar chart of untreated microfiber, it was found that the best two samples which achieves
the best performance of the sample, sample number 16 (Cotton compact spinning/ Microfiber288 – satin- 26 pick\cm),
11 | P a g e
Radar area were given 2.1525 and number 10 (Cotton carded yarn/ Microfiber 288 – satin- 26 pick\cm), Radar area
were given 2.130486.
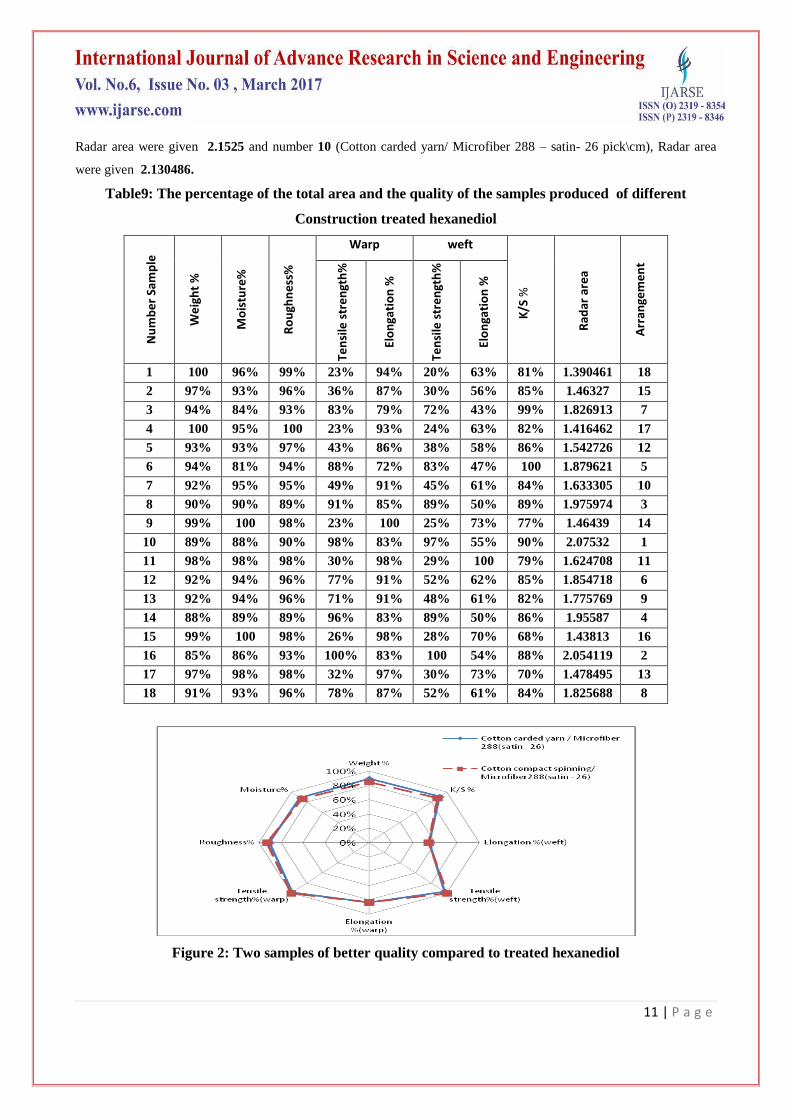
Table9: The percentage of the total area and the quality of the samples produced of different
Construction treated hexanediol
Nu
mb
er
Sam
ple
We
igh
t %
Mo
istu
re%
Ro
ugh
ne
ss%
Warp weft
K/S
%
Rad
ar a
rea
Arr
ange
me
nt
Ten
sile
str
en
gth
%
Elo
nga
tio
n %
Ten
sile
str
en
gth
%
Elo
nga
tio
n %
1 100
%
96% 99% 23% 94% 20% 63% 81% 1.390461 18
2 97% 93% 96% 36% 87% 30% 56% 85% 1.46327 15
3 94% 84% 93% 83% 79% 72% 43% 99% 1.826913 7
4 100
%
95% 100
%
23% 93% 24% 63% 82% 1.416462 17
5 93% 93% 97% 43% 86% 38% 58% 86% 1.542726 12
6 94% 81% 94% 88% 72% 83% 47% 100
%
1.879621 5
7 92% 95% 95% 49% 91% 45% 61% 84% 1.633305 10
8 90% 90% 89% 91% 85% 89% 50% 89% 1.975974 3
9 99% 100
%
98% 23% 100
%
25% 73% 77% 1.46439 14
10 89% 88% 90% 98% 83% 97% 55% 90% 2.07532 1
11 98% 98% 98% 30% 98% 29% 100
%
79% 1.624708 11
12 92% 94% 96% 77% 91% 52% 62% 85% 1.854718 6
13 92% 94% 96% 71% 91% 48% 61% 82% 1.775769 9
14 88% 89% 89% 96% 83% 89% 50% 86% 1.95587 4
15 99% 100
%
98% 26% 98% 28% 70% 68% 1.43813 16
16 85% 86% 93% 100% 83% 100
%
54% 88% 2.054119 2
17 97% 98% 98% 32% 97% 30% 73% 70% 1.478495 13
18 91% 93% 96% 78% 87% 52% 61% 84% 1.825688 8
Figure 2: Two samples of better quality compared to treated hexanediol
12 | P a g e
Figure2 and table 9 shows radar chart of treated hexanediol, it was found that the best two samples which achieves
the best performance of the sample, number 10 (Cotton carded yarn/ Microfiber 288 – satin- 26 pick\cm), Radar area
were given 2.07532- and sample number 16 (Cotton compact spinning/ Microfiber288 – satin- 26 pick\cm), Radar area
were given 2.054119.
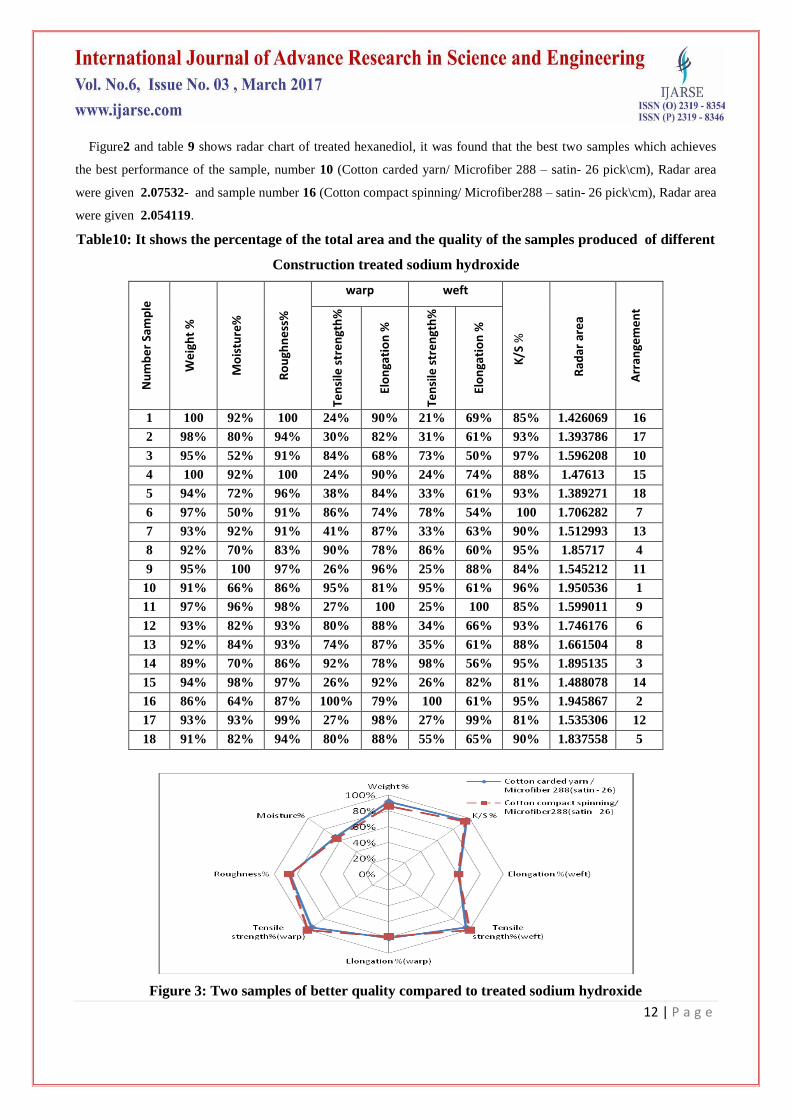
Table10: It shows the percentage of the total area and the quality of the samples produced of different
Construction treated sodium hydroxide
Nu
mb
er
Sam
ple
We
igh
t %
Mo
istu
re%
Ro
ugh
ne
ss%
warp weft
K/S
%
Rad
ar a
rea
Arr
ange
me
nt
Ten
sile
str
en
gth
%
Elo
nga
tio
n %
Ten
sile
str
en
gth
%
Elo
nga
tio
n %
1 100
%
92% 100
%
24% 90% 21% 69% 85% 1.426069 16
2 98% 80% 94% 30% 82% 31% 61% 93% 1.393786 17
3 95% 52% 91% 84% 68% 73% 50% 97% 1.596208 10
4 100
%
92% 100
%
24% 90% 24% 74% 88% 1.47613 15
5 94% 72% 96% 38% 84% 33% 61% 93% 1.389271 18
6 97% 50% 91% 86% 74% 78% 54% 100
%
1.706282 7
7 93% 92% 91% 41% 87% 33% 63% 90% 1.512993 13
8 92% 70% 83% 90% 78% 86% 60% 95% 1.85717 4
9 95% 100
%
97% 26% 96% 25% 88% 84% 1.545212 11
10 91% 66% 86% 95% 81% 95% 61% 96% 1.950536 1
11 97% 96% 98% 27% 100
%
25% 100
%
85% 1.599011 9
12 93% 82% 93% 80% 88% 34% 66% 93% 1.746176 6
13 92% 84% 93% 74% 87% 35% 61% 88% 1.661504 8
14 89% 70% 86% 92% 78% 98% 56% 95% 1.895135 3
15 94% 98% 97% 26% 92% 26% 82% 81% 1.488078 14
16 86% 64% 87% 100% 79% 100
%
61% 95% 1.945867 2
17 93% 93% 99% 27% 98% 27% 99% 81% 1.535306 12
18 91% 82% 94% 80% 88% 55% 65% 90% 1.837558 5
Figure 3: Two samples of better quality compared to treated sodium hydroxide
13 | P a g e
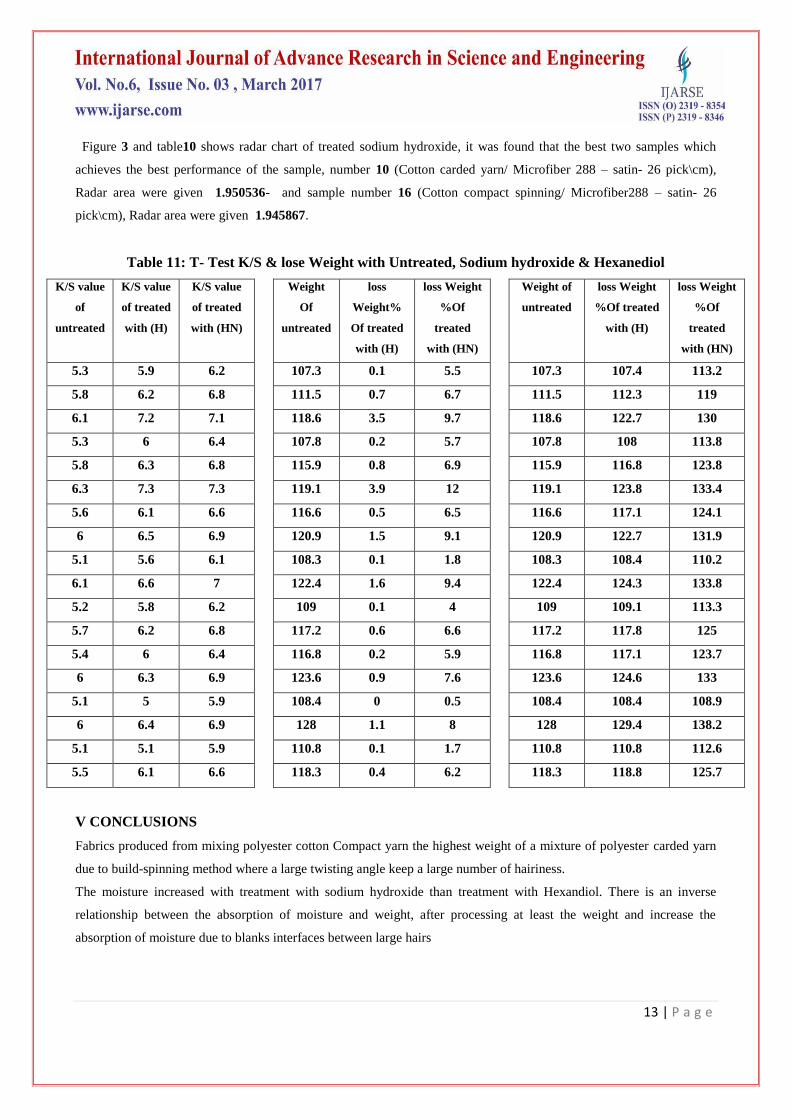
Figure 3 and table10 shows radar chart of treated sodium hydroxide, it was found that the best two samples which
achieves the best performance of the sample, number 10 (Cotton carded yarn/ Microfiber 288 – satin- 26 pick\cm),
Radar area were given 1.950536- and sample number 16 (Cotton compact spinning/ Microfiber288 – satin- 26
pick\cm), Radar area were given 1.945867.
Table 11: T- Test K/S & lose Weight with Untreated, Sodium hydroxide & Hexanediol
K/S value
of
untreated
K/S value
of treated
with (H)
K/S value
of treated
with (HN)
Weight
Of
untreated
loss
Weight%
Of treated
with (H)
loss Weight
%Of
treated
with (HN)
Weight of
untreated
loss Weight
%Of treated
with (H)
loss Weight
%Of
treated
with (HN)
5.3 5.9 6.2
107.3 0.1 5.5
107.3 107.4 113.2
5.8 6.2 6.8
111.5 0.7 6.7
111.5 112.3 119
6.1 7.2 7.1
118.6 3.5 9.7
118.6 122.7 130
5.3 6 6.4
107.8 0.2 5.7
107.8 108 113.8
5.8 6.3 6.8
115.9 0.8 6.9
115.9 116.8 123.8
6.3 7.3 7.3
119.1 3.9 12
119.1 123.8 133.4
5.6 6.1 6.6
116.6 0.5 6.5
116.6 117.1 124.1
6 6.5 6.9
120.9 1.5 9.1
120.9 122.7 131.9
5.1 5.6 6.1
108.3 0.1 1.8
108.3 108.4 110.2
6.1 6.6 7
122.4 1.6 9.4
122.4 124.3 133.8
5.2 5.8 6.2
109 0.1 4
109 109.1 113.3
5.7 6.2 6.8
117.2 0.6 6.6
117.2 117.8 125
5.4 6 6.4
116.8 0.2 5.9
116.8 117.1 123.7
6 6.3 6.9
123.6 0.9 7.6
123.6 124.6 133
5.1 5 5.9
108.4 0 0.5
108.4 108.4 108.9
6 6.4 6.9
128 1.1 8
128 129.4 138.2
5.1 5.1 5.9
110.8 0.1 1.7
110.8 110.8 112.6
5.5 6.1 6.6
118.3 0.4 6.2
118.3 118.8 125.7
V CONCLUSIONS
Fabrics produced from mixing polyester cotton Compact yarn the highest weight of a mixture of polyester carded yarn
due to build-spinning method where a large twisting angle keep a large number of hairiness.
The moisture increased with treatment with sodium hydroxide than treatment with Hexandiol. There is an inverse
relationship between the absorption of moisture and weight, after processing at least the weight and increase the
absorption of moisture due to blanks interfaces between large hairs
14 | P a g e
There is a direct correlation between surface roughness and weight per square meter, 144 microfibers less weight than
microfiber 288hair due to lack of hairs in cross section, at least after the processing of surface roughness and increase
smoothness.
Evidenced by the results of laboratory tests that when you add material processing of samples to give them a surface
fineness caused the low tensile strength, due to the nature of the treatment when you add the chemical absorbs fabric
altering the raw properties by accidental entanglement between the interaction of cellulosic chains by hydroxyl groups,
and lead to a decrease in tensile strength. Elongation suit inversely with the tensile strength, the higher the tensile
strength is less than the elongation.
REFERENCE
[1] T. Nakamura, R. Bommu, Y. Kamshi, “Dyeing Properties of Polyester Ultrafine Fiber” Textile Research Journal, 70
(11) , 2000, 961 – 968.
[2] H. Barani and S. Peyvandi., “Enhanced Deep Coloring of Micro Polyester Fabric”
MATERIALS SCIENCE, 16(2): ISSN, 2010, 1392–1320.
[3] M. Abdul Rahman AL-ansary “The Influence of Number of Filaments on Physical and Mechanical characteristics of
Polyester Woven Fabrics”, Life Science Journal 9 (3), 2012, 79-83 .
[4] A.R Horrocks, and S.C. Anand, (Eds). Handbook of Technical Textiles, CRC Press, ISBN 0-8493-1047-4, New
York, USA , 2004.
[5] Anonymous. Recent advancements in man-made textiles. New Cloth Market, ISSN 0972-1711, 14(4), 2000,13-14.
[6] J.A. Smith, (n.d.).( 27.10.2011), “Microfibers: Functional Beauty”, In: Ohio State University Extension Fact Sheet, ,
Available from: http://ohioline.osu.edu/hyg-fact/5000/5546.html , 2011.
[7] S.Ramakrishna, K. Fujihara, W. E. Teo, T. C. Lim, and Z. Ma, “An introduction to electrospinning and nanofibers”
World Scientific Publishing, ISBN 978-981-256-415-3, Singapore, 2005.
[8] O. Babaarslan, and H. K. Kaynak, “A study on air permeability of windproof polyester microfilament fabrics”
ICONTEX 2011-International Congress of Innovative Textiles, ISBN 978- 605- 4265- 14- 5, İstanbul Turkey,
October 20-22, 2011, 418-427.
[9] S.V. Purane, and N. R. Panigrahi, “Microfibers, microfilaments and their application” AUTEX Research Journal,
ISSN 1470 9589, 7(3) , 2007, 148-158.
[10] J.Rupp, and A. Yonenaga, “Microfibers-The new man-made fiber image” International Textile Bulletin, No.4, ,
ISSN 1029-8525, 2000, 12-24.
[11] K. K. Hatice and B. Osman “Polyester Microfilament Woven Fabrics, Woven Fabrics” ISBN: 978-953-51-0607-4
; 2012 , 155-178 , www.intechopen.com.
[12] A. Basu, “Microfibers: Properties, processing and use” Asian Textile Journal, ISSN 1819-3358, 10(4) , 2001.
[13] P. J. Brown; M.Sultan, and J.H. Nobbs, "Crosslinking Acrylic fibres with Hexanediol and Pentaerythritol" AATCC
2(3), 2002, 46-50.
[14] L. K. El-Gabry and A. Bendak; "Dyeing Characterization of Alkoxide Pretreated Acrylic, Polyester Fibres Blend
Using Cationic Dyes" Polish Journal of Applied Chemistry, 50( 3/4), 2006, 83-94.
15 | P a g e
[15] F. Fathy Saied, Z. M. Abdel-Megeid and L.K. El Gabry "The relation between fabric construction, treatments and
sewability "Journal of American Science, 7(3) , 2011.
[16] G. F. Colbrie, S. Heumann and G. Gubitz, “Biotechnology in the textile industry: Enzymatic Modification of
synthetic fibres” 2 nd
International conference of Textile Research Division, National Research Center, Cairo,
Egypt, 2005 , 33.
[17] W. B. Achwal “A comparative study of the surface action of caustic soda on polyester fabrics under different
conditions” Man-made Textile in India, 31(15), April 1984 ,18- 22.
[18] M. Davies and J. Amirbayat, “The effect of weight redaction on the performance of a polyester fibers satin
bending, drape and drop” Journal of the Textile Institute, 85 (3), 1994 , 376-382.
[19] J., S., Lee, and H., S., Ryu., “Alkaline softening of polyester fabrics treated with aqueous NaOH solutions
containing CTAB and EDA” 3rd
Asian Textile conference, 1, 1995 , 256-261.
[20]M. Haghighat Kish and M. Nouri , “Effect of sodium hydroxide and calcium hydroxide on polyester fabrics” J.
Applied Polymer Science, 72(5) , 1999 , 631- 637.
[21] W. M. Raslan, and A. Bendak; “Changes induced in silk-like polyester properties by alkoxides treatment”. Journal
of Applied Polymer Science, 98(4), 2005, 1829.