Embed Size (px)
Citation preview

Aayushi International Interdisciplinary Research Journal (AIIRJ) UGC Approved Sr.No.64259
Vol - IV Issue-VIII AUGUST 2017 ISSN 2349-638x Impact Factor 3.025
Email id’s:- [email protected],[email protected] I Mob.09922455749 website :- www.aiirjournal.com l UGC Approved Sr.No.64259
Page No.141
AAYUSHI
INTERNATIONAL INTERDISCIPLINARY
RESEARCH JOURNAL (AIIRJ)
VOL-IV ISSUE-VIII Aug. 2017
•Vikram Nagar, Boudhi Chouk, Latur.
•Tq. Latur, Dis. Latur 413512 (MS.)
•(+91) 9922455749, (+91) 8999250451
Address
•www.aiirjournal.comWebsite
Impact
Factor
3.025
CHIEF EDITOR – PRAMOD PRAKASHRAO TANDALE
ISSN 2349-638x
Refereed And Indexed Journal
UGC Approved Monthly Journal
Aayushi International Interdisciplinary Research Journal (AIIRJ) UGC Approved Sr.No.64259
Vol - IV Issue-VIII AUGUST 2017 ISSN 2349-638x Impact Factor 3.025
Email id’s:- [email protected],[email protected] I Mob.09922455749 website :- www.aiirjournal.com l UGC Approved Sr.No.64259
Page No.142
Spatial Pattern of Male-Female In-Migration to Haryana,
2001-A District Level Analysis
Harpreet Singh
Assistant Professor
Department of Geography
National Defence Academy (NDA)
Khadakwasla, Pune-411023(MS)
Abstract
Human migration is considered as tool for survival and growth. The history of human migration is as
deep-rooted as human evolution. Both male and female migrates from one geographical area to another but
for different purposes. In general, male migrates for economic causes while female migrates for social causes.
Haryana is one of the fast developing state of India and it attracts both male and female migrants from other
states/UTs of India.The spatial spread of both male and female in-migrants varies over the space of Haryana
either due to varying level of development or due to varying socio-cultural setups of all the districts.The present
paper tries to understand the spatial spread of male and female in-migrants to all the districts of Haryana from
other states and UTs of India. For analysis purpose the data from the migration tables of Haryana of census
2001 is used.
Keywords:Migration, Male, Female, Haryana, Spatial, District
Introduction:
Demographically, both the gender (male and female) are the important component of any
movement across any political or administrative boundaries.Various available literature on migration
reflects that both the gender migrates for different purposes.The most prominent reason of
migration for men and women are ‘employment’ and ‘marriage’ respectively.Irrespective of the
reason behind their movement, both the gender plays an important role in the growth and
development of any area.A combination of movement of males and females generates total
migration.It is quite important to understand the sex differential of in-migrants from other
states/Union Territories of India to Haryana which is marred with highly skewed sex ratio in India. It
is observed from various literature that the area having low sex ratio generally attracts more female
migrants than male migrants.The latest available census data shows that total 1.07 million males and
1.60 million females were enumerated as in-migrants to Haryanafrom other states/UTs of India
during 2001. Nearly half million female in-migrants were more than the male in-migrants.

Aayushi International Interdisciplinary Research Journal (AIIRJ) UGC Approved Sr.No.64259
Vol - IV Issue-VIII AUGUST 2017 ISSN 2349-638x Impact Factor 3.025
Email id’s:- [email protected],[email protected] I Mob.09922455749 website :- www.aiirjournal.com l UGC Approved Sr.No.64259
Page No.143
Study area-
.
Haryana is one of the 29 states of India. It lies between 27°39' to 30°35' N latitude and
between 74°28' and 77°36' E longitude. Haryana is a landlocked state of north India. It is surrounded
by the state of Uttar Pradesh in the east, Punjab and Himachal Pradesh in the north and Rajasthan in
the west and south.
The state ofHaryana was carved out on 1stNovember 1966 from the former state of East
Punjab on a linguistic basis. The total geographical area of the state is 44,212 km2which is 1.4% of
the geographical area of the country.In terms of its area; it is at 21stposition while with 25.35 million
population it stands at 18th position. River Yamuna forms its eastern border with the state of Uttar
Pradesh. Haryana surrounds the National capital, Delhi from three sides and it has maximum area in
National Capital Region (NCR).
Objectives-
a) To understand the volume of in-migrants to Haryana from other states/UTs of India.
b) To understand the spatial distribution of male in-migrants.
c) To understand the spatial distribution of female in-migrants.
Sources of migration data
Census, Population Registers and Sample Surveys are the three principal sources of
information on internal migration in India. To know the internal migration in India, census is the
major source of secondary data. In India, census provides data of migrants based on place of birth
(POB) and place of last residence (POLR). In the preset study the data based on the place of last
residence is used to understand the spatial pattern of both male and female in-migrants from other
states/UTs of India. Since the latest available data is only for 2001 census hence this paper is entirely
based on 2001 census data where migration Tables (D-Series) of Haryana for this census has been
analyzed.

Aayushi International Interdisciplinary Research Journal (AIIRJ) UGC Approved Sr.No.64259
Vol - IV Issue-VIII AUGUST 2017 ISSN 2349-638x Impact Factor 3.025
Email id’s:- [email protected],[email protected] I Mob.09922455749 website :- www.aiirjournal.com l UGC Approved Sr.No.64259
Page No.144
Result and Discussion:
In-migrationto Haryana from other states/UTs of India-
Haryana has made tremendous development in various fields hence it becomes the most
preferred destination state for the migrants from other states/UTs of India.As per 2001census, the
total population of Haryana was 16 millionand the total enumerated in-migrants from other states
and Union Territories of India to Haryana were 2.67 million which constitutes 9.59 percentof the
total population of Haryana. Hence, a fairly large proportion of population has been contributed by
the in-migrants from other state/UTs of India.There were total 19 districts in Haryana during 2001.
All these districts have high variation in term of development which leads to unequal distribution of
in-migrants over Haryana. The spatial pattern of in-migrantsalso shows that it isnot evenly
distributedin all the districts of Haryana. Hence the spatial pattern of in-migrants varies from district
to district. Some of the districts have very high concentration of in-migrants while other has very less
concentration.
Table1
Haryana: In-migrants from other states/UTs of India, 2001
(Data by districts)
Source: (i) Census of India (2001): Table D 2, Migration Tables of Haryana, data available on CD.
State/Districts Person Percent
Haryana 2675920 100.00
Faridabad 573540 21.43
Gurgaon 245968 9.19
Sirsa 212857 7.95
Panchkula 174541 6.52
Ambala 166770 6.23
Yamunanagar 142787 5.33
Panipat 142396 5.32
Sonipat 123589 4.61
Karnal 110150 4.11
Hisar 106141 3.96
Jhajjar 99926 3.73
Fatehabad 94984 3.54
Mahendragarh 92985 3.47
Rewari 89794 3.35
Kurukshetra 78301 2.92
Bhiwani 75235 2.81
Kaithal 58017 2.16
Rohtak 52337 1.95
Jind 35602 1.33

Aayushi International Interdisciplinary Research Journal (AIIRJ) UGC Approved Sr.No.64259
Vol - IV Issue-VIII AUGUST 2017 ISSN 2349-638x Impact Factor 3.025
Email id’s:- [email protected],[email protected] I Mob.09922455749 website :- www.aiirjournal.com l UGC Approved Sr.No.64259
Page No.145
Fig.1
As per Table 1, out of total 2.67 million in-migrants more than 50 percent were enumerated
in five districts of Haryana namely Faridabad, Gurgaon, Sirsa, Panchkula and Ambala.While the
remaining 50 percent in-migrants were enumerated in the remaining fourteen districts of Haryana
which shows a very high contrast in the distributional pattern of in-migrants.
Maximum numbers of in-migrants were enumerated in district Faridabad that is 0.57 million
which is 21.43 percent of the total in-migrants (Table1).Faridabad is the most preferred destination
district by the in-migrants from other states/UTs of India because of its industrial development.
Faridabad is known as the industrial hub of Haryana. Faridabad occupied first position among all the
district with maximum numbers of industrial units i.e. 2471 in the year 2000 (Singh and Kaur 2004).
Industrial development attracts the people as it provides employment/job opportunities to the
people.The second largest number of in-migrants were enumerated in Gurgaon i.e. 0.24 million
which is 9.19 percent of the total enumerated in-migrants. Gurgaon is also an industrial district of
Haryana. Moreover the close proximity of both these districts to the National Capital,Delhi is also a
major reason for more in-migration from other states/UTs of India.The third largest number of in-
migrants were enumerated in district Sirsa that is 0.21 million.Sirsa is an agriculturally advanced
district of Haryana.Hence it provides employment opportunities in agriculture sector and attracted
the migrants from other state/UTs of India.As per Haryana Development report, planning
commission, New Delhi 2001, the maximum percentage of agricultural labourers were found in
district Sirsa i.e. 23.84 per cent.
The newly formed Panchkula district was at forth position among all the districts and
account for 0.17 million in-migrants which were 6.52 percent of the total in-migrants (Table 1).The
district is in the close proximity to state’s capital, Chandigarh and serving as satellite town to the
state’s capital which results into more in-migration.The living cost is comparatively cheaper in
Panchkula than Chandigarh hence most of the migrants settled in Panchkula.
Yamunanagar (5.33percent), Panipat (5.32 percent), Sonipat (4.61percent), Karnal (4.11
percent), Hissar (3.96 percent),Jhajjar (3.73 percent) and Fatehabad(3.54 percent)were in the
medium category of districts having in-migration rate more than 3.50 percent from other states and
Union Territories of India.Yamunanagar, Panipat, Sonipat and Karnal are the industrial districts
where one or the other type of industries are located which attracted the migrants from other states
0
100,000
200,000
300,000
400,000
500,000
600,000
700,000
In-M
igra
nts
Districts
Haryana: In-migrants from other states/UTs of India,2001
Aayushi International Interdisciplinary Research Journal (AIIRJ) UGC Approved Sr.No.64259
Vol - IV Issue-VIII AUGUST 2017 ISSN 2349-638x Impact Factor 3.025
Email id’s:- [email protected],[email protected] I Mob.09922455749 website :- www.aiirjournal.com l UGC Approved Sr.No.64259
Page No.146
and Union Territories of India and most of them are located on National Highway no.1 which is again
an important reason for in-migration of people. Hissar is an agricultural district hence attracted the
migrants. Jhajjar being close to national capital, Delhi and industrially advanced district Gurgaon has
fairly good rate of in-migration.
District Mahendergarh (3.47 percent), Rewari (3.35 percent), Kurukshetra (2.92 percent),
Bhiwani (2.81 percent), Kaithal (2.16 percent), Rohtak (1.92 percent) and Jind (1.33 percent) were in
the lowest percentage of in-migration. These districts formed a continuous belt from Kurukshetra in
the north to Mahendergarh in the south. The peripheral location and distance from national as well
as state’s capital are the main deciding factors for low rate of in-migration.
District Jind was at the bottom position with less than 2 percent in-migrants (Table1).Total
35,602 in-migrants were enumerated in the district.District Jind remained a backward district in
terms of development since its inception hence it could not attract more migrants.Jind is the only
district having not only even a single large and medium scale industry at the time of state’s creation
(Singh and Kaur 2004, p150).Moreover district Jind has only 6 thousand hectares land under
cultivation which is lowest among all the districts of Haryana (statistical abstract of Haryana 2001-
02).
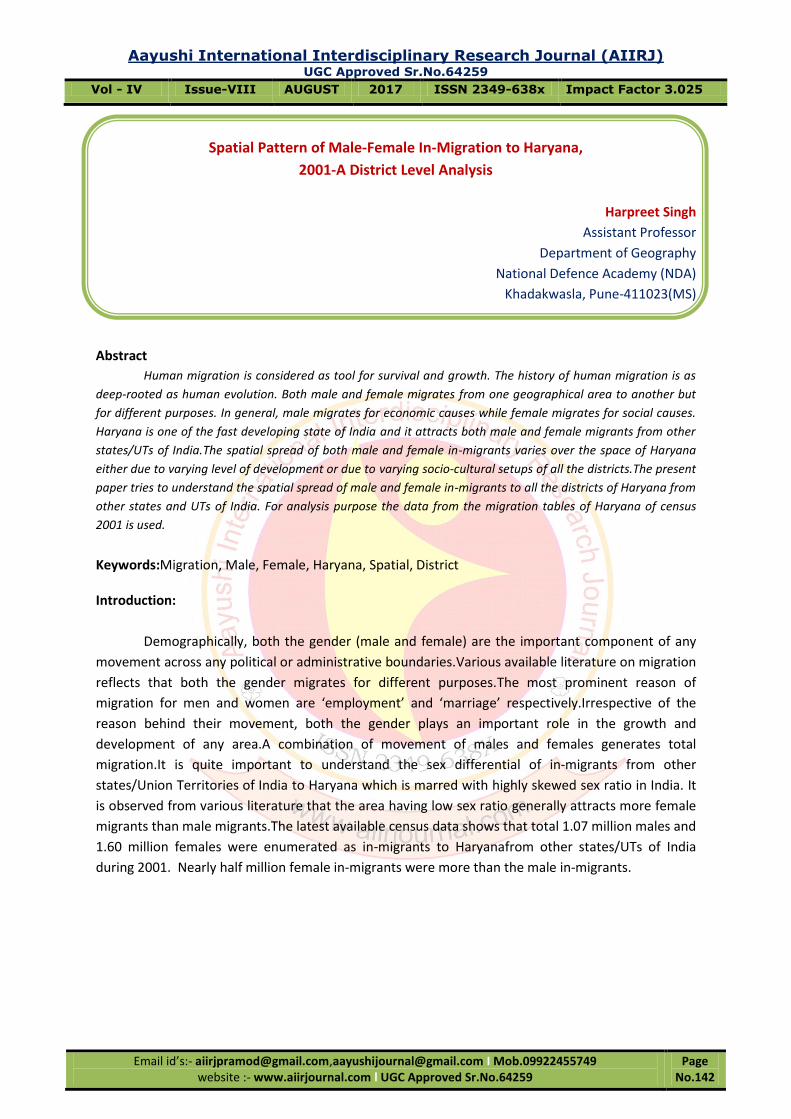
Spatial pattern of Male In-Migrants to Haryana-
Total 1.07 million males were enumerated as in-migrants to Haryana from other states/UTs
of India. Maximum number of male in-migrants were enumerated in district Faridabad i.e. 0.27
million. While the lowest number of in-migrants were enumerated in Mahendergarh district that is
9011 which is less than 1 percent.
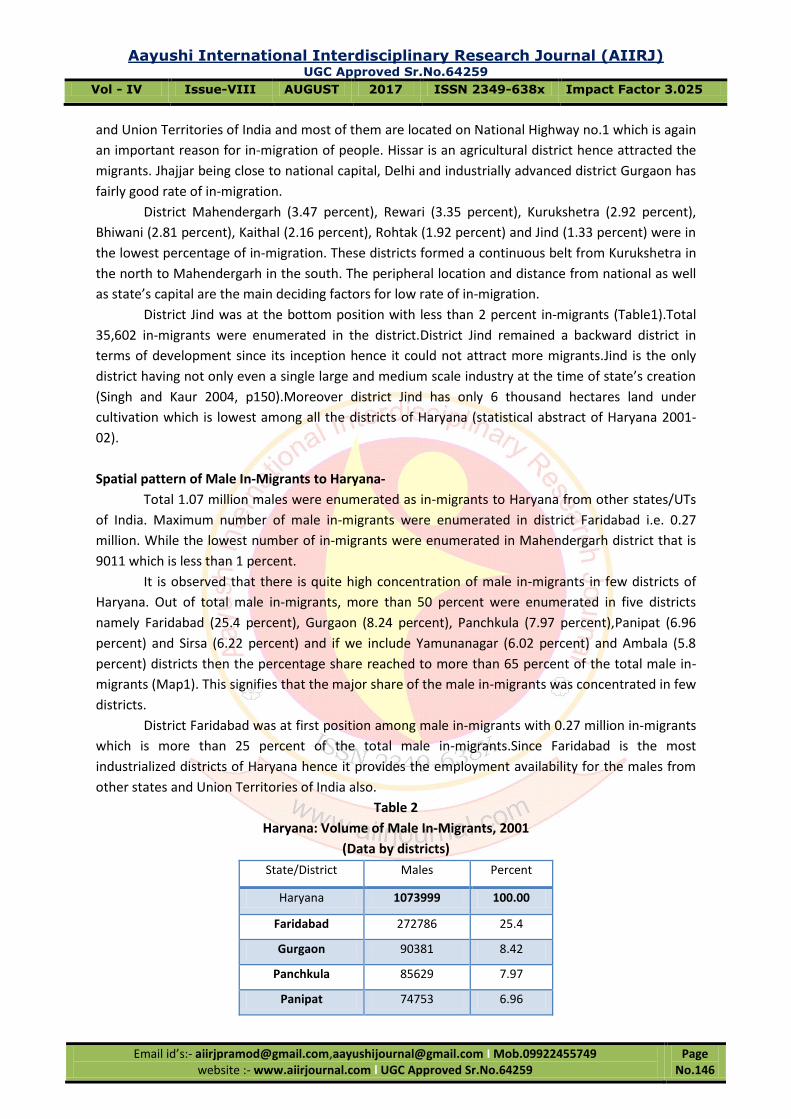
It is observed that there is quite high concentration of male in-migrants in few districts of
Haryana. Out of total male in-migrants, more than 50 percent were enumerated in five districts
namely Faridabad (25.4 percent), Gurgaon (8.24 percent), Panchkula (7.97 percent),Panipat (6.96
percent) and Sirsa (6.22 percent) and if we include Yamunanagar (6.02 percent) and Ambala (5.8
percent) districts then the percentage share reached to more than 65 percent of the total male in-
migrants (Map1). This signifies that the major share of the male in-migrants was concentrated in few
districts.
District Faridabad was at first position among male in-migrants with 0.27 million in-migrants
which is more than 25 percent of the total male in-migrants.Since Faridabad is the most
industrialized districts of Haryana hence it provides the employment availability for the males from
other states and Union Territories of India also.
Table 2
Haryana: Volume of Male In-Migrants, 2001
(Data by districts)
State/District Males Percent
Haryana 1073999 100.00
Faridabad 272786 25.4
Gurgaon 90381 8.42
Panchkula 85629 7.97
Panipat 74753 6.96
Aayushi International Interdisciplinary Research Journal (AIIRJ) UGC Approved Sr.No.64259
Vol - IV Issue-VIII AUGUST 2017 ISSN 2349-638x Impact Factor 3.025
Email id’s:- [email protected],[email protected] I Mob.09922455749 website :- www.aiirjournal.com l UGC Approved Sr.No.64259
Page No.147
Sirsa 66813 6.22
Yamunanagar 64694 6.02
Ambala 62334 5.8
Sonipat 49775 4.63
Hissar 46215 4.3
Jhajjar 45622 4.25
Karnal 44590 4.15
Fatehabad 33370 3.11
Kurukshetra 31545 2.94
Rewari 25189 2.35
Rohtak 21778 2.03
Bhiwani 18383 1.71
Kaithal 17405 1.62
Jind 13726 1.28
Mahendragarh 9011 0.84
Source:
(i) Census of India (2001): Table D 2, Migration Tables of Haryana, data available on CD.
Gurgaon had emerged as one of the most developed district of Haryana. Total 90,381 male
in-migrants were enumerated in Gurgaon district during 2001census (Table 2).Which is nearly 9

Aayushi International Interdisciplinary Research Journal (AIIRJ) UGC Approved Sr.No.64259
Vol - IV Issue-VIII AUGUST 2017 ISSN 2349-638x Impact Factor 3.025
Email id’s:- [email protected],[email protected] I Mob.09922455749 website :- www.aiirjournal.com l UGC Approved Sr.No.64259
Page No.148
percent of the total in-migrants. Both these districts were in top position among the total in-
migrants category.As per the statistical abstract of Haryana 2001-02, Gurgaon has the third largest
number of registered factories in Haryana i.e. 978 which leads to the male selective migration from
other states and Union Territories of India.
Gurgaon has also benefited due its location in the vicinity of National capital, Delhi from
where migration of males is quite high. Moreover Gurgaon was at second position in terms of
Human Development Index, 2001 (Human Development Report of Haryana, 2005).The newly formed
Panchkula district was at third position in term of male in-migration with 85,629 male in-migrants.
The nearness of Panchkula to the state capital, Chandigarh contributed to the high in-migration of
males.District Panipat was at fourth position with 74,753 male in-migrants which is nearly 7 percent
of the total in-migrants.The industrial development in Panipat attracted the male in-migrants from
other states and UTs of India.The easy accessibility due to its location on National Highway no.1 and
establishment of oil refinery which provides employment opportunities to male migrants results into
fairly high number of male in-migrants. Panipat was followed by district Sirsa with 66,813 in-
migrants. The main cause for male in-migration from other states and Union Territories of India is its
advancement in agricultural sector in which a large segment of migrated male is involved.Sirsa is an
agricultural district; it occupies first position in wheat production during 2000-01 by producing 10.15
lakh tones of wheat, which is 10.5 percent of total wheat production (Singh and Kaur, 2004). As per
the statistical abstract of Haryana 2001-02, the district has the highest percentage of the gross
irrigated area of the state that is 11.3 percent and has the highest number of male engaged as
agricultural labourer that is 43,715.Yamunanagar and Ambala were at sixth and seventh position
with 64,694 and 62,334 male in-migrants respectively.These two districts have a good industrial base
which attracted the male in-migrants from other states and Union Territories of India. As per the
statistical abstract of Haryana 2001-02, Yamunanagar has the second largest number of registered
working factories in Haryana.
Out of total 19 districts, six districts were in the medium category of male in-migrants.
Which included Sonipat (4.63 percent),Hissar(4.3 percent), Jhajjar (4.25 percent), Karnal (4.15
percent),Fatehabad (3.11 percent) and Kurukshetra (2.94 percent) (Map1).The districts which are
located in a continuous belt on the eastern side are benefitted being close to National Highway no.1
while the agricultural prosperity of Hissar and Fatehabad contributed to male in-migration.
The districts which are having interior location namely Rewari, Rohtak, Bhiwani, Kaithal, Jind
and Mahendragarh were in the lowest category (Map1).The peripheral location, industrial and
agricultural backwardness are the reasons for the less male in-migration from other states and
Union Territories of India.It is observed from the Human Development Index, 2001 that in term of
Gross Domestic Products all these districts are located at the lowest rank with Mahendergarh at the
bottom end; hence all these districts are termed as backward districts of Haryana.
Spatial pattern of Female In-Migration to Haryana-
Ravenstein’s laws of migration (1985) states that women are more mobile than men over
shorter than long distance.Therefore, the number of women migrants, moving over shorter distance
is likely to be higher than those of migrants moving over long distance.It is true in case of India,
where a significant share of female migration is associated with marriage due to the prevailing
cultural system.In the available literature till 1980s, the study of female migration was given very
less importance than its counterpart male migrants. Moreover a large number of female migrates
Aayushi International Interdisciplinary Research Journal (AIIRJ) UGC Approved Sr.No.64259
Vol - IV Issue-VIII AUGUST 2017 ISSN 2349-638x Impact Factor 3.025
Email id’s:- [email protected],[email protected] I Mob.09922455749 website :- www.aiirjournal.com l UGC Approved Sr.No.64259
Page No.149
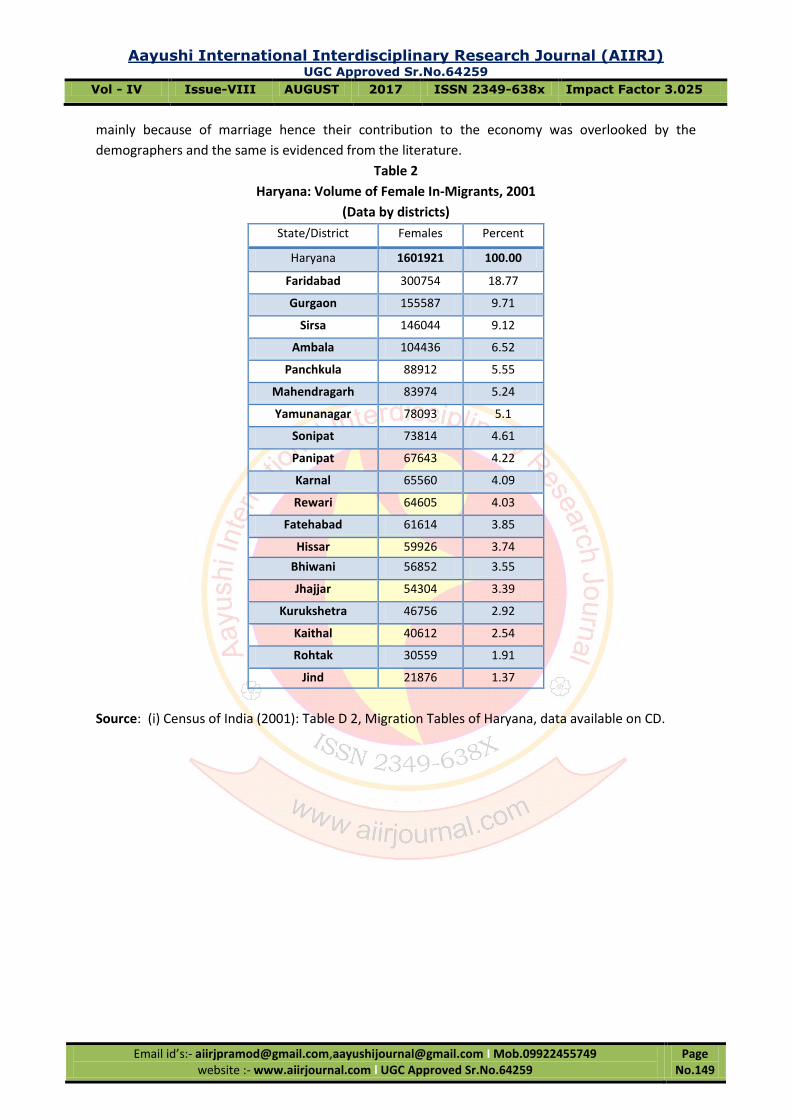
mainly because of marriage hence their contribution to the economy was overlooked by the
demographers and the same is evidenced from the literature.
Table 2
Haryana: Volume of Female In-Migrants, 2001
(Data by districts)
State/District Females Percent
Haryana 1601921 100.00
Faridabad 300754 18.77
Gurgaon 155587 9.71
Sirsa 146044 9.12
Ambala 104436 6.52
Panchkula 88912 5.55
Mahendragarh 83974 5.24
Yamunanagar 78093 5.1
Sonipat 73814 4.61
Panipat 67643 4.22
Karnal 65560 4.09
Rewari 64605 4.03
Fatehabad 61614 3.85
Hissar 59926 3.74
Bhiwani 56852 3.55
Jhajjar 54304 3.39
Kurukshetra 46756 2.92
Kaithal 40612 2.54
Rohtak 30559 1.91
Jind 21876 1.37
Source: (i) Census of India (2001): Table D 2, Migration Tables of Haryana, data available on CD.

Aayushi International Interdisciplinary Research Journal (AIIRJ) UGC Approved Sr.No.64259
Vol - IV Issue-VIII AUGUST 2017 ISSN 2349-638x Impact Factor 3.025
Email id’s:- [email protected],[email protected] I Mob.09922455749 website :- www.aiirjournal.com l UGC Approved Sr.No.64259
Page No.150
The lowest sex ratio in Haryana attracts the females from other states/Union Territories of
India. It is a general perception that the areas with low sex ratio may pull females, as the demand for
brides is higher in those areas.Kaur (2004), for example, examines the phenomenon of long distance
marriages to very high male dominating areas.
Around 1.60 million females were enumerated as in-migrants to Haryana during 2001
census. Out of total 19 districts of Haryana, six districts comprises more than 50 percent of the total
enumerated female in-migrants namely Faridabad (18.77 percent), Gurgaon (9.71 percent), Sirsa
(9.12 percent), Ambala (6.52 percent),Panchkula (5.55 percent) and Mahendergarh (5.24 percent)
(Table 2 & Map 2).
The largest number of female in-migrants were enumerated in Faridabad that is 0.30 million
which was nearly 19 percent of the total enumerated female in-migrants.It is a well-known fact that
district Faridabad is one of the highly developed district of Haryana with a very good industrial base
and infrastructure.As mentioned earlier the district has the largest number of registered working
factories which attracts the migrants.Gurgaon being one of the integral part of National Capital
Region (NCR) has attracted 0.15 million females from other states and union territories of India
which was nearly half of the total enumerated females in Faridabad. As per statistical abstract of
Haryana 2001-02,Gurgaon has maximum number of females engaged in household industry that is
7916 during 2001.With 0.14 million female in-migration district Sirsa was at third position. District
Sirsa was a part of cotton crop producing belt where more female workers were engaged as
compared to male.
Ambala and Panchkula were at fourth and fifth position with 0.10 million and 88,912 female
in-migration during 2001 census respectively.Ambala being located on National Highway no.1 has
easily accessible for female from other states and Union Territories.While Panchkula has the

Aayushi International Interdisciplinary Research Journal (AIIRJ) UGC Approved Sr.No.64259
Vol - IV Issue-VIII AUGUST 2017 ISSN 2349-638x Impact Factor 3.025
Email id’s:- [email protected],[email protected] I Mob.09922455749 website :- www.aiirjournal.com l UGC Approved Sr.No.64259
Page No.151
advantage of nearness to state’s capital, Chandigarh.Mahendergarh with 83,974 female in-migrants
was at sixth position. More numbers of female in-migration as compare to males can be related to
the sex ratio of the district. In term of sex ratio the district ranked first among all the districts of
Haryana with 919 female per 1000 males during 2001census (Statistical abstract of Haryana,
2001).The general sex ratio of the district has increased from 910 in 1991 to 919 in 2001 whereas the
Child sex ratio of Mahendergarh has reduced during the same period from 892 to 814. It may be
correlated with the fact that the migration of more number of females as compare to males
enhanced the general sex ratio during 1991-2001.Yamunanagar with 78,093 female in-migrants was
holding seventh position among all the districts of Haryana which was 5.1 percent of the total
enumerated female in-migrants.
Out of 12 districts total seven districts were in the medium category of female in-migration.
These were Sonipat (4.61percent), Panipat (4.22 percent), Karnal (4.09 percent), Rewari (4.03
percent), Fatehabad (3.85 percent), Hissar (3.74 percent) and Bhiwani (3.55 percent). Among these
seven district Sonipat, Panipat and Karnal are located on National Highway no.1 which connect
these districts with other states and union territories of India hence these districts has fairly high
percentage of female in-migration.
The remaining five districts were in the lowest category of female in-migration. These were
Jhajjar, Kurukshetra, Kaithal, Rohtak and Jind. As observed from the map 2, all these district has
central location. The level of development is less in these districts hence they does not provide any
opportunities to the outsiders.
Conclusion-
The census data of migration is available upto district level only hence district wise spatial
pattern of males and females in-migrants has been analyzedin this paper.It is observed that the
spatial pattern of in-migration follows the level of industrial and agriculture development.Because
the level of development of any district is one of the deciding factor for employment opportunities
to the migrants. The respective location of each district also decides the rate of in-migration. Hence,
it is noticed that the districts which are in close proximity to the national and state capital has
comparatively more rate of in-migration of both males and females and the districts which has
peripheral and interior location has comparatively low rate of in-migration.The high contract of
male-femalein-migration is observed in district Mahendergarh.Mahendergarh has bottom location
among male in-migrants while it is categorized among high rate of female in-migration districts.It is
because of the fact that the Mahendergarhis one of the backward district of Haryana hence does not
attracts male migrants but because of similar cultural setup with the border districts of Rajasthan it
received more number of female as marriage migrants.
References-
i) Census of India (2001): Haryana census, data available on CD.
ii) Census of India (2011): Haryana census, data available on CD.
iii) Chandna R.C. (1996): “Development and Population Growth: The Indian Experience”,
Population Geography, Vol. 18, Nos. 1 & 2, June-December 1996, pp. 9-26.
iv) Chandna, R.C. (2006): Geography of Population, Kalyani Publishers, New Delhi, p.253.
v) Economic survey of Haryana (2014-15): Department of economic and statistical analysis,Haryana
yojanabhawan, sector-4, Panchkula, p.3.

Aayushi International Interdisciplinary Research Journal (AIIRJ) UGC Approved Sr.No.64259
Vol - IV Issue-VIII AUGUST 2017 ISSN 2349-638x Impact Factor 3.025
Email id’s:- [email protected],[email protected] I Mob.09922455749 website :- www.aiirjournal.com l UGC Approved Sr.No.64259
Page No.152
vi) Ganguli, B.N.(1973): “Population and Development”, p.54.
vii) Ghosh, B. (1992): “Migration-Development Linkages: Some Specific Issues and Practical Policy
Measures”, International Migration, Vol. 30, pp. 423-56.
viii) Ghosh, J. (2010): “Migration and Gender Empowerment: Emerging Issues”,in Rajan S.I.(ed),
Governance and Labour Migration, India Migration report 2010, Routledge, New Delhi, pp. 135-163.
ix) Ghosh, S. (2007): The impact of immigration of West Bengal, 1947-1971, Unpublished Ph. D. Thesis,
Centre for Historical Studies, Jawaharlal Nehru University, New Delhi.
x) Gill, M.S. (1981): “Patterns of Migration in an under developed Tract: Hissar district of Haryana, 1951-
71”, Geographical Review of India, Vol. 43, No. 2, March, pp. 105 - 121.
xi) Haryana Development Report (2005): Planning commission, New Delhi, p. 37, 130.
xii) Haryana Development Report (2009): Planning commission, New Delhi, p. 131-32.
xiii) Human Development Report (2005): “Human Development Report of Haryana”, pp.40-44, and 57.
xiv) Kaur, Ravinder. 2004. “Across-Region Marriages: Poverty, Female Migration and the Sex Ratio.”
Economic and Political Weekly 39 (25):pp. 2595–2603.
xv) Ravenstein, E.G. (1885): “The Laws of Migration”, Journal of the Royal Statistical Society, Vol. 48, pp.
167-227.
xvi) Ravenstein, E.G. (1889): “The Laws of Migration”, Journal of the Royal Statistical Society, Vol. 52, pp.
214.
xvii) Singh M. and Kaur H. (2004): “Economic Development of Haryana-An Era of Prosperity”, Deep & Deep
Publication, New Delhi, pp. 105,143,145-150.
xviii) Statistical Abstract of Haryana (2001-02): “State statistical abstract of Haryana” Department of
Economic and statistical analysis, Haryana, pp. 42, 59, 64-65,149-150, 282, 385.