Embed Size (px)
Citation preview
Immune checkpoint inhibition in melanoma
John Haanen
ESMO I-O Preceptorship Lugano 2018
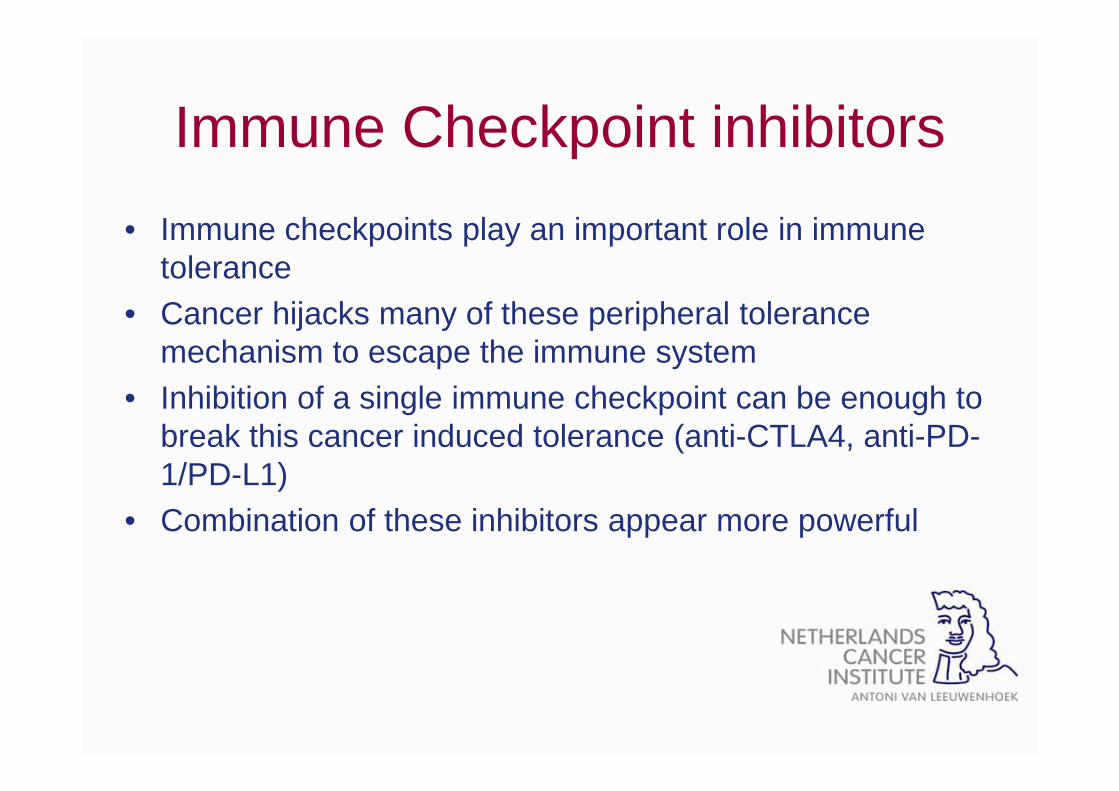
Immune Checkpoint inhibitors
• Immune checkpoints play an important role in immune tolerance
• Cancer hijacks many of these peripheral tolerance mechanism to escape the immune system
• Inhibition of a single immune checkpoint can be enough to break this cancer induced tolerance (anti-CTLA4, anti-PD-1/PD-L1)
• Combination of these inhibitors appear more powerful
“Melanoma has become from a disease that gave cancer a bad name to a ‘model’
disease for I-O”
Current I-O treatment options for melanoma– Stage IIII disease
• Neo-adjuvant/adjuvant trials
– Unresectable stage IIIc and stage IV disease
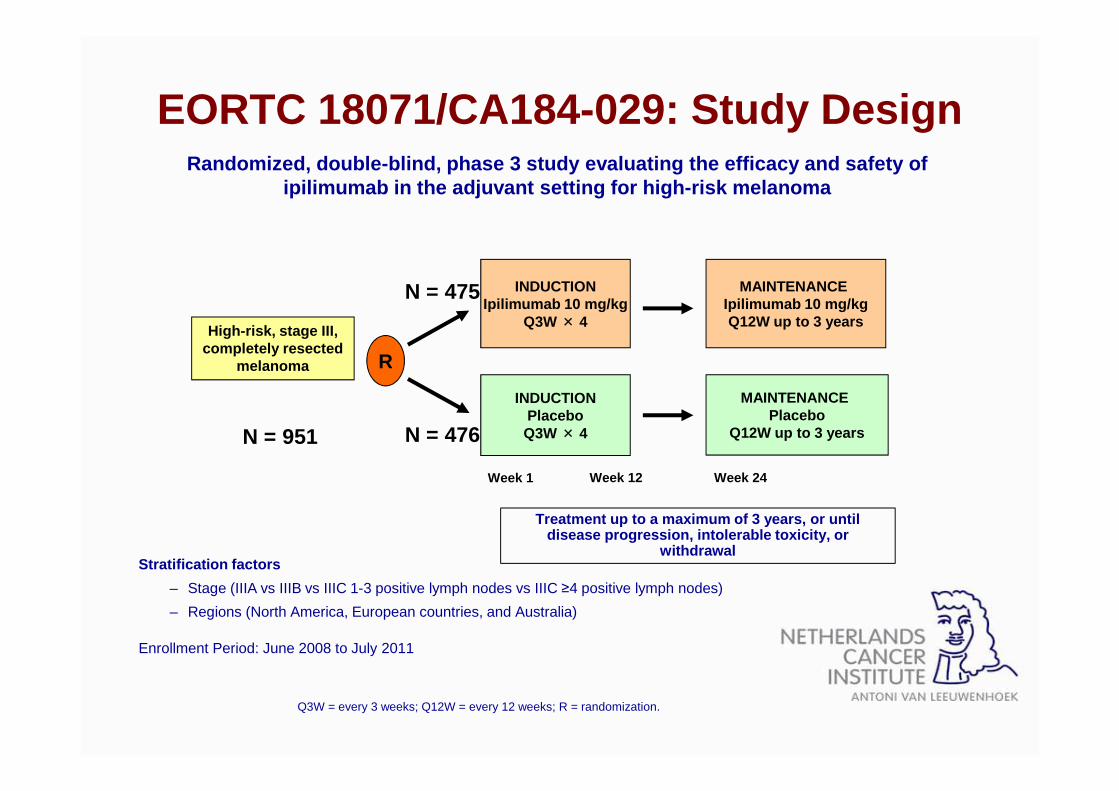
EORTC 18071/CA184-029: Study Design
Stratification factors
– Stage (IIIA vs IIIB vs IIIC 1-3 positive lymph nodes vs IIIC ≥4 positive lymph nodes)
– Regions (North America, European countries, and Australia)
Enrollment Period: June 2008 to July 2011
Randomized, double-blind, phase 3 study evaluating the efficacy and safety of ipilimumab in the adjuvant setting for high-risk me lanoma
INDUCTIONIpilimumab 10 mg/kg
Q3W × 4High-risk, stage III,
completely resected melanoma
INDUCTIONPlaceboQ3W × 4
R
MAINTENANCE Ipilimumab 10 mg/kgQ12W up to 3 years
MAINTENANCE Placebo
Q12W up to 3 years
Treatment up to a maximum of 3 years, or until disease progression, intolerable toxicity, or
withdrawal
N = 475
N = 476
Week 1 Week 12 Week 24
N = 951
Q3W = every 3 weeks; Q12W = every 12 weeks; R = randomization.
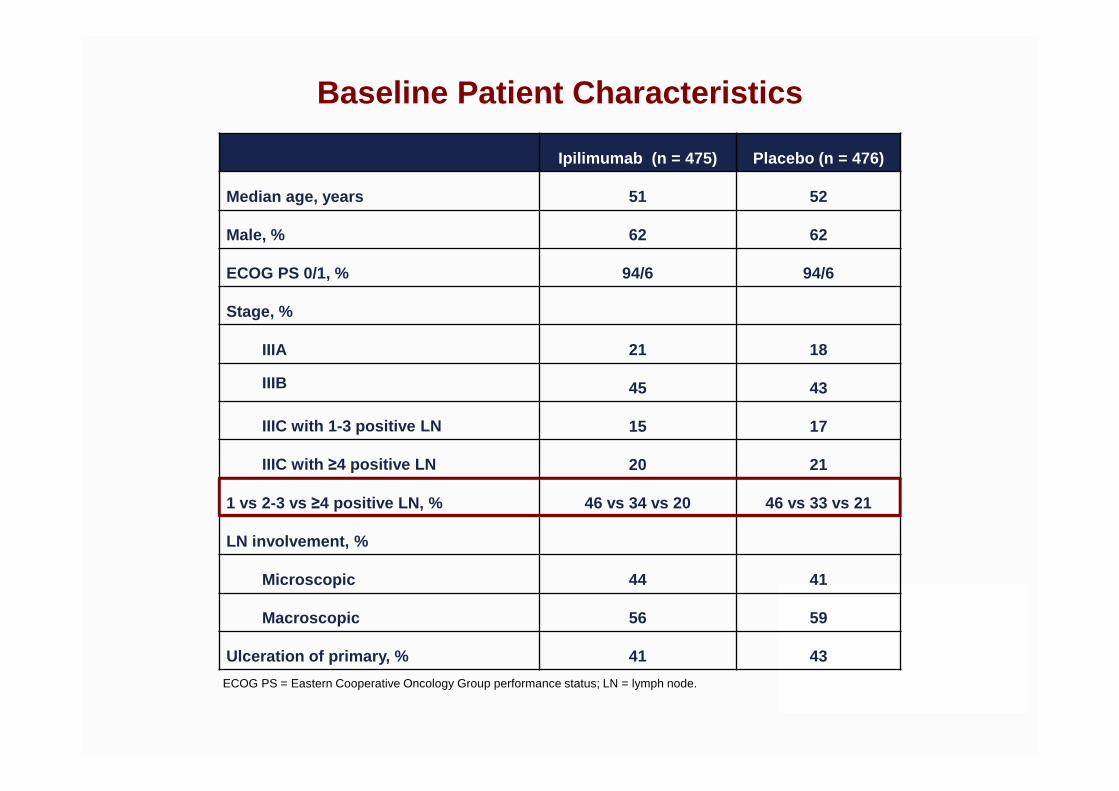
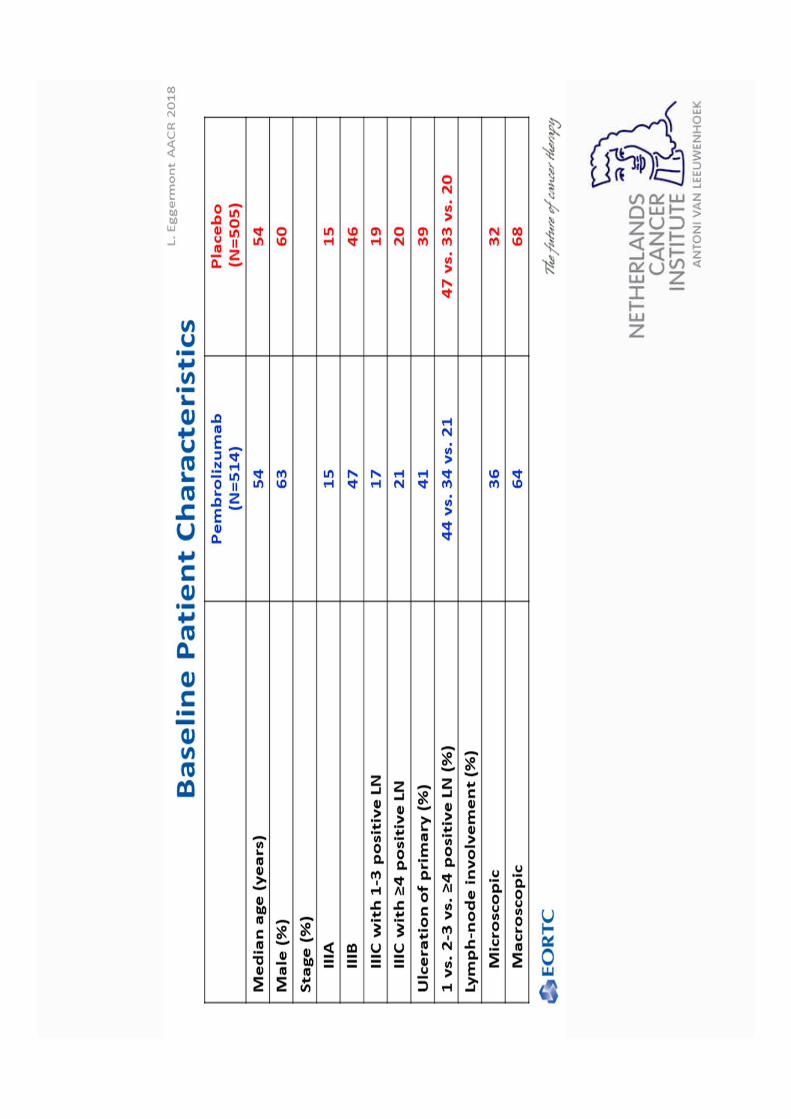
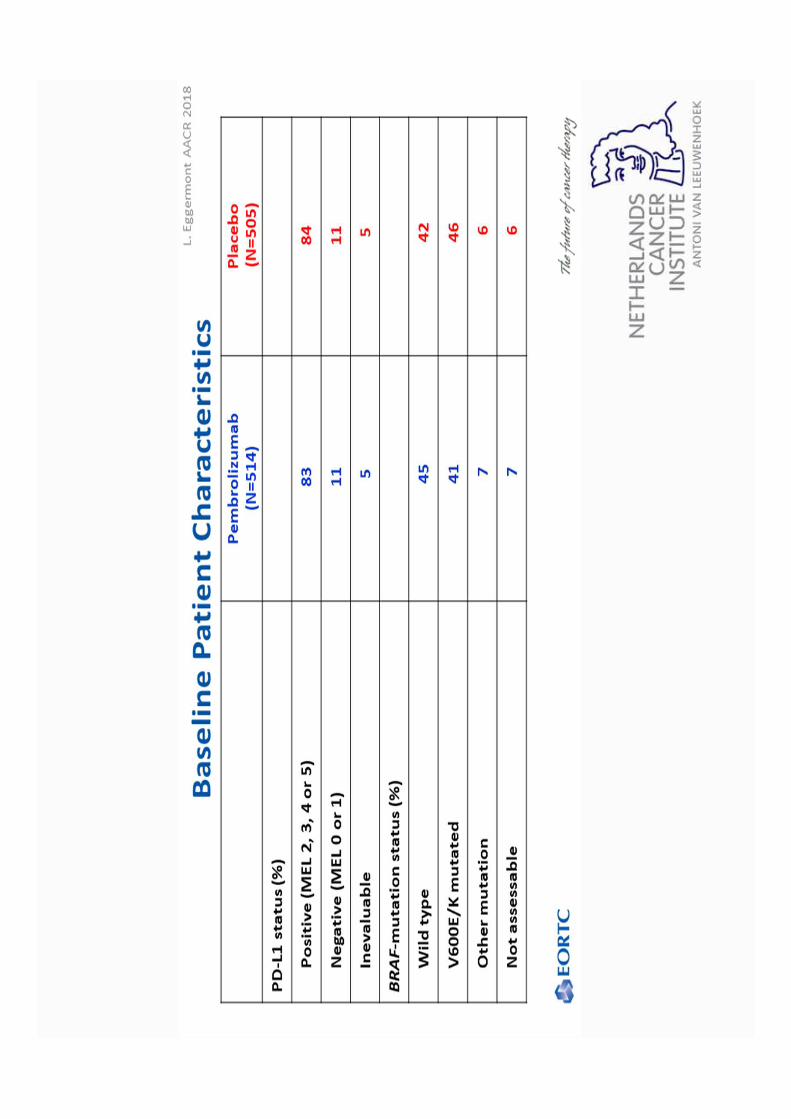
Baseline Patient Characteristics
Ipilimumab (n = 475) Placebo (n = 476)
Median age, years 51 52
Male, % 62 62
ECOG PS 0/1, % 94/6 94/6
Stage, %
IIIA 21 18
IIIB 45 43
IIIC with 1-3 positive LN 15 17
IIIC with ≥4 positive LN 20 21
1 vs 2-3 vs ≥4 positive LN, % 46 vs 34 vs 20 46 vs 33 vs 21
LN involvement, %
Microscopic 44 41
Macroscopic 56 59
Ulceration of primary, % 41 43
ECOG PS = Eastern Cooperative Oncology Group performance status; LN = lymph node.
aStratified by stage provided at randomization.CI = confidence interval.
Pat
ient
s A
live
and
With
out
Rec
urre
nce
(%
)
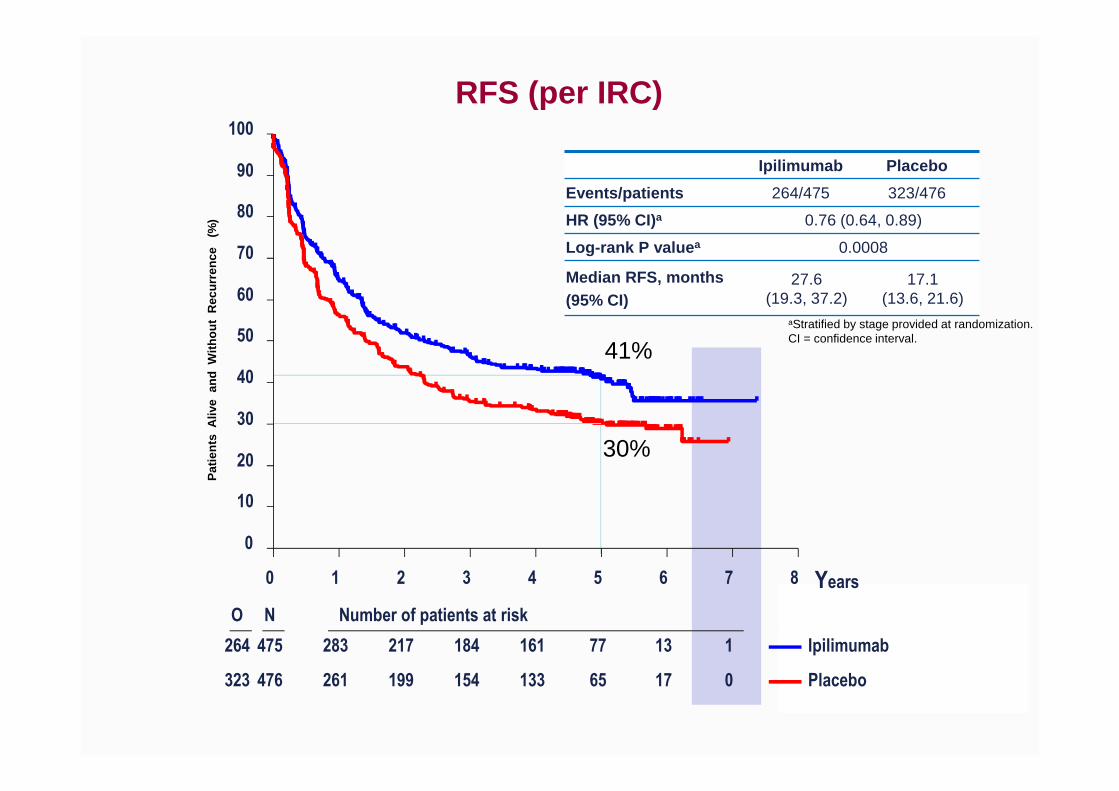
Ipilimumab Placebo
Events/patients 264/475 323/476
HR (95% CI)a 0.76 (0.64, 0.89)
Log-rank P value a 0.0008
Median RFS, months(95% CI)
27.6 (19.3, 37.2)
17.1 (13.6, 21.6)
RFS (per IRC)
41%
30%
Years0 1 2 3 4 5 6 7 8
0
10
20
30
40
50
60
70
80
90
100
O N Number of patients at risk
264 475 283 217 184 161 77 13 1
323 476 261 199 154 133 65 17 0
Ipilimumab
Placebo

Pat
ient
s A
live
(%
)
aStratified by stage provided at randomization.
Ipilimumab Placebo
Deaths/patients 162/475 214/476
HR (95.1% CI)a 0.72 (0.58, 0.88)
Log-rank P value a 0.001
OS
65%
54%
Years0 1 2 3 4 5 6 7 8
0
10
20
30
40
50
60
70
80
90
100
O N Number of patients at risk
162 475 431 369 325 290 199 62 4
214 476 413 348 297 273 178 58 8
Ipilimumab
Placebo
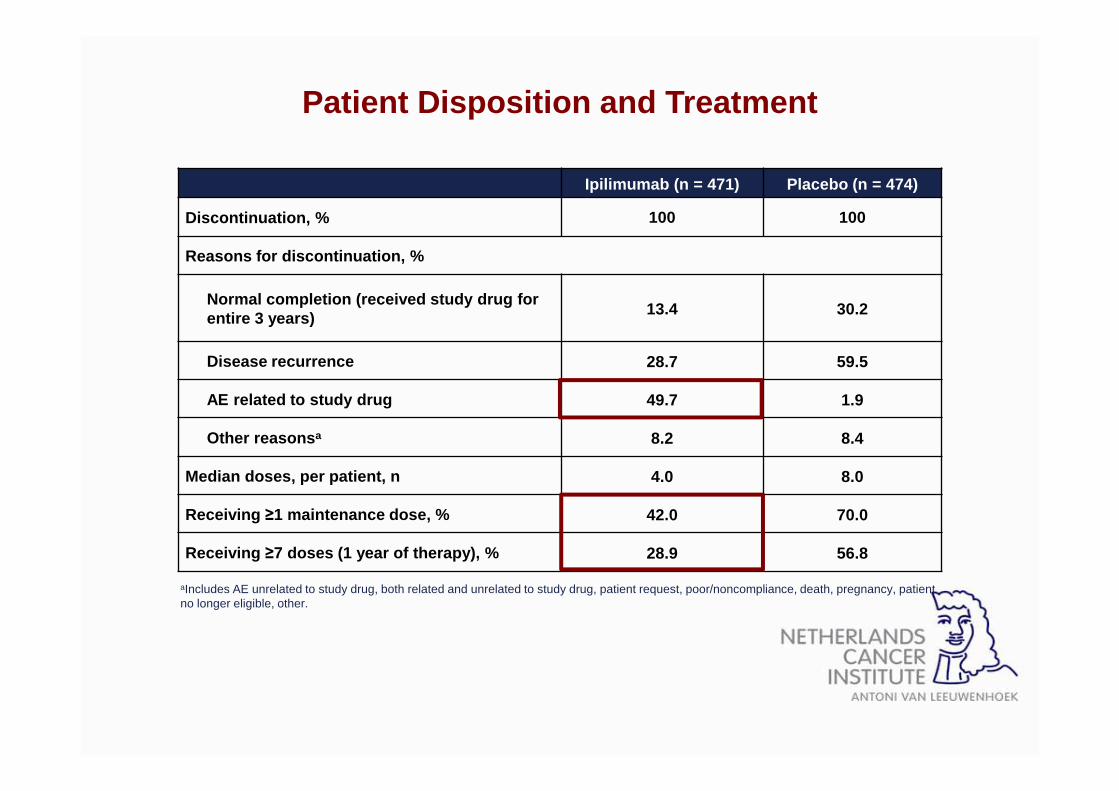
Patient Disposition and Treatment
Ipilimumab (n = 471) Placebo (n = 474)
Discontinuation, % 100 100
Reasons for discontinuation, %
Normal completion (received study drug for entire 3 years) 13.4 30.2
Disease recurrence 28.7 59.5
AE related to study drug 49.7 1.9
Other reasons a 8.2 8.4
Median doses, per patient, n 4.0 8.0
Receiving ≥1 maintenance dose, % 42.0 70.0
Receiving ≥7 doses (1 year of therapy), % 28.9 56.8
aIncludes AE unrelated to study drug, both related and unrelated to study drug, patient request, poor/noncompliance, death, pregnancy, patient no longer eligible, other.
Adjuvant Therapy With Nivolumab Versus Ipilimumab After Complete Resection of Stage III/IV Melanoma: A Randomized, Double-blind, Phase 3
Trial (CheckMate 238) Jeffrey Weber,1 Mario Mandala,2 Michele Del Vecchio,3 Helen Gogas,4 Ana M. Arance,5
C. Lance Cowey,6 Stéphane Dalle,7 Michael Schenker,8 Vanna Chiarion-Sileni,9 Ivan Marquez-Rodas,10
Jean-Jacques Grob,11 Marcus Butler,12 Mark R. Middleton,13 Michele Maio,14 Victoria Atkinson,15
Paola Queirolo,16 Veerle de Pril,17 Anila Qureshi,17 James Larkin,18* Paolo A. Ascierto19*
1NYU Perlmutter Cancer Center, New York, New York, USA; 2Papa Giovanni XIII Hospital, Bergamo, Italy; 3Medical Oncology, National Cancer Institute, Milan, Italy; 4University of Athens, Athens, Greece; 5Hospital Clínic de Barcelona, Barcelona, Spain; 6Texas Oncology-Baylor Cancer Center, Dallas, Texas, USA; 7Hospices Civils de Lyon, Pierre Bénite, France; 8Oncology Center Sf Nectarie Ltd., Craiova, Romania; 9Oncology
Institute of Veneto IRCCS, Padua, Italy; 10General University Hospital Gregorio Marañón, Madrid, Spain; 11Hôpital de la Timone, Marseille, France; 12Princess Margaret Cancer Centre, Toronto, Ontario, Canada; 13Churchill Hospital, Oxford, United Kingdom; 14Center for Immuno-Oncology, University Hospital of Siena, Istituto Toscano Tumori, Siena, Italy; 15Gallipoli Medical Research Foundation and Princess Alexandra Hospital,
Woolloongabba, and University of Queensland, Greenslopes, Queensland, Australia; 16IRCCS San Martino-IST, Genova, Italy; 17Bristol-Myers Squibb, Princeton, New Jersey, USA; 18Royal Marsden NHS Foundation Trust, London, UK; 19Istituto Nazionale Tumori Fondazione Pascale,
Naples, Italy; *Contributed equally to this study.
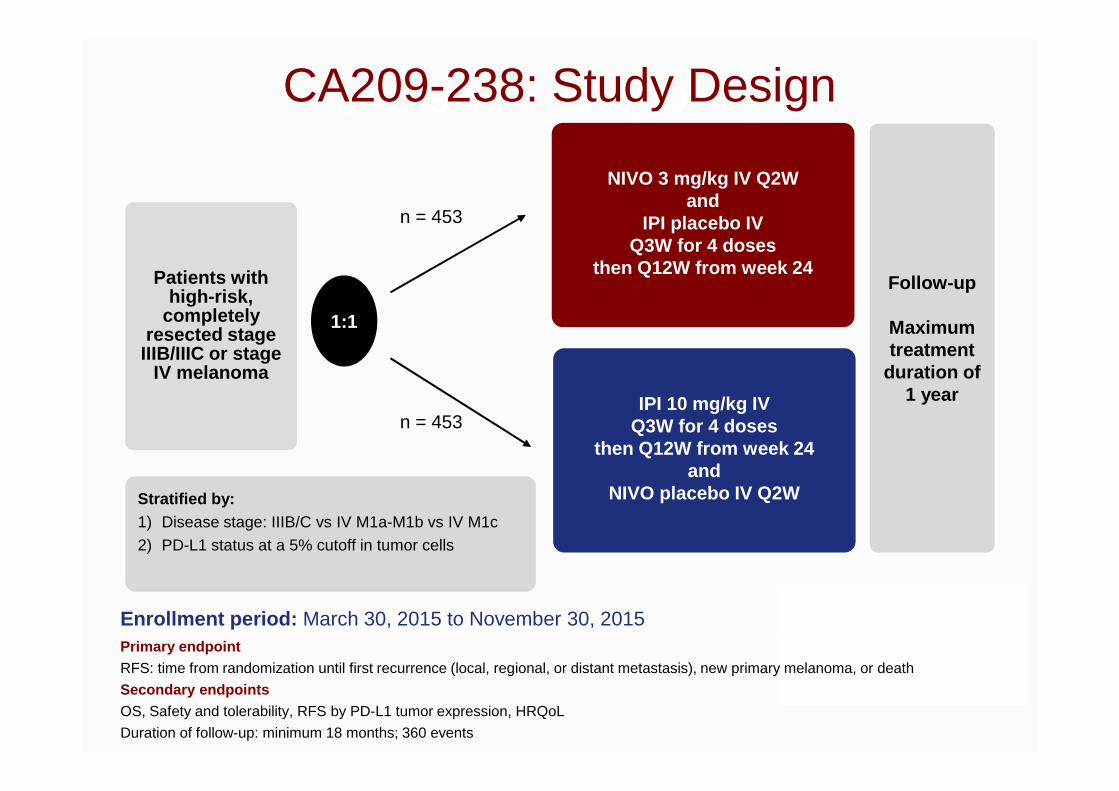
CA209-067: Study Design CA209-238: Study Design
Patients with high-risk,
completely resected stage
IIIB/IIIC or stage IV melanoma
Enrollment period: March 30, 2015 to November 30, 2015
Follow-up
Maximum treatment
duration of 1 year
NIVO 3 mg/kg IV Q2W and
IPI placebo IV Q3W for 4 doses
then Q12W from week 24
IPI 10 mg/kg IV Q3W for 4 doses
then Q12W from week 24 and
NIVO placebo IV Q2W
1:1
n = 453
n = 453
Stratified by: 1) Disease stage: IIIB/C vs IV M1a-M1b vs IV M1c
2) PD-L1 status at a 5% cutoff in tumor cells
Primary endpointRFS: time from randomization until first recurrence (local, regional, or distant metastasis), new primary melanoma, or death
Secondary endpointsOS, Safety and tolerability, RFS by PD-L1 tumor expression, HRQoL
Duration of follow-up: minimum 18 months; 360 events
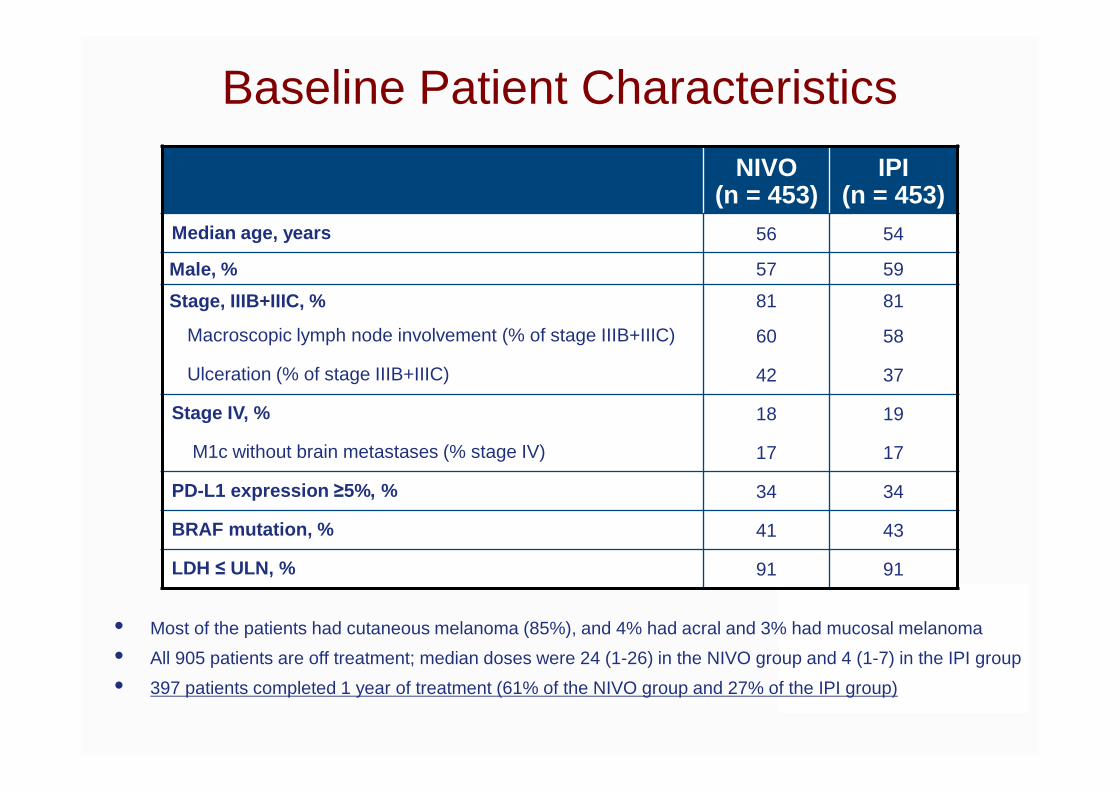
Baseline Patient Characteristics
• Most of the patients had cutaneous melanoma (85%), and 4% had acral and 3% had mucosal melanoma
• All 905 patients are off treatment; median doses were 24 (1-26) in the NIVO group and 4 (1-7) in the IPI group
• 397 patients completed 1 year of treatment (61% of the NIVO group and 27% of the IPI group)
NIVO(n = 453)
IPI(n = 453)
Median age, years 56 54
Male, % 57 59
Stage, IIIB+IIIC, % 81 81
Macroscopic lymph node involvement (% of stage IIIB+IIIC) 60 58
Ulceration (% of stage IIIB+IIIC) 42 37
Stage IV, % 18 19
M1c without brain metastases (% stage IV) 17 17
PD-L1 expression ≥5%, % 34 34
BRAF mutation, % 41 43
LDH ≤ ULN, % 91 91
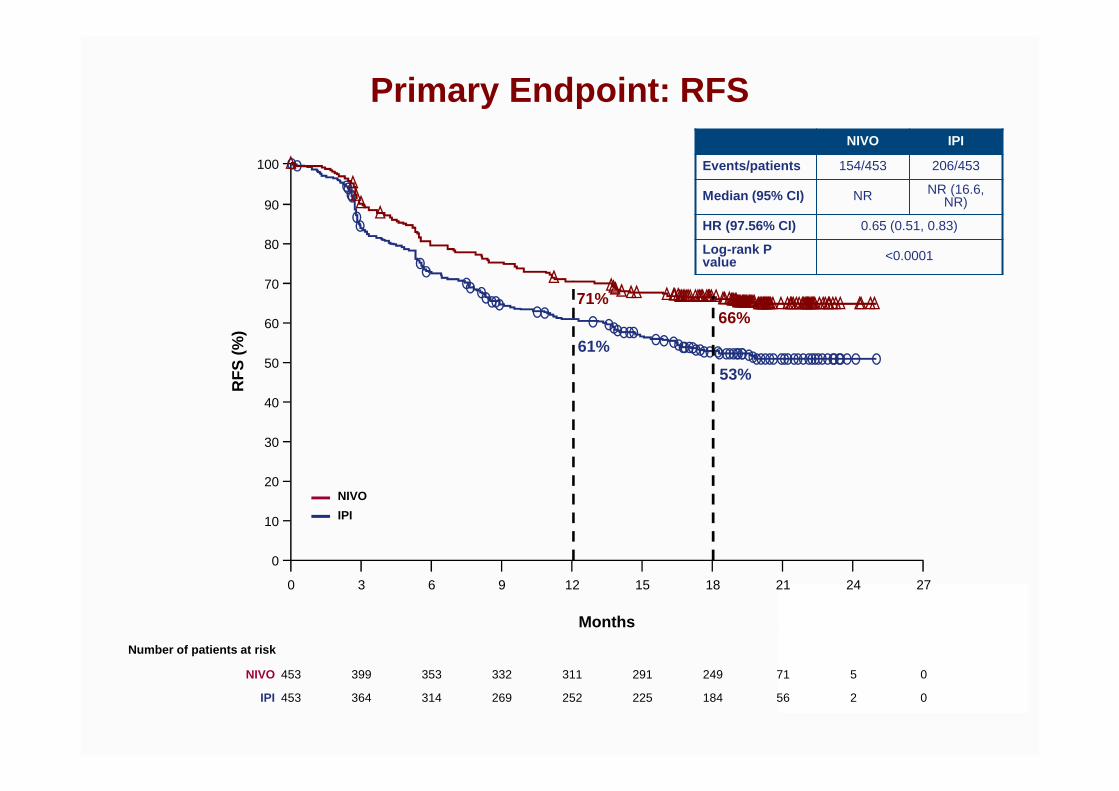
Primary Endpoint: RFS
RF
S (
%)
Months
0
10
20
30
40
50
60
70
80
90
100
0 6 12 18 24 273 9 15 21
453 353 311 249 5 0399 332 291 71NIVO
453 314 252 184 2 0364 269 225 56IPI
Number of patients at risk
NIVO
IPI
NIVO IPI
Events/patients 154/453 206/453
Median (95% CI) NR NR (16.6, NR)
HR (97.56% CI) 0.65 (0.51, 0.83)
Log-rank Pvalue <0.0001
66%
53%
71%
61%
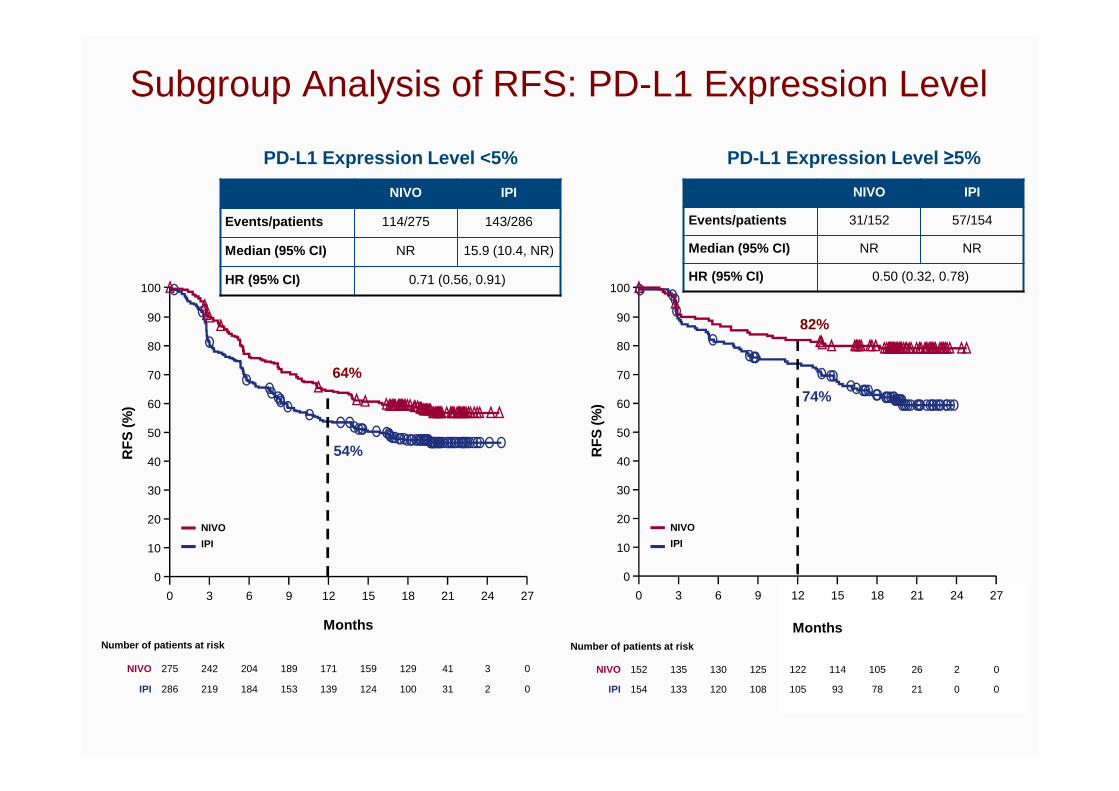
PD-L1 Expression Level <5% PD-L1 Expression Level ≥5%
NIVO IPI
Events/patients 114/275 143/286
Median (95% CI) NR 15.9 (10.4, NR)
HR (95% CI) 0.71 (0.56, 0.91)
NIVO IPI
Events/patients 31/152 57/154
Median (95% CI) NR NR
HR (95% CI) 0.50 (0.32, 0.78)
Subgroup Analysis of RFS: PD-L1 Expression Level R
FS
(%)
Months
0
10
20
30
40
50
60
70
80
90
100
0 6 12 18 24 273 9 15 21
NIVO
IPI
275 204 171 129 3 0242 189 159 41NIVO
286 184 139 100 2 0219 153 124 31IPI
Number of patients at risk
RF
S (%
)
Months
152 130 122 105 2 0135 125 114 26NIVO
154 120 105 78 0 0133 108 93 21IPI
Number of patients at risk
64%
54%
0
10
20
30
40
50
60
70
80
90
100
0 6 12 18 24 273 9 15 21
NIVO
IPI
82%
74%
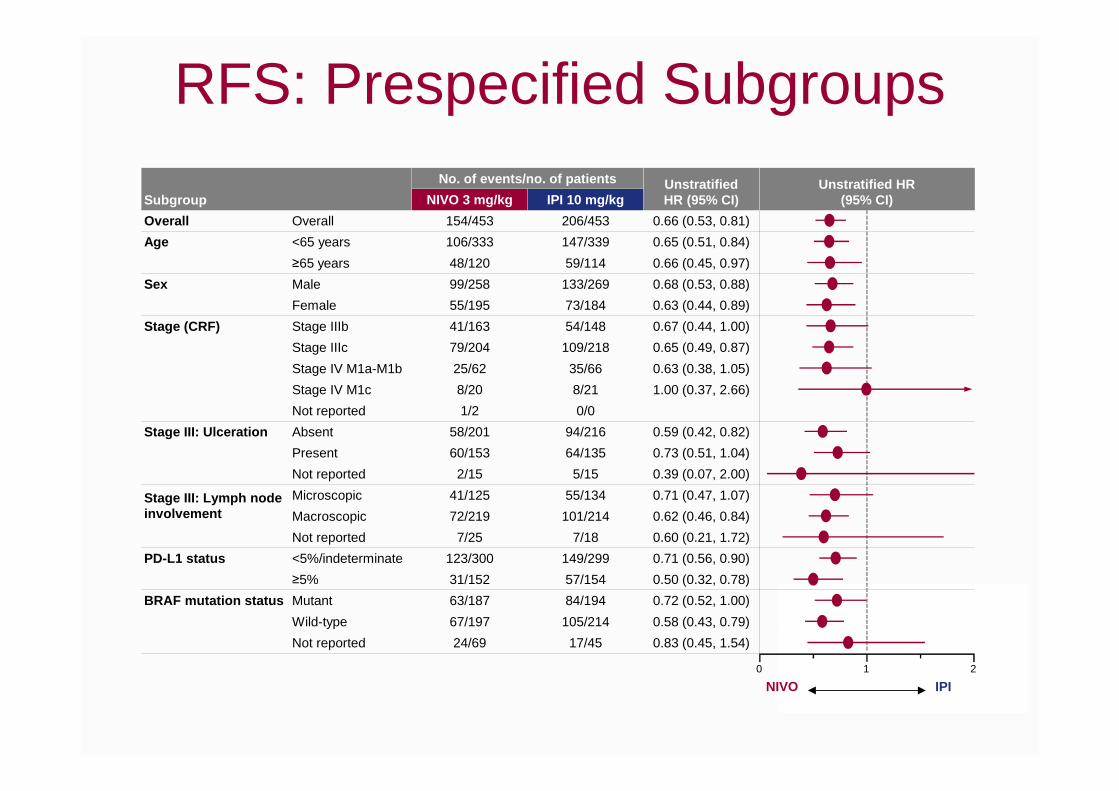
RFS: Prespecified Subgroups
Subgroup
No. of events/no. of patients UnstratifiedHR (95% CI)
Unstratified HR(95% CI)NIVO 3 mg/kg IPI 10 mg/kg
Overall Overall 154/453 206/453 0.66 (0.53, 0.81)
Age <65 years 106/333 147/339 0.65 (0.51, 0.84)
≥65 years 48/120 59/114 0.66 (0.45, 0.97)
Sex Male 99/258 133/269 0.68 (0.53, 0.88)
Female 55/195 73/184 0.63 (0.44, 0.89)
Stage (CRF) Stage IIIb 41/163 54/148 0.67 (0.44, 1.00)
Stage IIIc 79/204 109/218 0.65 (0.49, 0.87)
Stage IV M1a-M1b 25/62 35/66 0.63 (0.38, 1.05)
Stage IV M1c 8/20 8/21 1.00 (0.37, 2.66)
Not reported 1/2 0/0
Stage III: Ulceration Absent 58/201 94/216 0.59 (0.42, 0.82)
Present 60/153 64/135 0.73 (0.51, 1.04)
Not reported 2/15 5/15 0.39 (0.07, 2.00)
Stage III: Lymph node involvement
Microscopic 41/125 55/134 0.71 (0.47, 1.07)
Macroscopic 72/219 101/214 0.62 (0.46, 0.84)
Not reported 7/25 7/18 0.60 (0.21, 1.72)
PD-L1 status <5%/indeterminate 123/300 149/299 0.71 (0.56, 0.90)
≥5% 31/152 57/154 0.50 (0.32, 0.78)
BRAF mutation status Mutant 63/187 84/194 0.72 (0.52, 1.00)
Wild-type 67/197 105/214 0.58 (0.43, 0.79)
Not reported 24/69 17/45 0.83 (0.45, 1.54)
NIVO IPI0 1 2
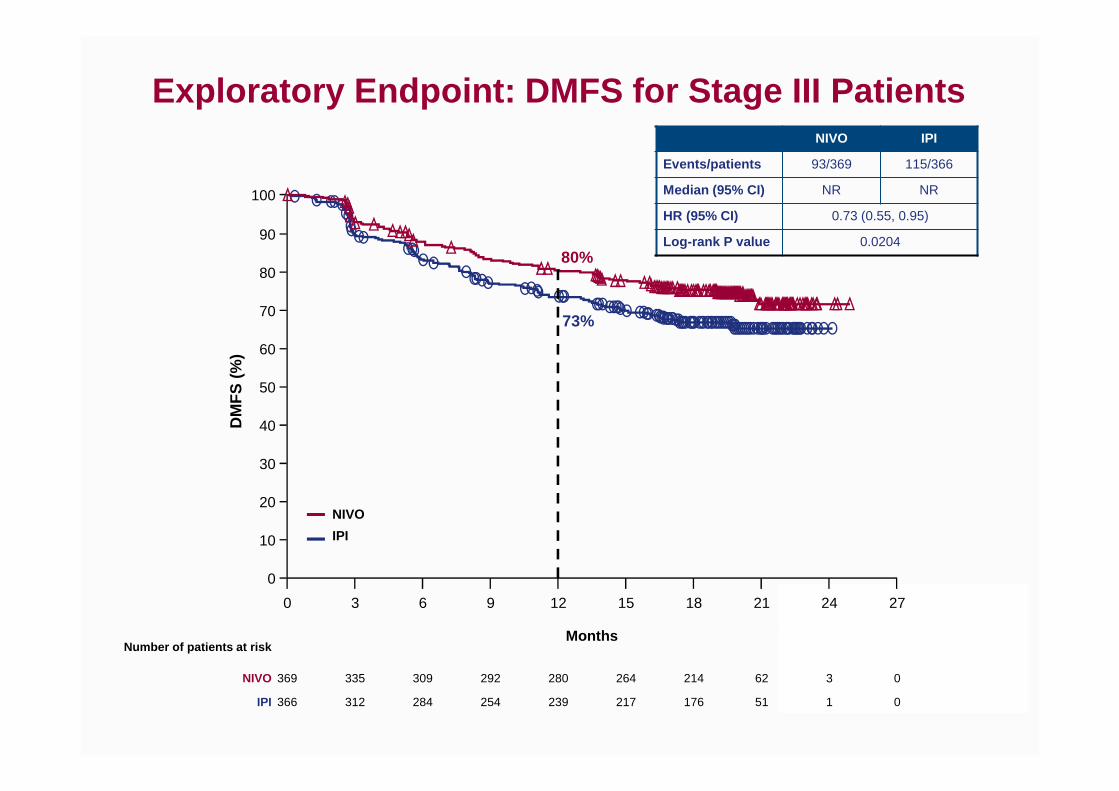
Exploratory Endpoint: DMFS for Stage III Patients
DM
FS
(%
)
Months
0
10
20
30
40
50
60
70
80
90
100
0 6 12 18 24 273 9 15 21
369 309 280 214 3 0335 292 264 62NIVO
366 284 239 176 1 0312 254 217 51IPI
Number of patients at risk
NIVO
IPI
NIVO IPI
Events/patients 93/369 115/366
Median (95% CI) NR NR
HR (95% CI) 0.73 (0.55, 0.95)
Log-rank P value 0.020480%
73%
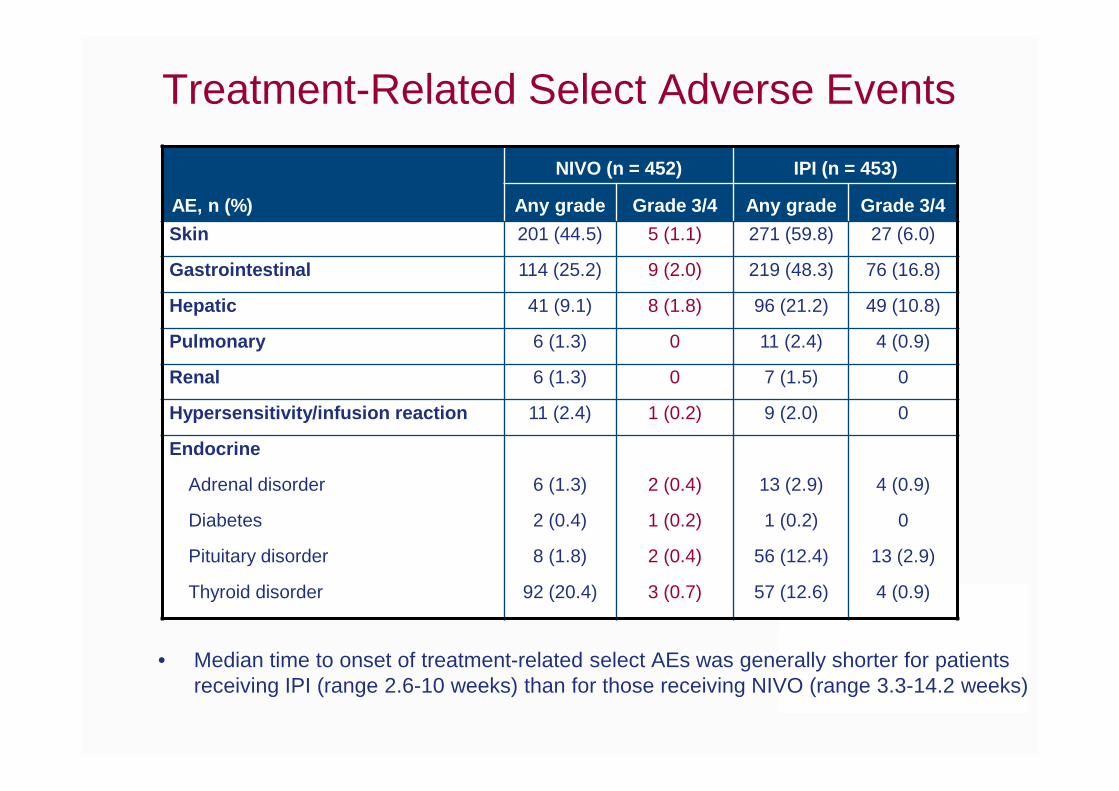
Treatment-Related Select Adverse Events
• Median time to onset of treatment-related select AEs was generally shorter for patients receiving IPI (range 2.6-10 weeks) than for those receiving NIVO (range 3.3-14.2 weeks)
AE, n (%)
NIVO (n = 452) IPI (n = 453)
Any grade Grade 3/4 Any grade Grade 3/4
Skin 201 (44.5) 5 (1.1) 271 (59.8) 27 (6.0)
Gastrointestinal 114 (25.2) 9 (2.0) 219 (48.3) 76 (16.8)
Hepatic 41 (9.1) 8 (1.8) 96 (21.2) 49 (10.8)
Pulmonary 6 (1.3) 0 11 (2.4) 4 (0.9)
Renal 6 (1.3) 0 7 (1.5) 0
Hypersensitivity/infusion reaction 11 (2.4) 1 (0.2) 9 (2.0) 0
Endocrine
Adrenal disorder 6 (1.3) 2 (0.4) 13 (2.9) 4 (0.9)
Diabetes 2 (0.4) 1 (0.2) 1 (0.2) 0
Pituitary disorder 8 (1.8) 2 (0.4) 56 (12.4) 13 (2.9)
Thyroid disorder 92 (20.4) 3 (0.7) 57 (12.6) 4 (0.9)
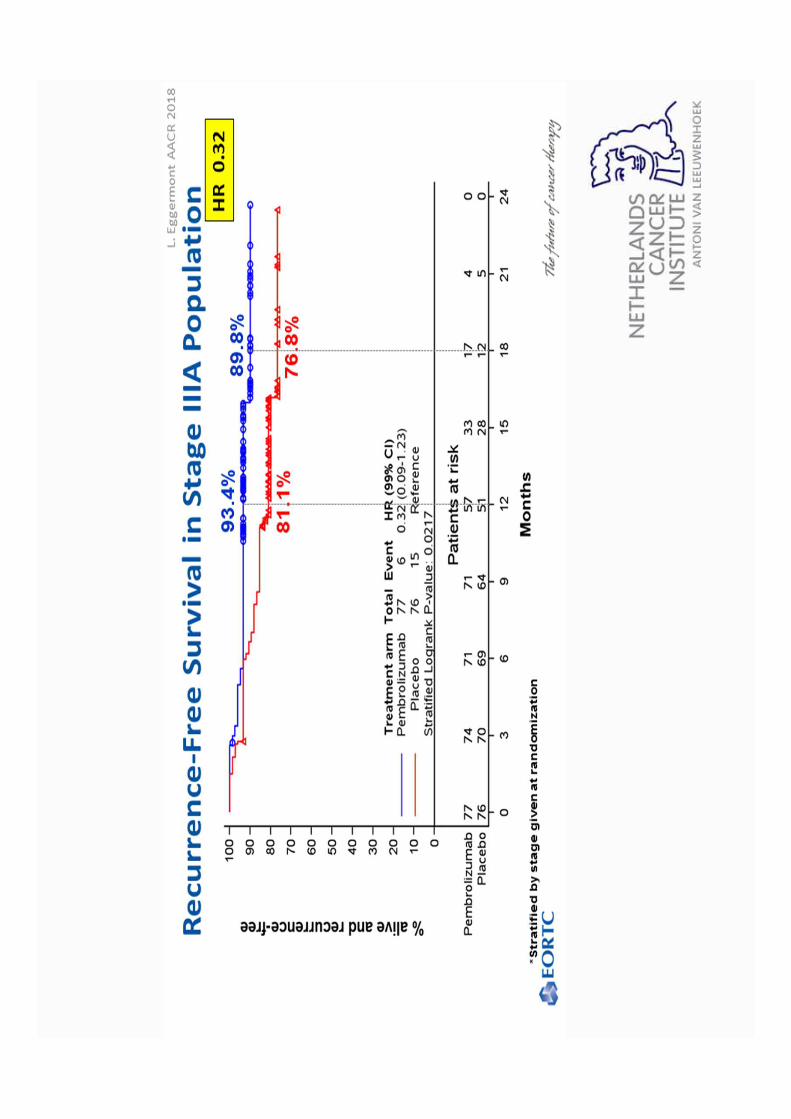

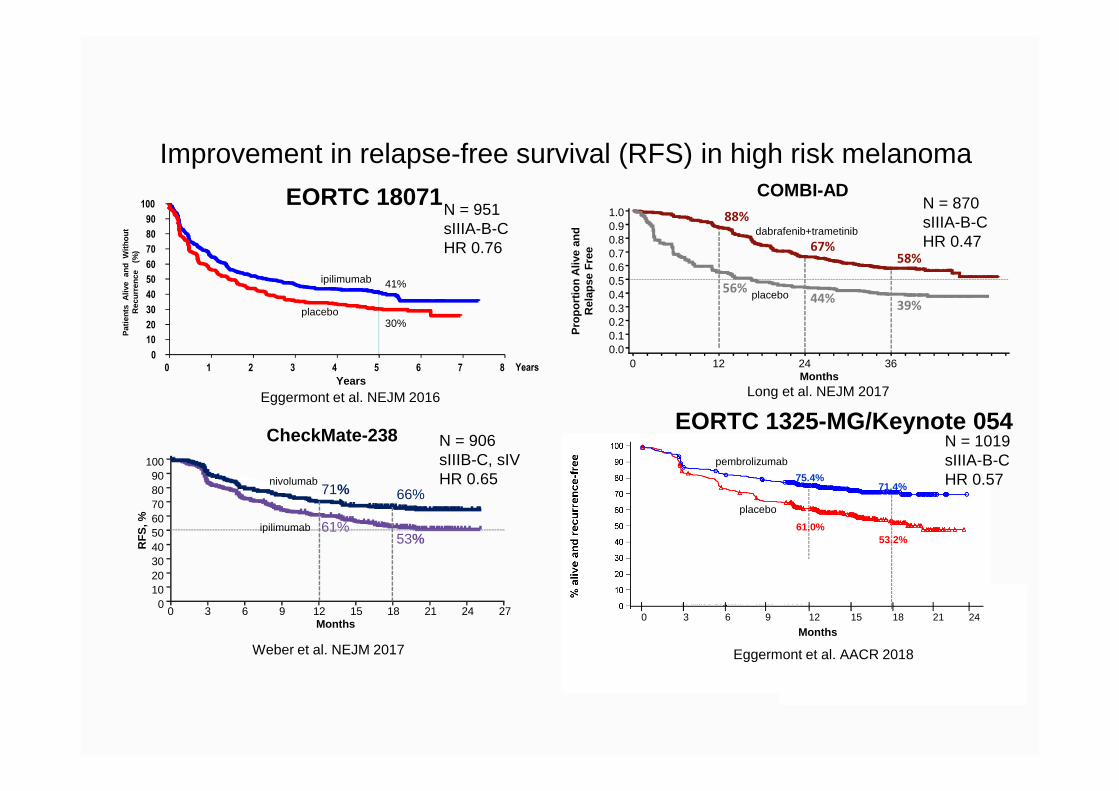
Improvement in relapse-free survival (RFS) in high risk melanoma
Months0
0.00.10.20.30.40.50.60.70.80.91.0
12 24 36
Pro
port
ion
Aliv
e an
d R
elap
se F
ree
88%
67%
58%
56%44%
39%
COMBI-ADN = 870sIIIA-B-CHR 0.47
Long et al. NEJM 2017
placebo
dabrafenib+trametinib
CheckMate-238100908070605040302010
00 3 6 9 12 15 18 21 24 27
Months
RF
S, %
71%
61%
66%
53%
Weber et al. NEJM 2017
N = 906sIIIB-C, sIVHR 0.65
ipilimumab
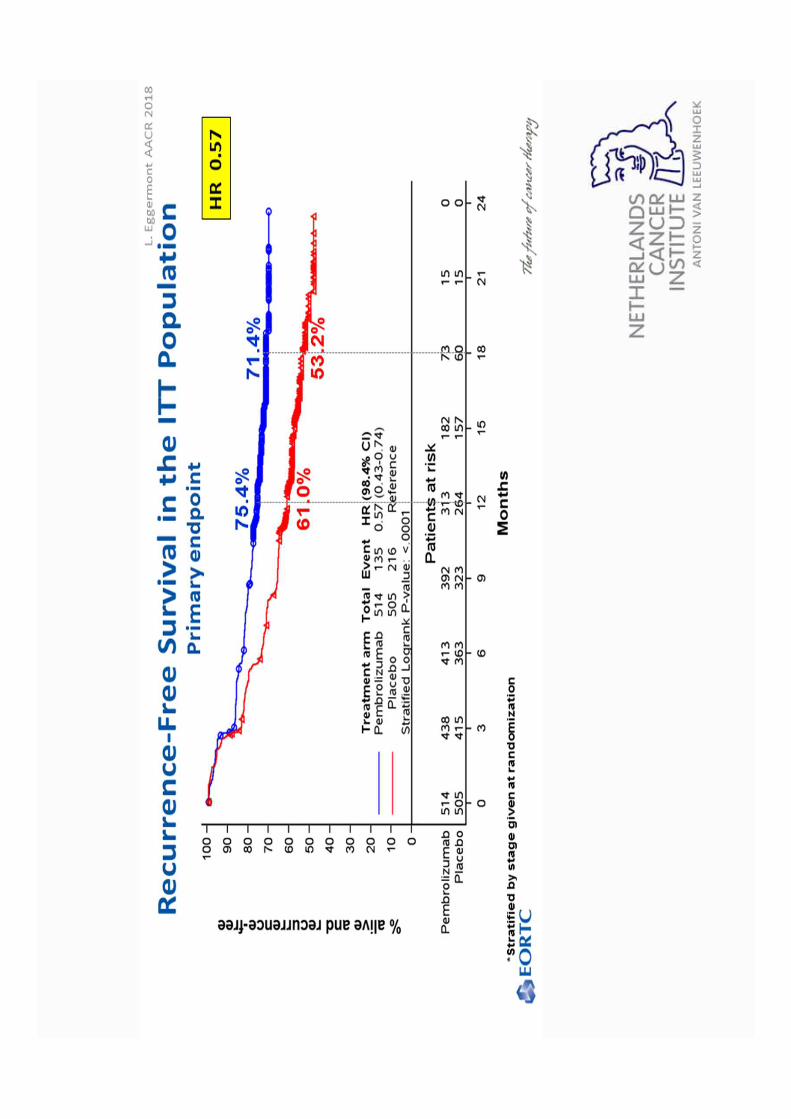
nivolumab 75.4%
61.0%53.2%
71.4%
EORTC 1325-MG/Keynote 054N = 1019sIIIA-B-CHR 0.57
0 3 6 9 12 15 18 21 24
Eggermont et al. AACR 2018
Months
placebo
pembrolizumab
Pat
ient
s A
live
and
With
out
Rec
urre
nce
(%
)
41%
30%
Years0 1 2 3 4 5 6 7 8
0
10
20
30
40
50
60
70
80
90
100
ipilimumab
placebo
N = 951sIIIA-B-CHR 0.76
Eggermont et al. NEJM 2016
EORTC 18071
Years
Important questions to address• Does adjuvant therapy improve overall survival
(OS) in addition to delaying relapses (RFS)?
• Is one of the anti-PD-1 better than the other?
• In patients with BRAF mutated melanoma, should we use an anti-PD-1 or a BRAF+MEK inhibitor combo?
“Melanoma has become from a disease that gave cancer a bad name to a ‘model’
disease for I-O”
Current I-O treatment options for melanoma– Stage IIII disease
• Neo-adjuvant/adjuvant trials
– Unresectable stage IIIc and stage IV disease
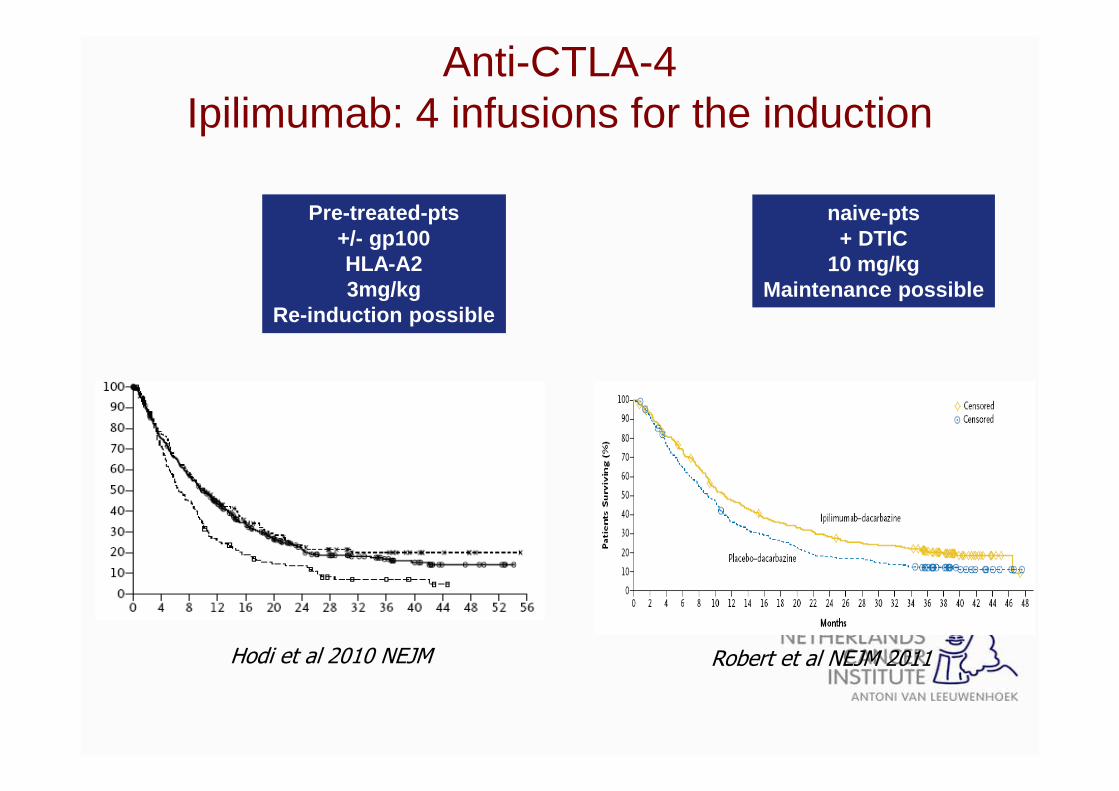
Anti-CTLA-4 Ipilimumab: 4 infusions for the induction
Hodi et al 2010 NEJM
Pre-treated-pts+/- gp100HLA-A23mg/kg
Re-induction possible
Robert et al NEJM 2011
naive-pts+ DTIC
10 mg/kgMaintenance possible
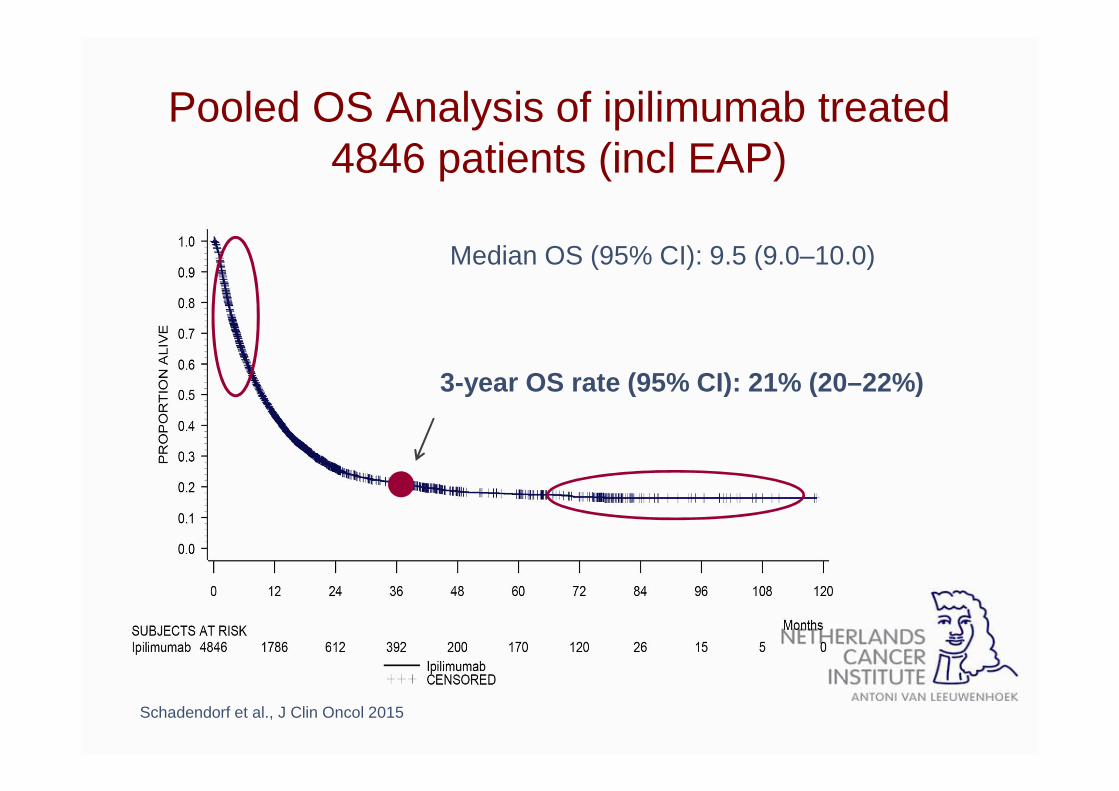
Pooled OS Analysis of ipilimumab treated 4846 patients (incl EAP)
Median OS (95% CI): 9.5 (9.0–10.0)
3-year OS rate (95% CI): 21% (20–22%)
Schadendorf et al., J Clin Oncol 2015
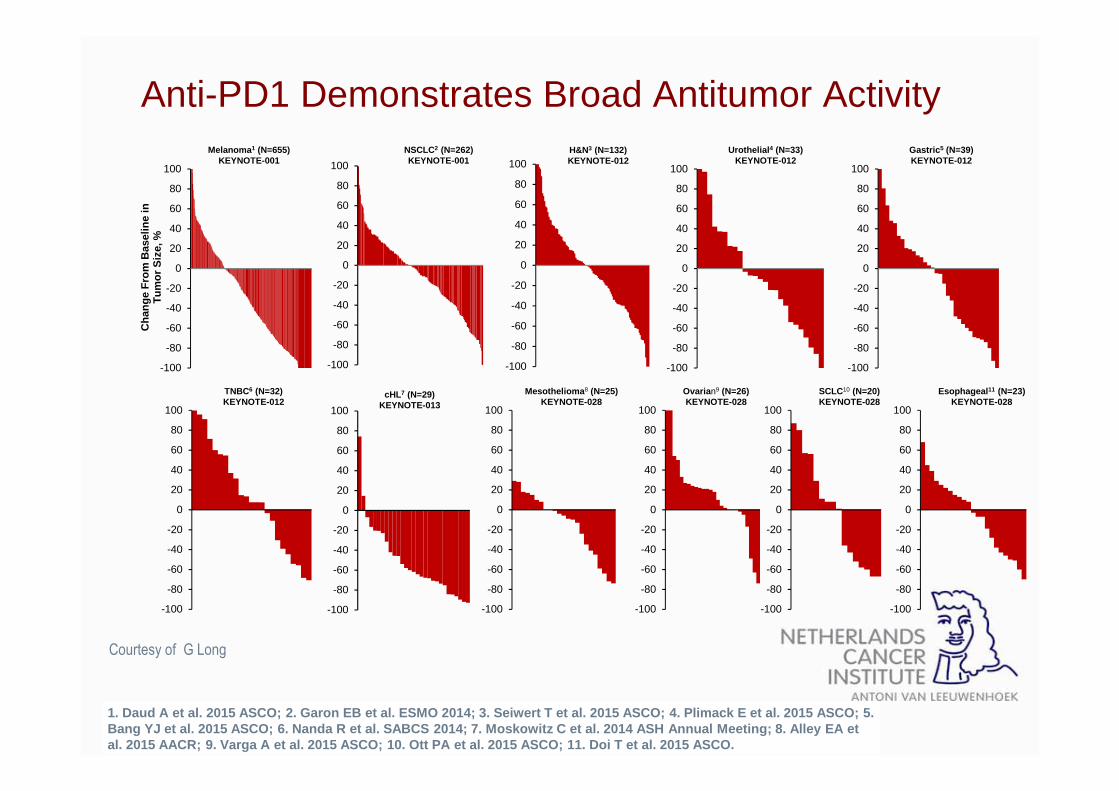
1. Daud A et al. 2015 ASCO; 2. Garon EB et al. ESMO 2014; 3. Seiwert T et al. 2015 ASCO; 4. Plimack E et al. 2015 ASCO; 5. Bang YJ et al. 2015 ASCO; 6. Nanda R et al. SABCS 2 014; 7. Moskowitz C et al. 2014 ASH Annual Meeting; 8. Alley EA et al. 2015 AACR; 9. Varga A et al. 2015 ASCO; 10. Ott P A et al. 2015 ASCO; 11. Doi T et al. 2015 ASCO.
-100
-80
-60
-40
-20
0
20
40
60
80
100
Cha
nge
Fro
m B
asel
ine
in
Tum
or S
ize,
%Melanoma 1 (N=655)
KEYNOTE-001
-100
-80
-60
-40
-20
0
20
40
60
80
100
NSCLC2 (N=262)KEYNOTE-001
-100
-80
-60
-40
-20
0
20
40
60
80
100
Gastric 5 (N=39)KEYNOTE-012
-100
-80
-60
-40
-20
0
20
40
60
80
100
-100
-80
-60
-40
-20
0
20
40
60
80
100
H&N3 (N=132)KEYNOTE-012
TNBC6 (N=32)KEYNOTE-012
-100
-80
-60
-40
-20
0
20
40
60
80
100
cHL7 (N=29)KEYNOTE-013
-100
-80
-60
-40
-20
0
20
40
60
80
100
Mesothelioma 8 (N=25)KEYNOTE-028
Anti-PD1 Demonstrates Broad Antitumor ActivityUrothelial 4 (N=33)
KEYNOTE-012
-100
-80
-60
-40
-20
0
20
40
60
80
100
-100
-80
-60
-40
-20
0
20
40
60
80
100
Ovaria n9 (N=26)KEYNOTE-028
-100
-80
-60
-40
-20
0
20
40
60
80
100
SCLC10 (N=20)KEYNOTE-028
-100
-80
-60
-40
-20
0
20
40
60
80
100
Esophageal 11 (N=23)KEYNOTE-028
Courtesy of G Long
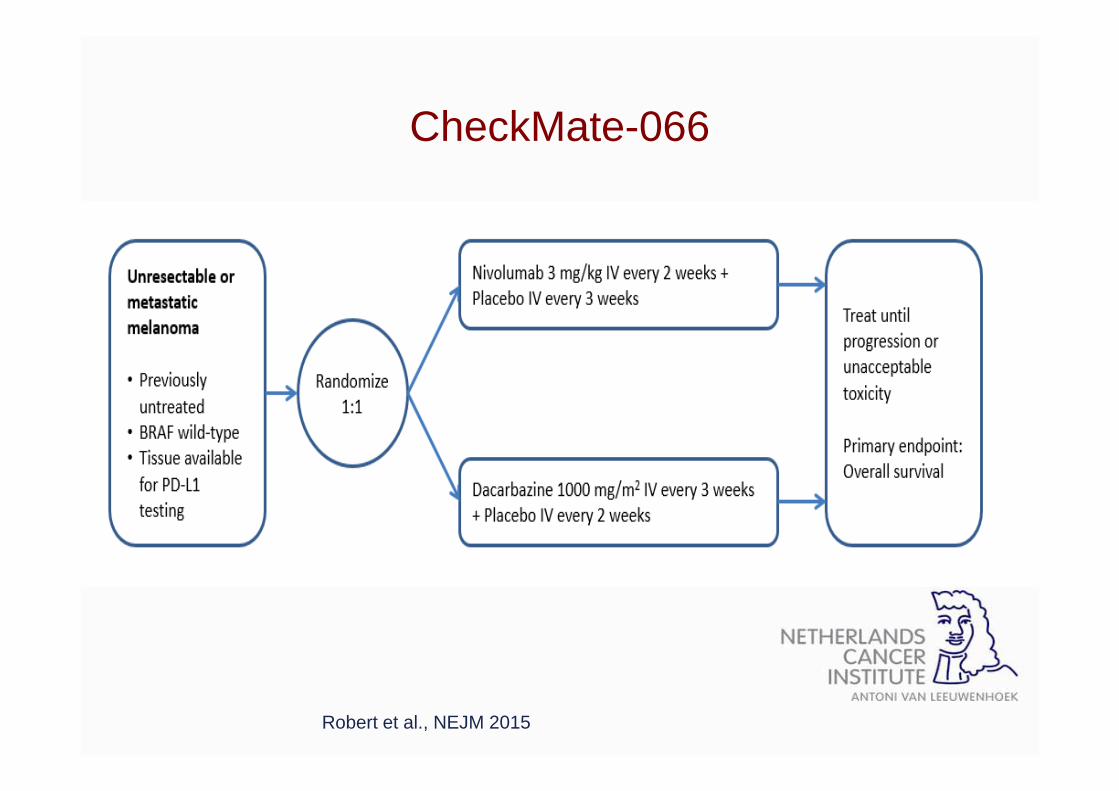
CheckMate-066
Robert et al., NEJM 2015
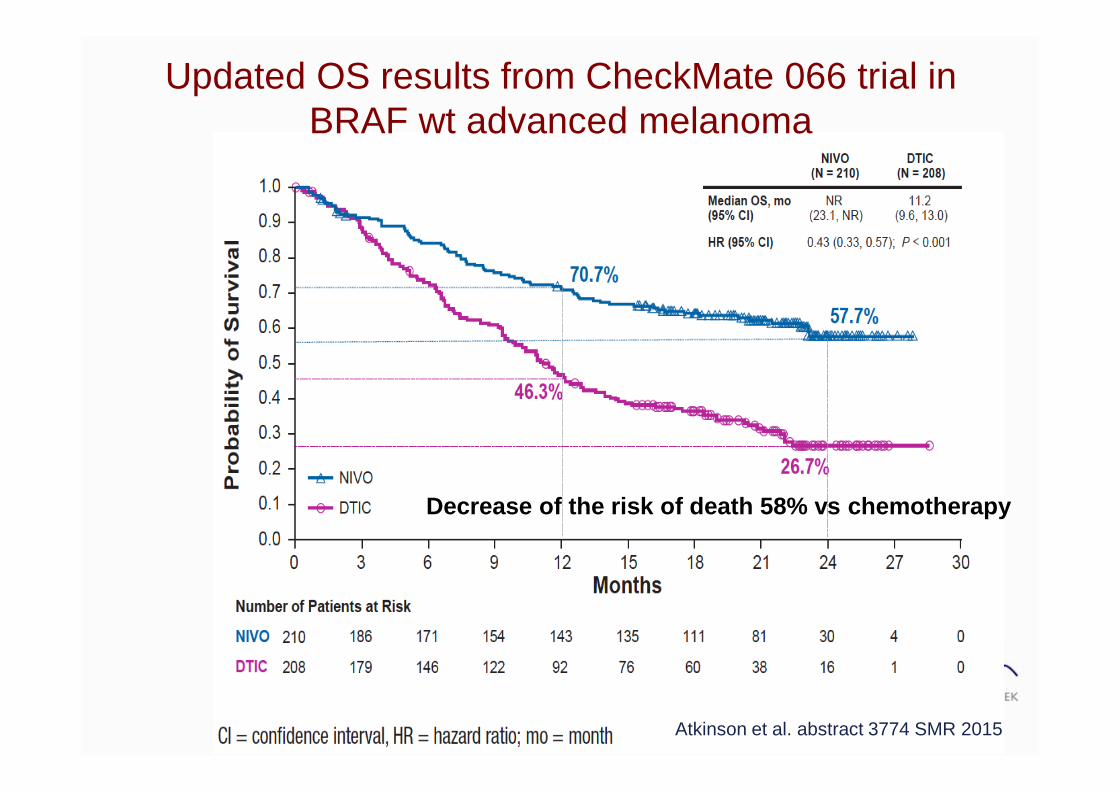
Updated OS results from CheckMate 066 trial in BRAF wt advanced melanoma
Atkinson et al. abstract 3774 SMR 2015
Decrease of the risk of death 58% vs chemotherapy
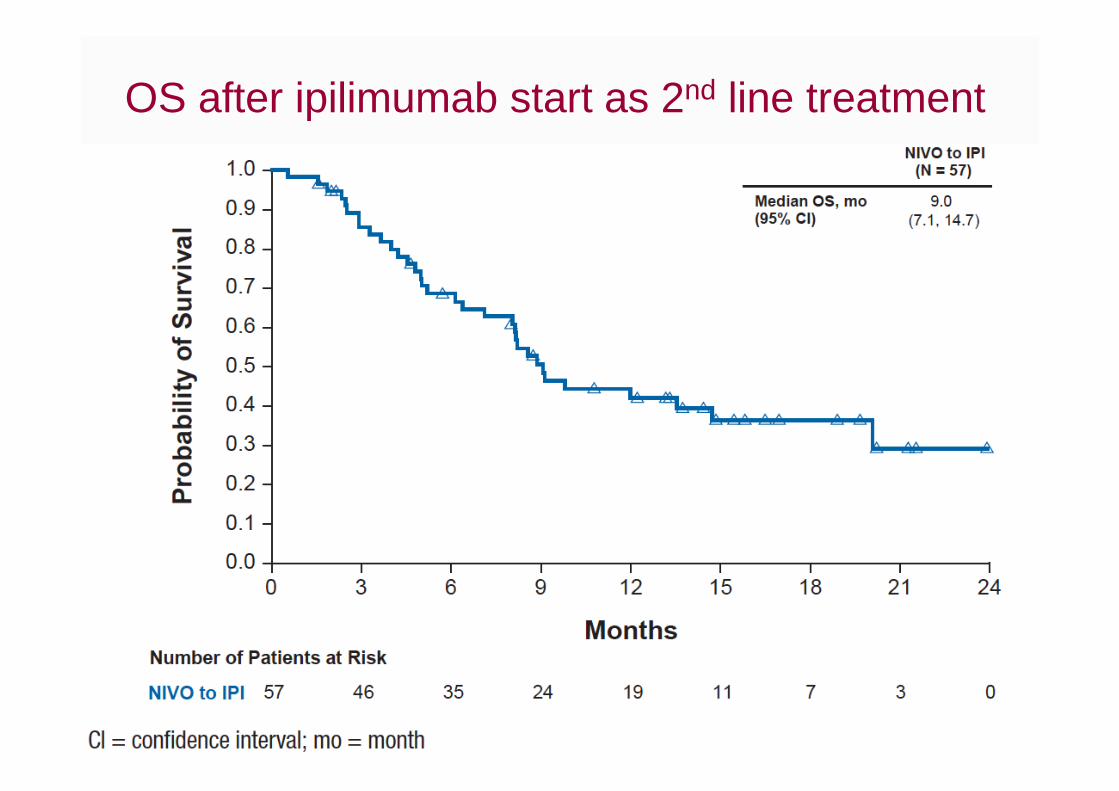
OS after ipilimumab start as 2nd line treatment

Pembrolizumab vs ipilimumab
Robert et al NEJM 2015
Treatment ArmMedian
(95% CI), mo
Rate at12 mo
HR (95% CI) P
Pembrolizumab Q2W NR (NR-NR) 74.1% 0.63 (0.47-0.83)
<0.00001
Pembrolizumab Q3W NR (NR-NR) 68.4% 0.69 (0.52-0.90)
<0.00001
Ipilimumab NR (12.7-NR) 58.2% — —
Decrease of risk of death of pembrolizumab 31 to 37% vs ipilimumab

37
ANALYSIS OF RESPONSE AND SURVIVAL IN PATIENTS WITH IPILIMUMAB -REFRACTORY MELANOMA TREATED WITH PEMBROLIZUMAB IN KEYNOTE -002
A. Daud1; I. Puzanov2; R. Dummer3; D. Schadendorf4; O. Hamid5; C. Robert6; F. S. Hodi7; J. Schachter8; J. A. Sosman9;
A. C. Pavlick10; R. Gonzalez11; C. Blank12; L. D. Cranmer13; S. J. O’Day14; A. K.Salama15; K. A. Margolin16; J. Yang17;
B. Homet Moreno17; N. Ibrahim17; A. Ribas18
1University of California, San Francisco, San Francisco, CA, USA; 2Vanderbilt-Ingram Cancer Center, Nashville, TN, USA; (currently at Roswell Park Cancer Institute, Buffalo, NY, USA; 3University of Zürich, Zürich, Switzerland; 4University Hospital Essen, Essen, Germany; 5The Angeles Clinic and Research Institute, Los Angeles, CA, USA; 6Gustave Roussy and Paris-Sud University, Villejuif, France; 7Dana-Farber Cancer Institute, Boston, MA, USA; 8Ella Lemelbaum Institute of Melanoma, Sheba Medical Center, Tel Hashomer, Israel; 9Vanderbilt-Ingram Cancer Center, Nashville, TN, USA (currently at Northwestern University Feinberg School of Medicine, Chicago, IL, USA, USA); 10New York University Cancer Institute, New York, NY, USA; 11University of Colorado Denver, Aurora, CO, USA; 12Netherlands Cancer Institute, Amsterdam, Netherlands; 13currently at University of Washington and Seattle Cancer Care Alliance, Seattle, WA, USA; 14John Wayne Cancer Institute, Santa Monica, CA, USA; 15Duke Cancer Institute, Durham, NC, USA; 16City of Hope, Duarte, CA, USA; 17Merck Sharp & Dohme Corp., a subsidiary of Merck & Co., Inc., Kenilworth, NJ, USA; 18University of California, Los Angeles, Los Angeles, CA, USA
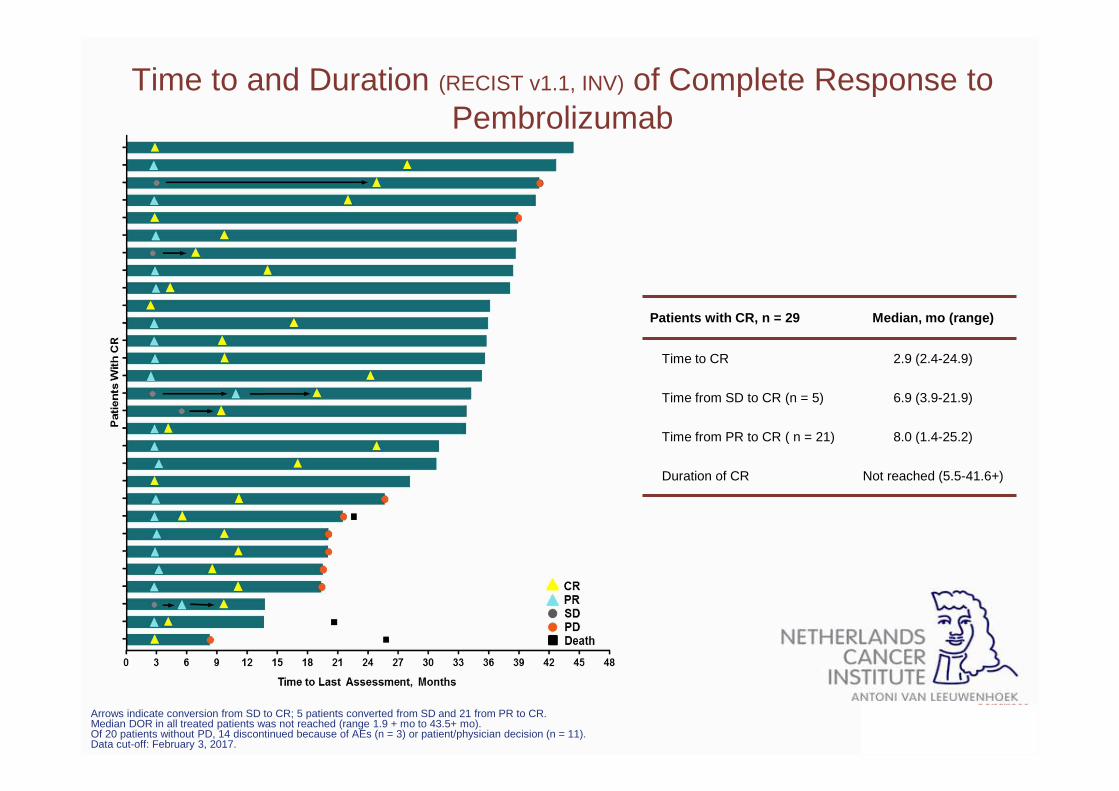
Arrows indicate conversion from SD to CR; 5 patients converted from SD and 21 from PR to CR.Median DOR in all treated patients was not reached (range 1.9 + mo to 43.5+ mo).Of 20 patients without PD, 14 discontinued because of AEs (n = 3) or patient/physician decision (n = 11).Data cut-off: February 3, 2017.
Time to and Duration (RECIST v1.1, INV) of Complete Response to Pembrolizumab
Patients with CR, n = 29 Median, mo (range)
Time to CR 2.9 (2.4-24.9)
Time from SD to CR (n = 5) 6.9 (3.9-21.9)
Time from PR to CR ( n = 21) 8.0 (1.4-25.2)
Duration of CR Not reached (5.5-41.6+)
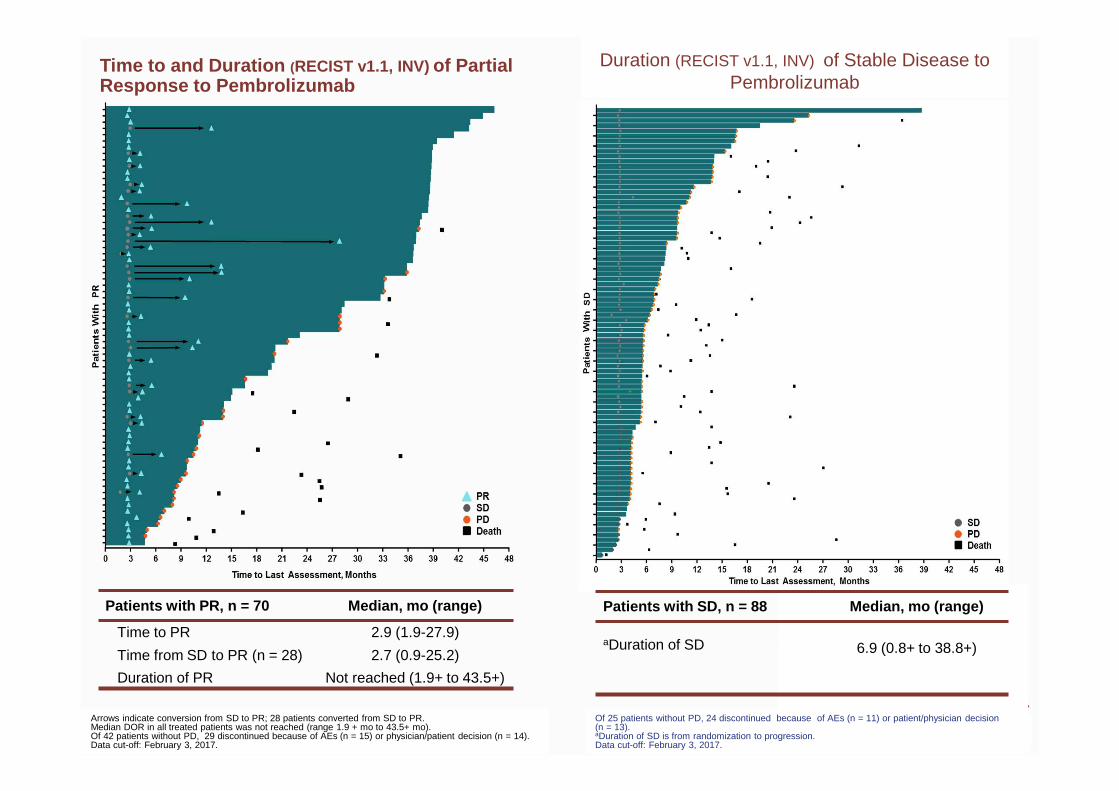
Time to and Duration (RECIST v1.1, INV) of Partial Response to Pembrolizumab
Patients with PR, n = 70 Median, mo (range)
Time to PR 2.9 (1.9-27.9)
Time from SD to PR (n = 28) 2.7 (0.9-25.2)
Duration of PR Not reached (1.9+ to 43.5+)
Arrows indicate conversion from SD to PR; 28 patients converted from SD to PR.Median DOR in all treated patients was not reached (range 1.9 + mo to 43.5+ mo).Of 42 patients without PD, 29 discontinued because of AEs (n = 15) or physician/patient decision (n = 14).Data cut-off: February 3, 2017.
Duration (RECIST v1.1, INV) of Stable Disease to Pembrolizumab
Of 25 patients without PD, 24 discontinued because of AEs (n = 11) or patient/physician decision (n = 13). aDuration of SD is from randomization to progression.Data cut-off: February 3, 2017.
Patients with SD, n = 88 Median, mo (range)
aDuration of SD 6.9 (0.8+ to 38.8+)
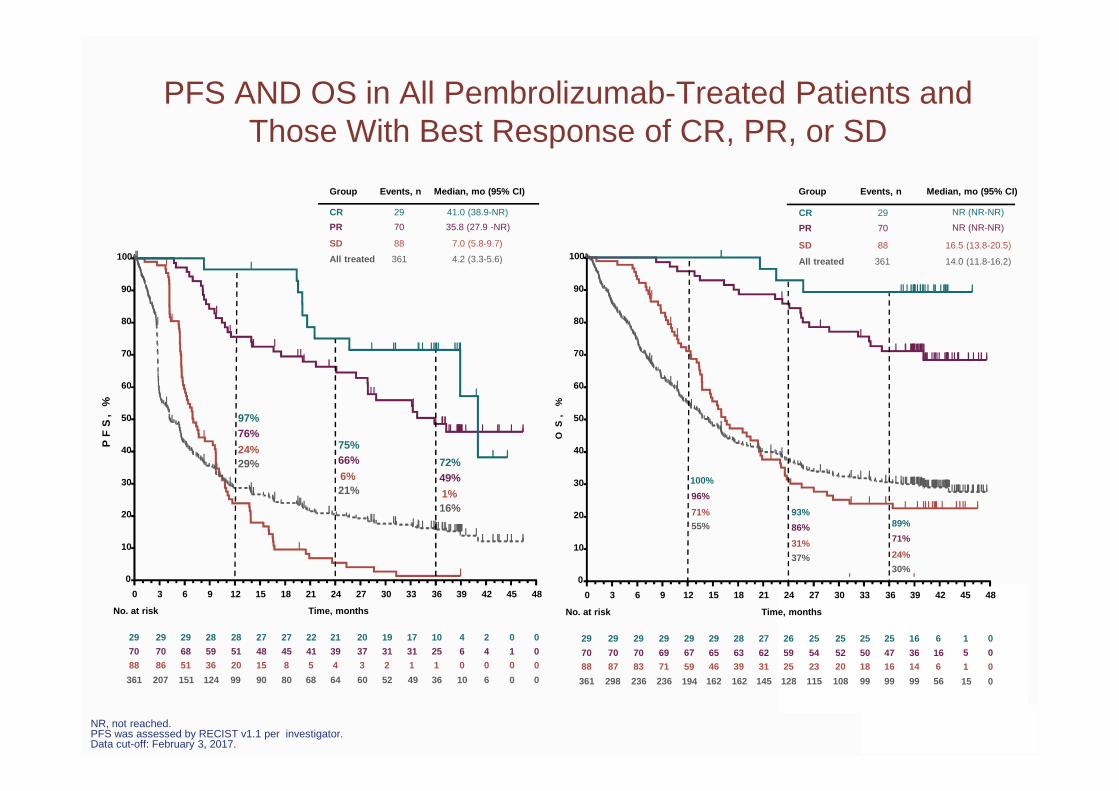
NR, not reached.PFS was assessed by RECIST v1.1 per investigator.Data cut-off: February 3, 2017.
PFS AND OS in All Pembrolizumab-Treated Patients and Those With Best Response of CR, PR, or SD
PF
S,
%
0 3 6 9 12 15 18 21 24 27 30 33 36 39 42 45 48
0
10
20
30
40
50
60
70
80
90
100
Time, monthsNo. at risk
29 27 27 22 21 20 19 17 10 4 2 0 0
70 48 45 41 39 37 31 31 25 6 4 1 0
88 15 8 5 4 3 2 1 1 0 0 0 0
361
29
70
86
207
29
68
51
151
28
59
36
124
28
51
20
99 90 80 68 64 60 52 49 36 10 6 0 0
97%76%
24%29%
75%66%
6%21%
72%49%
1%16%
29
70
88
361
41.0 (38.9-NR)
35.8 (27.9 -NR)
7.0 (5.8-9.7)
4.2 (3.3-5.6)
CR
PR
SD
All treated
Events, n Median, mo (95% CI)Group
NR (NR-NR)
NR (NR-NR)
16.5 (13.8-20.5)
14.0 (11.8-16.2)
Events, n Median, mo (95% CI)Group
SD
All treated
88
361
PR 70
29CR
OS
,%
29 29 28 27 26 25 25 25 25 16 6
70 65 63 62 59 54 52 50 47 36 1688 46 39 31 25 23 20 18 16 14 6
361
29
7087
298
29
7083
236
29
6971
236 162 162 145 128 115 108 99 99 99 56
100%
96%
71%
55%
93%
86%
31%
37%
89%
71%
24%
30%
Time, monthsNo. at risk
0
10
20
30
40
50
60
70
80
90
100
0 3 6 9 12 15 18 21 24 27 30 33 36 39 42 45 48
29
67
59
194
0
0
0
0
1
5
1
15
• Responses to pembrolizumab are durable and associated with prolonged OS in ipilimumab-refractory melanoma
• Even in these heavily pretreated patients, best response can evolve over time, with late conversions from SD to PR/CR and PR to CR observed
• No new safety signals with longer term follow-up
Conclusions
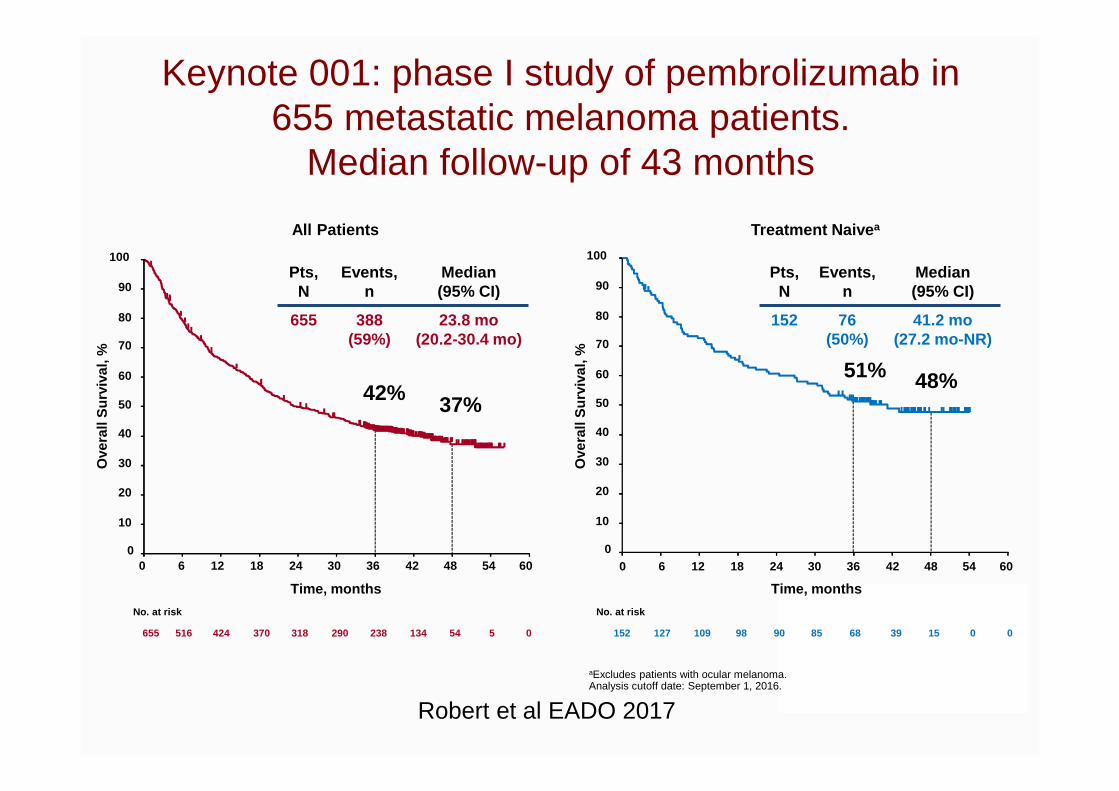
aExcludes patients with ocular melanoma.Analysis cutoff date: September 1, 2016.
Pts,N
Events, n
Median (95% CI)
152 76(50%)
41.2 mo(27.2 mo-NR)
Pts,N
Events, n
Median (95% CI)
655 388(59%)
23.8 mo(20.2-30.4 mo)
All Patients
0
10
20
30
40
50
60
70
80
90
100
Ove
rall
Sur
viva
l, %
0 6 12 18 24 30 36 42 48 54 60
Time, months
No. at risk
655 516 424 370 290 238 134 54 5 0 318
42% 37%
Treatment Naive a
Ove
rall
Sur
viva
l, %
0 6 12 18 24 30 36 42 48 54 60
Time, months
0
10
20
30
40
50
60
70
80
90
100
No. at risk
152 127 109 98 85 68 39 15 0 0 90
51% 48%
Keynote 001: phase I study of pembrolizumab in 655 metastatic melanoma patients.
Median follow-up of 43 months
Robert et al EADO 2017

Pembrolizumab phase 1: Keynote 001 :Median Follow-Up 43 Months for 655 patients
Consent withdrawal
5%
Discontinued for AEs:25%Discontinued for
PD:42%
On treatment:16%
Discontinue forphysician
Decision 11%
Range of follow-up: 36-57 months.Analysis cutoff date: September 1, 2016.
Robert et al EADO 2017
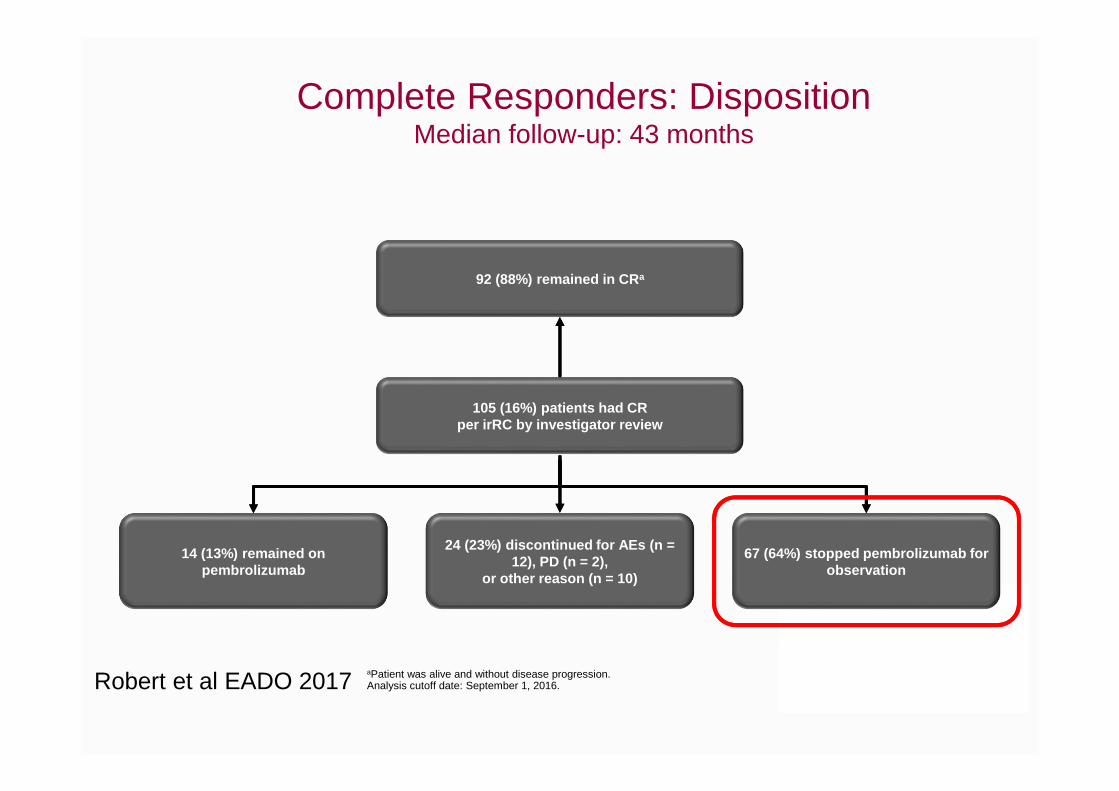
Complete Responders: DispositionMedian follow-up: 43 months
aPatient was alive and without disease progression.Analysis cutoff date: September 1, 2016.
14 (13%) remained on pembrolizumab
67 (64%) stopped pembrolizumab for observation
24 (23%) discontinued for AEs (n = 12), PD (n = 2),
or other reason (n = 10)
92 (88%) remained in CR a
105 (16%) patients had CR per irRC by investigator review
Robert et al EADO 2017
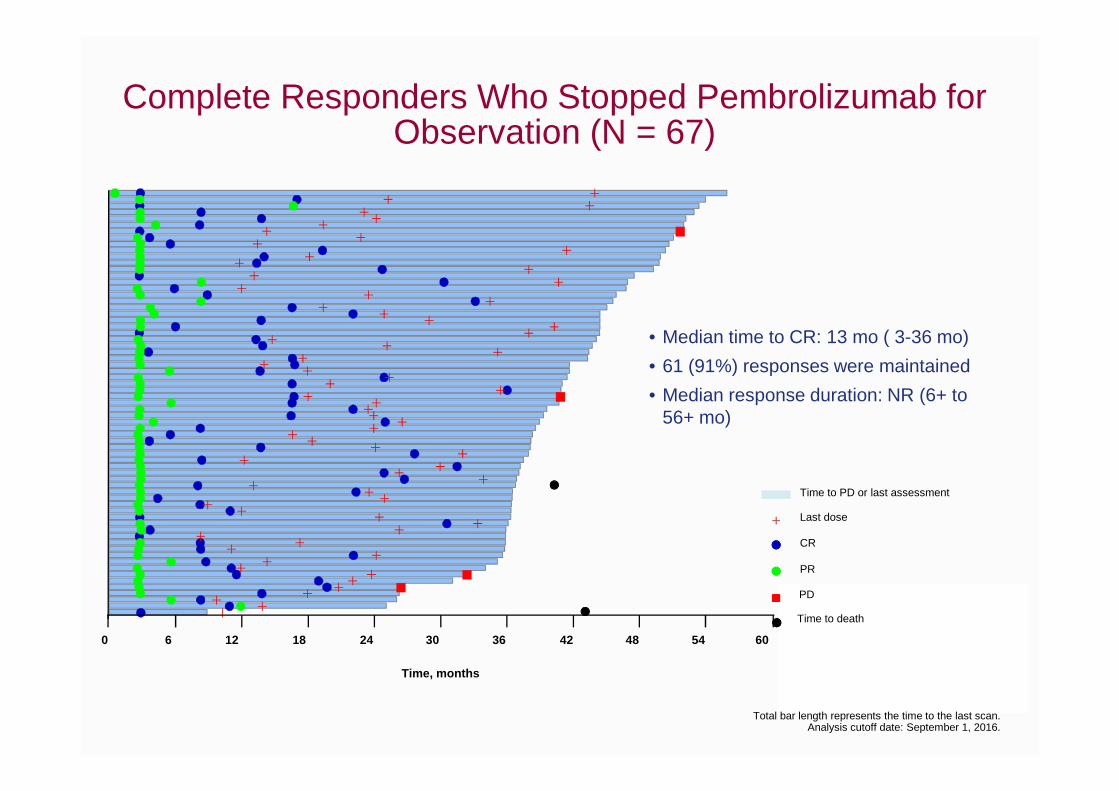
Complete Responders Who Stopped Pembrolizumab for Observation (N = 67)
Total bar length represents the time to the last scan.Analysis cutoff date: September 1, 2016.
0 6 12 18 24 30 36 42 48 54 60
Time, months
• Median time to CR: 13 mo ( 3-36 mo)
• 61 (91%) responses were maintained
• Median response duration: NR (6+ to 56+ mo)
PD
PR
CR
Time to PD or last assessment
Last dose
Time to death
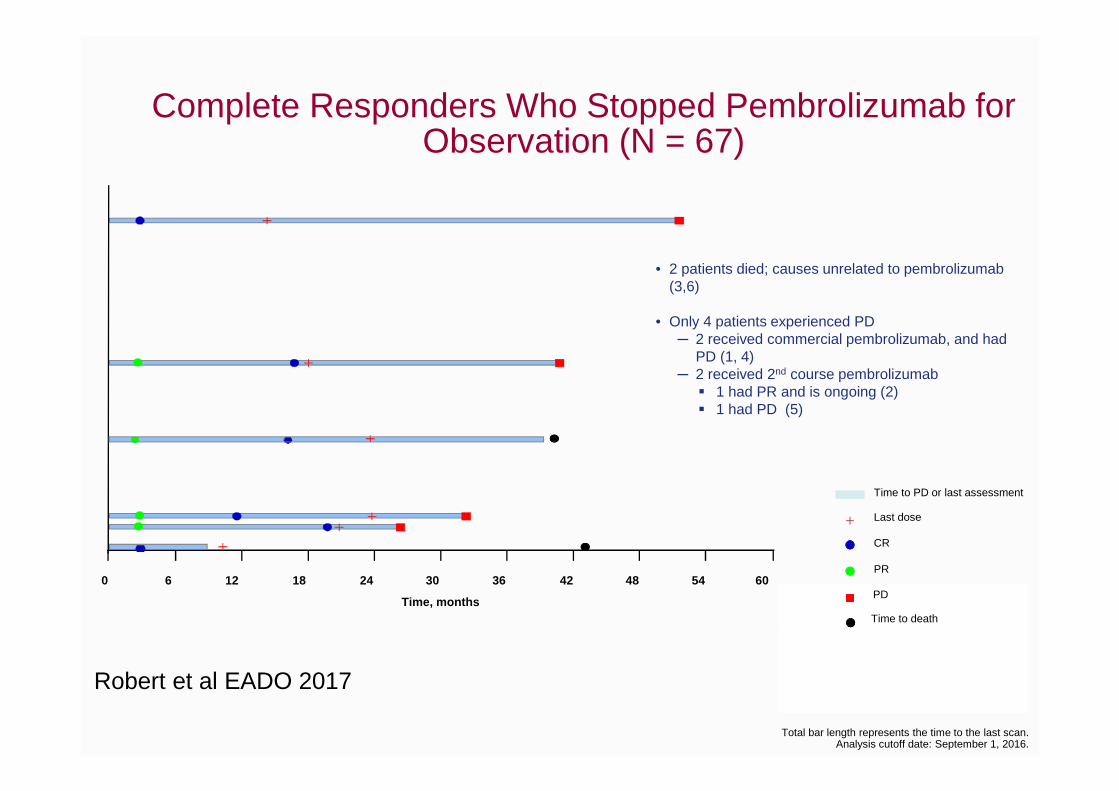
Complete Responders Who Stopped Pembrolizumab for Observation (N = 67)
Total bar length represents the time to the last scan.Analysis cutoff date: September 1, 2016.
• 2 patients died; causes unrelated to pembrolizumab(3,6)
• Only 4 patients experienced PD─ 2 received commercial pembrolizumab, and had
PD (1, 4)─ 2 received 2nd course pembrolizumab
� 1 had PR and is ongoing (2)� 1 had PD (5)
0 6 12 18 24 30 36 42 48 54 60PD
PR
CR
Time to PD or last assessment
Last dose
Time to death
Time, months
Robert et al EADO 2017
How long to treat with anti-PD1?
In case of a partial response or stable disease?
47
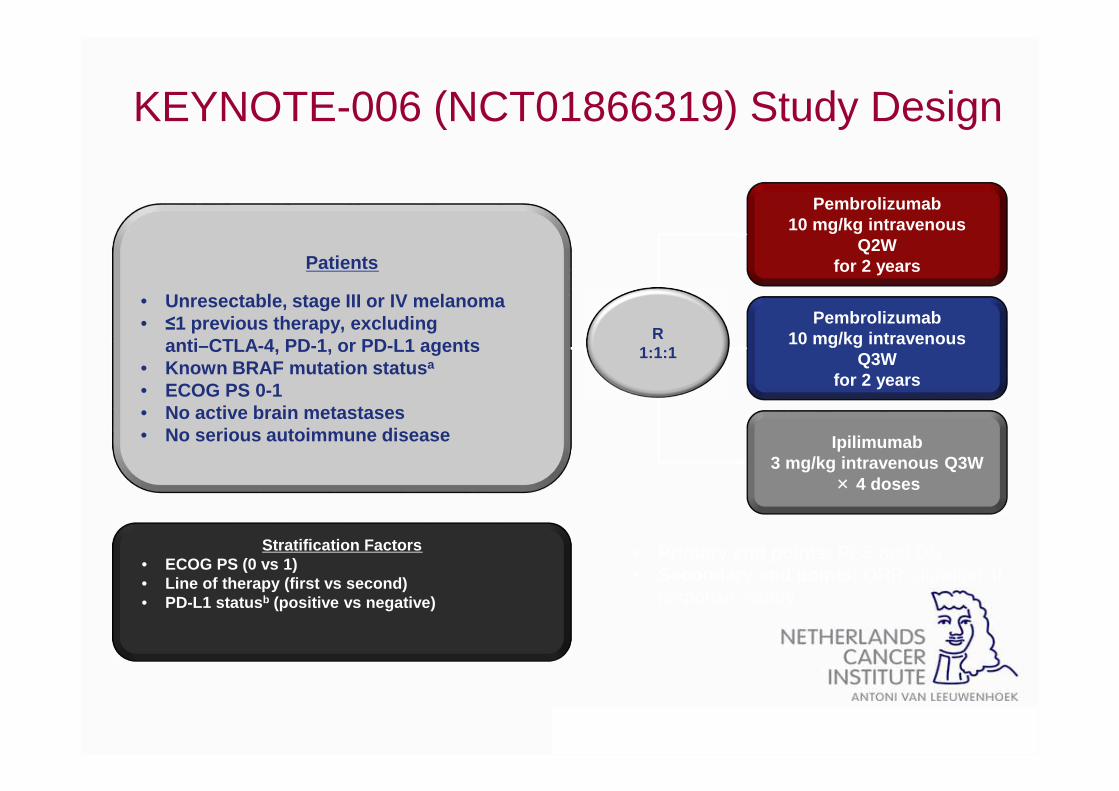
KEYNOTE-006 (NCT01866319) Study Design
• Primary end points: PFS and OS• Secondary end points: ORR, duration of
response, safety
Patients
• Unresectable, stage III or IV melanoma• ≤1 previous therapy, excluding
anti–CTLA-4, PD-1, or PD-L1 agents• Known BRAF mutation status a
• ECOG PS 0-1• No active brain metastases• No serious autoimmune disease
Pembrolizumab10 mg/kg intravenous
Q2W for 2 years
Pembrolizumab10 mg/kg intravenous
Q3W for 2 years
R1:1:1
Stratification Factors • ECOG PS (0 vs 1)• Line of therapy (first vs second)• PD-L1 status b (positive vs negative)
Ipilimumab3 mg/kg intravenous Q3W
× 4 doses
aPrior anti-BRAF targeted therapy was not required for patients with normal LDH levels and no clinically significant tumor-related symptoms or evidence of rapidly progressing disease. bDefined
as ≥1% staining in tumor and adjacent immune cells as assessed by IHC (22C3 antibody).
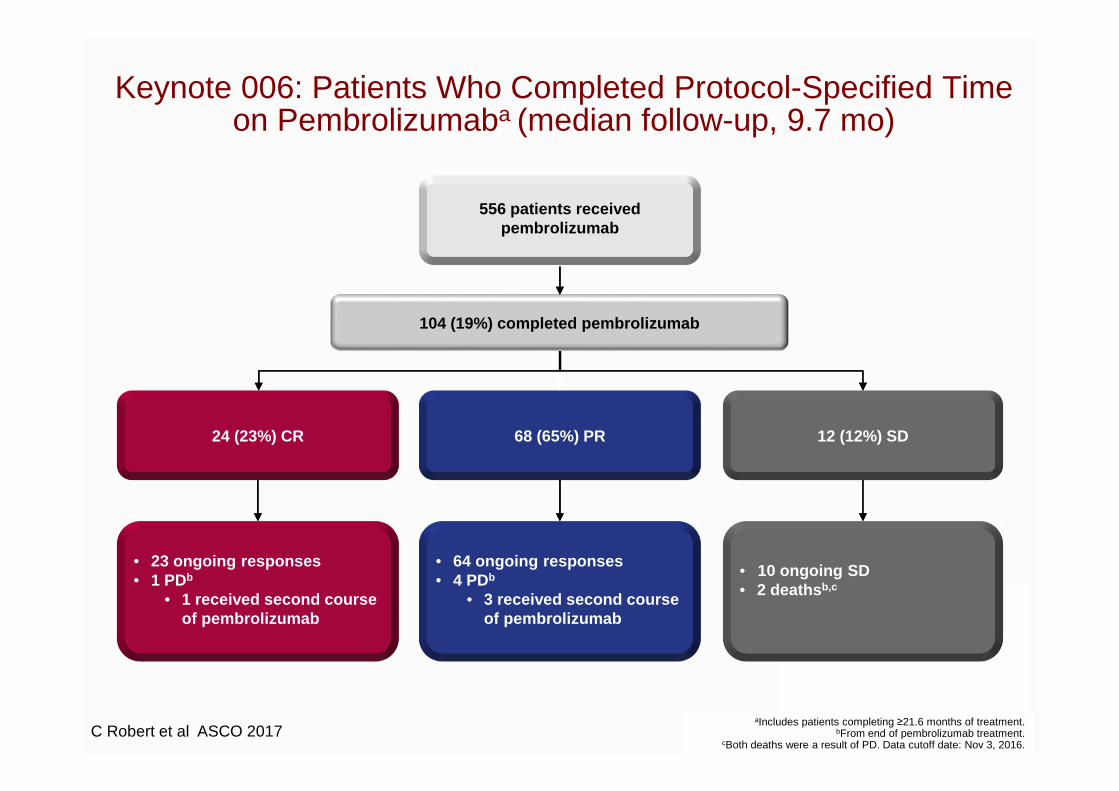
Keynote 006: Patients Who Completed Protocol-Specified Time on Pembrolizumaba (median follow-up, 9.7 mo)
aIncludes patients completing ≥21.6 months of treatment.bFrom end of pembrolizumab treatment.
cBoth deaths were a result of PD. Data cutoff date: Nov 3, 2016.
104 (19%) completed pembrolizumab
24 (23%) CR 68 (65%) PR 12 (12%) SD
• 23 ongoing responses• 1 PDb
• 1 received second course of pembrolizumab
• 64 ongoing responses• 4 PDb
• 3 received second course of pembrolizumab
• 10 ongoing SD• 2 deaths b,c
556 patients received pembrolizumab
C Robert et al ASCO 2017
100
90
80
70
60
50
40
30
20
10
00 2 4 6 8 10 12 14
104 96 95 86 67 30 6 0
Time, months
Pro
gres
sion
-Fre
e S
urvi
val,
%
No. at risk
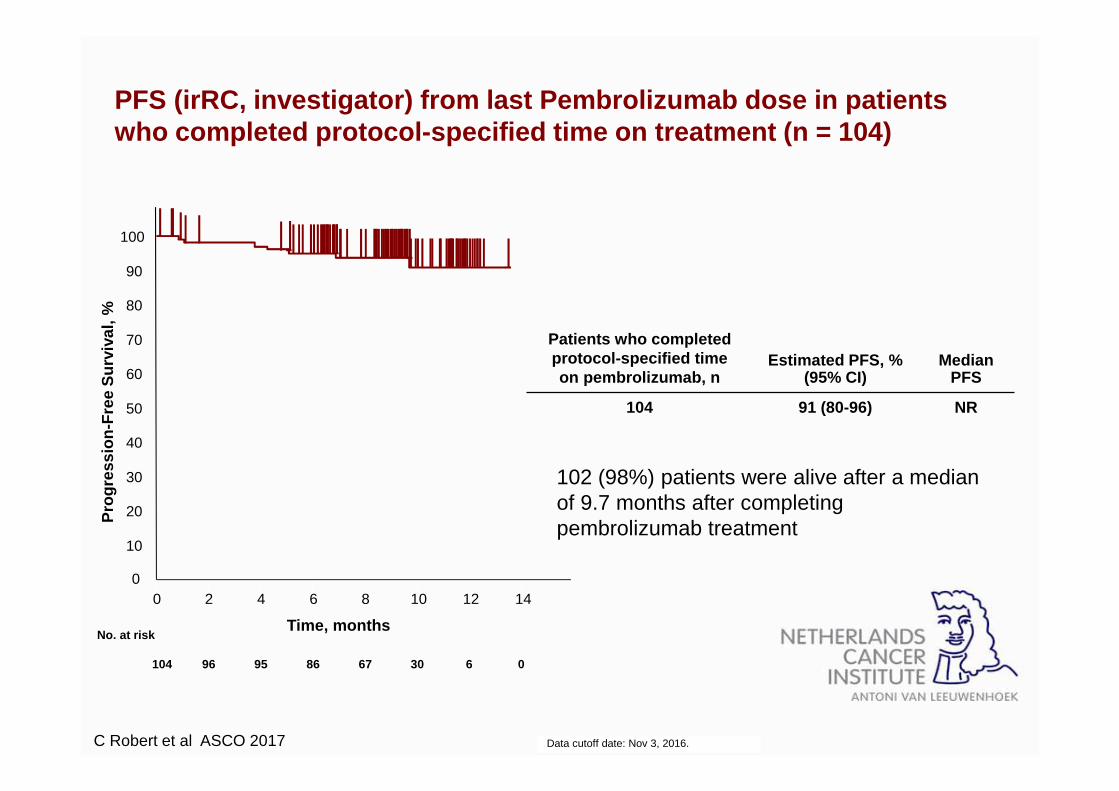
PFS (irRC, investigator) from last Pembrolizumab dos e in patients who completed protocol-specified time on treatment (n = 104)
Data cutoff date: Nov 3, 2016.
102 (98%) patients were alive after a median of 9.7 months after completing pembrolizumab treatment
Patients who completed protocol-specified time on pembrolizumab, n
Estimated PFS, % (95% CI)
Median PFS
104 91 (80-96) NR
C Robert et al ASCO 2017
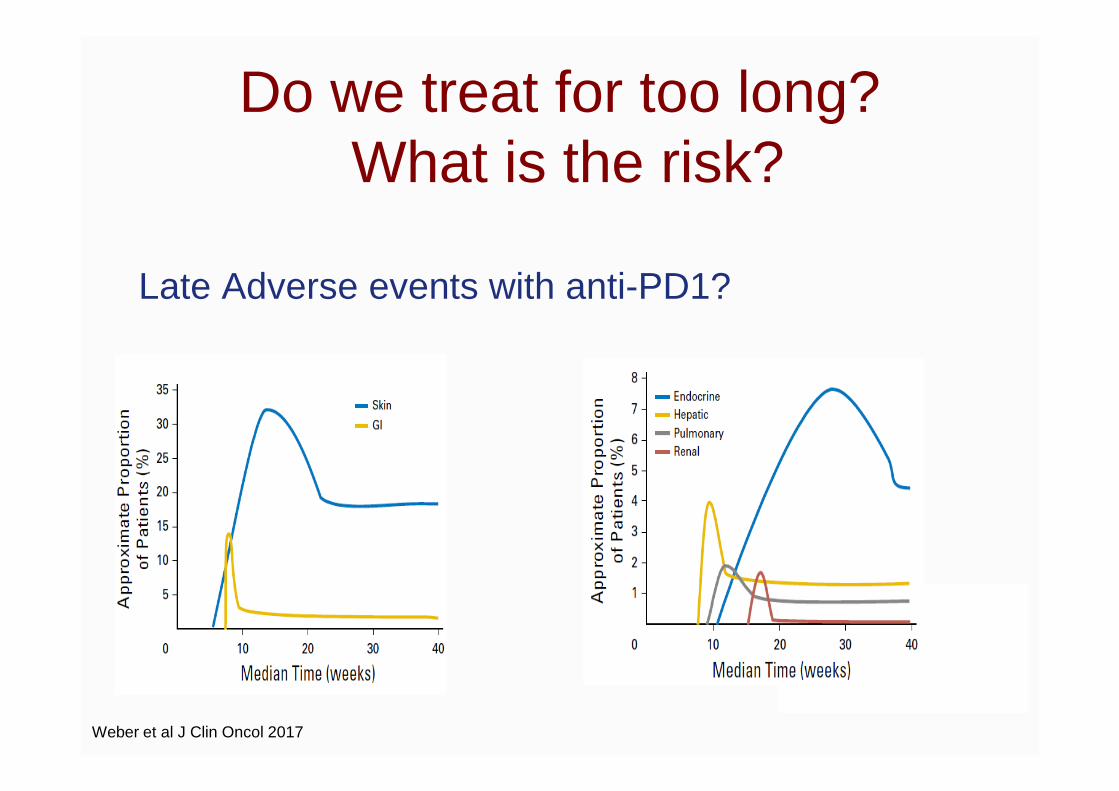
Do we treat for too long?What is the risk?
Late Adverse events with anti-PD1?
Weber et al J Clin Oncol 2017

No Significant increase in AE incidence between 2 and 3 years with anti-PD1
n (%)
PembrolizumabN = 555
Median FU (months) 7.9 23 33.9
Any grade % 76.2 79 79
Grade ¾ % 11.7 17 17
Led to death % 0 0 <1
Led to discontinuation %
5.4 9 10
Analysis includes all randomized patients who received ≥1 pembrolizumab dose.aAs designated by the investigator. bBecause of sepsis.
Data cutoff date: Nov 3, 2016.
TREATMENT-RELATED AE INCIDENCE OVER TIME
Data from Ribas et al, AACR 2015; Robert et al ASCO 2016; Robert et al ASCO 2017
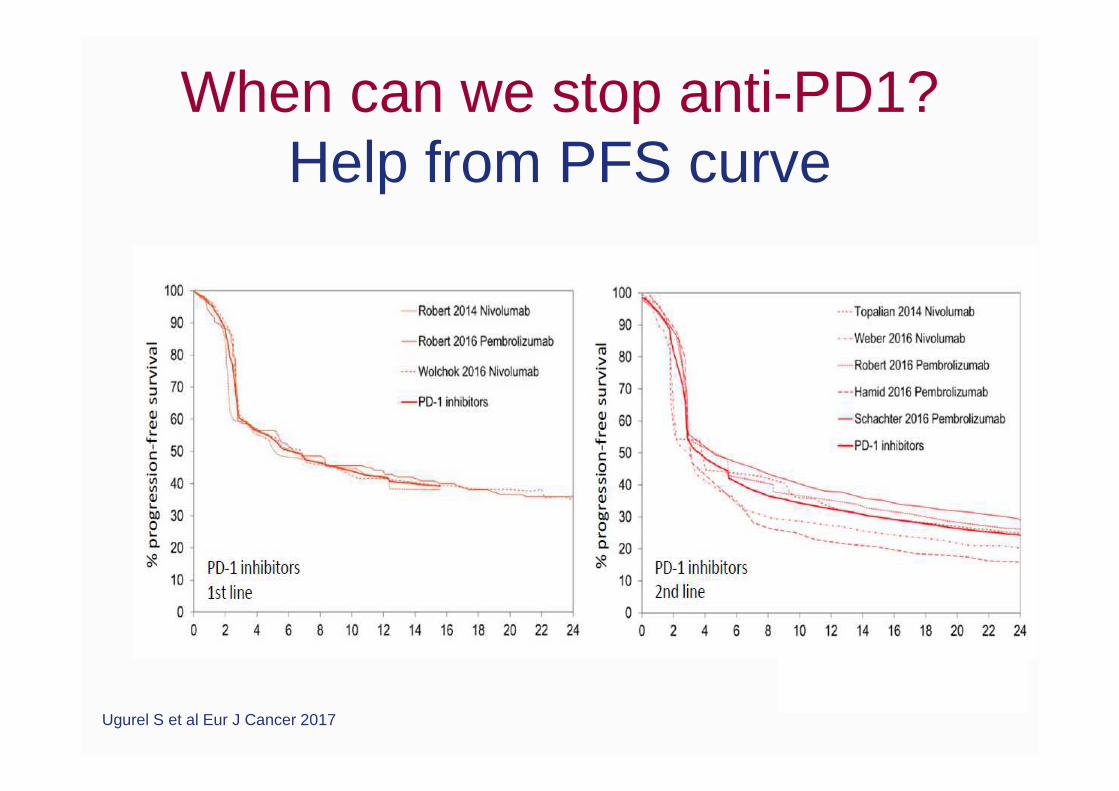
When can we stop anti-PD1? Help from PFS curve
Ugurel S et al Eur J Cancer 2017

Keynote 006 PFS Total Population (Median Follow-Up, 33.9 mo)
C Robert et al ASCO 2017
100
90
80
70
60
50
40
20
0
30
10
0 4 8 12 16 20 24 28 32 36 40
Time, months
556278
347110
26964
23140
21132
18227
15523
13820
8814
122
00
Pro
gres
sion
-Fre
e S
urvi
val,
%
No. at riskPembrolizumab
31%14%
34%15%
Ipilimumab
Stop pembro
Ipilimumab
Pembrolizumab
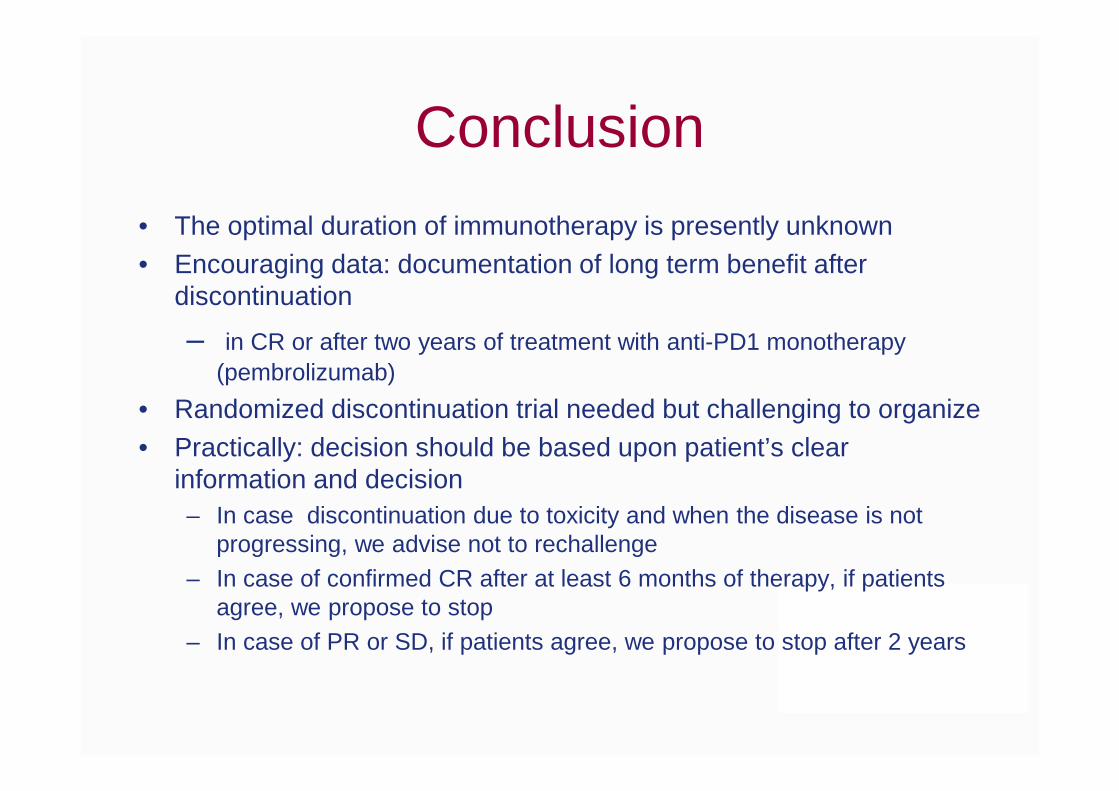
Conclusion
• The optimal duration of immunotherapy is presently unknown• Encouraging data: documentation of long term benefit after
discontinuation
– in CR or after two years of treatment with anti-PD1 monotherapy(pembrolizumab)
• Randomized discontinuation trial needed but challenging to organize• Practically: decision should be based upon patient’s clear
information and decision– In case discontinuation due to toxicity and when the disease is not
progressing, we advise not to rechallenge– In case of confirmed CR after at least 6 months of therapy, if patients
agree, we propose to stop– In case of PR or SD, if patients agree, we propose to stop after 2 years