Embed Size (px)
Citation preview

Imaging velocities of a vibrating objectby stroboscopic sideband holography
F. Verpillat,1 F. Joud,1 M. Atlan,2 and M. Gross3*
1 Laboratoire Kastler Brossel: UMR 8552 CNRS- ENS- UPMC, 24 rue Lhomond 75231 Paris05, France
2 Institut Langevin, UMR 7587 CNRS ESPCI ParisTech, 1, rue Jussieu, 75005 Paris3 Laboratoire Charles Coulomb: UMR 5221 CNRS, Universite Montpellier 2, 34095
Montpellier, France*[email protected]
Abstract: We propose here to combine sideband holography withstroboscopic illumination synchronized with the vibration of an object.By sweeping the optical frequency of the reference beam such a way theholographic detection is tuned on the successive sideband harmonic ranks,we are able to image the instantaneous velocities of the object. Since thestroboscopic illumination is made with an electronic device, the method iscompatible with fast (up to several MHz) vibration motions. The method isdemonstrated with a vibrating clarinet reed excited sinusoidally at 2 kHz,and a stroboscopic illumination with cyclic ratio 0.15. Harmonic rank upto n = ±100 are detected, and a movie of the instantaneous velocities isreported.
© 2012 Optical Society of America
OCIS codes: (090.1995) Digital holography; (090.1760) Computer holography; (200.4880)Optomechanics; (040.2840) Heterodyne; (100.2000) Digital image processing.
References and links1. G. Pedrini, Y. L. Zou, and H. J. Tiziani, “Digital double-pulsed holographic interferometry for vibration analysis,”
Jour. of Mod. Opt. 42(2), 367–374 (1995)2. G. Pedrini, H. J. Tiziani and Y. Zou, “Digital double pulse-tv-holography,” Opt. Laser Eng. 26(2), 199–219
(1997)3. G. Pedrini, P. Froening, H. Fessler, and H. J. Tiziani, “Transient vibration measurements using multi-pulse digital
holography,” Opt. Laser Tech. 29(8), 505–511 (1998)4. G. Pedrini, W. Osten and M. E. Gusev, “High-speed digital holographic interferometry for vibration measure-
ment,” Appl. Opt. 45(15), 3456–3462 (2006)5. Y. Fu, G. Pedrini, and W. Osten, “Vibration measurement by temporal fourier analyses of a digital hologram
sequence,” Appl. Opt. 46(23), 5719–5727 (2007)6. R. L. Powell and K. A. Stetson, “Interferometric vibration analysis by wavefront reconstruction”, J. Opt. Soc.
Am. 55(12), 1593–1598 (1965)7. P. Picart, J. Leval, D. Mounier, and S. Gougeon, “Time-averaged digital holography,” Opt. Lett. 28(20), 1900–
1902 (2003)8. F. Pinard, B. Laine, and H. Vach, “Musical quality assessment of clarinet reeds using optical holography,” J.
Acoust. Soc. Am. 113, 1736–1742 (2003)9. F. Zhang, J. D. R. Valera, I. Yamaguchi, M. Yokota, and G. Mills, “Vibration analysis by phase shifting digital
holography,” Opt. Rev. 11(5), 297–299 (2004)10. N. Demoli and D. Vukicevic, “Detection of hidden stationary deformations of vibrating surfaces by use of
time-averaged digital holographic interferometry,” Opt. Lett. 29(20), 2423–2425 (2004)11. P. Picart, J. Leval, J. C. Pascal, J. P. Boileau, M. Grill, J. M. Breteau, B. Gautier, and S. Gillet, “2d full field
vibration analysis with multiplexed digital holograms,” Opt. Express 13(22), 8882–8892 (2005)12. N. Demoli and I. Demoli, “Dynamic modal characterization of musical instruments using digital holography,”
Opt. Express 13(13), 4812–4817 (2005)
#170209 - $15.00 USD Received 8 Jun 2012; revised 7 Sep 2012; accepted 9 Sep 2012; published 20 Sep 2012(C) 2012 OSA 24 September 2012 / Vol. 20, No. 20 / OPTICS EXPRESS 22860
13. N. Demoli, “Real-time monitoring of vibration fringe patterns by optical reconstruction of digital holograms:mode beating detection,” Opt. Express 14(6), 2117–2122 (2006)
14. A. Asundi, V. R. Singh, “Time-averaged in-line digital holographic interferometry for vibration analysis,” Appl.Opt. 45(11), 2391–2395 (2006)
15. V. R. Singh, J. Miao, Z. Wang, G. Hegde, and A. Asundi, “Dynamic characterization of mems diaphragm usingtime averaged in-line digital holography,” Opt. Comm. 280(2), 285–290 (2007)
16. P. Picart, J. Leval, F. Piquet, J. P. Boileau, T. Guimezanes, and J. P. Dalmont, “Tracking high amplitude auto-oscillations with digital fresnel holograms,” Opt. Express 15(13), 8263–8274 (2007)
17. Y. Fu, H. Shi, and H. Miao, “Vibration measurement of a miniature component by high-speed image-plane digitalholographic microscopy,” Appl. Opt. 48(11), 1990–1997 (2009)
18. U. P. Kumar, Y. Kalyani, N. K. Mohan, and M. P. Kothiyal, “Time-average tv holography for vibration fringeanalysis,” Appl. Opt. 48(16), 3094–3101 (2009)
19. P. Picart, J. Leval, D. Mounier, and S. Gougeon, “Some opportunities for vibration analysis with time averagingin digital fresnel holography,” Appl. Opt. 44(3), 337–343 (2005)
20. D. N. Borza, “High-resolution time-average electronic holography for vibration measurement,” Opt. Lasers Eng.41(3), 515–527 (2004)
21. D. N. Borza, “Mechanical vibration measurement by high-resolution time-averaged digital holography,” Meas.Sci. Technol. 16: 1853 (2005)
22. D.N. Borza, ”Full-field vibration amplitude recovery from high-resolution time-averaged speckle interferogramsand digital holograms by regional inverting of the bessel function,” Opt. lasers Eng. 44(8), 747–770 (2006)
23. F. Joud, F. Laloe, M. Atlan, J. Hare, and M. Gross, “Imaging of a vibrating object by sideband digital holography,”Opt. Express 17(4), 2774–2779 (2009)
24. C. C. Aleksoff, “Temporally modulated holography,” Appl. Opt. 10(6), 1329–1341 (1971)25. F. Le Clerc, L. Collot, and M. Gross, “Numerical heterodyne holography with two-dimensional photodetector
arrays,” Opt. Lett. 25(10), 716–718 (2000)26. M. Gross, P. Goy, and M. Al-Koussa, “Shot-noise detection of ultrasound-tagged photons in ultrasound-
modulated optical imaging,” Opt. Lett. 28(24), 2482–2484 (2003)27. F. Joud, F. Verpillat, F. Laloe, M. Atlan, J. Hare, and M. Gross, “Fringe-free holographic measurements of
large-amplitude vibrations,” Opt. Lett. 34(23), 3698–3700 (2009)28. J. Leval, P. Picart, J.P. Boileau, and J. C. Pascal, “Full-field vibrometry with digital fresnel holography,” Appl.
Opt. 44(27), 5763–5772 (2005)29. U. Schnars and W. Juptner, “Direct recording of holograms by a ccd target and numerical reconstruction,” Appl.
Opt. 33(2), 179–181 (1994)30. P. Picart and J. Leval, “General theoretical formulation of image formation in digital fresnel holography,” J.
Opt. Soc. Am. A 25(7), 1744–1761 (2008)
1. Introduction
There is a big demand for full field vibration measurements, in particular in industry. Differentholographic techniques are able to image and analyse such vibrations. Double pulse holography[1, 2] records a double-exposure hologram with time separation in the 1...1000 μs range, andmeasures the instantaneous velocity of a vibrating object from the phase difference. The methodrequires a quite costly double pulse ruby laser system, whose repetition rate is low. Multi pulseholography [3] is able to analyse transient motions, but the setup is still heavier (4 pulses laser,three cameras).
The development of fast CMOS camera makes possible to analyse vibration efficiently bytriggering the camera on the motion in order to record a sequence of holograms that allows totrack the vibration of the object as a function of the time [4, 5]. The assessment analysis of themotion can be done by phase difference or by Fourier analysis in the time domain. The methodrequires a CMOS camera, which can be costly. It is also limited to low frequency vibrations,since a complete analysis of the motion requires a camera frame rate higher than the vibrationfrequency, because the bandwidth Δν of the holographic signal, which is sampled at the cameraframe rate νCCD, must be lower than the Nyquist-Shannon frequency limit Δν < νCCD/2. For aperiodic motion of frequency νA, the bandwidth Δν � 0 is much smaller than νA, and νA canovercome this limit: νA > νCCD/2. The exposure time must remains nevertheless lower thatthe vibration period, in order to avoid to wash out the signal, whose phase may vary duringexposure. This limits the duty cycle and the thus SNR (Signal to Noise Ratio).
#170209 - $15.00 USD Received 8 Jun 2012; revised 7 Sep 2012; accepted 9 Sep 2012; published 20 Sep 2012(C) 2012 OSA 24 September 2012 / Vol. 20, No. 20 / OPTICS EXPRESS 22861
Powell and Stetson [6] have shown that the time averaged hologram of an harmonically vi-brating object yields yields alternate dark and bright fringes. The dark fringes correspond tothe zeros of the Bessel function J0(z), where z is proportional to the vibration amplitude. Onegets then a direct mapping of this amplitude. Picard et al. [7] has simplified the processing ofthe data by performing time averaged holography with a digital CCD camera. Time averagedholography has no limit in vibration frequency and do not involve costly laser system, nor anexpensive CMOS fast camera. These advantages yield numerous recent developments of thetechnique [8–18]. Although the time averaged method gives a way to determine the amplitudeof vibration [19], quantitative measurement remain quite difficult, especially for high vibrationamplitudes. To solve this problem, Borza proposed high-resolution time-average speckle inter-ferometry and digital holography techniques, which allow subpixel resolution (optical) phaserecovery by inverting the Bessel function on its monotonic intervals and works well with largervibration amplitudes [20–22].
Joud et al. [23] extended the time averaged technique to the detection of the optical signalat the vibration sideband frequency νn, where n is the harmonic rank. It was demonstratedthat the signal amplitude of rank n is then proportional to the Bessel function Jn(z). As in theseminal work of Aleksoff [24], in Sideband holography the reference beam frequency is tunedin order to select the sideband of rank n. This tuning is made by the heterodyne holographytechnique [25]: the frequency of the illumination and reference beams are shifted by acoustooptic modulators (AOMs) so that the reference versus illumination frequency offset can befinely adjusted. Sideband holography, which is able to detect MHz frequency vibrations [26],is able on the other hand to image sidebands up to rank n = ±1000 [27], and by the way toanalyse vibration of large amplitude, which can be studied by time averaged technique at theprice of inverse methods [22].
Since both time averaged and sideband holography record the holographic signal over a largenumber a vibration periods, these two techniques are not sensitive to the phase of the vibration,and are thus unable to measure the instantaneous velocities of the object. To respond this prob-lem, Leval et al. [28] combine time averaged holography with stroboscopic illumination, but,since Leval uses a mechanical stroboscopic device, the Leval technique suffer of a quite lowduty cycle (1/144), and is limited in low vibration frequencies (νA < 5 kHz).
We propose here to combine Sideband Digital Holography (SDH) with stroboscopic illumi-nation synchronized with the vibration. To perform the stroboscopic illumination, we make useof two AOMs to control both the frequencies and the amplitudes of the illumination and refer-ence beams. This is done by switching electronically on and off the Radio Frequency signals(� 80 MHz) that drive the two AOMs.
If the amplitude of vibration is high, the light scattered by the vibrating object exhibit manysideband components. By sweeping the reference frequency such a way the holographic detec-tion is tuned on the successive sideband harmonic ranks n, stroboscopic sideband holographyis then able to detect, for any stroboscopic time delay, all the harmonic ranks generated byDoppler effect. One can then reconstruct the instantaneous velocity map of the vibrating ob-ject. The mechanical phase, which is related to the sign of the velocity is obtained by the way.Note that since the stroboscopic illumination is made by AOMs that are electronically driven,there is no practical limitation in the stroboscopic frequency and duty cycle.
In the following we will describe the principle of the method, and our optical and electronicsetup. A test experiment is made with a clarinet reed excited sinusoidally at νA = 2 kHz. Theamplitude of vibration is such that we get sideband signal up to rank n=±100. By sweeping thestroboscopic time delay, and by recording holograms for all harmonic ranks n, we can retrieveimages of the reed instantaneous velocity.
#170209 - $15.00 USD Received 8 Jun 2012; revised 7 Sep 2012; accepted 9 Sep 2012; published 20 Sep 2012(C) 2012 OSA 24 September 2012 / Vol. 20, No. 20 / OPTICS EXPRESS 22862

Fig. 1. Distribution on the sidebands energy |An,x,δx|2 as a function of the sideband har-monic n without (a) and with (b-d) stroboscopic illumination. Curves are plotted for differ-ent stroboscopic illumination time t = xTA with x = 0.25 0.35, 0.45, 0.55 , 0.65 and 0.75,and different stroboscopic illumination duration Δt = δxTA with δx = 1 (a), 0.2 (b), 0.1 (c)and 0.05 (d). The vibration amplitude is Φ = 50.
2. Stroboscopic SDH principle
2.1. Periodic sinusoidal motion
Consider a point of the object in vibrating sinusoidal at frequency νA and amplitude zmax. Itsdisplacement z(t) is:
z(t) = zmax cos(2πνAt) (1)
In backscattering geometry, this corresponds to a phase modulation:
ϕ(t) = 4πz(t)/λ = Φcos(2πνAt) (2)
where λ is the optical wavelength and Φ = 4πzmax/λ . The scattered field is then
E(t) = E e j2πν0t+ jϕ(t) (3)
= E∞
∑n=−∞
Jn(Φ)e j2π(ν0+nνA)t
where E is the complex amplitude of the field, ν0 the frequency of the illumination opticalfield EI , and Jn the nth order Bessel function of the first kind. The scattered field is a sum of
#170209 - $15.00 USD Received 8 Jun 2012; revised 7 Sep 2012; accepted 9 Sep 2012; published 20 Sep 2012(C) 2012 OSA 24 September 2012 / Vol. 20, No. 20 / OPTICS EXPRESS 22863
components of frequency νn:
νn = ν0 +nνA (4)
where n is the harmonic rank of the sideband (n = 0 for the carrier). Equation 3 means that theweight of the field component of frequency νn is E Jn(Φ). Figure 1(a) shows how the energy ofthe sideband |E |2|Jn(Φ)|2 varies with n, assuming Φ = 50 rad.
To interpret the spectrum of Fig. 1(a), one can reverse Eq. (4), considering n as a continuousvariable related to the frequency ν ≡ νn of the corresponding sideband component:
n(ν) = (ν −ν0)/νA (5)
Here, n is the Doppler frequency shift ν −ν0 in νA units. This shift is, by definition, related tothe distribution of the out-of-plane velocity V = dz/dt of the object:
ν −ν0 = nνA = 2V/λ (6)
where λ is the optical wavelength. The shift of harmonic rank n is confined between the values±Φ that correspond to the maximum velocities ±Vmax with Vmax = 2πνAzmax. The discretespectrum |Jn(φ = 50)|2 of Fig. 1(a) remains thus mostly confined between ±Φ, and dropsabruptly from a maximum reached close to n =±Φ to almost zero [27].
In order to reconstruct the object velocity map at given time of the vibration motion, we haveconsidered a stroboscopic illumination. The field E(t) is thus multiplied by the rectangularfunction Hx,δx(t) of period TA = 1/νA
Hx,δx(t) = 0 for t/TA < x−δx/2 (7)
= 1 for x−δx/2 < t/TA < x+δx/2
= 0 for x+δx/2 < t/TA
where xTA and δxTA are the illumination time and illumination duration. The scattered fieldbecomes thus:
E(t) = E Hx,δx(t) e j2πν0t+ jϕ(t) (8)
= E ∑n
An,x,δx(Φ)e j2πνnt
where E An,x,δx is the amplitude of the nth sideband component.We have calculated An,x,δx from Eq. (8) by numerical Fast Fourier Transform, and we have
plotted on Fig. 1(b-d) the energy |An,x,δx|2 as a function of n for different illumination phasedelays xTA and and different illumination durations δxTA. The energy |An,x,δx|2 is centered onthe Doppler shift n corresponding to the instantaneous velocity V at time xTA:
nνA = 2v(xTA)
λ=−2
Vmax
λsin(2πx) (9)
For Φ = 50 and x = 0.25 0.35, 0.45, 0.55 , 0.65 and 0.75, we get n = -50, -40.4, -15.4, +15.4+40.4 and +50 respectively, in good agrement with the curves plotted of Fig. 1(b-d). As ex-pected, the shape of the energy spectrum |An,x,δx|2 strongly depends on the illumination dura-tion δxTA.
For short illumination duration (i.e. δx = 0.05 on Fig. 1(d) ), we get a wide distribution ofthe energy along n, whose shape do not depends on illumination time xTA. This is expectedsince the illumination duration is to short to define the Doppler shift frequency precisely. One
#170209 - $15.00 USD Received 8 Jun 2012; revised 7 Sep 2012; accepted 9 Sep 2012; published 20 Sep 2012(C) 2012 OSA 24 September 2012 / Vol. 20, No. 20 / OPTICS EXPRESS 22864
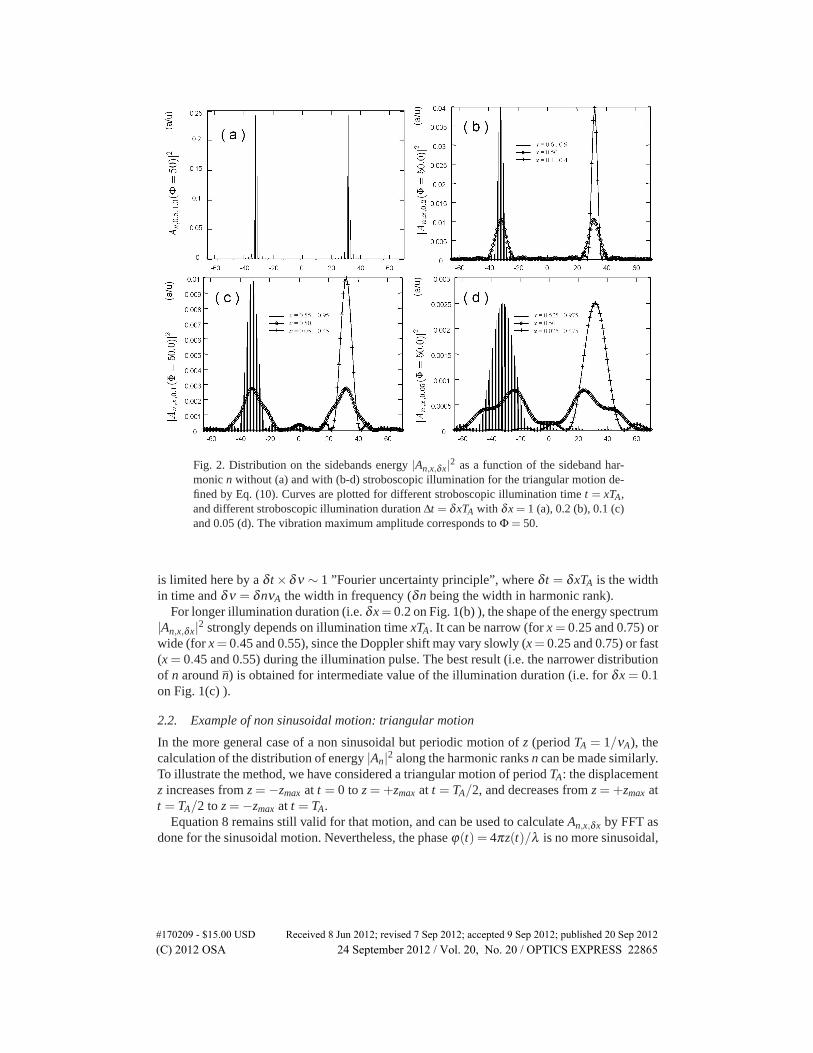
Fig. 2. Distribution on the sidebands energy |An,x,δx|2 as a function of the sideband har-monic n without (a) and with (b-d) stroboscopic illumination for the triangular motion de-fined by Eq. (10). Curves are plotted for different stroboscopic illumination time t = xTA,and different stroboscopic illumination duration Δt = δxTA with δx = 1 (a), 0.2 (b), 0.1 (c)and 0.05 (d). The vibration maximum amplitude corresponds to Φ = 50.
is limited here by a δ t ×δν ∼ 1 ”Fourier uncertainty principle”, where δ t = δxTA is the widthin time and δν = δnνA the width in frequency (δn being the width in harmonic rank).
For longer illumination duration (i.e. δx= 0.2 on Fig. 1(b) ), the shape of the energy spectrum|An,x,δx|2 strongly depends on illumination time xTA. It can be narrow (for x = 0.25 and 0.75) orwide (for x= 0.45 and 0.55), since the Doppler shift may vary slowly (x= 0.25 and 0.75) or fast(x = 0.45 and 0.55) during the illumination pulse. The best result (i.e. the narrower distributionof n around n) is obtained for intermediate value of the illumination duration (i.e. for δx = 0.1on Fig. 1(c) ).
2.2. Example of non sinusoidal motion: triangular motion
In the more general case of a non sinusoidal but periodic motion of z (period TA = 1/νA), thecalculation of the distribution of energy |An|2 along the harmonic ranks n can be made similarly.To illustrate the method, we have considered a triangular motion of period TA: the displacementz increases from z =−zmax at t = 0 to z =+zmax at t = TA/2, and decreases from z =+zmax att = TA/2 to z =−zmax at t = TA.
Equation 8 remains still valid for that motion, and can be used to calculate An,x,δx by FFT asdone for the sinusoidal motion. Nevertheless, the phase ϕ(t) = 4πz(t)/λ is no more sinusoidal,
#170209 - $15.00 USD Received 8 Jun 2012; revised 7 Sep 2012; accepted 9 Sep 2012; published 20 Sep 2012(C) 2012 OSA 24 September 2012 / Vol. 20, No. 20 / OPTICS EXPRESS 22865

but is given by:
ϕ(t) = (−1+4t/TA)Φ (10)
ϕ(t +TA/2) = (+1−4t/TA)Φ
where 0 < t < TA/2 and Φ = 4πzmax/λ .We have calculated by FFT An,x,δx from Eq. (8) and Eq. (10). We have plotted the energy
distribution |An,x,δx|2 without stroboscopic illumination on Fig. 2(a), and with stroboscopicillumination on Fig. 2(b-d). We have plotted |An,x,δx|2 for different illumination phase delaysxTA and and different illumination durations δxTA. The distributions of the energy |An,x,δx|2plotted here on Fig. 2 are very different than for the sinusoidal motion of same maximumamplitude ±zmax plotted on Fig. 1.
For 0.5 < x < 1.0, the displacement z decreases at constant velocity, and the shape of theenergy distribution |An,x,δx|2, which is shifted to the negative harmonic rank n < 0, not dependson the illumination time x. For 0 < x < 0.5 a similar result is obtained: the shape do not change,but the shift is positive: n > 0 since z increases. These results are expected for a triangularmotion.
The analysis of distribution of energy |An,x,δx|2 as a function of harmonic rank n, illuminationtime xTA and illumination duration δxTA yields detailed informations on the motion and on itsnon harmonic components.
3. Experimental setup
The sideband holography setups presented in previous publications does not allow to recon-struct the object at a given time of the vibration motion. To circumvent this problem, we haverealized a stroboscopic illumination synchronized on the vibration motion. Figure 3 (a) showsthe optical part of our setup, which is similar to the setups previously described [23,27]. Figure3 (b) shows the electronic, which drives the acousto optics modulators AOM1 and AOM2, andwhich has been modified to add amplitude modulation abilities. This electronic is based on 3direct digital synthesizer signal generators (SG1, 2 and 3), which are locked on the same 10MHz time base. SG1 excites the loudspeaker, which makes the reed vibrate at νA = 2143 Hz.SG2 generates a frequency tunable sinusoidal signal at νSG2 � 20 MHz, and a reference fixedfrequency 10 MHz signal, which is doubled by a frequency doubler (FD2: Mini Circuit LabInc.). SG3 generates a rectangular gate of duration 0.15× TA = 70 μs at frequency νA. Thisgate (SG3) is synchronized with respect to the reed excitation (SG1) with an electronicallyadjustable phase delay xTA.
To realize the stroboscopic illumination, two NAND Logical Gates LG, driven by the SG3gate, switch on and off the adjustable and the fixed 20 MHz frequency signals. The two 20 MHzgated signals obtained by the way are mixed with the signal of a 100 MHz quartz oscillator bytwo doubled balanced mixer (ZAD-1H: Mini Circuit Lab Inc.). We get thus two gated signalsthat exhibit two frequency components � 100 MHz ± 20 MHz. The signals at νAOM1 = 80MHz and νAOM2 � 80 MHz that drive the acousto optic modulators AOM1 and AOM2, arethus obtained by filtering the � 100 MHz ± 20 MHz signals with two 80 MHz LC resonantamplifiers.
Figure 4 illustrates the synchronization of the various signals. Out of the gate, the νAOM2 andνAOM2 signals are off, and one get no optical signals on the grating orders +1 of the acoustooptic modulators AOM1 and AOM2. The illumination and reference beams are then off. Ourstroboscopic gate acts thus both on illumination, and on holographic reference (i.e. on holo-graphic detection efficiency).
The data acquisition is made by a computer that drive the three signal generators SG1, SG2and SG3. For every value of the stroboscopic delay xTA, the harmonic rank of detection is
#170209 - $15.00 USD Received 8 Jun 2012; revised 7 Sep 2012; accepted 9 Sep 2012; published 20 Sep 2012(C) 2012 OSA 24 September 2012 / Vol. 20, No. 20 / OPTICS EXPRESS 22866

Fig. 3. Optical setup (a), and electronic (b) that drives the acousto optic modulator and theloudspeeker. (a) L: laser; AOM1,2: accousto optic modulators driven at frequency νAOM1,2;M: mirrors; BS: beam splitter; BE: beam expander; LS: loudspeaker exciting the clarinetreed at frequency νA/2; CCD: CCD camera. (b) SG1,2,3: direct digital synthesizer (DDS)signal generators;; Quartz: 100 MHz quartz oscillator; LG: NAND logical gate; DBM:double balanced mixer; Ampl: 20 MHz and 80 MHz LC resonant amplifiers.
swept from n = −100 to n = +100, i.e., for each n, the computer drives SG2 such a way thefrequencies of the acousto-optics modulators signals verify:
νAOM1 −νAOM2 = nνA +νCCD/4 (11)
Four-phase heterodyne holography is then performed [25], i.e., a sequence of 4 images I0, ..., I3
is recorded yielding the complex hologram:
H = (I0 − I2)+ j(I0 − I2) (12)
The optical field image of the reed E(x,y) is reconstructed from H(x,y) with the standardone FFT (Fast Fourier Transform) method [29, 30], where x and y are the coordinates of the1024×1024 calculation matrix. The reconstructed images intensity I = |E|2 of rank n is storedin a 3D 1024×1024×201 cube of data with axes x, y and n. To the end, an image of the reedvelocities is extracted from the cube.
For each stroboscopic delay xTA the operations are repeated: the rank n is swept; for eachn the holograms are recorded, reconstructed and stored within the cube of data. Images of thevelocities are then obtained.
#170209 - $15.00 USD Received 8 Jun 2012; revised 7 Sep 2012; accepted 9 Sep 2012; published 20 Sep 2012(C) 2012 OSA 24 September 2012 / Vol. 20, No. 20 / OPTICS EXPRESS 22867

Fig. 4. Chronogram of the signals: (a) SG1 sinusoidal signal of period TA = 1/νA excitingthe reed; (b) SG3 rectangular gate and (c) �80 MHz gated signals driving the accousto-optical modulators AOM1 and AOM2.
4. Experimental results
Figure 5 shows nine reconstructed images of the reed with stroboscopic delay xTA with x =0, 0.3 and 0.7 (respectively from top to bottom), and for n = −60, 0 and +60 (respectivelyfrom left to right). Each image of Fig. 5 represents thus one component n of the instantaneousDoppler spectrum. Since the hologram are recorded off axis, the read images are off axis too. Tocenter the images of the reed, the 1024×1024 reconstructed images are truncated to 1024×512on Fig. 5. One recognize the reed on Fig. 5(b) to (h), and the reed + mouthpiece on Fig. 5(b,eand h). The right part of reed is clamped on the mouthpiece, while the tip, whose motion is free,is on the left.
On each image, we get signal on the zone (x,y) of the reed where the instantaneous Dopplershift 2V (x,y,xTA)/λ is close to nνA. This point is illustrated by Fig. 6 that show as a functionof the longitudinal axis y the reed displacement z(y,xTA) and the reed velocity V (y,xTA) atillumination time t = xTA. The size, shape and brightness of the zone with signal depend on thetime of illumination xTA (i), on the illumination duration δxTA (ii), and on the harmonic rank n(iii).
For delay time xTA = 0, we observe signal on a narrow bright zone of the reed for n = 60(Fig. 5(c) ), no signal for n=−60 (Fig. 5(a) ) and some signal for n= 0 (Fig. 5(b) ). This meansthat the reed is illuminated when it moves towards the detector, and only the n > 0 harmonicare generated, and detected. The narrow bright zone of Fig. 5(c) corresponds to the points of
#170209 - $15.00 USD Received 8 Jun 2012; revised 7 Sep 2012; accepted 9 Sep 2012; published 20 Sep 2012(C) 2012 OSA 24 September 2012 / Vol. 20, No. 20 / OPTICS EXPRESS 22868

Fig. 5. Reconstruction images of the reed at time xTA = 0 (a,b,c), 0.3 TA (d,e,f) and 0.7 TA(g,h,i) for n = −60 (a,d,g), 0 (b,e,h) and +60.0 (c,f,i). The images are displayed in loga-rithmic scale for the field intensity |E|2.
Fig. 6. Reed displacement z(y,xTA) and the reed velocity V (y,xTA) at illumination timet = xTA. The holographic signal on sideband of rank n is obtained if V (y,xTA) is close toV (n) = nλνA.
#170209 - $15.00 USD Received 8 Jun 2012; revised 7 Sep 2012; accepted 9 Sep 2012; published 20 Sep 2012(C) 2012 OSA 24 September 2012 / Vol. 20, No. 20 / OPTICS EXPRESS 22869

Fig. 7. Successive positions of the reed on a period TA. These images are obtained bytaking the section in the x = 268 (horizontal white dashed line of Fig. 5 (e) ) of the stackof reconstructed images for n = −100 to +100. The images are displayed in logarithmicscale for the optical field intensity |E|2.
the reed where the instantaneous velocity at time xTA = 0 is close to
Vn=60 = 60νAc/ν0 � 8×10⁻² m.s−1 (13)
For time 0.3TA, we observe a uniform signal on the reed for n = 0 (Fig. 5(e)) and no signalfor n = ±60 (Fig. 5 (d,f) ). This means that the reed is in a position of maximal amplitude ofoscillation, with a velocity near zero.
For time 0.7TA, the reed goes away from the detector. The results are similar to the onesobtained at time xTA = 0. We observe a narrow bright zone for n =−60 (Fig. 5(g) ), no signalfor n =+60 (Fig. 5 (i) ), and some signal for n = 0 (Fig. 5 (h) ).
To image the reed instantaneous velocities during vibration motion, we have swept the il-lumination time xTA from 0 to TA by step of 0.1 TA. For each time xTA, we have recorded thehologram for n = −100 to +100, and we have stored the 201 reconstructed images in a 3Dcube of data with axes x, y and n. The n axis corresponds to the Doppler shift, i.e. to the reedvelocity. We have performed cuts of the 3D data in order to extract 2D images along axis xand n (y being fixed). Figure 7 displays the cuts obtained for y = 256 , which correspond to thehorizontal white dashed line in Fig. 5 (e) ).
We actually obtain on Fig. 7 a direct visualization of the shape of the reed instantaneousvelocity, which varies with the illumination time xTA. Since the motion is a sine function of
#170209 - $15.00 USD Received 8 Jun 2012; revised 7 Sep 2012; accepted 9 Sep 2012; published 20 Sep 2012(C) 2012 OSA 24 September 2012 / Vol. 20, No. 20 / OPTICS EXPRESS 22870

time, the images of the instantaneous velocities of Fig. 7 are similar to images of the reeditself, shifted in phase by π/2. A movie, made with the 10 images of Fig. 7, is provided insupplementary material (Media 1). Another movie, with 20 images per period, is also provided(Media 2). The movie shows the evolution of the reed velocities, or the reed motion (if oneneglects the shift of phase).
We must notice that the images of Fig. 7 (or the supplementary material movie) correspond toa huge amount of data, since it is necessary to record, for every time xTA, 4 images by harmonicrank n with n = −100 to +100. We record thus 10× 4× 201 = 8040 images. The frequencyof acquisition of the camera being of 12.5 Hz, the total recording time is approximately 12minutes. It is necessary to add the time necessary for the calculation of reconstruction of holo-grams as well as the time needed to control, during acquisition, the change of frequency of thesynthesized signal generators SG2 and SG3. To get the 10 images of Fig. 7, the total time isthus about one hour.
5. Conclusion
This experiment demonstrates that it is possible to reconstruct a map of the instantaneous ve-locities of a vibrating object by combining sideband holography and stroboscopic illuminationsynchronized with the vibration motion. Although the amount of generated data is huge, its ac-quisition is quite simple, since it is fully automatized by using a computer that drives, throughsignal generators (SGs) and acousto optics modulators (AOMs), both the stroboscopic illumina-tion, and the tuning of the sideband detection. The computer then performs both data acquisitionand image reconstruction.
The technique is demonstrated here in the case of a simple sinusoidal oscillation. It can beextended to more complex periodic motions. One must notice that the technique is sensitive tothe direction of the instantaneous velocity (sign of n). The technique can thus be used to get thegeometrical shape of a vibration mode in order to remove any ambiguity.
#170209 - $15.00 USD Received 8 Jun 2012; revised 7 Sep 2012; accepted 9 Sep 2012; published 20 Sep 2012(C) 2012 OSA 24 September 2012 / Vol. 20, No. 20 / OPTICS EXPRESS 22871