Embed Size (px)
Citation preview
IMAGE ANALYSIS OF NON AQUEOUS PHASE LIQUID MIGRATION IN
AGGREGATED KAOLIN
CHIN PEI QI
Thesis submitted in fulfilment of the requirements
for the award of the degree of
B.Eng (Hons.) Civil Engineering
Faculty of Civil Engineering and Earth Resources
UNIVERSITI MALAYSIA PAHANG
JUNE 2015

vi
ABSTRACT
Laboratory experiments have been conducted using NAPL in a three-dimensional
rectangular acrylic model to study the migration of NAPL in double porosity soil.
Double porosity is an important feature in soil due to its influence on the migration of
liquids within the soil. NAPL is used as there is less research carried out to investigate
the flow of immiscible liquid in double porosity soil. Toluene has been used as NAPL
and aggregated kaolin have been utilized as double porosity soil. Experiments were
carried out to observe the migration of NAPL by obtaining the area of migration liquid,
the saturation of NAPL as well as the intensity of NAPL during migration. The
experiments were conducted using kaolin aggregates with three different moisture
contents which were 28%, 30% and 32% respectively. An image analysis procedure is
used to analyze the migration of NAPL in aggregated kaolin as well as determining the
effect of different moisture contents of aggregated kaolin in migration of NAPL. The
experimental results from image analysis have shown that the migration of NAPL will
increase as the moisture content increases. In conclusion, image analysis is capable of
observing and visualizing the migration of NAPL based on saturation, intensity and area
invaded by the NAPL in double porosity soil.

vii
ABSTRAK
Ujikaji makmal telah dijalankan menggunakan cecair bukan fasa akues (NAPL) dalam
sebuah model akrilik tiga dimensi berbentuk segi empat tepat untuk mengkaji migrasi
NAPL dalam tanah keliangan dua. Keliangan dua merupakan ciri yang penting dalam
tanah kerana ia akan mempengaruhi migrasi cecair dalam tanah. NAPL digunakan
dalam kajian ini kerana tidak banyak kajian telah dijalankan oleh para pengkaji untuk
menyiasat aliran cecair tidak larut dalam tanah keliangan dua. Toluena digunakan
sebagai NAPL dan agregat kaolin digunakan sebagai tanah keliangan dua. Ujikaji telah
dijalankan untuk memerhati migrasi NAPL dengan mendapatkan kawasan migrasi
cecair, ketepuan NAPL dan juga keamatan NAPL semasa migrasi. Eksperimen
dijalankan menggunakan tiga kandungan kelembapan yang berbeza dalam agregat
kaolin iaitu 28%, 30% dan 32%. Prosedur analisis telah digunakan sebagai alat untuk
menganalisis migrasi NAPL dalam agregat kaolin di samping juga mengenalpasti kesan
daripada kandungan kelembapan yang berbeza dalam agregat kaolin terhadap migrasi
NAPL. Hasil daripada ujikaji telah membuktikan bahawa migrasi NAPL akan
meningkat apabila kandungan kelembapan meningkat. Sebagai kesimpulan, analisis
imej berupaya dalam memerhati dan menggambarkan migrasi NAPL berdasarkan
ketepuan, keamatan dan kawasan yang disebarkan oleh NAPL dalam tanah keliangan
dua.

viii
TABLE OF CONTENT
Page
SUPERVISOR’S DECLARATION ii
STUDENT’S DECLARATION iii
ACKNOWLEDGEMENTS v
ABSTRACT vi
ABSTRAK vii
TABLE OF CONTENT viii
LIST OF TABLES xi
LIST OF FIGURES xii
LIST OF SYMBOLS xv
LIST OF ABBREVATION xvi
CHAPTER 1 INTRODUCTION
1.1 Background 1
1.2 Problem Statement 3
1.3 Objectives of Study 4
1.4 Scope of Study 4
1.5 Research Significance 4
CHAPTER 2 LITERATURE REVIEW
2.1 Non-Aqueous Phase Liquids (NAPLs) 6
2.1.1 Characteristics and Behavior of NAPLs 6
2.1.2 Toluene 8
2.2 Double Porosity 9
2.2.1 Double Porosity in Natural Media 10

ix
2.2.2 Double Porosity in Artificial Media 10
2.3 Image Analysis 11
2.3.1 Image Pro-Premier 9.1 11
2.3.1.1 Capture Images and Videos 12
2.3.1.2 Process and Enhance 12
2.3.1.3 Measure and Quantify 12
2.3.1.4 Count and Classify Objects 13
2.4 Past Related Works 13
CHAPTER 3 METHODOLOGY
3.1 Introduction 16
3.2 Before the Experiments 17
3.2.1 Apparatus and Materials 17
3.2.2 LNAPL Preparation 18
3.2.3 Aggregated Sample Preparation 18
3.2.4 Experimental Setup 21
3.3 During the Experiments 21
3.3.1 Camera Calibration 21
3.3.2 Image Capturing 21
3.4 After the Experiments 22
3.4.1 Image Processing by Image Pro-Premier 9.1 22
3.4.1.1 Calibration of Images into Actual Size of Model 23
3.4.1.2 Choose Ranges of Measurements 25
3.4.1.3 Defining a Region of Interest (ROI) 26
3.4.1.4 Smart Segmentation to Measure Objects within ROI 27
3.4.1.5 Exporting Data Table into Microsoft Excel 30

x
CHAPTER 4 RESULTS AND DISCUSSIONS
4.1 Introduction 31
4.2 Results 31
4.2.1 Migration of NAPL in Aggregated Kaolin of 31
28% Moisture Content
4.2.2 Migration of NAPL in Aggregated Kaolin of 36
30% Moisture Content
4.2.3 Migration of NAPL in Aggregated Kaolin of 42
32% Moisture Content
4.3 Discussions 46
CHAPTER 5 CONCLUSIONS AND RECOMMENDATIONS
5.1 Conclusions 51
5.2 Recommendations for Future Research 52
REFERENCES 53
APPENDICES
A Calculation to Determine Amount of Kaolin Granules Needed to Make 56
Aggregated Sample

xi
LIST OF TABLES
Table No. Title Pages
3.1 Kaolin properties 19
3.2 Weight of kaolin aggregate required 21
3.3 Frequency of image acquisition 22
4.1 Result from image analysis for 28% moisture content sample 32
4.2 Result from image analysis for 30% moisture content sample 37
4.3 Result from image analysis for 32% moisture content sample 42

xii
LIST OF FIGURES
Figure No. Title Pages
1.1 Example of result obtained from image analysis 2
2.1 Soil and water retention curve and classification of soil moisture
zones
8
2.2 Concept of double porosity 9
3.1 Overall research 17
3.2 Procedures for making kaolin samples 20
3.3 Procedures of analysis 23
3.4 Create new calibration 24
3.5 Quick calibration 24
3.6 Apply calibration to active image 25
3.7 Selecting types of measurements 26
3.8 Select ROI rectangle tool 27
3.9
Drawing ROI on active image
27
3.10 Smart Segmentation dialog 28
3.11
Segmenting objects
29
3.12
Segmenting backgrounds
29
3.13
Count to measure objects
30
3.14
Exporting data table
30
4.1
Graph of area of NAPL migration in kaolin aggregate of 28%
moisture content versus time
33
4.2
Graph of percentage area of NAPL migration in kaolin aggregate
34

xiii
of 28% moisture content versus time
4.3
Graph of mean intensity of NAPL in kaolin aggregate of 28%
moisture content versus time
34
4.4
Graph of saturation of NAPL in kaolin aggregate of 28% moisture
content versus time
35
4.5
4.6
4.7
4.8
4.9
4.10
4.11
4.12
4.13
4.14
4.15
4.16
Migration of NAPL in aggregated kaolin sample using image
analysis at the 0th
, 25th
, 50th
, 90th
, 150th
, 240th
, 480th
, 960th
and
2609th
seconds
Graph of area of NAPL migration in kaolin aggregate of 30%
moisture content versus time
Graph of percentage area of NAPL migration in kaolin aggregate
of 30% moisture content versus time
Graph of mean intensity of NAPL in kaolin aggregate of 30%
moisture content versus time
Graph of saturation of NAPL in kaolin aggregate of 30% moisture
content versus time
Migration of NAPL in aggregated kaolin sample using image
analysis at the 0th
, 25th
, 50th
, 90th
, 150th
, 240th
, 480th
, 960th
and
2009th
seconds
Graph of area of NAPL migration in kaolin aggregate of 32%
moisture content versus time
Graph of percentage area of NAPL migration in kaolin aggregate
of 32% moisture content versus time
Graph of mean intensity of NAPL in kaolin aggregate of 32%
moisture content versus time
Graph of saturation of NAPL in kaolin aggregate of 32% moisture
content versus time
Migration of NAPL in aggregated kaolin sample using image
analysis at the 0th
, 25th
, 50th
, 90th
, 150th
, 240th
, 480th
, 960th
and
1103th
seconds
Graph of area of NAPL migration versus time in kaolin sample
36
38
39
39
40
41
43
44
44
45
46
47

xiv
4.17
4.18
with moisture content of 28%, 30% and 32%
Graph of intensity of NAPL migration versus time in kaolin
sample with moisture content of 28%, 30% and 32%
Graph of saturation of NAPL migration versus time in kaolin
sample with moisture content of 28%, 30% and 32%
48
49

xv
LIST OF SYMBOLS
% Percentage
cm Centimeter
ppm
Parts per million
g Gram
Kg/m³ Kilogram per metre cube
min Minute
s Second
bpp Bits per pixel
Cm2
Centimeter square
Lum Luminosity
cm²/s Centimeter square per second

xvi
LIST OF ABBREVIATIONS
NAPL Non Aqueous Phase Liquid
DNAPL Dense Non Aqueous Phase Liquid
LNAPL Light Non Aqueous Phase Liquid
VOC Volatile Organic Compound
HDR High Dynamic Range
RGB Red-Green-Blue
HSL Hue-Saturation-Lightness
HSI Hue-Saturation-Intensity
IAT Image Analysis Techniques
DSLR Digital Single-Lens Reflex

CHAPTER 1
INTRODUCTION
1.1 Background
In this modern and fast developing era, computer analysis is commonly used and
widely applied in various fields including civil engineering because it enables us to see
how the system in the model responds and provides an accurate database for us before
the real product is produced. Besides, it also saves time and cost as we don’t need to
build the prototype which is time consuming and expensive in order to obtain the result.
Image analysis is a type of computer analysis that is used to extract meaningful
information from images. This includes identifying shapes, counting objects,
determining colors and also measuring object properties. Edge detection, shape
detectors, color-based segmentation, and image thresholding are common image
analysis algorithms. A detailed statistics can be obtained from images to provide human
analysts with additional quantitative and qualitative data through the combinations of
these common image processing techniques with region analysis functions. Figure 1.1
shows an example of result obtained from an experiment using image analysis. From
the figure, the flow of liquid with time in each stage and the saturation profile are
clearly observed.

2
Figure 1.1: Example of result obtained from image analysis
In civil engineering, image analysis is often used to study the movement and
behaviour of very small and tiny properties in a structure. For instance, void and
porositiness in soils is hard to be seen with naked eyes. According to Burger and
Shackelford (2001) and Mandique (2007), there were two scales of porosity from
natural and manmade geomaterials with macro pores surrounding micro pores. From
Coppola (2000) and Jongmans et al. (2003) view, double porositiness may arise due to
root holes, worm holes and cracks in soils or the aggregated nature of the medium.
Garga (1988) had reviewed that fissuring and cracking are the most common defects
that could be observed in heavily overconsolidated and desiccated clay, whereas during
soil compaction on dry side of the optimum moisture content, aggregation often occurs
in agricultural soils and compacted soils as stated by Romero et al. (1999). In this

3
research, NAPL will be used to study the migration of liquid between the two scales of
porosity in aggregated soils by image analysis.
Contamination of the subsurface by hydrocarbons is one of the most challenging
environmental problems because they contaminate the subsurface through accidental
spillage or poorly designed disposal. Petroleum products such as benzene, toluene,
ethylbenzene and xylene as well as chlorinated solvents are some of the most commonly
encountered contaminants resulting from industrial activities as explained by Wang et al.
(1996). These compounds usually exist in the subsurface in the form of NAPL because
of their low aqueous solubility due to their non-polar molecular structure as stated by
Pankow and Cherry (1996). Because of their low solubility in water, residual NAPLs
constitute a long-term source of groundwater contamination. NAPLs are able to
migrate to the water table and eventually become trapped in the water-saturated zone as
residual ganglia occupying one or few pores and held in place by capillary forces.
1.2 Problem Statement
Water contamination by NAPL during agricultural activities as well as oil and
gas activities is a concern in this era. A lot of research had been carried out to study the
migration of NAPL in soil. So far, not many researches were done using image analysis
to study the migration of NAPL in double porosity aggregated soil. In this research,
image analysis is used to reproduce a dynamic NAPL saturation profile during
experiments and to analyze the result of the NAPL migration in the aggregated kaolin of
double porosity through lab experiments. Besides that, very little research had been
done so far to study effect of different moisture content on migration of NAPL in
aggregated soil. Through this research, effect of different moisture content can be
determined by comparing the results from image analysis.

4
1.3 Objectives of Study
In any research, there are some objectives to be achieved. In this research, the objectives
are:
i. To create the aggregated kaolin samples with different moisture contents
in the laboratory.
ii. To analyze the migration of toluene in the aggregated kaolin samples by
using image analysis.
iii. To study the effect of different moisture content on toluene migration in
the aggregated kaolin samples.
1.4 Scope of Study
In this research, samples of kaolin aggregates will be prepared with different
moisture contents of 28%, 30% and 32% respectively. The experiments will be
conducted at least once for each moisture content to achieve consistency of NAPL
migration. Then, a physical acrylic model with size of 10 cm x 5 cm x 30 cm will be
prepared in the laboratory to accommodate a kaolin aggregates samples with size of 10
cm x 5 cm x 10 cm. Toluene will be poured into the kaolin aggregate samples while
pictures will be taken using a camera and time will be taken until the toluene settles
down. Next, image analysis will be conducted by using Image Pro-Premier 9.1. Lastly,
the migration of toluene in aggregated kaolin samples will be studied and analyzed
through images captured from DSLR camera.
1.5 Research Significance
The research provides a clearer study and analysis of migration of NAPL in the
aggregated kaolin samples with different moisture contents by using image analysis.
Image analysis will reproduce dynamic NAPL saturation profile during the whole
process of experiment until the NAPL settles down. The result is beneficial to
agriculture as well as oil and gas sectors in order to overcome oil spills problem that
might happen during agriculture activities and oil and gas activities in the sea. Besides
that, image analysis is a safe, low risk and cost effective method to do analysis on this

5
research as it is non destructive and non intrusive to the whole process of experiments
as well as to the environment. Hence, it is a reliable method chosen by many researchers
to conduct their experiments without harming the environment.

CHAPTER 2
LITERATURE REVIEW
2.1 Non Aqueous Phase Liquids (NAPLs)
NAPLs are a type of chlorinated compounds or the products of petroleum
hydrocarbon/products. NAPLs are often found or encountered at sites that are
contaminated, especially at chemical production and industrial manufacturing facilities
as stated by Kaluarachchi (2001).
NAPLs are divided into two types; LNAPL and DNAPL. LNAPL are those
liquids that are less dense than water, mainly petroleum products such as gasoline,
toluene, benzene, xylene and ethylbenzene. Petroleum products are usually low
molecular weight hydrocarbons of which the water solubility is almost similar to
chlorinated hydrocarbons. Chlorinated hydrocarbons are compounds with low
molecular weight and almost immiscible in water. They have volatile properties and
also classified as DNAPL. DNAPL are those liquids that are denser than water. Some
other examples of DNAPL are coal tar waste, creosote-based wood-treating oils,
chlorinated solvents and polychlorinated biphenyl compounds (PCBs).
2.1.1 Characteristics and Behavior of NAPLs
The migration of NAPLs in a medium is divided into two types of conditions;
through unsaturated zone and through saturated zone as stated by Kehew (2006).

7
In an unsaturated porous medium, migration of NAPLs behaves in a way similar
to that of flow of water. A capillary suction is applied on the NAPLs when the fluid is
below the level of saturation of pores. This condition is similar to that applied on water
but water is a more adhesive medium compared to non-polar organics when in contact
with soil sub-surfaces. NAPLs in two or three phase unsaturated system is also known
as the non-wetting fluid. This is because water, also known as wetting fluid, normally
fills up the whole surface of solids in the medium. The movement of NAPLs also varies
through wet porous medium and through dry porous medium. Hence, different moisture
contents in porous medium will also affect the migration of NAPLs.
Initially, a NAPL is released into an unsaturated zone and it will move
downwards by gravitational forces. The fluid will then be resisted by capillary forces
during the stage of residual saturation development. To pass through the medium, the
NAPL is to remove the existing pore fluids where it is easy in the pendular zone due to
the par of filled pores. Rate of movement of fluid is highly caused by the viscosity of
fluid, which is the internal friction within the fluid that causes movement resistance, and
also the size of grain of soil. Coarse-grained soils tend to have a lower residual
saturation of water and hence it is easier to migrate a NAPL through them. When the
NAPL reaches the funicular zone, the rate of movement becomes slower due to pressure
build up against the resistance of the higher saturation percentage of water. The
condition of pendular saturation, funicular saturation and residual air is shown in the
Figure 2.1. Migration of DNAPLs and LNAPLs in the unsaturated zone is similar. In a
condition where the residual saturation is achieved and exceeded, the fluid moves
downward to the water table. At that point, DNAPLs will behave differently from
LNAPLs. A layer of DNAPL might form a top layer at the saturated zone but the fluid
will permeate through the water table under sufficient pressure due to its high density to
the first layer of material with low permeability.

8
Figure 2.1: Soil water retention curve and classification of soil moisture zones
Source: Kehew (2006)
2.1.2 Toluene
Toluene (C6H5CH3) is harmful to human skin, mucous membrane and nervous
system as it is one of the most dangerous indoor pollutants among volatile organic
compounds (VOC) as stated by Chen, X.M. (1984). It is a kind of aromatic hydrocarbon
which possesses low olfactory threshold concentration, and the threshold limit value of
toluene vapor indoor concentration is 0.05 ppm according to the indoor air quality
standard as said by Huang et al. (2012). Toluene usage is wide and closely related to our
daily life. It is used widely in adhesive & ink manufacturing and thinner formulations,
dilutants for varnishes, lacquers and enamels. Besides, it is also used as solvent,
industrial feedstock, and as an additive to gasoline to boost octane ratings. Toluene is a
colourless liquid that is not soluble in water and it is a non-mutagenic and carcinogenic
compound. In addition, toluene is also a volatile liquid and hence it would have a

9
propensity to migrate to the atmosphere following an environmental release but does
not pose a hazard to the food.
2.2 Double Porosity
Double porosity refers to two scales of porosity in a mixture. In soils, double
porosity refers to the micro pores (intra-aggregate pores) and macro pores (inter-
aggregate pores) and it is closely linked to low permeability and high permeability
respectively. Double porosity theory in natural geomaterials is initially discovered by
Barenblatt et al. (1960). This concept is about a fractured rock formation that consists of
two media, which are the fractures (inter-aggregate pores) and the matrix blocks (intra-
aggregate pores). Both have their own characteristic properties and behaviour. The
primary porosity or the matrix blocks is in between the inter-aggregate pores with low
permeability meanwhile in the secondary or fracture porosity, those are with low
storage capacity with high permeability such as fractures. The concept of double
porosity is presented as in Figure 2.2 below.
Figure 2.2: Concept of double porosity
Source: Koliji (2008)
Natural and manmade geomaterials usually exhibit the two scales of porosity.
Various researches had been done and they stated that fluids especially NAPL prefers to
flow through the secondary porosity which includes fractures, fissures, cracks or inter-
10
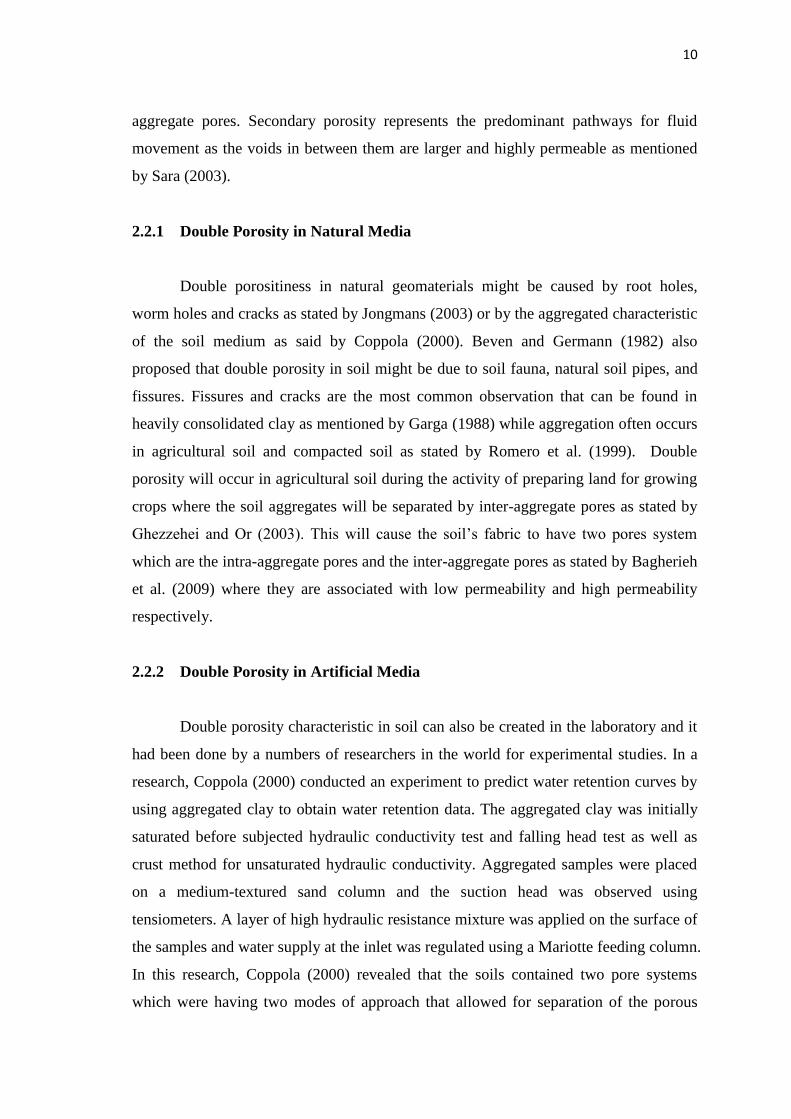
aggregate pores. Secondary porosity represents the predominant pathways for fluid
movement as the voids in between them are larger and highly permeable as mentioned
by Sara (2003).
2.2.1 Double Porosity in Natural Media
Double porositiness in natural geomaterials might be caused by root holes,
worm holes and cracks as stated by Jongmans (2003) or by the aggregated characteristic
of the soil medium as said by Coppola (2000). Beven and Germann (1982) also
proposed that double porosity in soil might be due to soil fauna, natural soil pipes, and
fissures. Fissures and cracks are the most common observation that can be found in
heavily consolidated clay as mentioned by Garga (1988) while aggregation often occurs
in agricultural soil and compacted soil as stated by Romero et al. (1999). Double
porosity will occur in agricultural soil during the activity of preparing land for growing
crops where the soil aggregates will be separated by inter-aggregate pores as stated by
Ghezzehei and Or (2003). This will cause the soil’s fabric to have two pores system
which are the intra-aggregate pores and the inter-aggregate pores as stated by Bagherieh
et al. (2009) where they are associated with low permeability and high permeability
respectively.
2.2.2 Double Porosity in Artificial Media
Double porosity characteristic in soil can also be created in the laboratory and it
had been done by a numbers of researchers in the world for experimental studies. In a
research, Coppola (2000) conducted an experiment to predict water retention curves by
using aggregated clay to obtain water retention data. The aggregated clay was initially
saturated before subjected hydraulic conductivity test and falling head test as well as
crust method for unsaturated hydraulic conductivity. Aggregated samples were placed
on a medium-textured sand column and the suction head was observed using
tensiometers. A layer of high hydraulic resistance mixture was applied on the surface of
the samples and water supply at the inlet was regulated using a Mariotte feeding column.
In this research, Coppola (2000) revealed that the soils contained two pore systems
which were having two modes of approach that allowed for separation of the porous

11
medium into inter-aggregate pores and intra-aggregate pores where double porosity
existence was found. Lewandowska et al. (2005) then conducted an experiment to show
that double porosity can be created in laboratory by mixing clayey sintered spheres
materials which have minute pore size with larger pore size of uniformly distributed
sand to produce two distinct pore sizes where double porosity can be traced. Another
research was carried out by Li and Zhang (2009) to study the formation of double
porosity in compacted and decomposed granitic soil as well as the progression of
microporosity structure in the samples throughout the wetting-drying process. The
formation of inter-aggregate pores and intra-aggregate pores were seen during
compaction and the inter-aggregate pores were very compressible when stress was
applied.
2.3 Image Analysis
Image analysis is a type of computer analysis that is used to extract meaningful
information from images which includes identifying shapes, counting objects,
determining colors and also measuring object properties. Edge detection, shape
detectors, color-based segmentation, and image thresholding are common image
analysis algorithms. A detailed statistics can be obtained from images to provide human
analysts with additional quantitative and qualitative data through the combinations of
these common image processing techniques with region analysis functions.
2.3.1 Image Pro-Premier 9.1
Image Pro-Premier 9.1 is a useful tool to ease the process of capturing,
processing, measuring, analyzing and sharing images as well as valuable data. Image
Pro-Premier 9.1 provides features which include capturing images and videos, process
and enhancement, measurement and quantification as well as counting and classifying
objects.

12
2.3.1.1 Capture Images and Videos
Image Pro-Premier 9.1 ensures a superior capture experience as it instantly
captures an image while live preview is running without loss of data. Besides that, it
records quick experiments that last for longer periods of time which is suitable to be
used in this research.
2.3.1.2 Process and Enhance
Image Pro-Premier 9.1 is equipped with auto alignment tools that enable the
alignment of individual images or images in a sequence for translation, rotation or
scaling inaccuracies. This software has HDR processing which allows a HDR image to
be created out of a sequence of images where different exposures of the same scene will
be presented using the widest possible range of dark to light pixels. Overlaying and
comparing images can be done with both live images and previously captured images.
Image compare workspace allows the placement of semi-transparent version of images
on top of each other so that we can clearly distinguish the differences and similarities
between images. It can be readily observed and saved as new images for report purposes
or for more analysis. On the other hand, extracting and merging colour channels are
possible using this software. It easily combines and separate images into RGB, HSL or
HSI colour channels. Moreover, it can reduce noise and enhance details with filters by
removing background noise and reveal hidden details with image processing filters and
previewing filters on an active image for instant result before applying filters.
2.3.1.3 Measure and Quantify
Calibration of images for analysis can be easily done using spatial and intensity
calibration tools. It comes with auto calibration feature which uses a stage micrometer
to automatically calibrate an image. Besides that, we can also detect and measure the
distance between edges along a defined line or changing intensity levels automatically.
Movement of object can also be tracked manually or automatically by following cells,
particles or other objects as they move through time and space. Objects that have faded
out of view or moved out of working space can also be tracked using Image Pro-