Embed Size (px)
Citation preview

1
www.icirr.org
Illinois’ Undocumented Immigrant Population: A Summary of Recent Research
by Rob Paral and Associates
By Fred Tsao Illinois Coalition for Immigrant and Refugee Rights
February 2014
This report is made possible through the generous support of the Polk Bros. Foundation, the John D. and Catherine T. MacArthur Foundation, the Illinois Funders DACA Relief
Initiative, and the Chicago Community Trust
55 E. Jackson Blvd, Suite 2075
Chicago, IL 60604 312 332-7360 www.icirr.org

1
www.icirr.org
Illinois’ Undocumented Immigrant Population: A Summary of Recent Research by Rob Paral and Associates
The numbers included in this report are based on estimates; the results should be used as a guide to understand the general characteristics of the community. Information regarding the methodology behind these figures is available at this link. More detailed data is available from Rob Paral and Associates, [email protected]. More than half of Illinois’ undocumented immigrants live in suburban Chicago Roughly 511,000 undocumented immigrants live in the state of Illinois. While concentrated in metro Chicago, these immigrants live in counties throughout the state.
Suburban Chicago is home to about 54% percent of the state’s undocumented population, compared to 36% who live in the city. DuPage, Kane, Lake, and Will Counties are each home to more than 10,000 undocumented residents, as are Aurora Township (Kane County), Waukegan Township (Lake), Elgin Township (Kane), and Cicero, Hanover, and Elk Grove Townships in Cook County. In Chicago, South Lawndale (Little Village) is the community area with the largest number of undocumented immigrants (20,000). Recent movements of immigrants have created large undocumented populations in Belmont Cragin, Gage Park, Albany Park, and Brighton Park that now outnumber the undocumented in Pilsen (Lower West Side).
Undocumented populations in selected Illinois regions
Estimated undocumented
population Share of total population that is
undocumented
Illinois 511,000 4%
Chicago 183,000 7%
Suburban Cook County 125,000 5%
Collar counties (DuPage, Grundy, Kane, Kendall, Lake, McHenry, Will)
151,000 4.5%
Downstate (94 counties) 53,000 1%
36%
24%
30%
10%
Geographic Distribution of Illinois Undocumented
Immigrants
Chicago Suburban Cook County
7 collar counties 94 downstate counties

2
www.icirr.org
Undocumented populations in selected Illinois regions
Selected Illinois counties Estimated undocumented population
Kane County 43,000
Lake County 39,000
DuPage County 36,000
Will County 22,000
Champaign County 11,000
McHenry County 8,000
Winnebago County 7,000
Undocumented populations in Chicago and surrounding communities
A more detailed on-line map of undocumented immigrant residential patterns throughout the state of Illinois is available at this link.

3
www.icirr.org
Undocumented populations in selected Illinois regions
Selected townships Estimated undocumented population
Aurora (Kane County) 23,000
Cicero (Cook) 18,000
Waukegan (Lake) 14,000
Hanover (Cook) 11,000
Elgin (Kane) 10,000
Elk Grove (Cook) 10,000
Joliet (Will) 9,000
Addison (DuPage) 9,000
Wheeling (Cook) 9,000
Leyden (Cook) 8,000
Proviso (Cook) 8,000
Avon (DuPage) 7,000
Palatine (Cook) 7,000
Maine (Cook) 7,000
Winfield (DuPage) 6,000
Bloomingdale (DuPage) 6,000
Schaumburg (Cook) 6,000
Dundee (Kane) 6,000
Du Page (Will) 5,000
Lyons (Cook) 5,000
Berwyn (Cook) 5,000
Selected Chicago community areas Estimated undocumented population
South Lawndale (Little Village) 20,000
Belmont Cragin 12,000
Gage Park 11,000
Albany Park 10,000
Brighton Park 9,000
Lower West Side (Pilsen) 8,000
Avondale 7,000
Logan Square 7,000
New City (Back of the Yards) 7,000
West Ridge 6,000
West Lawn 6,000
Chicago Lawn 6,000
Rogers Park 5,000
Irving Park 5,000

4
www.icirr.org
Illinois’ undocumented are largely from Latin America, but immigrants from Asia and Europe make up significant portions Latin American immigrants make up approximately 84% of Illinois’ undocumented population. Mexicans alone account for 77%. Asians make up approximately 9% of the undocumented population in Illinois, but make up 12% of the undocumented population in the collar counties and 21% of the undocumented downstate. The most significant Asian countries of origin are the Philippines, India, Korea, and China. Another 5% are from Europe, mostly from Poland, the former Soviet Union, and elsewhere in Eastern Europe.
Country/ region of origin of Illinois undocumented population
Number (share) from Mexico
Number (share) from
Latin America
Number (share) from Asia
Number (share) from
Europe
Illinois 392,000 (77%) 430,000 (84%) 48,000 (9%) 25,000 (5%)
Chicago 138,000 (75%) 155,000 (85%) 12,000 (7%) 11,000 (6%)
Suburban Cook 95,000 (76%) 102,000 (82%) 15,000 (12%) 6,000 (5%)
Collar counties 125,000 (83%) 136,000 (90%) 9,000 (6%) 4,000 (3%)
Downstate 94 counties 34,000 (64%) 37,000 (70%) 11,000 (21%) 3,000 (5%)
Illinois’ undocumented immigrants are largely younger adults Three out of every five undocumented immigrants in Illinois are between the ages of 25 and 44. The age distribution of the undocumented are consistent across the state, except that downstate the undocumented skew slightly younger.
Age distribution of Illinois undocumented population
Number (share)
under 18 Number (share)
age 18-24 Number (share)
age 25-44 Number (share) age 45 or older
Illinois 58,000 (11%) 78,000 (15%) 298,000 (58%) 77,000 (15%)
Chicago 19,000 (10%) 28,000 (16%) 106,000 (58%) 29,000 (16%)
Suburban Cook 15,000 (12%) 17,000 (14%) 72,000 (58%) 21,000 (17%)
Collar counties 18,000 (12%) 21,000 (14%) 91,000 (61%) 21,000 (14%)
Downstate 94 counties 7,000 (13%) 12,000 (23%) 28,000 (53%) 6,000 (11%)
11%
15%
58%
15%
Age Distribution of Illinois Undocumented Immigrants
Under 18 Years 18 to 24 Years 25 to 44 Years total 45 or older

5
www.icirr.org
Illinois’ undocumented immigrants skew slightly more male than the overall population, Compared to the general population of Illinois, which is split 49%-51% male-female, undocumented immigrants skew slightly more male, particularly in the collar counties and downstate. In suburban Cook, women outnumber men among the undocumented.
Gender distribution of Illinois undocumented population
Number (share) male Number (share) female
Illinois 265,000 (52%) 246,000 (48%)
Chicago 95,000 (52%) 87,000 (48%)
Suburban Cook 62,000 (50%) 63,000 (50%)
Collar counties 79,000 (53%) 71,000 (47%)
Downstate 94 counties 28,000 (54%) 24,000 (46%)
Illinois’ undocumented immigrants live overwhelmingly in families, many of which are mixed-status families that include U.S. citizen spouses and children Undocumented immigrants in Illinois live overwhelmingly in family households. Throughout the Chicago area, roughly nine in ten undocumented immigrants live in family households.
Illinois undocumented immigrants living in family households
Total undocumented
population
Undocumented immigrants living in family households
Share of undocumented immigrants who live in
family households
Illinois 511,000 454,000 89%
Chicago 183,000 160,000 88%
Suburban Cook 125,000 114,000 91%
7 collar counties 151,000 140,000 93%
Downstate 94 counties 53,000 40,000 75%
Among the undocumented immigrants in Illinois, nearly half are heads of households that include their spouse or minor children:
29% are married and living with their own minor children
10% are married with no children
8% are single parents living with their own minor children.
3% are single heads of households who do not live with their own children, but who live with other relatives.
11% are the undocumented minor children living with a parent.
20% live in family households as relatives of the head of the household; these individuals include adult children, parents, siblings, and other individuals who are related to the heads of household by birth, marriage, or adoption.
8% live in family households but are unrelated to the head of household. These persons include boarders, roommates, unmarried partners, and unrelated foster children.
11% of undocumented immigrants do not live in family households—that is, they do not live in a household in which any members are related to the head of the household.

6
www.icirr.org
Relationship and household type among Illinois undocumented immigrants
Married householder
with own minor children
Single householder
with own minor children
Married householder without own
children
Single family householder without own
minor children
Illinois 149,000 43,000 53,000 14,000
Chicago 48,000 15,000 19,000 6,000
Suburban Cook 38,000 11,000 15,000 4,000
7 collar counties 50,000 13,000 14,000 3,000
Downstate 94 counties 13,000 4,000 6,000 1,000
29%
8%
10%
3%11%
20%
8%
11%
Relationship and household type among Illinois undocumented immigrants
Married householder with own children
Single householder with own children
Married householder without own children
Single family householder without own children
Minor children living with parent
Other relative in family household
Nonrelative in family household
In non-family household

7
www.icirr.org
Relationship and household type among Illinois undocumented immigrants
Minor children living with
parent
Other relatives living in family
household
Nonrelatives living in family
household
In non-family household or
group quarters
Illinois 54,000 100,000 41,000 57,000
Chicago 18,000 41,000 13,000 23,000
Suburban Cook 14,000 25,000 8,000 11,000
7 collar counties 16,000 29,000 16,000 10,000
Downstate 94 counties 6,000 6,000 5,000 13,000
Roughly 5% of all Illinois households, and 6% of family households, include at least one undocumented immigrant. In Chicago alone, more than 8% of total households and more than 12% of family households include at least one undocumented immigrant.
Illinois households that include undocumented immigrants
Total households
Households with at least one undocumented
member
Share of total households that have at least one
undocumented member
Illinois 4,745,000 237,000 5%
Chicago 1,015,000 85,000 8%
Suburban Cook 904,000 59,000 6%
7 collar counties 1,130,000 69,000 6%
Downstate 94 counties 1,696,000 25,000 1%
Illinois family households that include undocumented immigrants
Total family households
Family households with at least one
undocumented member
Share of total family households that have at least one undocumented member
Illinois 3,121,000 198,000 6%
Chicago 559,000 68,000 12%
Suburban Cook 619,000 51,000 8%
7 collar counties 839,000 61,000 7%
Downstate 94 counties 1,104,000 18,000 2%
Of those Illinois family households that include at least one undocumented immigrant, 87% are mixed-status--that is, they also include at least one U.S. citizen or immigrant with lawful status-and 74% include a native-born U.S. citizen. In the collar counties surrounding Chicago, 90% of family households are mixed-status, and 79% include at least one native-born U.S. citizen.

8
www.icirr.org
Approximately 886,000 Illinois residents live with relatives in family households that include at least one undocumented immigrant. (This count includes the immigrants themselves and all other relatives in the family household, regardless of the status of those relatives.) Of these residents, roughly 799,000 (90%) live in mixed-status households that also include a family member who is a U.S. citizen or has lawful immigration status. Roughly 711,000 (80%) live in a household with at least one native-born U.S. citizen and one undocumented immigrant.
Related persons in Illinois living in family households that include at least one undocumented immigrant
Related persons in family households that
include at least one undocumented
immigrant
Number (share) of these Individuals in
households that also a legal immigrant or a U.S.
citizen
Number (share) of these individuals in
households that also include a native-born
citizen
Illinois 886,000 799,000 (90%) 711,000 (80%)
Chicago 301,000 266,000 (88%) 233,000 (77%)
Suburban Cook 238,000 217,000 (91%) 190,000 (80%)
7 collar counties 273,000 252,000 (92%) 230,000 (84%)
Downstate 94 counties 74,000 65,000 (88%) 58,000 (78%)
About 145,000 Illinois families with children include at least one undocumented parent, making up 36% of all immigrant families with children. Among these families, 126,000 (88%) include at least one native-born child, and 107,000 (74%) include only native-born children.
Illinois family households with undocumented parents and U.S.-born children
Families with children that include at least one undocumented
parent
Number (share) of these families with at
least one U.S.-born child
Number (share) of these families with
only U.S.-born children
Illinois 145,000 126,000 (87%) 107,000 (74%)
Chicago 48,000 42,000 (87%) 35,000 (74%)
Suburban Cook 38,000 33,000 (86%) 29,000 (76%)
7 collar counties 46,000 41,000 (88%) 34,000 (73%)
Downstate 94 counties 13,000 11,000 (84%) 9,000 (72%)
Illinois family households that include both undocumented immigrants and U.S. citizens
Family households that include at least one
undocumented immigrant
Number (share) of such households that also
include a legal immigrant or a U.S. citizen
Number (share) of such households that also include a native-
born U.S. citizen
Illinois 198,000 172,000 (87%) 146,000 (74%)
Chicago 68,000 57,000 (84%) 47,000 (70%)
Suburban Cook 51,000 46,000 (89%) 38,000 (74%)
7 collar counties 61,000 55,000 (90%) 48,000 (79%)
Downstate 94 counties 18,000 15,000 (83%) 13,000 (70%)

9
www.icirr.org
In 55% of all Illinois married couples with at least one undocumented spouse, the other spouse is lawfully present (either native-born, naturalized, or lawful permanent resident). In 37% of these couples, the other spouse is a U.S. citizen.
Illinois married couples with at least one undocumented spouse
Married couples with at least one
undocumented spouse
Number (share) of these couples in which one spouse is lawfully
present
Number (share) of these couples in which
one spouse is a US citizen
Illinois 141,000 78,000 (55%) 53,000 (37%)
Chicago 46,000 25,000 (54%) 17,000 (38%)
Suburban Cook 38,000 23,000 (61%) 15,000 (38%)
7 collar counties 44,000 23,000 (53%) 16,000 (37%)
Downstate 94 counties 13,000 7,000 (54%) 5,000 (36%)
Illinois’ undocumented immigrants largely speak Spanish, but significant numbers speak Asian/Pacific languages More than four-fifths of Illinois’ undocumented immigrants speak Spanish. Roughly 20% of undocumented immigrants in downstate Illinois speak an Asian or Pacific Island language—a figure that corresponds to the 21% share of downstate undocumented immigrants who came to the U.S. from Asia.
Languages spoken by Illinois undocumented immigrants
Undocumented persons 5 years
old or older
Number (share) who speak Spanish
Number (share) who speak an Asian/Pacific
language
Illinois 505,000 415,000 (82%) 44,000 (9%)
Chicago 181,000 151,000 (83%) 10,000 (5%)
Suburban Cook 123,000 99,000 (81%) 15,000 (12%)
7 collar counties 150,000 131,000 (88%) 9,000 (6%)
Downstate 94 counties 52,000 34,000 (66%) 11,000 (20%)
Roughly half of Illinois’ undocumented immigrants have limited English proficiency Half of Illinois’ undocumented immigrants (254,000) have difficulty with English; 93,000 speak no English. About 57% of the undocumented in Chicago have limited English proficiency.
English proficiency among Illinois undocumented immigrants
Undocumented persons 5 years
old or older
Number (share) who speak English
not well
Number (share) who speak no
English
Illinois 505,000 161,000 (32%) 93,000 (19%)
Chicago 181,000 63,000 (35%) 41,000 (23%)
Suburban Cook 123,000 38,000 (31%) 22,000 (18%)
7 collar counties 150,000 45,000 (30%) 25,000 (17%)
Downstate 94 counties 52,000 15,000 (28%) 6,000 (11%)

10
www.icirr.org
Nearly half of Illinois’ undocumented immigrants have not completed high school, though a significant share have earned a college degree Approximately 47% of Illinois’ undocumented population (176,000) have not earned a high school diploma. About 30% (113,000) have never attended high school. On the other hand, 29% (109,000) have a high school diploma but never attended college, 8% (29,000) have attended college but have not earned a degree, and 16% (61,000) have earned at least an associate’s degree. In downstate Illinois, 20% of undocumented immigrants have earned at least a bachelor’s degree.
Educational attainment among Illinois undocumented immigrants
Undocumented persons 25 years old or
older
Did not attend
high school
Attended high
school, no diploma
Completed high school, no college
Attended college,
no degree
Completed at least
associate’s degree
Illinois 375,000 113,000 63,000 109,000 29,000 61,000
Chicago 135,000 43,000 21,000 41,000 10,000 21,000
Suburban Cook 93,000 27,000 13,000 29,000 8,000 17,000
7 collar counties 112,000 35,000 22,000 30,000 9,000 16,000
Downstate 94 counties
34,000 9,000 6,000 9,000 3,000 7,000
Roughly one-third of Illinois’ undocumented immigrants live below the federal poverty line Approximately 29% of Illinois’ undocumented immigrants (146,000) live below 100% of the federal poverty level ($23,550 for a household of four). Another 34% (171,000) are between 100% and 200% of the poverty line. In Chicago alone, 33% (60,000) are below 100% of the federal poverty level, and 67% (122,000) are below 200% of the poverty line.
30%
17%29%
8%
16%
Educational Attainment Among Illinois Undocumented Immigrants
No high school Some high school, no diploma
High school diploma, no college Some college, no degree
At least Associate's Degree

11
www.icirr.org
Income among Illinois undocumented immigrants
Undocumented persons for whom poverty status
is determined
Number (share) with income below 200% of federal poverty level
Number (share) with income below 100% of federal poverty level
Illinois 503,000 316,000 (63%) 146,000 (29%)
Chicago 181,000 122,000 (67%) 60,000 (33%)
Suburban Cook 124,000 70,000 (57%) 30,000 (24%)
7 collar counties 149,000 89,000 (60%) 38,000 (25%)
Downstate 94 counties 48,000 35,000 (72%) 18,000 (37%)
Under the Senate immigration reform bill, legalizing immigrants must either maintain regular employment or average income of at least 100% of the federal poverty level to renew their provisional status. To gain lawful permanent resident (green card) status, they must maintain regular employment or income of average income of at least 125% of the poverty line. Illinois’ undocumented immigrants participate in the state labor force at high rates, working in a broad range of industries and occupations Roughly 68% of undocumented immigrants participate in the Illinois labor force—a slightly higher participation rate than that of the general population (66%). The labor force participation rate is particularly high in the collar counties (75%).
Labor force participation among Illinois undocumented immigrants
Undocumented persons 16 years
old or older
Number (share) civilian employed
Number (share) civilian unemployed
Number (share) not in the labor
force
Illinois 465,000 286,000 (62%) 33,000 (7%) 145,000 (31%)
Chicago 168,000 99,000 (59%) 14,000 (9%) 54,000 (32%)
Suburban Cook 112,000 69,000 (61%) 7,000 (6%) 37,000 (33%)
7 collar counties 138,000 93,000 (68%) 10,000 (7%) 35,000 (25%)
Downstate 94 counties 47,000 25,000 (53%) 3,000 (6%) 19,000 (41%)
Roughly one-fifth of Illinois’ undocumented immigrants work in manufacturing, while another one-fifth work in accommodations and food services. Approximately 11% work in administrative and support services (including waste management), and another 10% work in construction.
Common industries of employment among Illinois undocumented immigrants
Manufacturing Accommodations and food services
Administrative and support
services
Construction
Illinois 63,000 (22%) 59,000 (21%) 31,000 (11%) 28,000 (10%)
Chicago 22,000 (23%) 21,000 (21%) 8,000 (8%) 12,000 (12%)
Suburban Cook 13,000 (19%) 12,000 (18%) 8,000 (12%) 8,000 (12%)
Collar counties 21,000 (22%) 22,000 (23%) 12,000 (13%) 6,000 (7%)
Downstate 94 counties 7,000 (27%) 5,000 (19%) 2,000 (7%) 1,000 (5%)
12
www.icirr.org
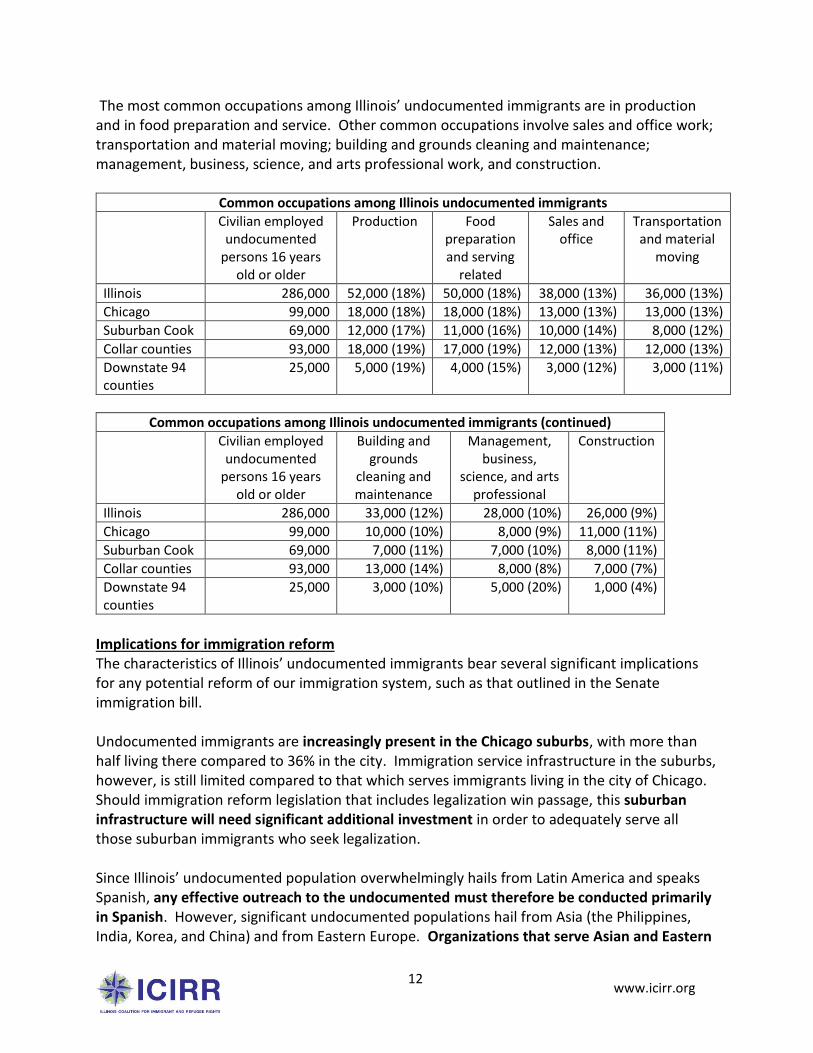
The most common occupations among Illinois’ undocumented immigrants are in production and in food preparation and service. Other common occupations involve sales and office work; transportation and material moving; building and grounds cleaning and maintenance; management, business, science, and arts professional work, and construction.
Common occupations among Illinois undocumented immigrants
Civilian employed undocumented
persons 16 years old or older
Production Food preparation and serving
related
Sales and office
Transportation and material
moving
Illinois 286,000 52,000 (18%) 50,000 (18%) 38,000 (13%) 36,000 (13%)
Chicago 99,000 18,000 (18%) 18,000 (18%) 13,000 (13%) 13,000 (13%)
Suburban Cook 69,000 12,000 (17%) 11,000 (16%) 10,000 (14%) 8,000 (12%)
Collar counties 93,000 18,000 (19%) 17,000 (19%) 12,000 (13%) 12,000 (13%)
Downstate 94 counties
25,000 5,000 (19%) 4,000 (15%) 3,000 (12%) 3,000 (11%)
Common occupations among Illinois undocumented immigrants (continued)
Civilian employed undocumented
persons 16 years old or older
Building and grounds
cleaning and maintenance
Management, business,
science, and arts professional
Construction
Illinois 286,000 33,000 (12%) 28,000 (10%) 26,000 (9%)
Chicago 99,000 10,000 (10%) 8,000 (9%) 11,000 (11%)
Suburban Cook 69,000 7,000 (11%) 7,000 (10%) 8,000 (11%)
Collar counties 93,000 13,000 (14%) 8,000 (8%) 7,000 (7%)
Downstate 94 counties
25,000 3,000 (10%) 5,000 (20%) 1,000 (4%)
Implications for immigration reform The characteristics of Illinois’ undocumented immigrants bear several significant implications for any potential reform of our immigration system, such as that outlined in the Senate immigration bill. Undocumented immigrants are increasingly present in the Chicago suburbs, with more than half living there compared to 36% in the city. Immigration service infrastructure in the suburbs, however, is still limited compared to that which serves immigrants living in the city of Chicago. Should immigration reform legislation that includes legalization win passage, this suburban infrastructure will need significant additional investment in order to adequately serve all those suburban immigrants who seek legalization. Since Illinois’ undocumented population overwhelmingly hails from Latin America and speaks Spanish, any effective outreach to the undocumented must therefore be conducted primarily in Spanish. However, significant undocumented populations hail from Asia (the Philippines, India, Korea, and China) and from Eastern Europe. Organizations that serve Asian and Eastern

13
www.icirr.org
European communities must therefore be included in any informational outreach and direct service should immigration reform win enactment. Illinois’ undocumented immigrants live predominantly in mixed-status families, often with a U.S. citizen spouse or child. This finding is contrary to the common image of undocumented immigrants as single and unattached. On the contrary, undocumented immigrants have strong equities in this country, a fact that provides a powerful argument against enforcement policies that separate these immigrants from their lawfully present spouses and children. Indeed, the fact that 78,000 undocumented immigrants in Illinois are married to a U.S. citizen or lawfully present immigrant spouse further suggests that any immigration reform legislation should fix the unlawful presence bars and other obstacles that currently block the undocumented spouses from gaining lawful status through sponsorship of the lawfully present spouses. Such fixes would remove the threat of deportation and separation for these couples, and offer a simpler and quicker alternative to legalization, which, if the Senate bill offers any indication, would involve a long and rigorous process. Undocumented immigrants will also need significant assistance to meet any educational, language, and work requirements that legalization might impose. Half of the state’s undocumented immigrants have difficulty with English, and roughly half have not earned a high school diploma. And while the undocumented have strong rates of labor force participation, nearly two-thirds have incomes below 200% of the federal poverty level. To have a fair opportunity to gain lawful status through a legalization program, our state’s undocumented immigrants will need to have available to them English language and vocational training programs that would enable them to enhance their education and job skills. Such programming would enable legalizing immigrants to not only meet the requirements of legalization but also to contribute even more to our state’s economic and civic life.