Embed Size (px)
Citation preview
Illicit Discharge Detection and Elimination (IDDE) 201:
Conducting IDDE InvestigationsU.S. EPA Stormwater Webcast Series
July 11, 2007
Jennifer ZielinskiCenter for Watershed Protection
Harry StarkCuyahoga County Board of Health
Nikos SingelisU.S. EPA Stormwater Program

Presentation Overview
IDDE 101 ReviewDesktop AssessmentsField AssessmentsIDDE Case StudyPost-Screening PrioritizationDetailed Sampling and Analysis

IDDE 101 Review
Nikos… what is an Illicit Discharge?

What is an Illicit Discharge?
A discharge to an MS4 that is not composed entirely of storm water except permitted discharges and fire fighting related discharges40 CFR 122.26(b)(2)- Unique frequency,
composition & mode of entry- Interaction of the sewage
disposal system & the storm drain system
- Produced from “generating sites”
IDDE 101 Review
Nikos… what can you tell me about Discharge
Frequencies?
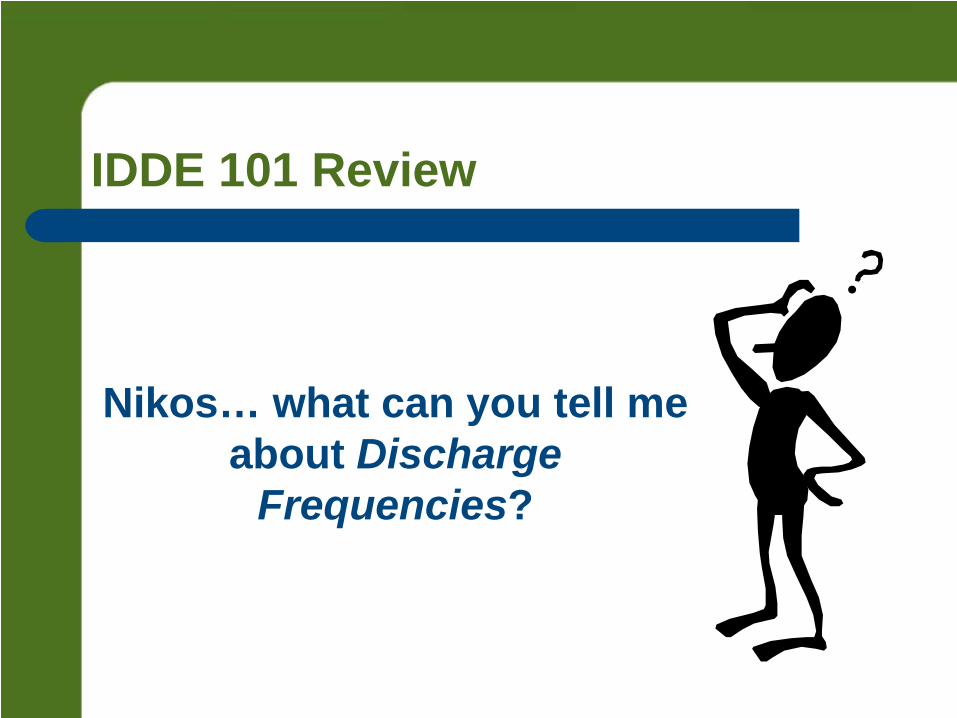
Discharge Frequency
Continuous discharges– Occur most or all of the time
Intermittent discharges– Occur over a shorter period of time (e.g., a few
hours per day or a few days per year)Transitory discharges– Occur rarely, usually in response to a singular
event such as an industrial spill, ruptured tank, sewer break, transport accident or illegal dumping episode

IDDE 101 Review
Nikos… what are some common Discharge Flow
Types?

Discharge Flow Types
Sewage & septage flows Washwater flowsLiquid wastesTap water *Landscape irrigation flows *Groundwater & spring water flows *
* Not typically considered illicit
IDDE 101 Review
Nikos… what are some typical Modes of Entry for
illicit discharges into storm sewers?
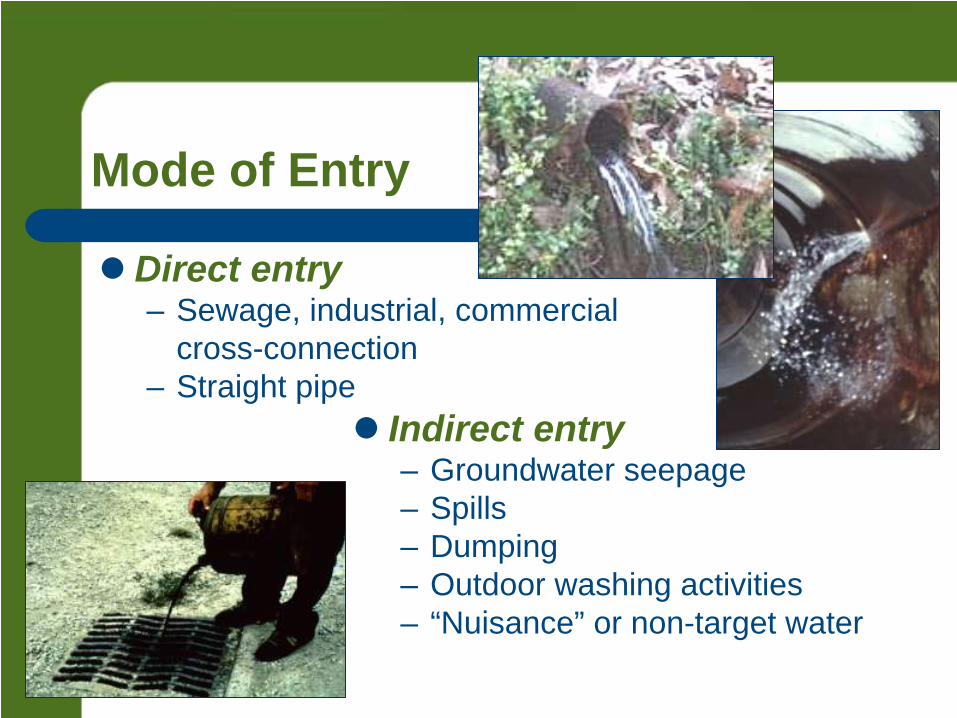
Mode of Entry
Direct entry– Sewage, industrial, commercial
cross-connection– Straight pipe
Indirect entry– Groundwater seepage– Spills – Dumping – Outdoor washing activities – “Nuisance” or non-target water
IDDE 101 Review
Nikos… what are Generating Sites?

Land Use & Potential Generating Sites
ResidentialCommercialIndustrialInstitutionalMunicipal
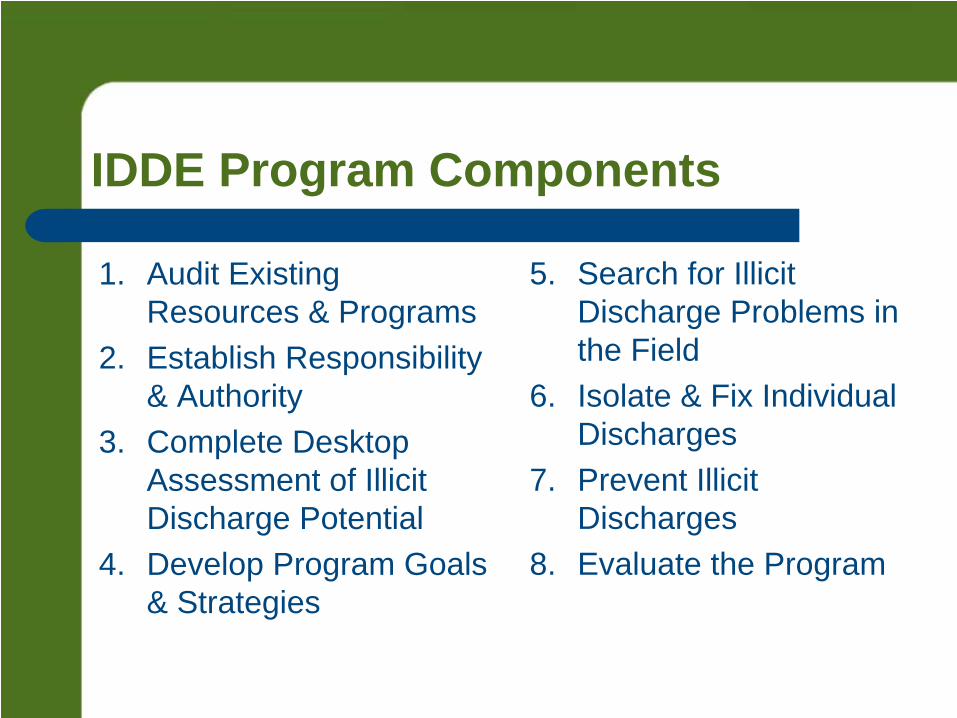
IDDE Program Components
1. Audit Existing Resources & Programs
2. Establish Responsibility & Authority
3. Complete Desktop Assessment of Illicit Discharge Potential
4. Develop Program Goals & Strategies
5. Search for Illicit Discharge Problems in the Field
6. Isolate & Fix Individual Discharges
7. Prevent Illicit Discharges
8. Evaluate the Program
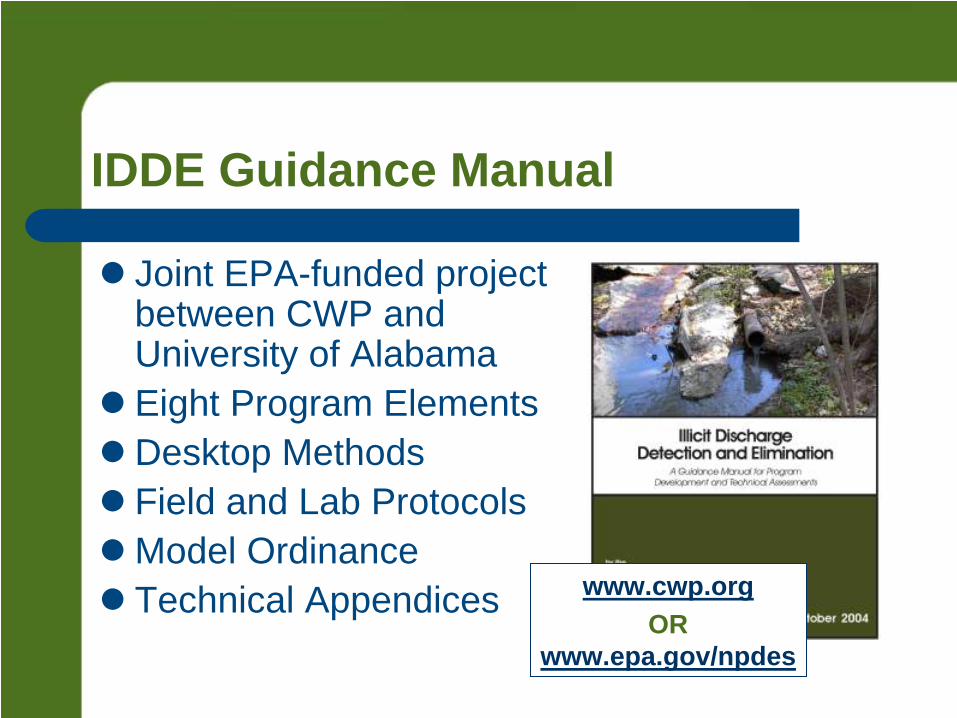
IDDE Guidance Manual
Joint EPA-funded project between CWP and University of AlabamaEight Program ElementsDesktop MethodsField and Lab ProtocolsModel OrdinanceTechnical Appendices www.cwp.org
ORwww.epa.gov/npdes
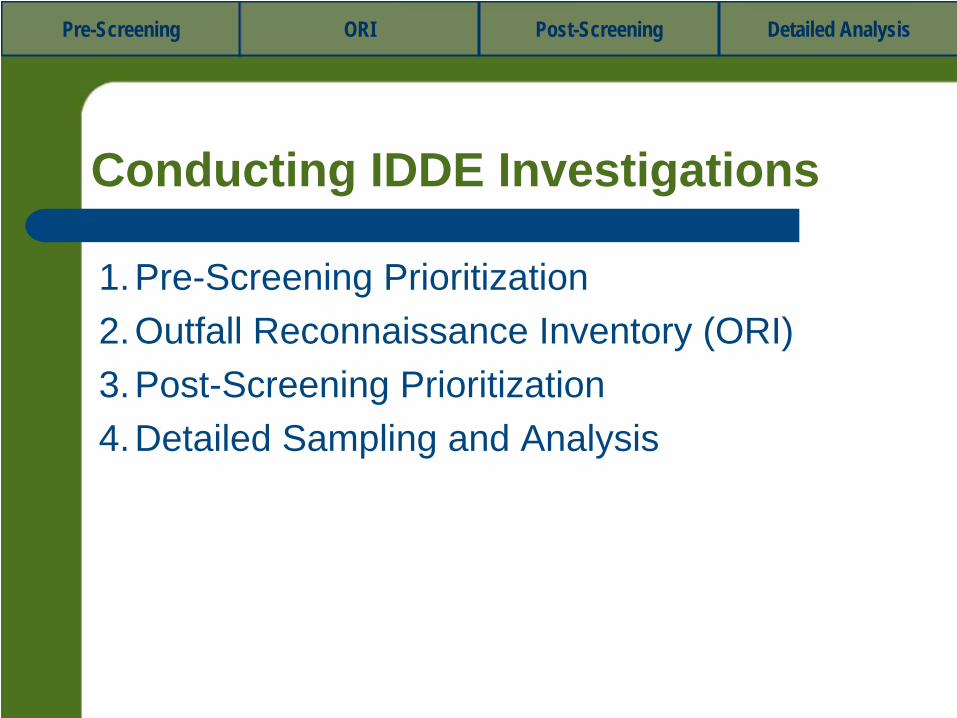
Conducting IDDE Investigations
1. Pre-Screening Prioritization2. Outfall Reconnaissance Inventory (ORI)3. Post-Screening Prioritization4. Detailed Sampling and Analysis
Pre-Screening ORI Post-Screening Detailed Analysis
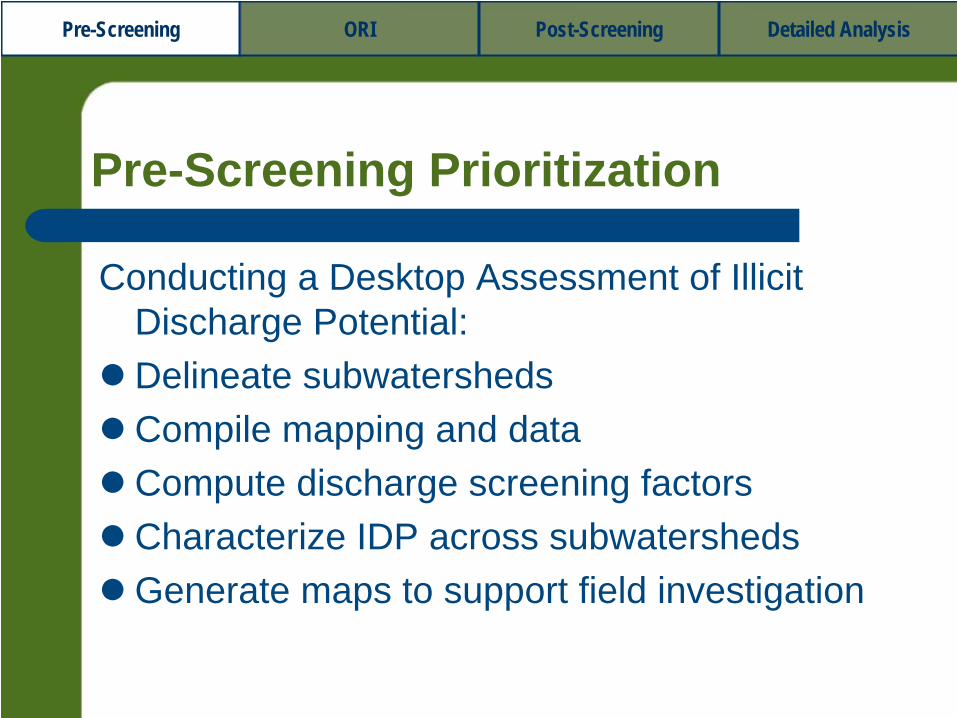
Pre-Screening Prioritization
Conducting a Desktop Assessment of Illicit Discharge Potential:Delineate subwatershedsCompile mapping and dataCompute discharge screening factors Characterize IDP across subwatershedsGenerate maps to support field investigation
Pre-Screening ORI Post-Screening Detailed Analysis

Screening Factors
Past Discharge ComplaintsPoor Dry Weather Water QualityDensity of Generating Sites Density of Industrial NPDES PermitsStormwater Outfall Density
Age of Subwatershed DevelopmentFormer Combined SewersOlder Industrial OperationsAging or Failing SewersDensity of Older Septic SystemsPast Sewer Conversions
Select the factors that apply most to your communitySelect the factors that apply most to your community
Pre-Screening ORI Post-Screening Detailed Analysis

Prioritizing Subwatersheds Using IDP Screening Factors
SubwatershedPast
discharge complaints
Poor dry weather
WQ
Density of SW outfalls
Average age of dev.
Raw IDP score
Normalized IDP score
Subwatershed A 8 (2) 30% (2) 14 (2) 40 (2) 8 2
Subwatershed B 3 (1) 15% (1) 10 (2) 10 (1) 5 1.25
Subwatershed C 13 (3) 60% (3) 16 (2) 75 (3) 11 2.75
Subwatershed D 1 (1) 25% (1) 9 (1) 15 (2) 5 1.25
Subwatershed E 5 (1) 15% (1) 21 (3) 20 (1) 6 1.5
Basis for Assigning Scores… 1 2 3
Past discharge complaints/reports (total # logged) < 5 5 - 10 > 10
Dry weather water quality (# times bacteria stds exceeded) < 25% 25 - 50% > 50%Storm water outfall density (# outfalls / stream mile) < 10 10 - 20 20
Average age of development (years) < 25 25 - 50 > 50
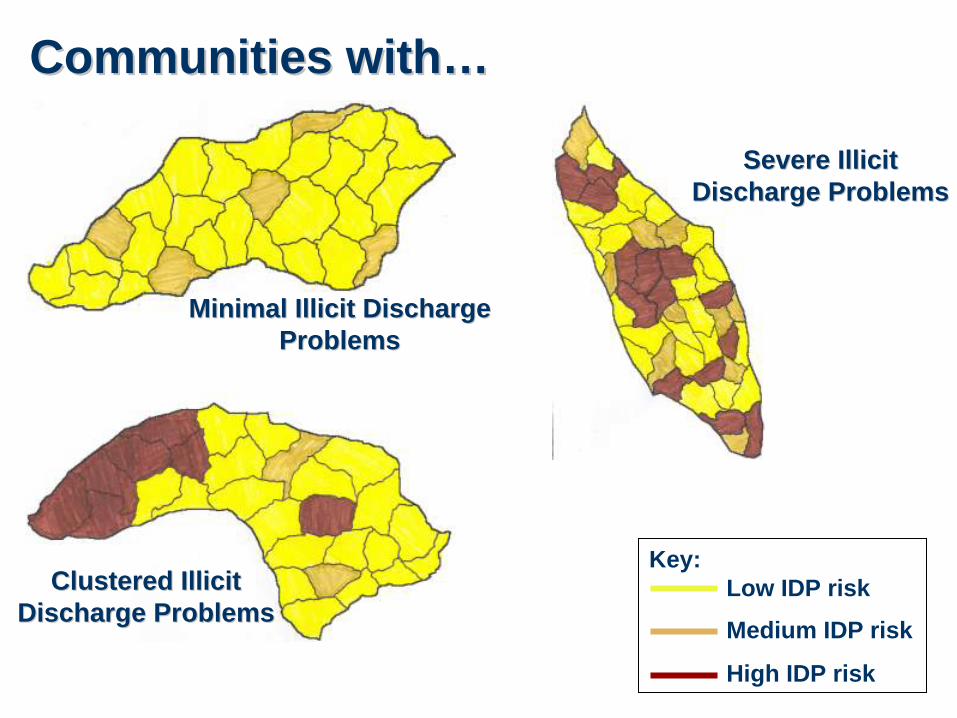
Key:Low IDP risk
Medium IDP risk
High IDP risk
Clustered Illicit Clustered Illicit Discharge ProblemsDischarge Problems
Communities withCommunities with……
Severe Illicit Severe Illicit Discharge ProblemsDischarge Problems
Minimal Illicit Discharge Minimal Illicit Discharge ProblemsProblems

Conditions Driving Program Setup
Minimal problems– Consider combining outfall surveys with a broader stream
assessment program
Clustered problems– Focus on confined subwatersheds, reaches, or specific
industries where history of suspect discharges exist
Severe problems– Recognize that IDDE program will need significant commitment
(staff, equipment, budget) for improvements to be realized
Pre-Screening ORI Post-Screening Detailed Analysis

Questions?
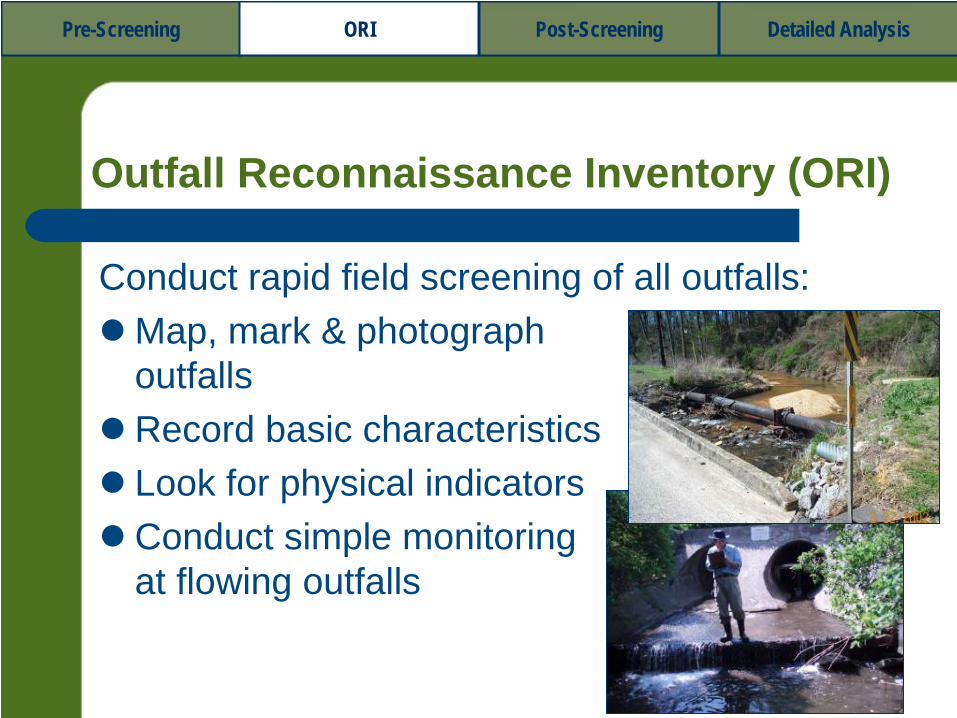
Outfall Reconnaissance Inventory (ORI)
Conduct rapid field screening of all outfalls:Map, mark & photographoutfallsRecord basic characteristicsLook for physical indicatorsConduct simple monitoringat flowing outfalls
Pre-Screening ORI Post-Screening Detailed Analysis
Check your webcast resourcesCheck your webcast resources
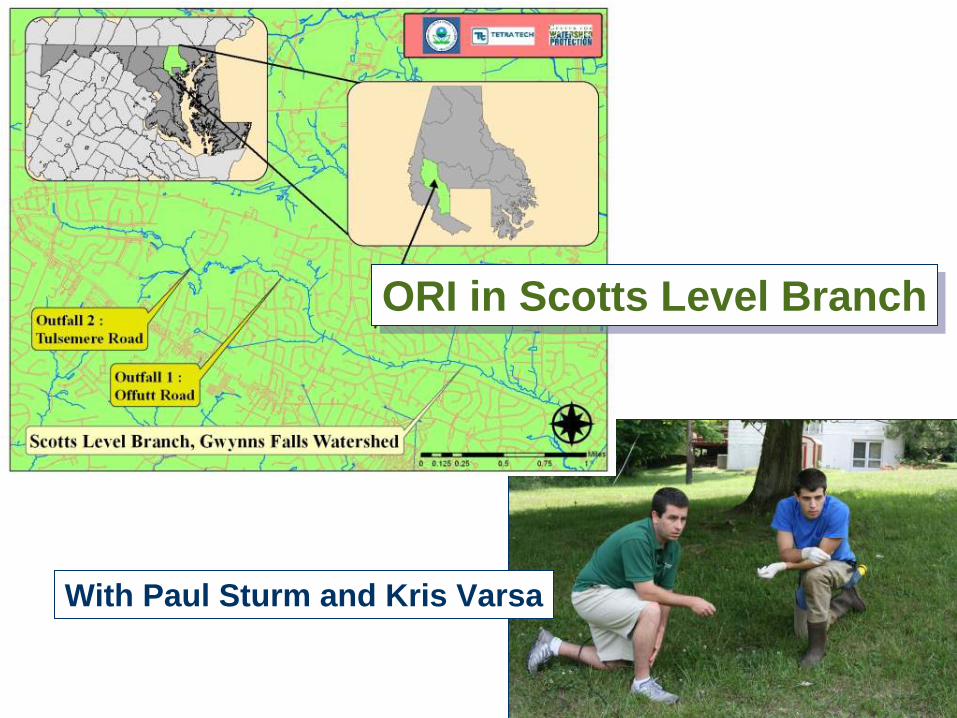
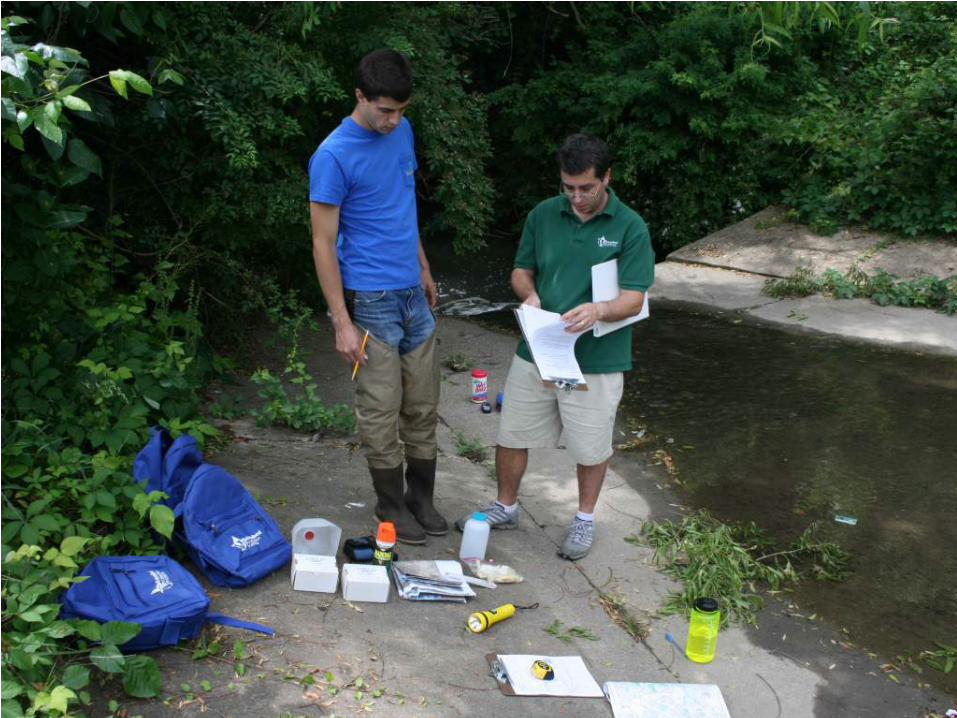
ORI in Scotts Level BranchORI in Scotts Level Branch
With Paul Sturm and Kris Varsa

Outfall Reconnaissance Inventory (ORI) The Basics
Safety considerationsTime of year considerationsSuppliesStaffing requirements
Pre-Screening ORI Post-Screening Detailed Analysis

SAFETY CONSIDERATIONS
VIDEO
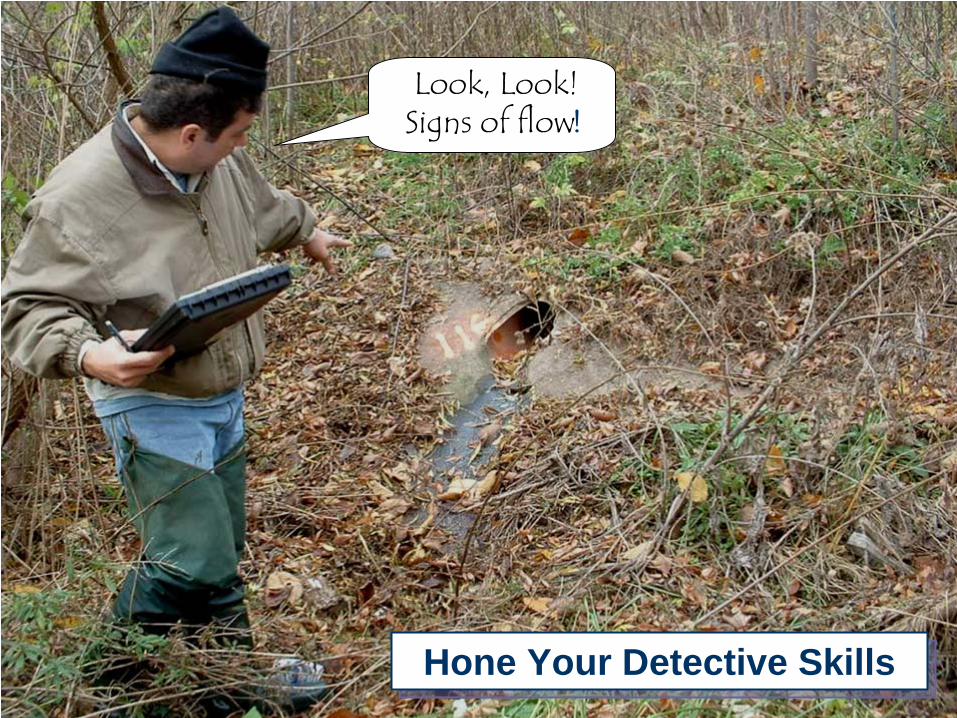
Look, Look! Signs of flow!
2002Hone Your Detective SkillsHone Your Detective Skills
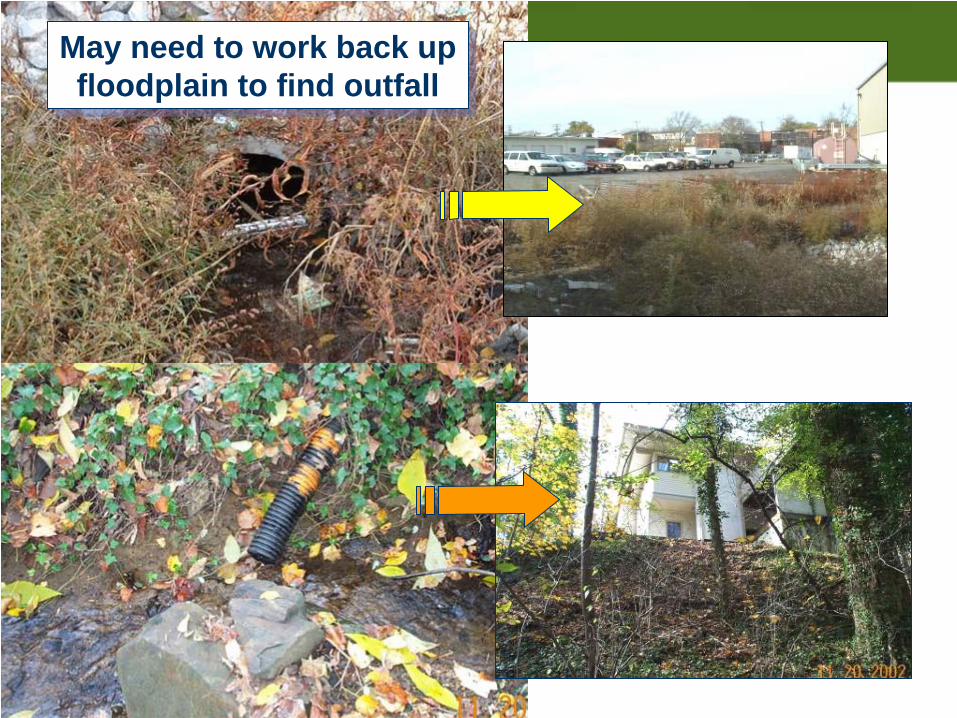
May need to work back up floodplain to find outfall
May need to work back up floodplain to find outfall

TIMING CONSIDERATIONS
VIDEO
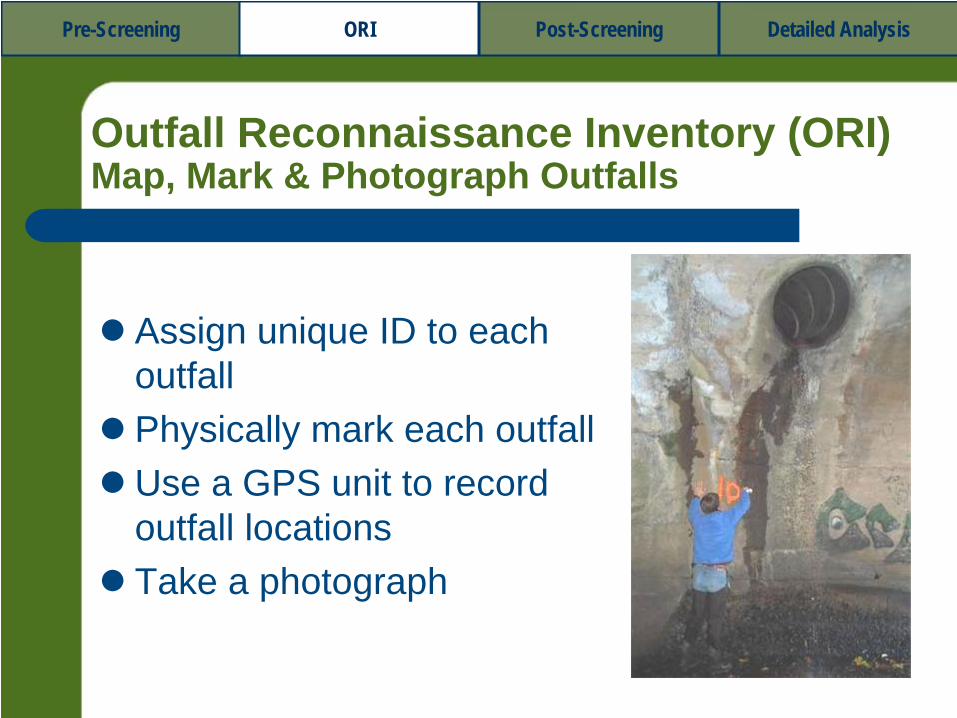
Outfall Reconnaissance Inventory (ORI) Map, Mark & Photograph Outfalls
Assign unique ID to each outfallPhysically mark each outfallUse a GPS unit to record outfall locationsTake a photograph
Pre-Screening ORI Post-Screening Detailed Analysis

Outfall Reconnaissance Inventory (ORI) Record Basic Characteristics
Dimensions, Material, & Presence of Flow
Pre-Screening ORI Post-Screening Detailed Analysis
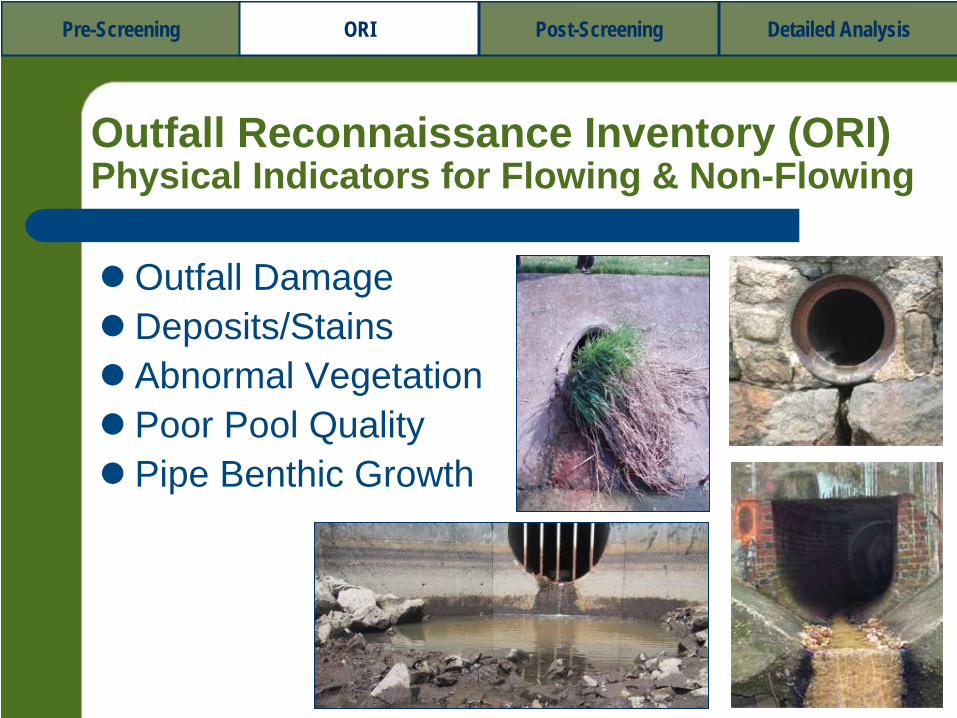
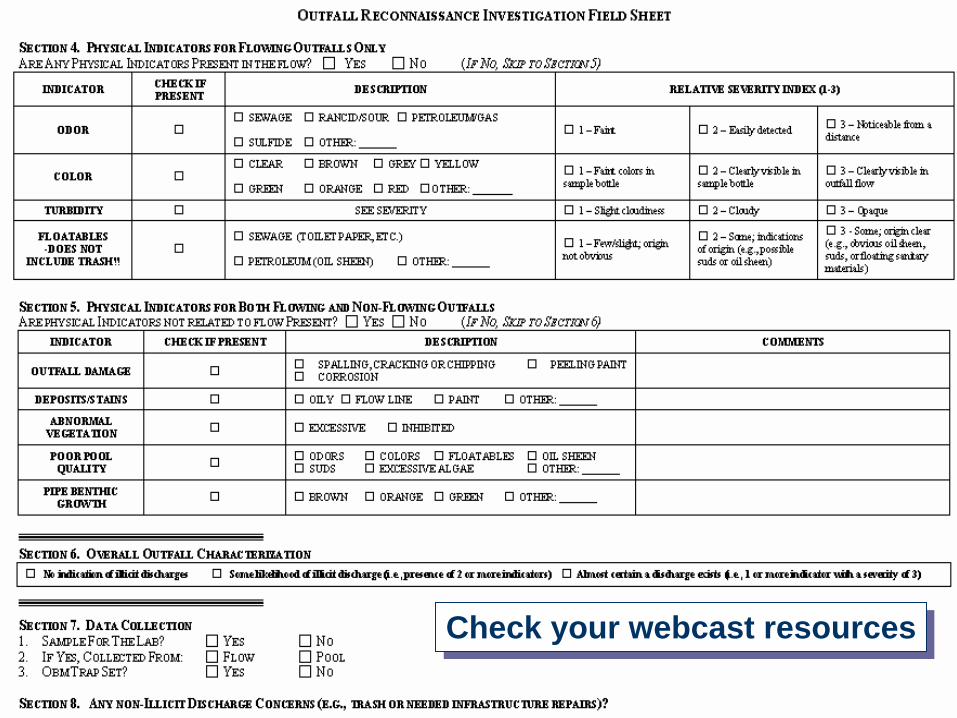
Outfall Reconnaissance Inventory (ORI) Physical Indicators for Flowing & Non-Flowing
Outfall DamageDeposits/StainsAbnormal VegetationPoor Pool QualityPipe Benthic Growth
Pre-Screening ORI Post-Screening Detailed Analysis

DRY OUTFALL VIDEO


Outfall Reconnaissance Inventory (ORI) Simple Monitoring at Flowing Outfalls
FlowpHTemperatureAmmonia
Pre-Screening ORI Post-Screening Detailed Analysis
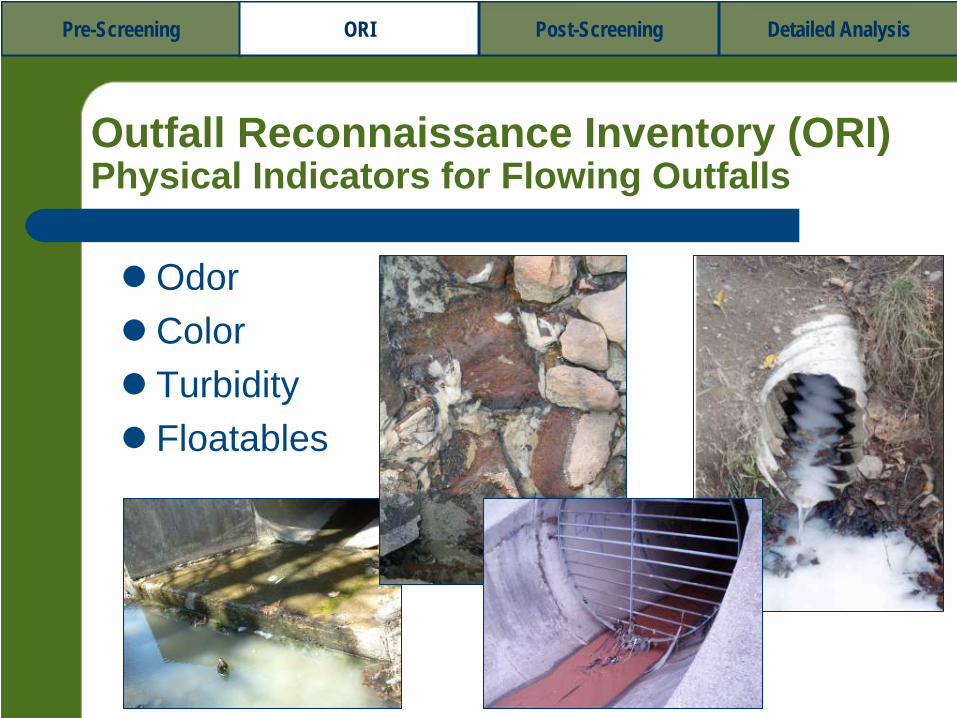
Outfall Reconnaissance Inventory (ORI) Physical Indicators for Flowing Outfalls
OdorColorTurbidityFloatables
Source: Fort Worth DEM
Pre-Screening ORI Post-Screening Detailed Analysis

FLOWING OUTFALL VIDEO

Outfall Reconnaissance Inventory (ORI) Overall Outfall Characterization
Outfall designation:– Unlikely illicit discharge– Potential illicit discharge– Suspect illicit discharge– Obvious illicit discharge
Data collectedNon-illicit discharge concerns
Pre-Screening ORI Post-Screening Detailed Analysis
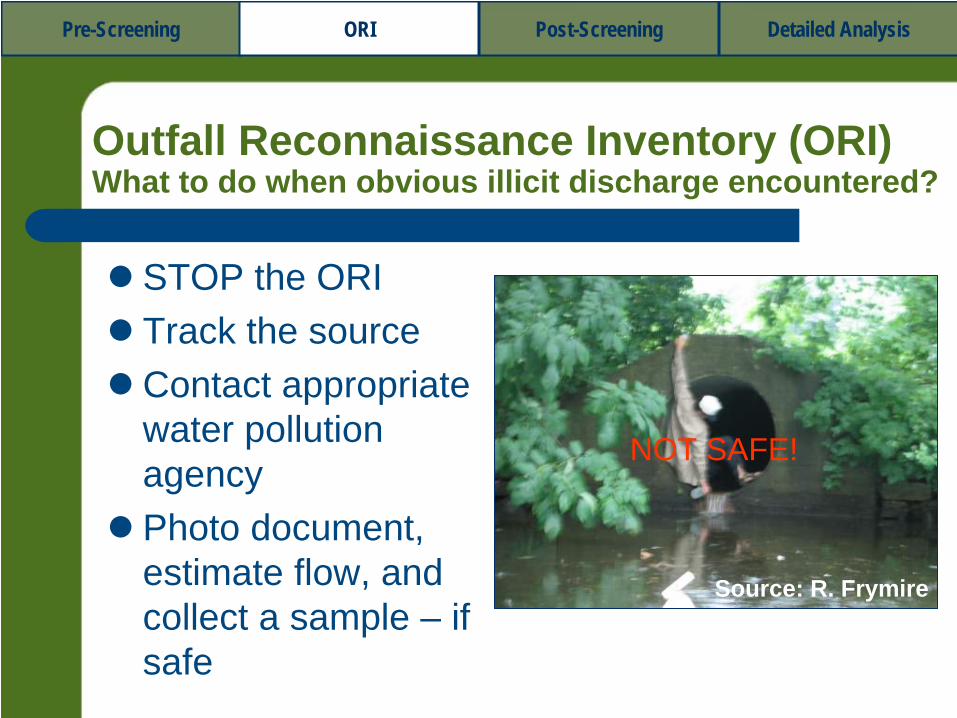
STOP the ORITrack the sourceContact appropriate water pollution agencyPhoto document, estimate flow, and collect a sample – if safe
Source: R. Frymire
NOT SAFE!
Outfall Reconnaissance Inventory (ORI) What to do when obvious illicit discharge encountered?
Pre-Screening ORI Post-Screening Detailed Analysis

Outfall Reconnaissance Inventory (ORI) Cost Considerations
Equipment (relatively minor)Crew size (2 to 3 people per crew)Stream miles (~ 2 to 3 miles per crew per day)Pre- and post-processing data management(~ 1 to 3 person-days for each day spent in field)
Pre-Screening ORI Post-Screening Detailed Analysis
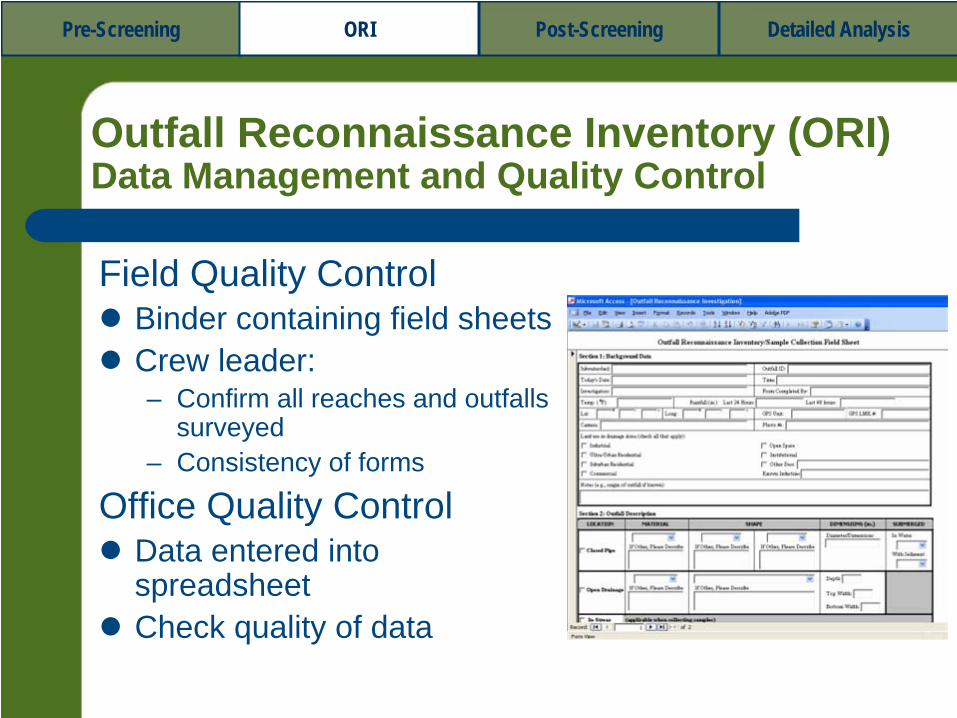
Outfall Reconnaissance Inventory (ORI) Data Management and Quality Control
Field Quality ControlBinder containing field sheetsCrew leader:– Confirm all reaches and outfalls
surveyed– Consistency of forms
Office Quality ControlData entered into spreadsheetCheck quality of data
Pre-Screening ORI Post-Screening Detailed Analysis
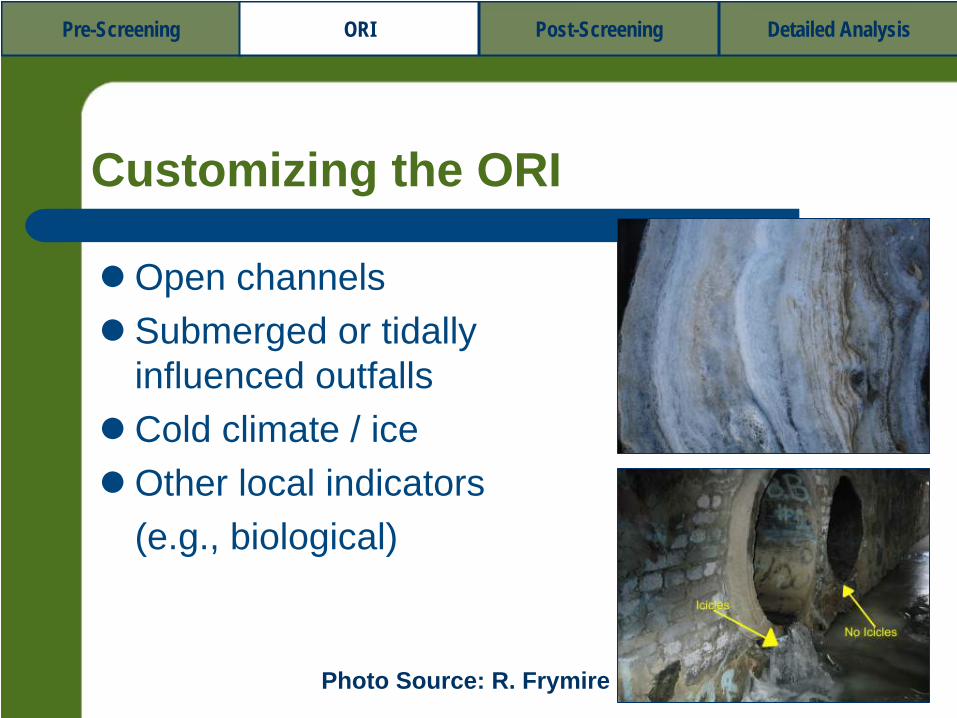
Customizing the ORI
Open channelsSubmerged or tidally influenced outfallsCold climate / iceOther local indicators(e.g., biological)
Photo Source: R. Frymire
Pre-Screening ORI Post-Screening Detailed Analysis
The ORI Cannot…
Find all discharges (can sometimes lead to a “false positive” as well)Detect intermittent flows that leave no traceQuantify impacts definitively (no direct measure of relative problem)Define sources (except for some obvious indicators)
Pre-Screening ORI Post-Screening Detailed Analysis

Questions?

Cuyahoga County Board of Health’s
Illicit Discharge Detection and Elimination Program
Harry Stark, RS, MPA
Cuyahoga County Board of Health

Map of Cuyahoga County
Lake Erie
Cuyahoga County
It is the most populous county in Ohio with a population of 1,393,978 The County is 1,246 square miles in size787 miles is water

CCBH General Health District
Serving over 830,000 residentsRepresent–
35 cities (except Cleveland, Shaker Hts., and Lakewood)
–
19 villages–
2 townships
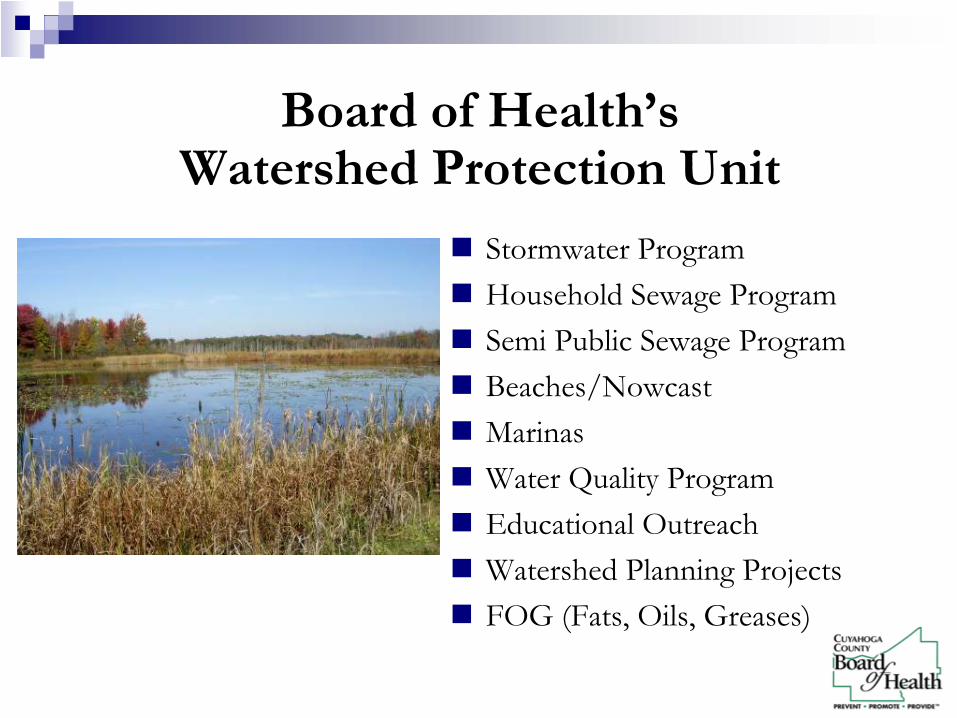
Board of Health’s Watershed Protection Unit
Stormwater ProgramHousehold Sewage ProgramSemi Public Sewage ProgramBeaches/NowcastMarinasWater Quality ProgramEducational OutreachWatershed Planning ProjectsFOG (Fats, Oils, Greases)

CCBH Involvement on Phase II
Household Sewage Treatment Systems (HSTS)Water Quality SamplingLimited Guidance from Ohio EPACommunities looking for assistancePrincipal Member of Northeast Ohio Storm Water Task Force Committee
Off-lot Discharging HSTS
Approved in the State of Ohio–
Outdated rules / no legislation
–
No general NPDES permit for household septic systems from the Ohio EPA
One of only a handful of states that approves these systems without a permitting mechanism in placeAre now illicit sources of discharges under Phase II Stormwater
CCBH Regional Stormwater Program
MS4 Outfall InventoryDry Weather Inspections/SamplingSource TrackingEducational Outreach/InvolvementGood HousekeepingCurrently have 53 contracts with communities to perform activitiesCurrently performing activities in 4 Counties
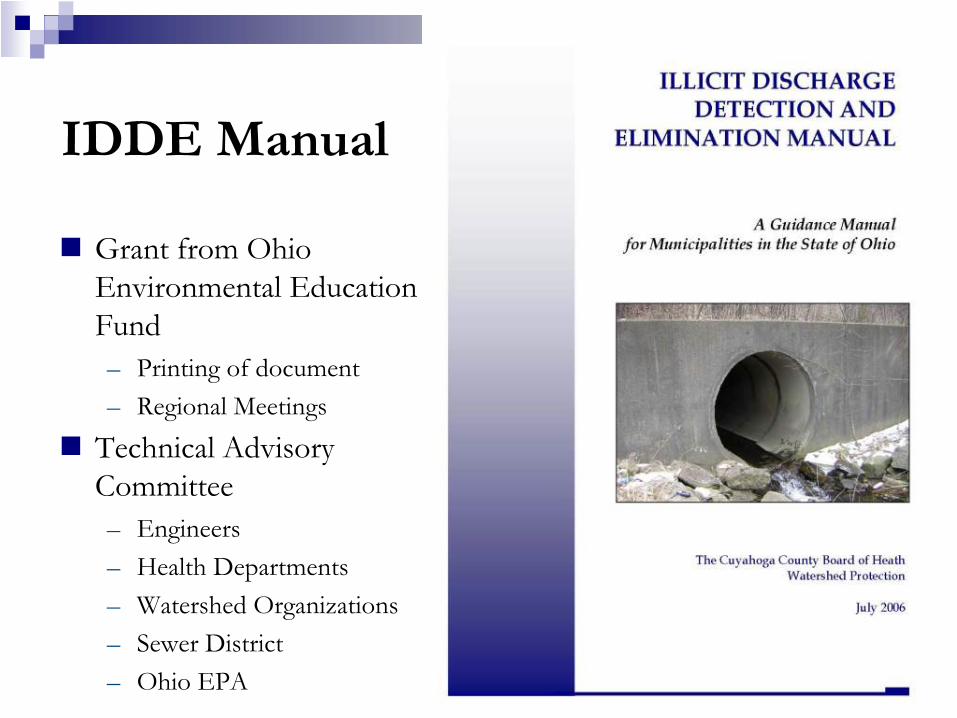
Grant from Ohio Environmental Education Fund–
Printing of document–
Regional Meetings
Technical Advisory Committee –
Engineers–
Health Departments–
Watershed Organizations–
Sewer District–
Ohio EPA
IDDE Manual
CCBH Program Outfall Inventory / Mapping
45 communities completed to dateOver 4,000 MS4 outfalls have been identifiedUtilize the procedures identified in the IDDE Guidance Manual for Ohio for identifying the MS4 outfalls
Outfall Inventory / Mapping
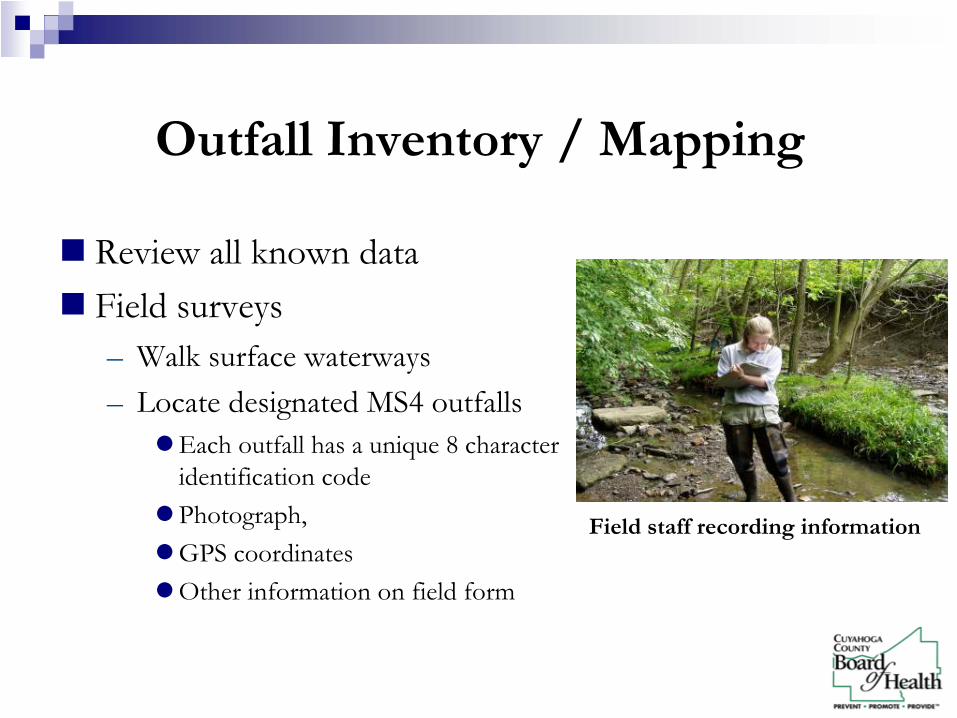
Review all known data Field surveys–
Walk surface waterways
–
Locate designated MS4 outfallsEach outfall has a unique 8 character identification codePhotograph, GPS coordinatesOther information on field form
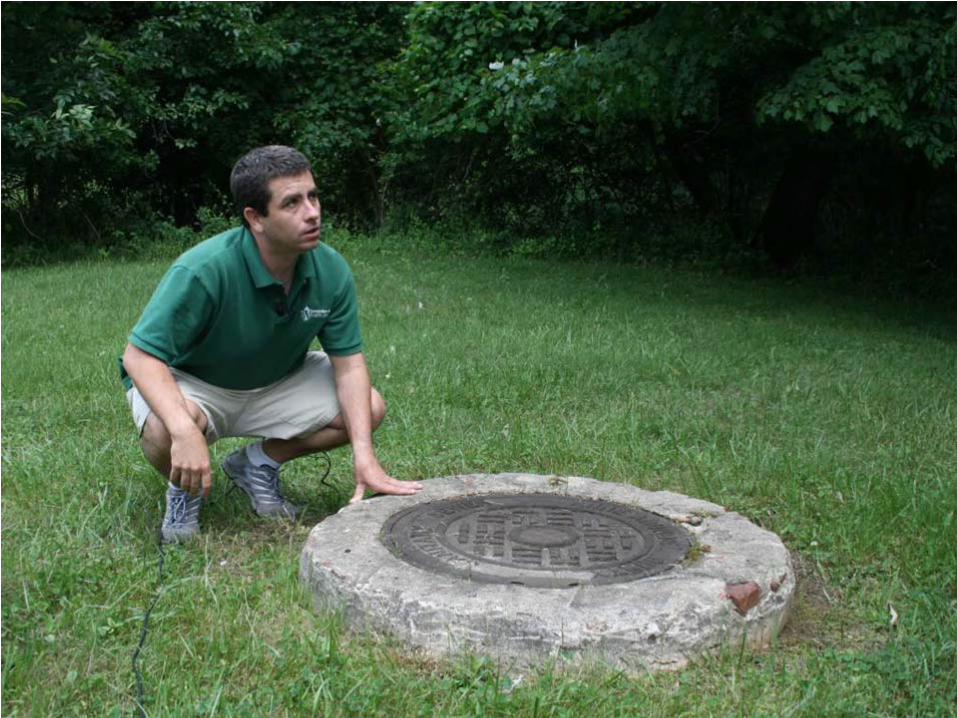
Field staff recording information
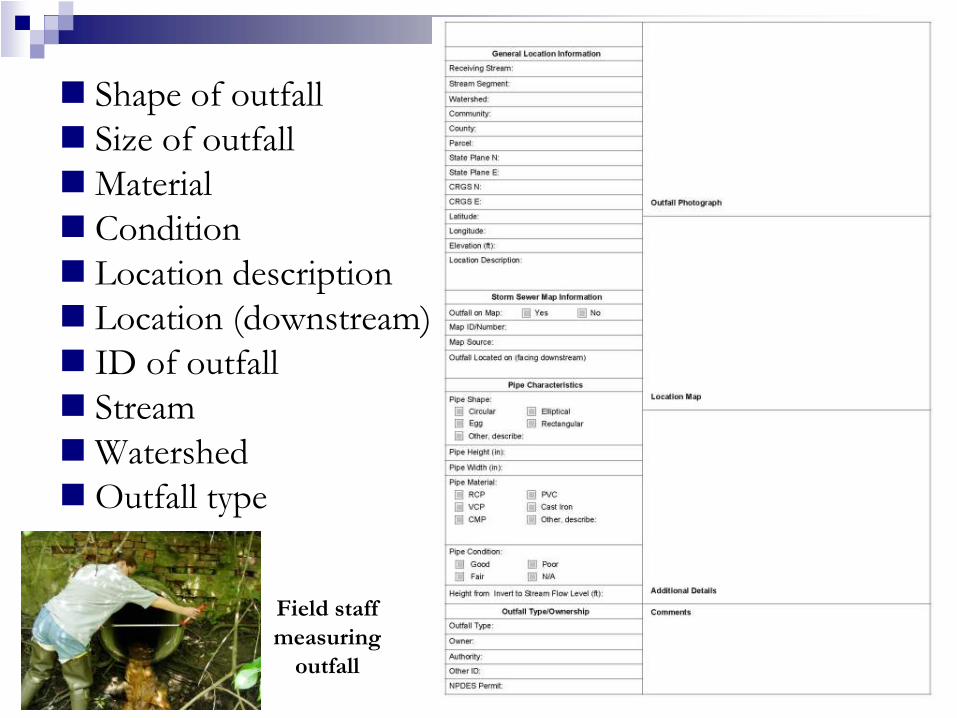
Shape of outfallSize of outfallMaterialConditionLocation descriptionLocation (downstream)ID of outfallStreamWatershedOutfall type
Field staff measuring
outfall
Inventory field form
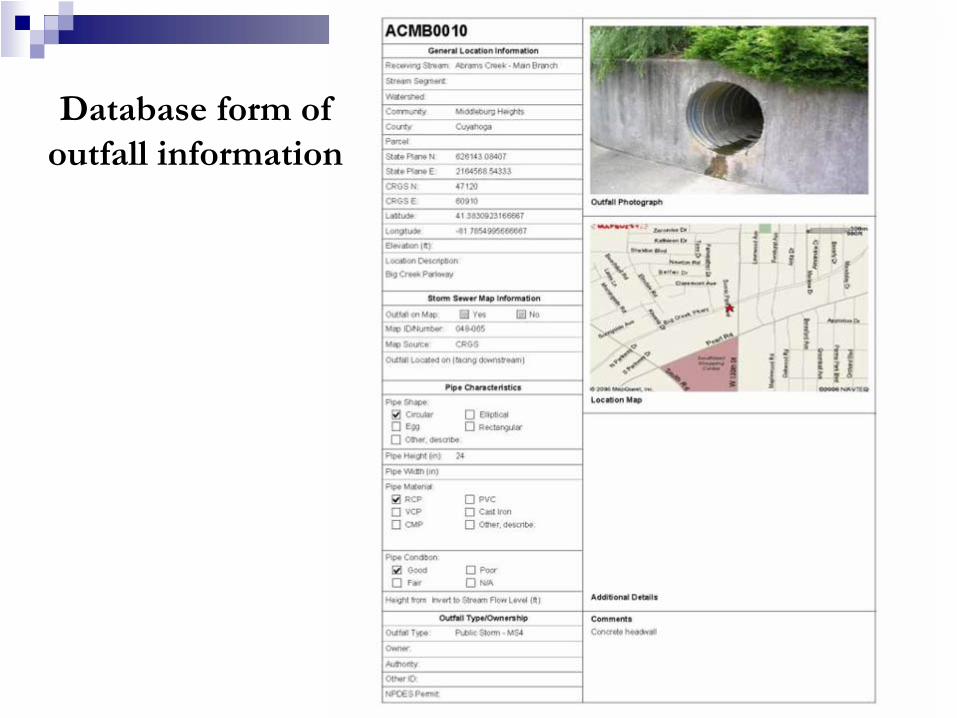
Database form of outfall information
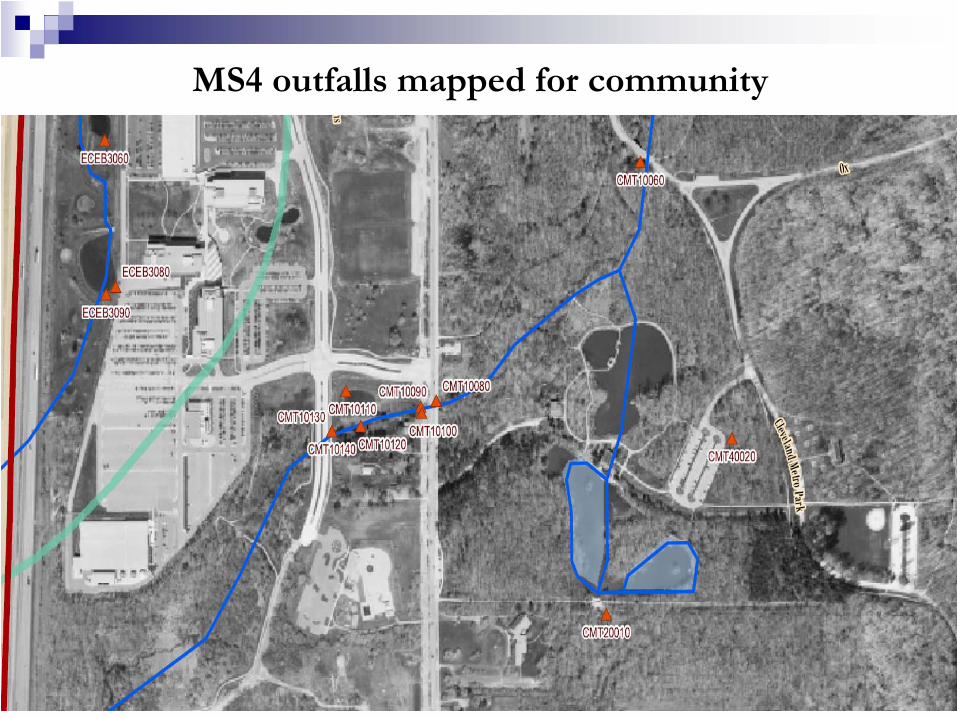
MS4 outfalls mapped for community
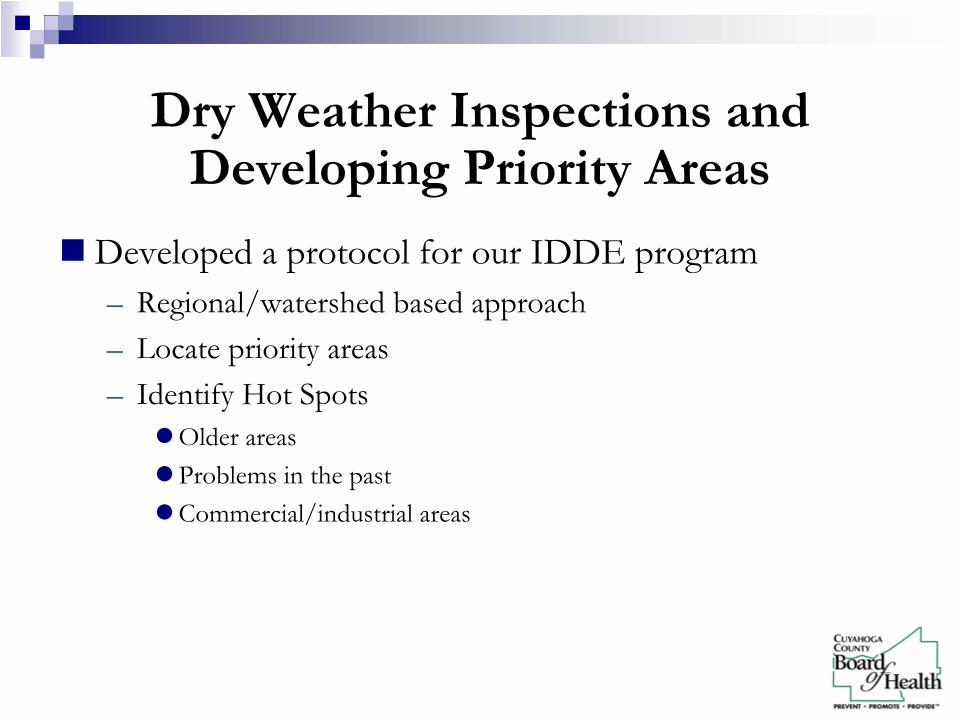
Developed a protocol for our IDDE program–
Regional/watershed based approach
–
Locate priority areas–
Identify Hot Spots
Older areasProblems in the pastCommercial/industrial areas
Dry Weather Inspections and Developing Priority Areas

Inspections of outfalls
Visual inspections of outfalls once inventoriedDry weather - 72 hours no rainfall (0.1”)Notify public during field componentLook for obvious signs of pollution, flow of water
Visual inspection of MS4 outfall
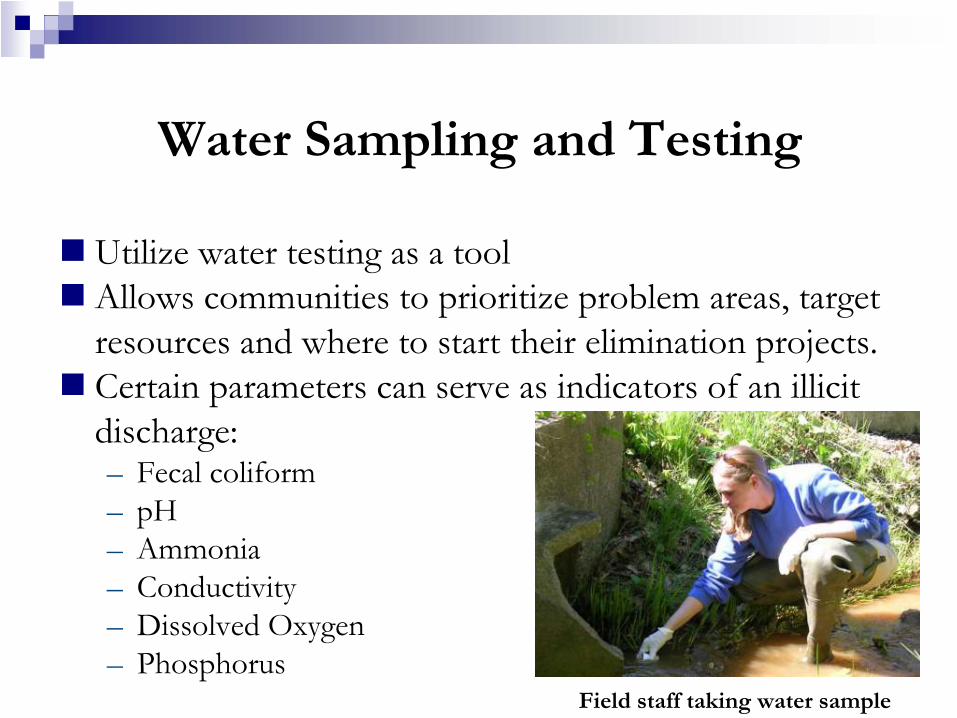
Water Sampling and Testing
Utilize water testing as a toolAllows communities to prioritize problem areas, target resources and where to start their elimination projects.Certain parameters can serve as indicators of an illicit discharge:–
Fecal coliform
–
pH–
Ammonia
–
Conductivity–
Dissolved Oxygen
–
PhosphorusField staff taking water sample
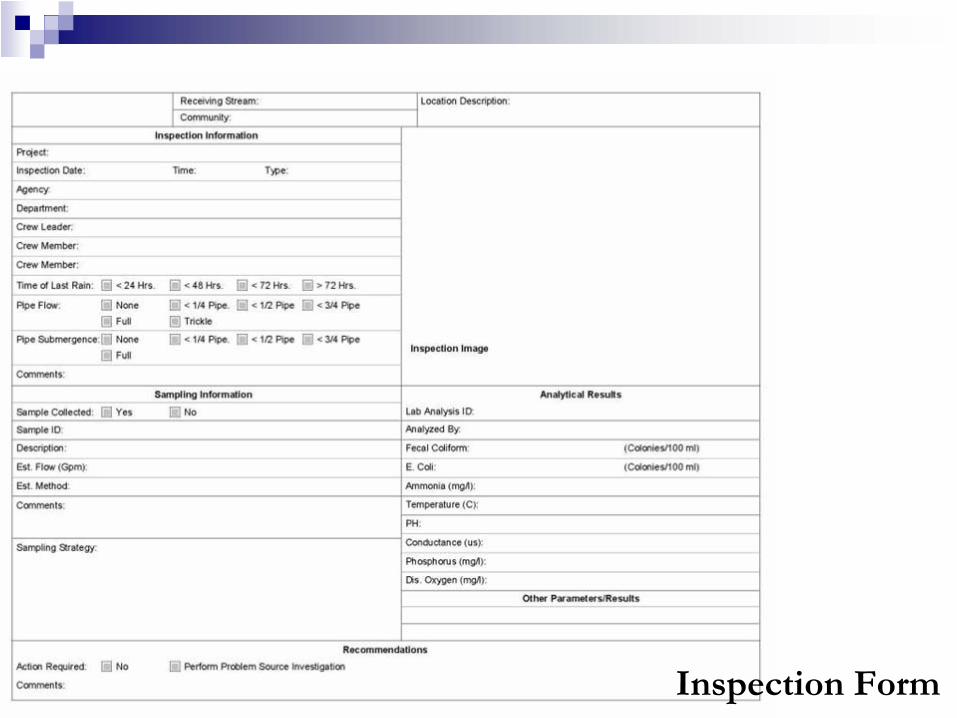
Inspection Form
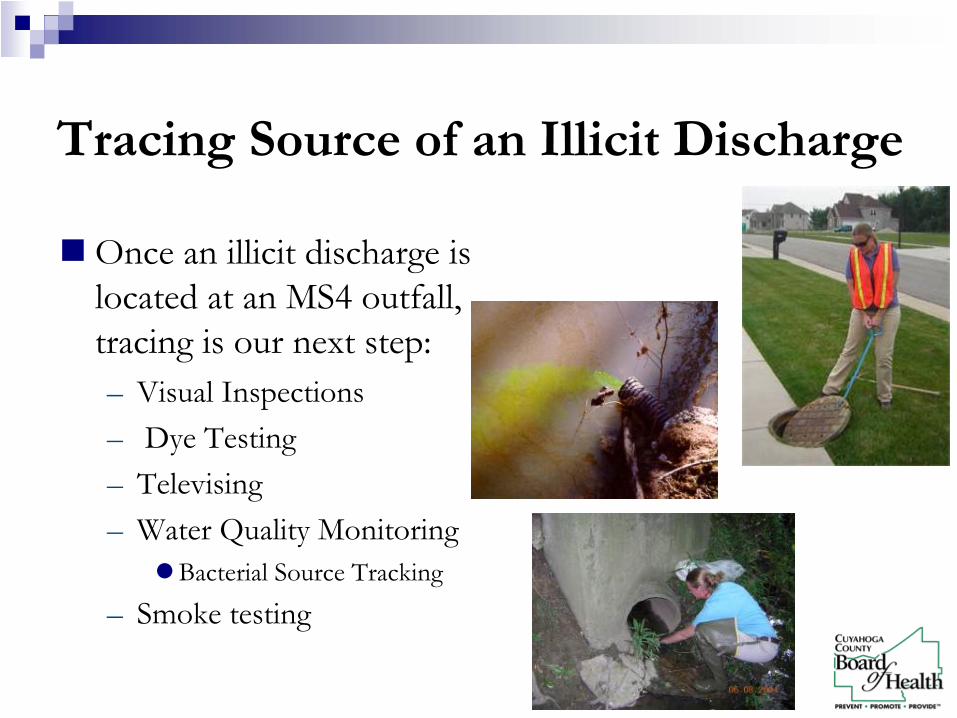
Tracing Source of an Illicit Discharge
Once an illicit discharge is located at an MS4 outfall, tracing is our next step:–
Visual Inspections
–
Dye Testing–
Televising
–
Water Quality MonitoringBacterial Source Tracking
–
Smoke testing

CCBH Field Investigations
Look for obvious signs during dry weather work. Looking for the obvious violations first, then can work in the future on intermittent flows. Use on a regional basis (watershed/subwatershed basis) – look for areas with worse bacterial contamination to focus resources on those areas first.Utilize fecal coliform levels of 5,000 colonies per 100ml.
CCBH Field Investigations
To date 2,240 water samples have been taken.–
56% of MS4 outfalls have had dry weather flows identified
572 possible illicit discharge locations have been identified through water quality sampling–
14% of MS4 outfalls have possible illicit discharges
Cuyahoga County has a lot of older development–
Majority of problems to date, over 90%, has been associated with older infrastructure communities (inner ring suburbs)
–
Majority of problems to date, has been a mixture of both residential (approximately 75%) and commercial locations (approximately 25%).

CCBH Source Tracking
We utilize visual up pipe observations–
We then utilize maps of the storm sewer system and determine where additional sampling is required and sample those areas,
–
This then pinpoints the areas with high bacterial counts, ammonia, etcOnce locations have been identified, the information is given to communities who then deal with the elimination portion (we do assist)Have source tracked and identified over 50 illicit discharge locations to date –of which over half have been eliminatedLessons learned
–
time consuming, –
not easy to identify locations where to sample in all cases depending upon the information available for that community or the field conditions
and access to locations
–
Cooperation with communities

Educational Outreach/Involvement
School-age children programPublic Officials programGeneral public programVolunteer monitoring

Good Housekeeping
Good Housekeeping programs for communitiesUtilize Lake County Stormwater Utility Program–
Includes program toolboxes for specific topics
Erosion and sediment controlIllicit DischargeConstruction site spill responseParking lot / street sweeping

CCBH Regional Stormwater Program
Stress Regional Approach55 Phase II designated communities within Cuyahoga County, all separate MS4 permitsOhio strong home rule stateWorking with communities across community boundaries and county boundaries
CCBH Regional Stormwater Program
Allows for better use of our resources–
Utilize our IDDE program on a regional basis –
creates
commonality on all aspects of programs.–
Equipment / Man power
–
Dry weather and Sampling processesAllows for better use of time when performing these activities by continued work on one waterway that traverses multiple communities rather than performing work community by communityWatershed Based Approach / Regional Approach: Looking at water quality problems and issues across boundaries.
CCBH Regional Stormwater Program
Creates dialogue (positive) between communities–
Common model ordinances
–
Common Problems / Common Solutions–
Develop common IDDE program

Questions?

Post-Screening Prioritization
ORI, combined with other existing data, can help determine:Extent of the problemIf problems are “clustered”Indicators of intermittent dischargesRelative ranking of problem outfalls
Pre-Screening ORI Post-Screening Detailed Analysis
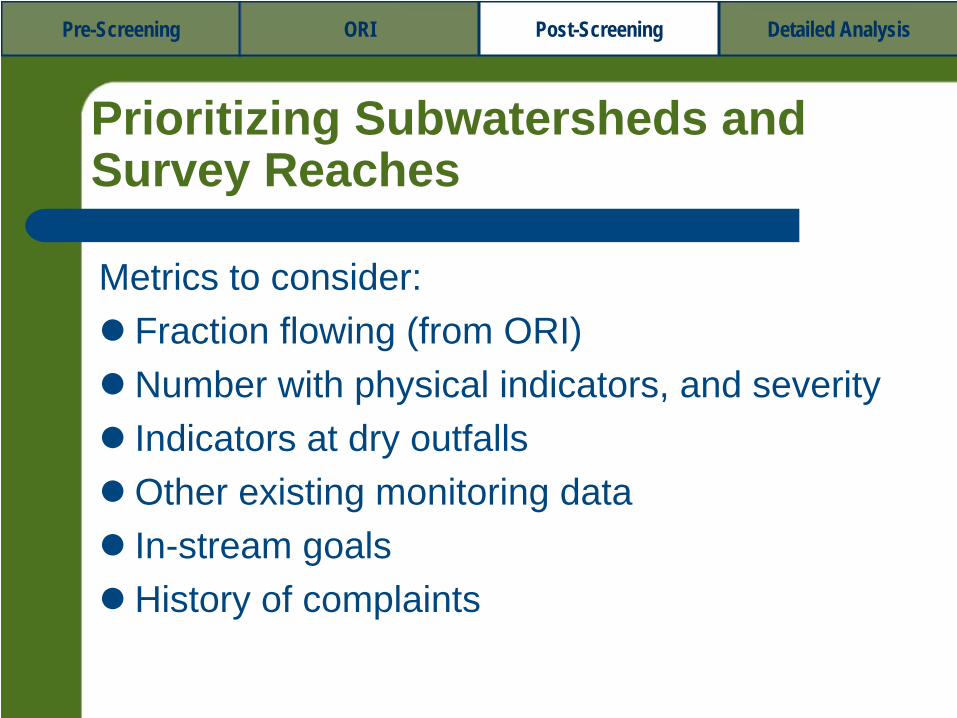
Prioritizing Subwatersheds and Survey Reaches
Metrics to consider:Fraction flowing (from ORI)Number with physical indicators, and severityIndicators at dry outfallsOther existing monitoring dataIn-stream goalsHistory of complaints
Pre-Screening ORI Post-Screening Detailed Analysis
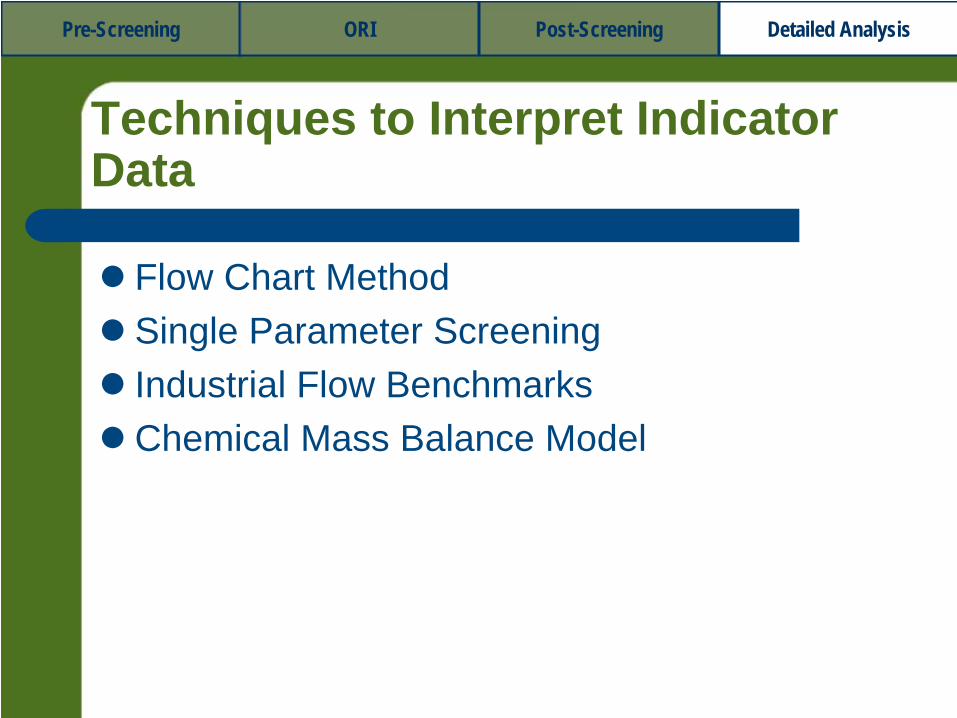
Techniques to Interpret Indicator Data
Flow Chart MethodSingle Parameter ScreeningIndustrial Flow BenchmarksChemical Mass Balance Model
Pre-Screening ORI Post-Screening Detailed Analysis
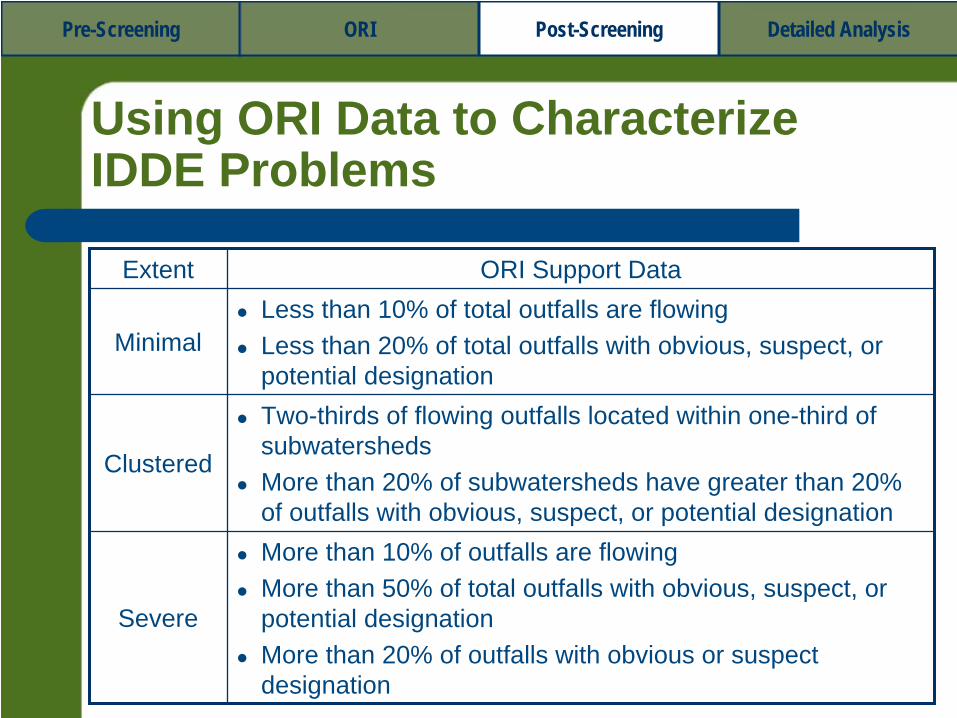
Using ORI Data to Characterize IDDE Problems
Extent ORI Support Data
MinimalLess than 10% of total outfalls are flowingLess than 20% of total outfalls with obvious, suspect, or potential designation
Clustered
Two-thirds of flowing outfalls located within one-third of subwatershedsMore than 20% of subwatersheds have greater than 20% of outfalls with obvious, suspect, or potential designation
Severe
More than 10% of outfalls are flowingMore than 50% of total outfalls with obvious, suspect, or potential designationMore than 20% of outfalls with obvious or suspect designation
Pre-Screening ORI Post-Screening Detailed Analysis

Detailed Sampling and Analysis
Use Indicator Monitoring to:Identify problem outfalls not apparent from physical indicators aloneTest suspect or problem outfalls to confirm if illicit dischargeDetermine flow typeAnalyze intermittent discharges
Pre-Screening ORI Post-Screening Detailed Analysis

Key Features for Ideal Indicators
Distinguishes a particular source“Tight” statistical distributionPrecise measurement SafeRelatively inexpensiveSimple to conduct
Pre-Screening ORI Post-Screening Detailed Analysis

Key Lab Considerations
Equipment costStaff trainingNumber of samplesSafetyDisposal
Photo Source: Robert Pitt
Pre-Screening ORI Post-Screening Detailed Analysis
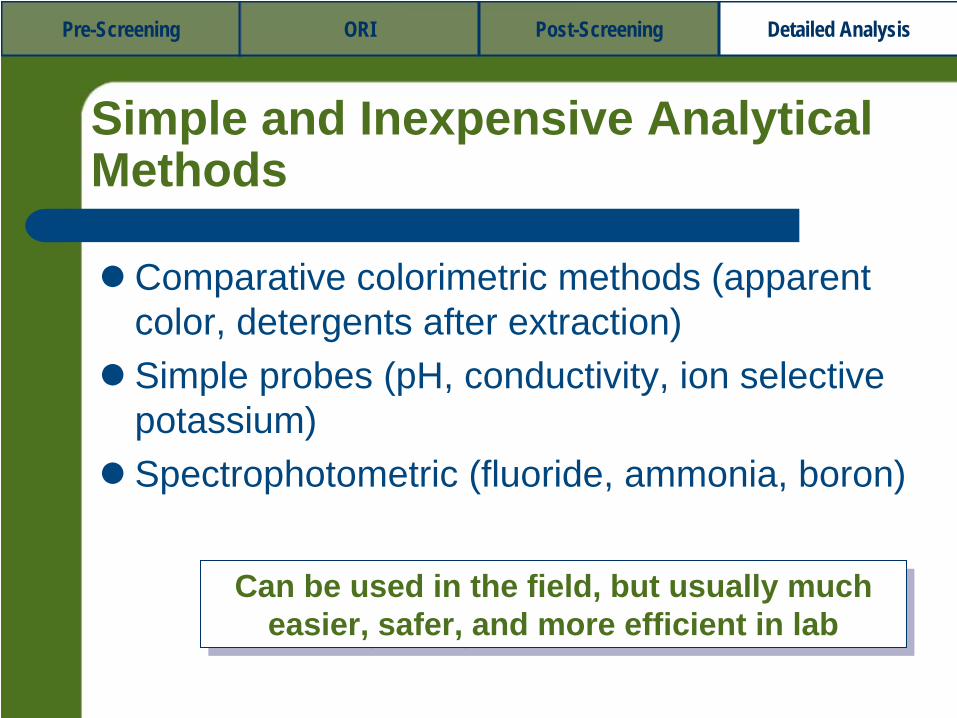
Simple and Inexpensive Analytical Methods
Comparative colorimetric methods (apparent color, detergents after extraction)Simple probes (pH, conductivity, ion selective potassium)Spectrophotometric (fluoride, ammonia, boron)
Can be used in the field, but usually much easier, safer, and more efficient in lab
Can be used in the field, but usually much easier, safer, and more efficient in lab
Pre-Screening ORI Post-Screening Detailed Analysis
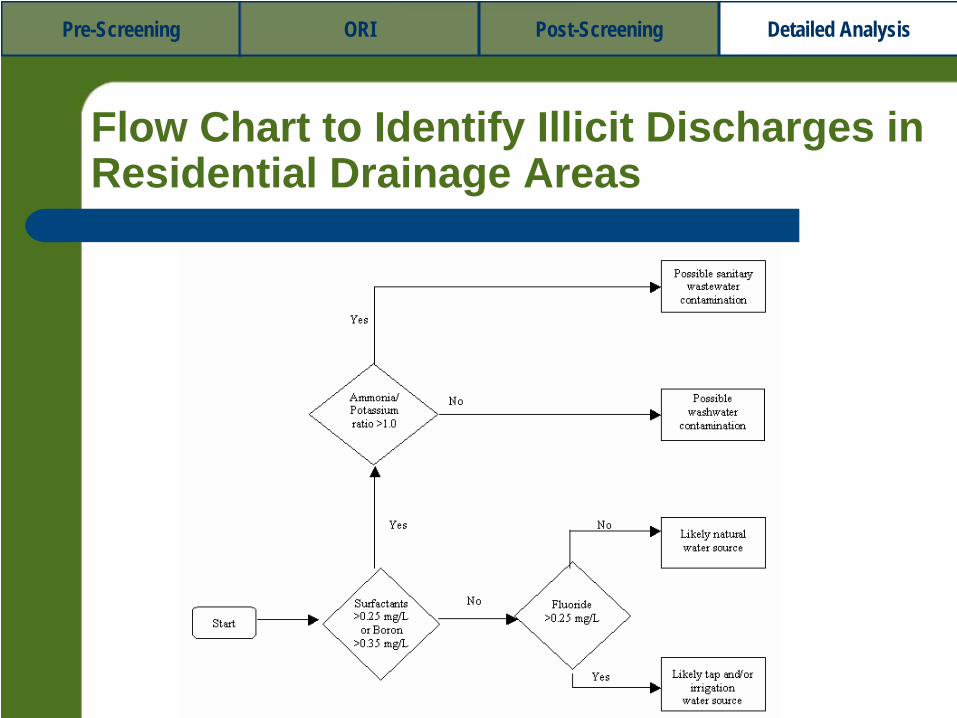
Flow Chart to Identify Illicit Discharges in Residential Drainage Areas
Pre-Screening ORI Post-Screening Detailed Analysis
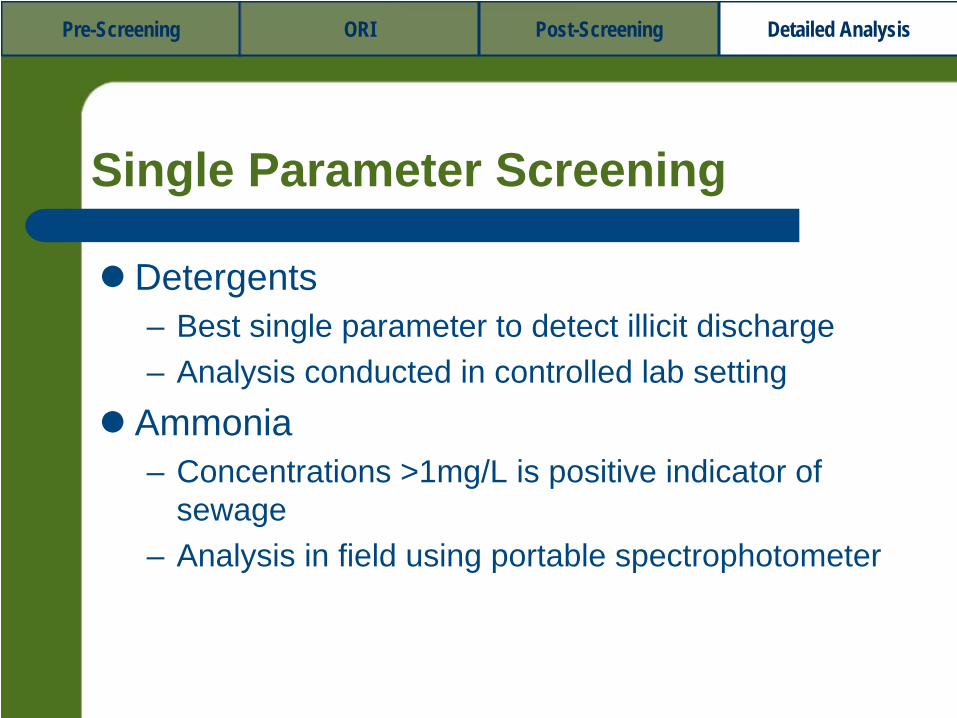
Single Parameter Screening
Detergents– Best single parameter to detect illicit discharge– Analysis conducted in controlled lab setting
Ammonia– Concentrations >1mg/L is positive indicator of
sewage– Analysis in field using portable spectrophotometer
Pre-Screening ORI Post-Screening Detailed Analysis

Benchmark Concentrations to Identify Industrial Discharges
Benchmark Concentration Notes
Ammonia(mg/L)
> 50Existing “Flow Chart” ParameterConcentrations higher than the benchmark can identify a few industrial discharges
Potassium(mg/L)
> 20Existing “Flow Chart” ParameterExcellent indicator of a broad range of industrial discharges
Color(Units)
> 500 Supplemental parameter that identifies a few specific industrial discharges
Conductivity(µS/cm)
> 2,000 Identifies a few industrial dischargesMay be useful to distinguish between industrial sources
Hardness(mg/L as CaCO3 )
< 10> 2,000
Identifies a few industrial dischargesMay be useful to distinguish between industrial sources
pH(Units)
< 5
Only captures a few industrial dischargesHigh pH values may also indicate an industrial discharge but residential wash waters can have a high pH as well
Turbidity(NTU)
> 1,000 Supplemental parameter that identifies a few specific industrial discharges
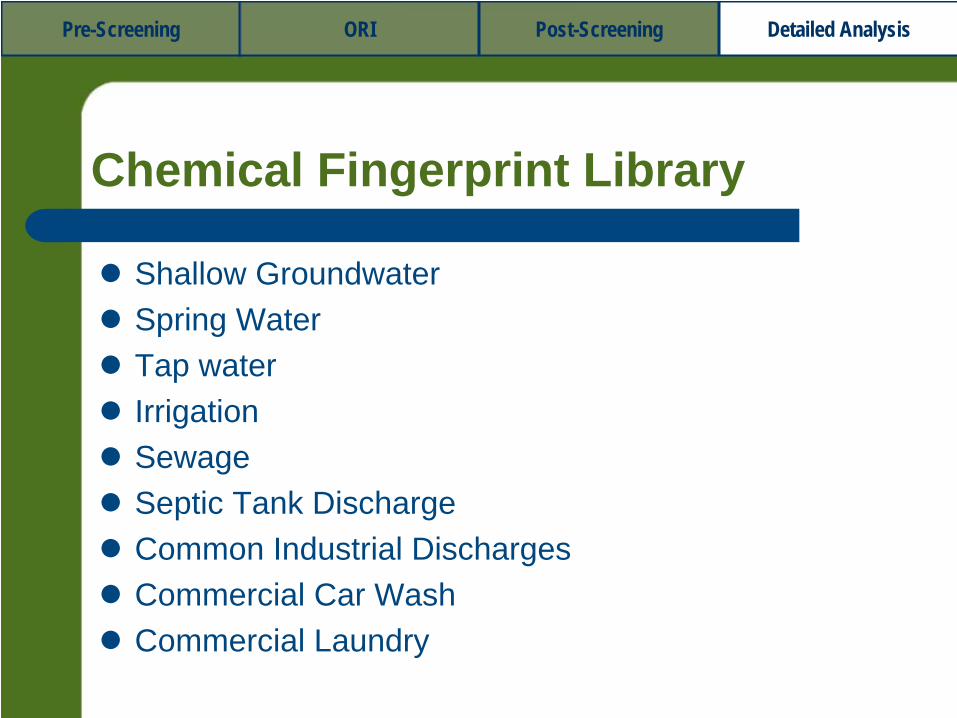
Chemical Fingerprint Library
Shallow GroundwaterSpring WaterTap waterIrrigationSewageSeptic Tank DischargeCommon Industrial DischargesCommercial Car WashCommercial Laundry
Pre-Screening ORI Post-Screening Detailed Analysis

Fingerprints of Major Sources
SewageE. ColiDetergents (various)High Ammonia/ Potassium Ratio
Wash WaterDetergents (various)
Shallow GroundwaterHardness, pH
Tap WaterFluorideSometimes Hardness
SeptageE. ColiFluorescenceHigh Ammonia/Potassium
Pre-Screening ORI Post-Screening Detailed Analysis

Special Indicators for Intermittent Discharges
Optical brightener monitoringToxicity testingOutfall dammingTake a sample from the pool
Pre-Screening ORI Post-Screening Detailed Analysis
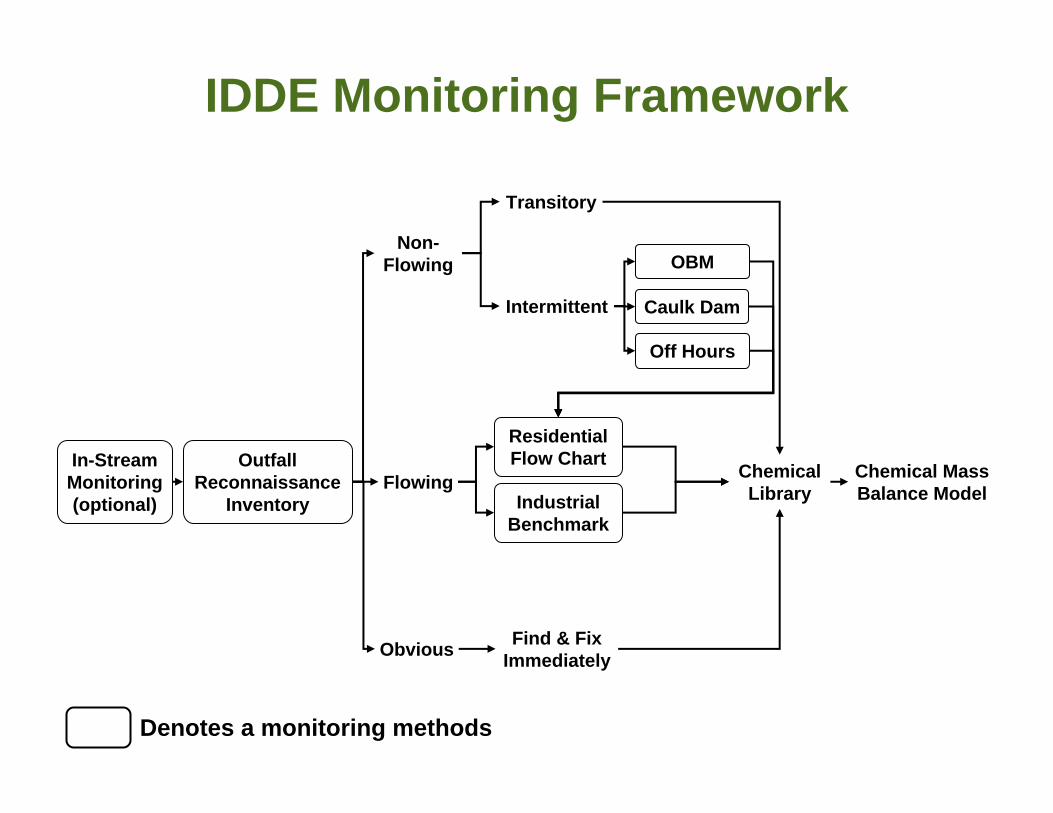
IDDE Monitoring Framework
In-Stream Monitoring (optional)
Outfall Reconnaissance
Inventory
OBM
Caulk Dam
Off Hours
Residential Flow Chart
Industrial Benchmark
Obvious Find & Fix Immediately
Flowing
Non-Flowing
Intermittent
Transitory
Chemical Library
Chemical Mass Balance Model
Denotes a monitoring methods
Questions?