Embed Size (px)
Citation preview

Higher ValueSteaming Toward
Ka
wa
sa
Ki K
ise
n K
ais
ha
, LTD
. an
nu
aL R
ep
oR
T 2011
Iino Building1-1,
Uchisaiwaicho 2-chome,
Chiyoda-ku, Tokyo 100-0011, Japan
Phone: (+81) 3-3595-5063 (IR & PR Group)
Fax : (+81) 3-3595-5001
URL : http://www.kline.co.jp
Printed in Japan
Annual Report 2011 for the year ended March 31, 2011

Profile
Pursuing new challengeswith flexibility and strength
Contents“K” Line Spirit 2
“K” Line Presence 4
“K” Line Commitment 6
Financial Highlights 10
Message to Our Stakeholders 12
An Interview with the President 13
Review of the Medium-Term Management Plan
20
Business Review and Outlook 24-34
Containership Business 24
Dry Bulk Business 26
Car Carrier Business 28
Energy Transportation and Tanker Business
30
Offshore Support Vessel Business
32
Heavy Lifter Business 32
Short Sea and Coastal Business 33
Logistics Business 34
Position in the Worldwide Markets 35
Special Feature 1:Expansion of the Heavy Lifter Business
36
Special Feature 2:Moving Ahead in the Offshore Energy E&P (Exploration and Production) Support Business
38
CSR Activities 40
Corporate Governance and Risk Management
42
Directors, Auditors and Executive Officers
44
Organization 45
Major Subsidiaries and Affiliates 46
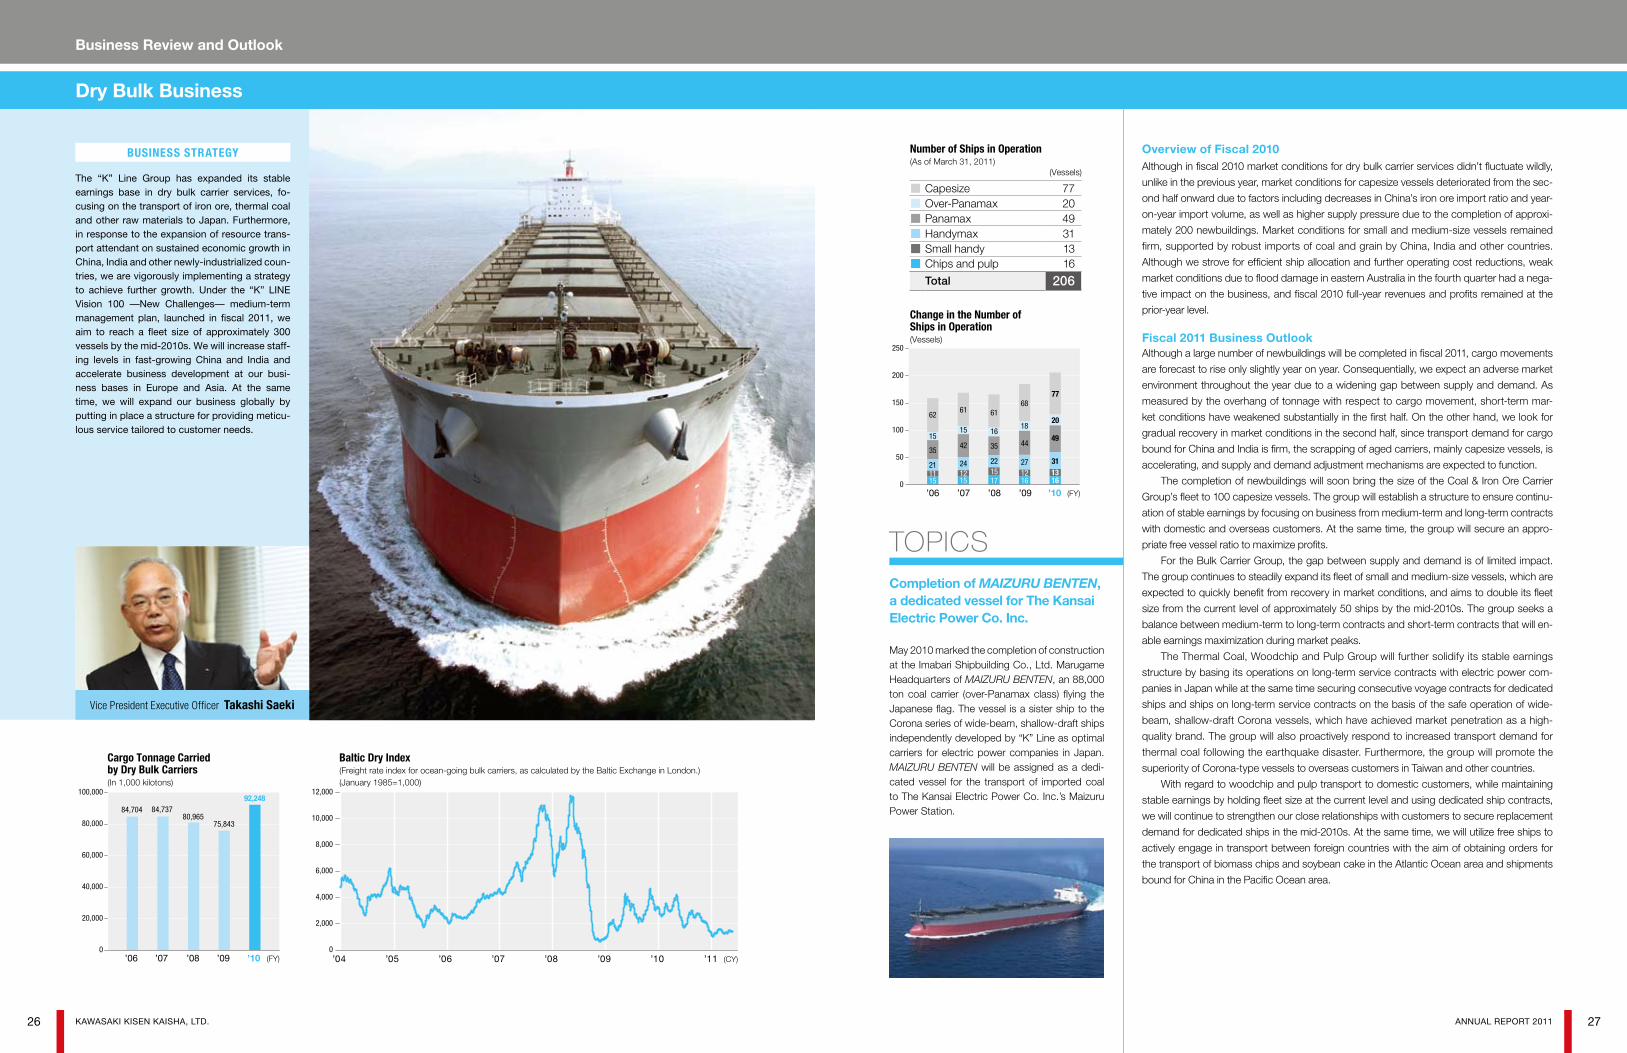
Global Service Network 48
Fleet and Container Terminals 50
Corporate History 51
Financial Section 52
Outline of the Company / Stock Information
85
“K” Line is an integrated world-class shipping company that owns and
operates a diverse fleet of ships adapted to society’s marine transport
needs. As of March 31, 2011, the “K” Line Group included 26 domestic
and 290 overseas consolidated subsidiaries. Approximately 7,900
employees work at sea and on land representing the “K” Line brand
with the aim of making “K” Line an excellent global carrier.
In fiscal 2010 “K” Line achieved a return to profitability and dividends.
Considering the change in the business environment and in preparation
for our centennial anniversary in 2019, we launched a medium-term
management plan covering the three-year period beginning in fiscal
2011 under the theme “New Challenges.”
Cautionary StatementWe would like to advise you that some forward-looking plans, prospects, and strategies, etc. written in this Report that are not historical facts have the possibility of including risk and uncertainties caused by future changes of surrounding circumstances. We would appreciate your understanding that actual results may differ from plans, prospects and strategies, etc.
1AnnuAl RepoRt 2011

“K” Line Spirit
Corporate Principles
“K” Line Pioneering Initiatives
The basic principles of “K” Line Group as a shipping business organization centering on shipping lie in: (a) Diligent efforts for safety in navigation and cargo operations as well as for environmental preservation; (b) Sincere response to customer needs by making every possible effort; and (c) Contributing to the world’s economic growth and stability through continual upgrading of service quality.
Vision
1. To be trusted and supported by customers as a globally developing group,
2. To build a business base that will be capable of responding to any and all changes in business circumstances, and to continually pursue and practice innovation for survival in the global market,
3. To create and provide a workplace where each and every employee can have hopes and aspirations for the future, and can express creativity and display a challenging spirit.
The history of “K” Line has by no means been smooth and
uneventful. During the course of more than 90 years of business
operation, the company has weathered numerous upheavals in the
business environment. The impetus for our resilience in the face of
adversity is the “K” Line Spirit, a source of strength fostered since
the founding of the company, which we express using the terms,
“independence,” “freedom and vigor,” and “progressive attitude.”
The “K” Line Spirit is a long-running corporate tradition that each
employee carries on to this day.
Throughout the years, we have devised and resolutely implemented
a series of bold strategies grounded in “K” Line’s unique spirit. So
long as we draw on the “K” Line Spirit, we will achieve even greater
success by further developing our services and providing value that
meets the expectations of customers around the world.
“K” Line SpiritIn the marine transport industry, which grows in step with the global economy, “K” Line has always sought to pursue unique strategies with a boldness of spirit. The history of “K” Line is a history of pioneering and creation.
We will remain sensitive to current trends and blaze a path to the future through vigorous, flexible business activities.
Completion of Japan’s first PCC (Pure Car Carrier) TOYOTA MARU NO. 10.
Completion of first Japanese flag LNG carrier BISHU MARU. Managed by “K” Line.
Completion of the CORONA ACE a wide-beam, shallow-draft coal carrier capable of efficient cargo handling, which became the basic model for thermal coal transport carriers
The first Japanese shipping company to begin operation of an exclusive Double-stack Train (DST) in North America.
1970
1983
1986
1994
Large, high-quality offshore support vessels have gone into full-scale operation at floating production and drilling facilities off the coast of Brazil and in the North Sea.
Heavy lifters with the world’s highest lifting capacity will demonstrate their worth in the transport of large cargo and offshore development facilities that previously could not be transported.
p. 38
Offshore support vessels
p. 36
Heavy lifter vessels
“K” Line Spirit
Independence
Freedom and vigor
Progressive attitude
Continuing to advanceThe source of growth that opens possibilities for the future
2 KAWASAKI KISen KAISHA, ltD. 3AnnuAl RepoRt 2011

Lines of Business
Containership
Business
Bulk Shipping
Business
Other B
usiness
Operating Revenues
Logistics Business
We provide total logistics services meeting the growing diversity and complexity of logistics needs —including ocean and air cargo freight, buyer’s consolidation services (at the request of cargo owners, arranging to consolidate and ship cargoes from multiple owners), warehousing and truck transportation—by consolidating the know-how and broad experience of all members of the “K” Line Group.
p. 34
Short Sea and Coastal Business
Group company Kawasaki Kinkai Kisen Kaisha, Ltd. provides coastal freight transportation and ferry services. It operates passenger and truck ferries, express roll-on/roll-off cargo ships, dedicated carriers for limestone used in steel and cement production and general cargo carriers. It also operates liners and trampers for cargo to and from destinations in Asia.
p. 33
Containership Business
We operate a global service network centered on east-west trunk routes linking Asia/North America, Asia/Europe and Europe/North America through an alliance with prominent shipping companies in China, Taiwan and South Korea and extending to north-south routes linking Asia/South America and Asia/Middle East-Africa and intra-Asia routes. We transport broad spectrum of cargo—electronic equipment, electrical products, furniture, clothing, food and beverages, hops and so on—by container.
p. 24
Energy Transportation and Tanker Business
We transport liquefied gas using LNG and LPG carriers and crude oil and oil products by tanker. In addition to industrial energy sources, we transport city gas, gasoline and other energy resources used by consumers.
p. 30
Car Carrier Business
Since 1970, when “K” Line deployed TOYOTA MARU No.10 as Japan’s first PCC (Pure Car Carrier), we have been recognized as a pioneer in safe and prompt transportation of passenger cars, trucks and other vehicles. We are actively upgrading the fleet and working to improve transportation quality.
p. 28
Dry Bulk Business
We offer transport services for raw materials such as coal, iron ore, grain (wheat, soybeans, corn, etc.), woodchip and pulp. Recently, in addition to cargo bound for Japan, we actively transport cargo bound for China, India and other developing countries, and engage in trilateral transport in the Atlantic region.
p. 26
Heavy Lifter Business
On June 30, 2011 we acquired all shares of affiliate SAL Group of Germany, making it a wholly owned subsidiary. Through the SAL Group, we transport mainly large-scale cargoes related to energy and infrastructure development.
p. 32
Offshore Support Vessel Business
Through K LINE OFFSHORE AS in Norway, we provide offshore support vessel service to support the expanding offshore energy development industry.
p. 32
Increasing Presence
Since “K” Line launched its first containership service in 1968,
the containership fleet has grown to nearly 80 vessels, safely and
reliably delivering cargo to customers around the world. The pure
car carrier that “K” Line developed in 1970 created a new business
model and is contributing to expansion of automobile transport with
the world’s premier damage prevention system. In the resource
transportation sector, which is rapidly expanding due to economic
growth in newly-industrializing countries, we operate a variety
of ship types in all sizes to meet customer needs. Ships with the
“K” Line funnel symbol ply the world’s seas, from oil tankers and
LNG carriers, which have achieved a record of accident-free, safe
delivery of energy resources spanning many years, to the world’s
largest heavy lifters and offshore support vessels, which satisfy
new forms of transportation demand.
Linking people all over the worldOperation of a fleet optimized for market needs
Containership Business
45.2%
985billion yen
Other Business
9.4%
Bulk Shipping Business
45.4%
4 KAWASAKI KISen KAISHA, ltD. 5AnnuAl RepoRt 2011
“K” Line Presence

“K” Line Commitment
To address the issues of changing climate, air and sea pollution
and shrinking biodiversity and to protect the irreplaceable global
environment, the “K” Line Group places the highest priority on safe
operation and environmental preservation. We actively engage in
environmental initiatives, including the installation of eco-friendly
equipment on ships and the adoption of ship facilities and structures
to prepare against accidents.
Although ships offer the lowest CO2 emissions per ton-kilometer of
all modes of transportation, we aim to further improve energy efficiency.
In addition to using engine exhaust heat energy, converting water flow
energy generated by propellers into propulsion power and reducing
fuel consumption through the use of energy-saving auto pilot systems,
we are developing and improving environmental technologies from
every conceivable perspective. For instance, we conduct research and
development into the use of fuels emitting less CO2.
Use of Water Emulsion Fuel
Water emulsion fuel and its propertiesWater emulsion fuel is fuel made by agitating water and oil to disperse water particles in fuel oil. The use of water emulsion fuel has been shown to reduce nitrogen oxides (NOx) in diesel engine exhaust by approximately 20%. “K” Line Group has installed equipment to produce water emulsion on vessels it operates and is conducting on-board demonstration tests.
Environmental Conservation Initiatives
“K” Line’s Response to Tier III Nitrogen Oxide (NOx) Emission Control for Newbuildings
NOx emissions from the engines of ships constructed on and after 2016 must be reduced by 80% or more from the levels under the Tier I controls applied in 2000. “K” Line is cooperating in the development of technologies for complying with these NOx controls, such as demonstration tests of water emulsion fuel, which contributes to NOx reduction.
Steadfast Commitment
Water emulsion fuel combustion reactionWhen water emulsion fuel burns, the reaction in the diagram below occurs.lFuel particles surround the water particles. lWhen water emulsion fuel is injected into the engine, the water particles evaporate before the fuel particles ignite.lDue to the water evaporation, the fuel particles atomize into diffuse minute particles.lSince the extremely minute fuel particles burn readily, complete combustion is facilitated.lFor this reason, combustion efficiency is improved, resulting in cleaner exhaust.
Oil particles at the time of injection
Clean exhaust
Water particles
Oil particles
Emulsion fuel Oil particles at the time of combustion Exhaust
“K” Line’s Response to the Ballast Water Management Convention
Ballast water plays an important role in maintaining hull strength and ensuring stability during ship operation. However, there is concern about the impact on other ecosystems from discharge of non-native plankton and other marine organisms contained in ballast water. Ecosystem maintenance and biodiversity assurance have been undertaken as international initiatives, and the International Maritime Organization (IMO) has adopted the International Convention for the Control and Management of Ships' Ballast Water and Sediments (Ballast Water Management Convention). This has resulted in efforts to develop ballast water treatment systems for elimination of marine organisms in keeping with the provisions of the convention. The “K” Line Group is implementing a project* for experimental installation of a system on large bulk carriers (coal carriers). The installation and operation of a ballast water management system on large, an in-service bulk carrier is a world’s first, and we plan to utilize the knowledge and experience gained from the project and apply the expertise to other ship types.
* A joint project of IHI Marine United Inc., JFE Engineering Corporation, and SEA Systems Co., Ltd. with support from a joint research scheme of Class NK.
Pipelines for ballast water treatment system
Protecting the environmentFor clear seas and beautiful skies
6 KAWASAKI KISen KAISHA, ltD. 7AnnuAl RepoRt 2011
Change in the Environmental Impact of Ships Operated by “K” Line
Volume of CO2 emissions per freight ton-kilometer (gram-CO2/ton-kilometer)
Volume of SOx emissions per freight ton-kilometer (gram-SOx/ton-kilometer)
Volume of NOx emissions per freight ton-kilometer (gram-NOx/ton-kilometer)
2008
3.77 2009
3.22 2010
3.16
2008
0.066 2009
0.057 2010
0.054
2008
0.113 2009
0.088 2010
0.082

LNG as a next-generation, clean energy:
Meeting the Earth’s needs for
environmentally-friendly clean energy,
Meeting the world’s needs for
environmentally-friendly ships, and
Powering “K” Line’s clean energy ships.
“K” Line Commitment
“K” Line’s Gas-Fuelled Ship Development ProjectEnergy consumption is increasing rapidly due to the growth of global population, and the increasing exhaust gas emissions
are causing global warming. Moreover, this is causing a price increase for bunker fuel oil which is becoming a serious
problem in the marine shipping industry. In order to overcome these issues, “K” Line started research and development on
Gas-fuelled ships, making it the first car carrier in the world to use liquefied natural gas (LNG) for propulsion.
Presently, propulsion of most ships is powered with heavy fuel oil or diesel oil. However, if there is a switch to LNG fuel,
which is called a next-generation clean energy source for ships, pollutants in emissions such as carbon dioxide (CO2),
nitrogen oxides (NOx), sulfur oxides (SOx) and particulate matter (PM) can be drastically reduced. “K” Line has been a
pioneer in the maritime shipping industry and is now tackling the challenges of developing LNG fuel technology.
* Compared to the use of heavy fuel oil, by switching to LNG and adopting new technologies, CO2 emissions can be reduced by approximately 40%, NOx by 80% to 90%, SOx and PM by 100%.
Challenges Faced by the Gas-Fuelled Ship Development Project Teamthere are some difficulties to successfully realize this project. lnG fuel bunkering, storing and handling
technology to provide lnG to Gas engines must be developed. Gas-fuelled ships engaged in ocean transport
have never been built, except for lnG carriers and small domestic ships in norway.
to solve these above-mentioned difficulties, “K” line established the Gas-Fuelled Ship Development project
team in 2010. It was started together with Kawasaki Heavy Industries, ltd. which has the technologies of lnG
carriers and gas engines as well as Det norske Veritas (DnV), a norwegian classification society that is famed
as a pioneer in the use of lnG as ship fuel in europe.
We intend to develop next-generation and environmentally-friendly technologies, exerting continuous effort
to achieve the construction and operation of gas-fuelled ships in the near future.
“K” Line’s Gas-Fuelled Ship Development Project
Two pressure vessels (type C, 6 bar) are applied for LNG fuel tanks. These tanks shall be required to comply with strict safety standards. Therefore, the tanks are installed in an independent compartment and located a certain distance from the ship’s outer shell and bottom to ensure safety in the event of a collision or other marine incident. In addition, a complete double-wall piping system is applied for fuel pipes as a further safety measure.
lLNG Tanks lGas Engines Two sets of gas engines (5,000kw each) are applied as propulsion system, employing lean burn combustion. Each cylinder has an auxiliary chamber with spark plug to generate a flame for ignition, which is called torch jet, with the air-gas fuel mixture being combusted in the main chamber.
lPropulsion SystemOutput of the two gas engines is combined by a special reduction gear and transmitted to one controllable pitch propeller (CPP).
lShaft GeneratorsTwo sets of shaft generators are installed and driven by the reduction gear. It is possible to disengage the gear using a clutch. During navigation, all electric power demand can be covered by one shaft generator. During maneuvering conditions, parallel running of the two shaft generators is required to supply enough power to bow thrusters and other equipment.
System Structure
MDO or MGOD/GGSwitchboard
No.2 M/EGAS ENGINE
No.1 M/EGAS ENGINE
SGM
SG
CPP:Clutch
Internal electric power
GAS
GAS
8 KAWASAKI KISen KAISHA, ltD. 9AnnuAl RepoRt 2011

Financial Highlights
Kawasaki Kisen Kaisha, Ltd. and consolidated subsidiariesYears ended March 31
FY2001 FY2002 FY2003 FY2004 FY2005 FY2006 FY2007 FY2008 FY2009 FY2010 FY2010 FY2011 prospects*7
(Millions of yen) (Thousands of U.S. dollars)*4 (Millions of yen)
operating revenues ¥571,014 ¥632,725 ¥724,667 ¥828,444 ¥940,819 ¥1,085,539 ¥1,331,048 ¥1,244,317 ¥838,033 ¥985,085 $11,847,084 ¥1,090,000
operating income 19,049 29,282 70,534 108,054 87,976 61,357 129,649 71,604 (52,075) 58,610 704,871 6,000
ordinary income*2 11,968 23,672 62,564 107,235 88,573 63,928 125,868 60,011 (66,272) 47,350 569,453 3,000
net income 4,768 10,373 33,196 59,853 62,424 51,514 83,012 32,421 (68,721) 30,603 368,046 2,000
net assets*3 77,716 82,040 121,006 181,276 257,810 357,625 376,277 356,153 331,865 314,986 3,788,166 290,000 *8
Roe (%)*5 6.5 13.0 32.7 39.6 28.4 17.1 23.7 9.4 (21.4) 10.2
RoA (%)*6 2.3 4.5 11.6 18.4 13.0 7.7 13.5 6.2 (6.6) 4.6 0
DeR (times) 4.32 3.74 2.33 1.32 1.08 0.95 0.93 1.31 1.67 1.66 1.83
total assets 533,295 515,825 559,135 605,331 757,040 900,439 968,630 971,603 1,043,885 1,032,505 12,417,378
Per share of common stock (yen) (U.S. dollars)
net income 8.03 17.24 55.71 100.70 104.89 86.67 131.36 50.89 (106.24) 40.08 0.48 2.62
net assets 130.88 138.29 204.37 306.06 435.19 556.55 558.46 525.43 403.53 381.87 4.59
Cash dividends applicable to the year 3.00 5.00 10.00 16.50 18.00 18.00 26.00 13.50 — 9.50 0.11 —
Employees
total 6,058 6,013 6,088 6,226 6,827 7,041 7,615 7,706 7,740 7,895
-10
0
10
20
30
0
50
100
-100
150
47
3
4.6
0
Prospects*7’01 ’02 ’03 ’04 ’05 ’06 ’07 ’08 ’09 ’10 ’11(FY)
-100
0
20
100
150
0
500
1,000
1,500
9851,090
59
6
Prospects*7’01 ’02 ’03 ’04 ’05 ’06 ’07 ’08 ’09 ’10 ’11(FY)
0
10
20
30
40
50
100
200
300
400
0
500
315290
26.028.2
Prospects*7,8’01 ’02 ’03 ’04 ’05 ’06 ’07 ’08 ’09 ’10 ’11(FY)
0
2
4
6
200
400
0
600
483
530
1.831.66
Prospects*7’01 ’02 ’03 ’04 ’05 ’06 ’07 ’08 ’09 ’10 ’11(FY)
Operating Revenues / Operating Income Ordinary income (Left scale) ROA (Right scale) Net assets (Left scale) Equity ratio (Right scale) Interest-bearing liabilities (Left scale) DER (Debt Equity Ratio) (Right scale)
Ordinary Income / ROA Interest-bearing Liabilities / DER (Debt Equity Ratio)Net Assets / Equity Ratio
(Billions of yen) (Billions of yen) (Billions of yen) (%) (%) (%)(Billions of yen) (Billions of yen)
Notes: 1. Unless otherwise stated, above figures are all in millions of yen. *2. Ordinary income consists of operating income and nonoperating income/expenses. *3. Until fiscal 2005, amounts posted under ‘shareholders’ equity’ (calculated using the previous accounting standards) are employed for ‘net assets.’ *4. The U.S. dollar amounts are converted from the yen amounts at ¥83.15 = U.S. $1, the exchange rate prevailing on March 31, 2011.
Equity ratio: Shareholders’ equity / Total assetsShareholders’ equity: Net assets – (Minority interests + Share warrant)
DER: Interest-bearing liabilities / Shareholders’ equity
*5. Return on Equity: Net income/Shareholders’ equity*6. Return on Assets: Ordinary income/Total assets*7. Figures announced on April 28, 2011*8. Net assets are shown before adjustment for minority interests.
Operating revenues (Left scale) Operating income (Right scale)
“K” LINE Vision 100 “New Challenges”“KV 2010”“K” LINE Vision 2008+“K” LINE Vision 2008KV PlanNew K-21
10 KAWASAKI KISen KAISHA, ltD. 11AnnuAl RepoRt 2011

Message to Our Stakeholders
An Interview with the President
In April 2011, the “K” Line Group established the “K” LINE Vision 100 —New Chal-
lenges— medium-term management plan, taking our next step toward future busi-
ness development. On the 11th of March, the month prior to the announcement of
the management plan, Japan was devastated by one of the largest natural disasters
in recorded history. We once again offer our prayers for the repose of those who lost
their lives in the Great East Japan Earthquake and our heartfelt sympathies to every-
one affected by the catastrophe. Amid continued repercussions from the earthquake
such as deterioration in the functioning of the global supply chain and concerns about
electric power shortages, the “K” Line Group is committed to assisting in recovery
in any way we can through our business activities centered on marine transport and
through the input of resources at our disposal.
Looking at developments around the world, we see spreading concern that the
European debt problem will become a weight that impedes recovery of the global
economy. We see a number of indicators that show signs of economic slowdown in
the United States, principally housing and employment figures. In addition, the ris-
ing consumer price index in China has given rise to wariness about additional fiscal
austerity measures. Furthermore, in the marine transport industry profits are under
tremendous pressure from yen appreciation and high fuel oil prices.
Nevertheless, with a view to “K” Line’s upcoming centennial anniversary in 2019,
we will pursue strategic moves to make demand expansion in developing countries and
global trends the impetus for future growth. After assuming office, President Asakura
launched the Business Structural Reform Committee and led discussions on short-
term cost reduction measures to cope with an economic environment fraught with
uncertainty. This situation was similar to the loss that the company experienced after
the financial crisis of 2008. He has devoted himself to improving and strengthen-
ing the medium- to long-term financial position in line with the objectives of the
“K” LINE Vision 100 —New Challenges— medium-term management plan.
Although I have relinquished my duties as an executive officer this term, I
intend to support the renewed and revitalized “K” Line in my role of oversee-
ing the new management structure as Chairman of the board of directors.
The “K” Line group intends to achieve business development to reward
the expectations of our shareholders. I ask your continued support in the
coming years.
Under the new “K” LINE Vision 100 —New Challenges— medium-term
management plan, “K” Line will enhance corporate value by further
strengthening the earnings base and financial structure while also
taking on exciting new challenges. We asked President Jiro Asakura
what lies ahead for “K” Line.
Higher ValueSteaming Toward
Director, Chairman
Hiroyuki Maekawa
12 13AnnuAl RepoRt 2011

An Interview with the President
ing methods for each business unit. The fundamental task of the Business Restructuring Subcommittee
is reflection on how to respond to structural changes in the market and change what must be changed.
Fiscal 2010 brought an upturn in the economic environment and demand recovery that fueled a re-
covery in containership cargo movement and led to higher freight rates. The market for dry bulk carrier
services, especially for small and medium-sized carriers, firmed up in response to robust demand for
iron ore, coal and grain in China and India. Cargo volume in the car carrier business increased by ap-
proximately 40% from fiscal 2009, when the impact of the economic downturn was severe, resulting in
sharp increases in revenues and profits.
As a result, we were able to achieve dramatic improvement in consolidated business results, re-
cording operating revenues of ¥985.1 billion, operating income of ¥58.6 billion, ordinary income of
¥47.4 billion and net income of ¥30.6 billion,
The “K” Line Group has advanced step by step by always facing and overcoming difficult challenges in
unison. I intend to positively view challenges and difficulties as growth opportunities. Adversity enables
us to see clearly things that aren’t readily apparent in ordinary times. In that sense, I believe that this is
an excellent opportunity to promote the structural improvement of the company and review our busi-
ness processes and practices. My objective is to make “K” Line a strong, sturdy company that can
achieve dramatic advances as we approach our centennial anniversary.
A pressing task is earnings improvement. As a short-term measure, we have set up the Earnings
Improvement Subcommittee under the Business Structural Reform Committee and will intensely con-
sider and rapidly implement cost reductions and other urgent profit improvement measures. In addi-
tion, in July we launched the Business Restructuring Subcommittee to examine more efficient operat-
The “K” Line Group established the “K” LINE Vision 100 medium-term management plan in April 2008
with a view to the mid-2010s and through to “K” Line’s centennial anniversary in 2019. We have sub-
sequently reviewed the plan in response to sweeping changes in the business environment. “K” LINE
Vision 100 KV2010 was announced in January 2010 as a plan to cope with the global economic
slump and tumultuous business environment, and in fiscal 2010 we achieved business results that
exceeded the plan’s objectives. Now we have announced “K” LINE Vision 100 —New Challenges—,
a medium-term management plan that has further developed the themes in the previous plan, making
prompt incorporation into planning of changes in market structure and growth in developing countries
and strategic investments in new growth sectors the foundation of our business strategy. At the same
time, we aim to establish a stable earnings base and strengthen the financial base through a qualitative
transformation from a course of all-around expansion.
Please provide an overview of “K” LINE Vision 100 —New Challenges—, the medi-um-term management plan announced in April 2011 covering the period from fiscal 2011 to 2013.
Q.2
You became president in circumstances that allow for little optimism about the busi-ness environment for marine transport services. Please describe your aspirations for “K” Line and provide a review of fiscal 2010.
Q.1
Investments for the coming three years have been largely finalized, and the investment plan consists
of the sum of those investments. For instance, of the ¥95.0 billion in investments for fiscal 2011, ¥23.0
billion will be outlays for structural improvements, ¥37.0 billion will be for strengthening of new busi-
nesses, and ¥35.0 billion will be for newbuildings such as dry bulk carriers. For the second half of the
term of the plan, the bulk of investment will be principally payments for dry bulk carrier newbuildings.
The medium-term management plan calls for investment of ¥240.0 billion. In what business sectors do you plan to invest?Q.3
14 KAWASAKI KISen KAISHA, ltD. 15AnnuAl RepoRt 2011

An Interview with the President
Increased containership size has become a major industry trend, and mega containerships are scheduled
for deployment in stages, especially on European routes. For “K” Line, the introduction of next-generation
mega containerships is under study from various perspectives in addition to cost competitiveness, in-
cluding profitability and environmental conservation.
We will devise optimal measures based on factors such as the number of vessels, time of deploy-
ment, and balance of owned and chartered vessels while closely observing future market trends and tak-
ing care to avoid opportunity loss.
Please describe the business policy for each business sector. First, what is the sta-tus of consideration of mega containerships?Q.4
Scrapping of vessels has been increasing, and we expect supply pressure to gradually ease and mar-
ket conditions to head toward recovery beginning in the second half of the current term. Nearly 90%
of “K” Line’s capesize vessels operate under medium- to long-term contracts, and the impact of dete-
rioration in market conditions on our business is limited. At the same time, market conditions for small
and medium-size vessels from Panamax class down have become comparatively firm. Although we
plan fleet expansion, with an emphasis on small- and medium-size bulk carriers, we have no intention
of increasing the number of vessels without good reason. We intend to secure contracts, whenever
possible, and also accumulate medium-term to long-term contracts for small and medium-size vessels
with highly-respected customers.
Is the market environment for dry bulk services, especially large vessels, stagnant?Q.5
We take pride in having been among the first companies to offer global services. We moved quickly to
set up operating subsidiaries in Singapore, the U.S. and Europe, and thus established a sales and ves-
sel operation network. This has earned us a reputation for excellence from overseas customers. For in-
stance, we are one of leading carriers in the volume of cargo bound for Arcelor Mittal, one of the world’s
largest steel producers.
In China, the world’s largest raw steel-producing country, we have concluded a number of long-term
iron ore transport contracts with major steelmakers and have steadily established a track record in Chi-
na’s dry bulk market. In India, we stole a march on competitors by concluding long-term contracts for the
transport of raw coal with JSW Group, a powerful conglomerate, obtaining long-term transport contracts
for 16 million tons of coal per year beginning in 2012. In addition, we have concluded a five-year contract
with Gujarat NRE Coke, a major coke producer in India. To step up our activities in India, a booming
market, we have increased staffing levels and since April 2011 an executive officer has been stationed in
India as CEO of our local subsidiary.
In your opinion, what are “K” Line’s strength in dry bulk services?Q.6
Since production at automakers has recovered far earlier than we initially supposed, we returned the fleet
to full operation in July. With regard to the profit and loss forecast, the key is how much we can recover
from a substantial loss incurred in the first quarter (April to June). Reportedly, in the second half some au-
tomakers will increase production over the levels planned before the earthquake on March 11 to make up
for first-half decreases. We will work to improve earnings to the extent possible by meeting demand for
transportation of this additional production.
Recovery of production at Japan’s automakers is a positive development, isn’t it? Q.7
The liquefied natural gas (LNG) transport market was already recovering before the earthquake, and
since the disaster, electric power companies have been purchasing additional quantities of LNG to
ensure full-capacity operation of LNG thermal power generation plants. Accordingly, LNG transport
demand is further increasing due to the impact of the earthquake, on top of a favorably developing
market trend. “K” Line will leverage nearly 30 years of experience in LNG transport as we seek contin-
ued expansion of LNG transport as a business that earns stable profits while placing the highest im-
portance on operating safety.
Do you expect transport demand for alternate fuels to increase due to the impact of the Fukushima nuclear power accident?Q.8
16 KAWASAKI KISen KAISHA, ltD. 17AnnuAl RepoRt 2011

An Interview with the President
See for details.p. 7
The establishment and maintenance of safe operation is a minimum requirement for the operation of a
marine transport business to ensure the safety of crews and ships and the safety and reliable delivery of
entrusted cargoes. Operation of a marine transport business simply isn’t possible without safety, and it is
people who protect the safety of ships. For this reason, “K” Line has established a safe operation manage-
ment system that develops crew members who can safely operate ships and provides complete support
for ship operation from shore.
The risk of piracy has increased in recent years, and we take every conceivable countermeasure,
including escorting by naval vessels of Japan’s Maritime Self-Defense Forces and other countries, the
avoidance of navigating the piracy-affected areas, high-speed navigation and the installation of anti-piracy
equipment. We also strive to ensure safe operation by enlisting the cooperation of international organiza-
tions and national governments.
What are your thoughts on operating safety, the most important consideration for a shipping company?Q.9
The “K” Line Group will strive to meet the expectations of our shareholders, investors and other stake-
holders by vigorously implementing the measures set forth in the new “K” LINE Vision 100 —New Chal-
lenges— medium-term management plan and enhancing corporate value.
With regard to profit distribution, “K” Line has made it an important management priority to maximize
shareholder returns while taking into consideration the need to secure internal reserves necessary for
capital investment for sustainable growth and maintenance of a sound financial position, key priorities
in the management plan. Our policy is to increase the dividend payout ratio by 1% each year keeping
in mind a dividend payout ratio of 30% in the mid-2010s. We declared a dividend of ¥9.5 per share (an
interim dividend of ¥4.0 and a year-end dividend of ¥5.5) for fiscal 2010. For fiscal 2011, although we
will make a dividend payout ratio of 25% our target, we will not make a decision on the dividend at this
time in view of the extreme uncertainty in circumstances surrounding our business. We will make a fur-
ther announcement about the dividend once we have determined that a forecast is possible, taking into
consideration factors such as the outlook for the full year and the financial situation.
I ask the continued support and encouragement of our shareholders and investors in the coming years.
Finally, I would like to convey my sympathies to everyone affected by the Great East Japan Earth-
quake and my prayers for the early recovery of the stricken region. In addition to offering monetary dona-
tions to assist the victims, “K” Line is cooperating in the ocean transport of temporary housing materials
and everyday goods bound for stricken areas and has provided free of charge reefer containers for the
storage of foodstuffs. We are committed to engaging in sustained support activities to assist with the
recovery of the areas affected by the disaster.
Please offer a message to the shareholders and investors.Q.11
Although ships are a more environmentally friendly mode of transport than trucks or aircraft, total world-
wide emissions of CO2 from ships in 2007 were 1.05 billion tons (3.3% of the world total), of which 0.87
billion tons are said to have been emitted by ships in international marine transport service, an amount that
rivals emissions from the country of Germany. Amid increasing momentum to reduce exhaust from ships
to protect the global environment, “K” Line, as a company that exerts leadership in protection of the global
environment, takes a variety of environmental measures in ship operation, including efforts to reduce CO2
emissions. To reduce emissions of nitrogen oxide (NOx), a cause of acid rain that destroys forests, we are
developing environmental technologies and conducting demonstration experiments. For instance, we are
applying water emulsion fuel* that can reduce NOx generation in engines and installing ballast water treat-
ment equipment that prevents interoceanic migration of marine organisms, which is thought to have an
impact on ecosystems. We are now attempting conversion to a ship propulsion method that will enable
substantial reductions in greenhouse gases in exhaust and environmentally destructive substances. This
involves the development of ships that use as fuel liquefied natural gas (LNG), called a next-generation
clean energy source for ships. Although the construction of an onshore infrastructure to supply LNG fuel
is an issue, we have nearly completed basic technical studies for the development of ships powered by
LNG. “K” Line aims to reduce the environmental impact of international marine transport and will continue
to undertake development of environmentally-friendly technologies and ships.
The International Maritime Organization (IMO) actively discusses environmental issues. Tell us about environmental preservation initiatives at “K” Line.Q.10
* Water emulsion fuel is fuel made by agitating water and oil to disperse water particles in fuel oil. The use of water emulsion fuel reduces nitro-gen oxides (NOx) in diesel engine exhaust by approximately 20%.
President and CEO
Jiro Asakura
18 KAWASAKI KISen KAISHA, ltD. 19AnnuAl RepoRt 2011

Review of the Medium-Term Management Plan
Two Missions
1 Expansion of stable earnings base and sustainable growth
Although recovery in the business environment is spotty, a situa-
tion partly attributable to the impact of the Great East Japan Earth-
quake, the global economy is showing steady recovery. “K” Line
will work to expand its earnings base by seeking steady expansion
of its core businesses, containership, dry bulk carrier and car carrier
services, and by closely observing structural changes in energy re-
source demand and working to expand energy transportation and
tanker services and heavy lifter services into new core businesses.
Initiatives by Business Segment
Supply-Demand RatioForecast Demand Forecast Supply
0
5
10
15
20
75
80
85
90
95
100
’07 ’08 ’09 ’11’10 ’12 ’13 ’14 ’15(CY)
(Millions of TEU) (%)
Worldwide Forecast for Containership Shipping Capacity Supply and Demand
Sources: Materials from Drewry, Alphaliner, and other sources and “K” Line forecasts.
(Millions of tons)
0
50
100
150
300
350
250
200
400
’10 ’15 ’20(CY)
Asia-Pacific Middle East EuropeNorth America Central and South America
Demand for LNG, Attracting Attention as a Source of Clean Energy
Source: RIM Yearbook, prepared by “K” Line based on Poten & Partners and CERA
2,500
2,750
3,000
3,250
3,750
3,500
4,000
200
300
400
500
600
700
’07 ’08 ’09 ’11’10 ’12 ’13 ’14 ’15(CY)
The Supply-Demand Gapwill start to shrink in 2012
Fleet capacity DWTCargo movement volume(Millions of tons) (Millions of DWT)(Annual cargo movement volume) (Year-end total fleet capacity)
Dry Bulk Total Fleet Capacity DWT and Cargo Movement Volume Forecasts
Sources: Clarkson; data for 2011 to 2015 are “K” Line forecasts.
nContainership BusinessIn fiscal 2011: outlook is for recovery trend from summer onward, despite tempo-rarily weak market conditions at beginning of the period, and in response to rising demand, a continued mild recovery is expected in fiscal 2012 and beyond.
We will pursue business development focused on north-south routes and intra-Asian routes, where future expansion is forecast, and provide a broad service network evolv-ing around CKYH—the Green Alliance in the main east-west routes. We will also con-sider containership fleet upgrades.
nCar Carrier BusinessRestructuring of the business plan in response to structural changes in the completed car transport market
We will expand ship allocation services and upgrade the fleet in response to diversifi-cation in marine transport demand due to market expansion in developing countries. We aim to develop a structure to transport 3.5 million cars per year by the mid-2010s.
nEnergy Transportation and Tanker BusinessCoping with structural change in global energy demand (higher demand for LNG, acceleration of energy development)
We will seek to expand our LNG carriers operations to cope with increased LNG de-mand and pursue profitability improvement from synergy by entering businesses in upstream sectors such as floating LNG production vessels and drillships.
nHeavy Lifter and Offshore Support Vessel BusinessResponding to demand from growth sectors such as energy development
In June 2011 “K” Line made the SAL Group of Germany a wholly owned subsidiary with the aim of developing heavy lifter operations into a core business. In offshore sup-port vessel operations, we will seek a stable earnings structure by means of long-term contracts with high-value customers.
nLogistics BusinessResponding to steady recovery in demand for infrastructure-related cargo transport and air cargo transport
We will expand and upgrade services offered by “K” Line Logistics, Air Tiger Express and Century Distribution System to develop our logistics operations, focusing on the Asian market.
nDry Bulk Carrier BusinessContinuation of fleet upgrades to cope with recovery in the global economy in fiscal 2011 and beyond
Expansion of resource transport and increases in ton-miles are expected to accompany sustained economic growth in China, India and other developing countries. In the mid-2010s we will engage in fleet upgrades aimed at bringing fleet size to 300 vessels, focusing on the addition of small and medium-sized vessels.
20 KAWASAKI KISen KAISHA, ltD. 21AnnuAl RepoRt 2011
The “K” LINE Vision 100 medium-term management plan was
established in April 2008 with a view to the mid-2010s and through
to “K” Line’s centennial anniversary in 2019. However, we revised
the plan as “K” LINE Vision 100 KV2010 in January 2010 to
correspond to changes in the overall economic environment since
the financial crisis of 2008. Having surpassed the objectives for
fiscal 2010 in the “K” LINE Vision 100 KV2010 revised plan, we
decided to once again review the plan in light of future structural
changes in the market such as demand for energy resources, the
rising prominence of developing countries and our desire to actively
engage in business in growth sectors. The review resulted in the
“K” LINE Vision 100 —New Challenges—. The plan subtitle “New
Challenges” refers to our desire to contribute to the recovery of our
Japan battered by earthquake disaster and to the long tradition of
meeting difficult challenges that is the basis for the “K” Line Spirit.
The main theme of the “K” LINE Vision 100 medium-term
management plan is “Synergy for All and Sustainable Growth.”
We aim to share benefits and continue to grow together with
our stakeholders: customers, shareholders, business partners,
employees, and society at large. In this review of the plan, in
addition to the five basic missions set forth in the previous version,
we have added and are working to realize two additional missions:
1) Expansion of stable earnings base and sustainable growth and 2)
Strategic investment in response to structural market changes and
growth in demand.
Background to the Review of the Medium-Term Management Plan
“K” LINE Vision 100“New Challenges”
Activities to promote environmental protection
Stable and safe ship operation administration structure
The five basic priorities
Three Missions
Borderless management through the best and strongest organization
Strategic investment and proper allocation of management resources
Improvement of corporate value and complete risk management
Apr. 2008 Jan. 2010 Apr. 2011 Mid-2010s
“K” LINE Vision 100 (Main Theme: Synergy for All and Sustainable Growth)
“K” LINE Vision 100 KV2010
(Capital investment in creation of a flexible fleet and in new businesses)(Ongoing measures for improvement and strengthening of financial makeup)
Two Missions1 Expansion of stable earnings base and sustainable growth
2 Strategic investment in response to structural market changes and growth in demand
“K” LINE Vision 100 —New Challenges—
1 Move into the black in fiscal 2010 and early resumption of dividends
2 Expansion of stable earnings base and sustainable growth3 Improvement and strengthening of financial makeup

“K” Line will undertake to build a highly adaptable and flexible
fleet against a backdrop of demand expansion in China, India
and other developing countries and structural market changes
and diversification, and will invest in new businesses in growth
sectors. We have reviewed the initial investment figure of ¥56.0
billion for fiscal 2011 and now forecast investment of ¥95.0 bil-
lion. By applying ¥23.0 billion of this to structural reform of the
fleet through the purchase and addition of pre-owned vessels
that have recently come off lease or off charter, we will increase
the flexibility to dispose of ships when business conditions or
demand fluctuates.
In addition, the investment amount includes ¥37.0 billion for
investment in offshore support vessels, heavy lifters and chemi-
cal carriers to reinforce new business operations. Even as we
make these investments for structural reform and new business
reinforcement, we will continue to strengthen the financial base.
nChanges in Fleet Size
nNumerical Targets
(Unit: vessels)
Fiscal YearFY2010
completionFY2011
completionFY2012
completionFY2013
completionFY2011-13completion
No. of Vessels at end of FY2013
Containerships 11 6 4 0 10 82
Dry Bulk Carriers 16 35 23 27 85 260
Car Carriers 7 7 1 0 8 86
tankers 0 1 2 0 3 29
lnG Carriers 0 0 0 0 0 42
offshore Support Vessels 3 4 0 0 4 8
Heavy lifter Vessels 2 0 0 0 0 16
Coastal Vessels 1 1 2 0 3 54
total 40 54 32 27 113 577
Capesize: Dry bulk carriers with cargo capacity over 100,000 deadweight tonsPanamax size: The largest ships that meet passage limits for the Panama Canal—Dry bulk carriers of 60,000-80,000 deadweight tonsHandymax: Cargo capacity is about 45,000–60,000 deadweight tons with self-loading facilities capable of cargo loading and unloading at ports that do not have
modern loading facilities.Small handy: Cargo capacity is about 20,000–40,000 deadweight tons with self-loading facilities capable of cargo loading and unloading at ports that do not have
modern loading facilities.
FY2011 FY2012 FY2013 Mid–2010s
operating revenue (Billion yen) 1,090 1,160 1,250 1,300
ordinary income (Billion yen) 3 46 71 110
net income (Billion yen) 2 32 52 70
Shareholders’ equity (Billion yen) 290 320 370 450
Interest-bearing debt (Billion yen) 530 510 460 380
operating cash flow (Billion yen) 49 105 125 —
Investing cash flow (Billion yen) -95 -80 -65 —
DeR (times) 1.83 1.59 1.24 Below 0.95
RoA (%) 0 4 6 Above 8%
Shareholders’ equity ratio (%) 26 28 31 Above 40%
Interest-bearing debt / operating cash flow (times) 10.82 4.86 3.68 Below 4.5
Dividend payout ratio (%) 25 26 27 30%
Assumption
FY2011 FY2012 FY2013
Dry bulk market (pacific round voyage)
Capesize (uS$ / day) 20,000 25,000 30,000
panamax (uS$ / day) 15,000 17,500 20,000
Handymax (uS$ / day) 13,000 15,000 18,000
Small handy (uS$ / day) 11,000 12,000 14,000
exchange rate (Yen / uS$) 85 85 85
Bunker price (uS$ / Mt) 650 600 600
Sensitivity (FY2011) Exchange rate changes: ±1 yen / US$1 approx. ¥1.2 billion (ordinary income) Bunker price changes: ±US$10 / MT approx. ¥1.2 billion (ordinary income)
Targets for financial index (Consolidated)
Cash Flows from Investments
FY2011 plan: ¥95.0 billion
(1) Structural improvements: ¥23.0 billion (Purchase of pre-owned vessels after termination of lease or charter contracts)
(2) new business development: ¥37.0 billion ( Offshore support vessels, Heavy lifters, Chemical tankers, etc.)
FY2012 plan: ¥80.0 billion
FY2013 plan: ¥65.0 billion
three-year total for 2011– 2013: ¥240 billion
nChange in Profit and Key Performance Indicators
In 2012 and beyond we expect to return to a normal earnings structure as a result of expansion of business operations. We forecast steady improvement in
financial indicators such as the debt equity ratio (DER) and equity ratio in fiscal 2012 and beyond accompanying earnings improvement, despite some deteriora-
tion in fiscal 2011. We have set targets for the mid-2010s of a DER of 95% or lower, return on assets (ROA) of 8% or higher, an equity ratio of 40% or higher, a
ratio of interest-bearing debt to operating cash flow of 4.5 times or lower, and a payout ratio of 30%.
0
300
600
900
1,200
1,500
0
50
100
150
200
250
Mid-2010s(FY)2010 2011 2012 2013
1,300
110
70
(Result)
Operating revenues (Left scale) Net income (Right scale) Ordinary Income (Right scale)
(Billions of yen)
Income
0
100
200
300
400
500
0
0.5
1.0
1.5
2.0
2.5450
0.95
Mid-2010s(FY)2010 2011 2012 2013(Result)
Shareholders’ equity Operating CF Investment CF DER
(Billions of yen) (Times)
Major Financial Indicators
Review of the Medium-Term Management Plan
2 Strategic investment in response to structural market changes and growth in demand
22 KAWASAKI KISen KAISHA, ltD. 23AnnuAl RepoRt 2011
Service Network Expansion and Modification
nNorth America Routes
•Asia-NorthAmericaEastCoastRoutesService improvements such as shortening of transit time between Ho Chi Minh City and New York by seven days through a review of ports (April 2011)
nNorth-SouthRoutes
•Asia-SouthAmericaEastCoastRoutesTransition to two loops per week through the ad-dition of new services (July 2011)
•Asia-SouthAmericaWestCoastRoutesAddition of a port call in Honolulu and start of weekly service linking Japan-Asia/Honolulu (De-cember 2010)
Topics
Change in Freight Rates for Cargo Originating in China (Average US$ freight rates per TEU)
0
2,000
1,500
500
1,000
2,500
’01.1 ’02.1 ’03.1 ’04.1 ’05.1 ’08.1’07.1’06.1 ’09.1 ’10.1 ’11.1
China⇒Northern Europe China⇒The Mediterranean China⇒North America East Coast China⇒North America West Coast
(CY)
Source: China Containerized Freight Index
Overview of Fiscal 2010In a business environment fraught with uncertainty since the financial crisis of 2008, we
reduced tonnage on routes between Asia and North America, where overall cargo vol-
umes decreased by 6% year on year. Cargo volumes increased by 8% on routes between
Asia and Europe/the Mediterranean, where cargo movements were solid throughout the
year, and increased by 2% on north-south and intra-Asian routes. As a result of these
developments, the “K” Line Group’s overall cargo volumes in fiscal 2010 were nearly at
the same level as the previous year.
Freight rates improved substantially and revenues increased as a result of freight rate
restoration. The business returned to profitability due to maximum utilization of tonnage
and equipment, streamlining in ship allocation and eco-friendly slow steaming, despite
negative factors such as soaring fuel oil prices and yen appreciation.
Fiscal 2011 Business OutlookWe expect worldwide freight movements, which improved dramatically in 2010, to follow
a gradual growth path in 2011 and beyond. With regard to freight rate levels, however,
short-term cargo rates declined during the winter off-season due to supply pressure
resulting from the completion of new ships in early spring and are expected to lag for a
time. Although freight rate restoration was achieved to some extent in most trades dur-
ing the summer peak season, we anticipate an adverse business environment due to an
expected year-on-year decrease in full-year freight rates on European and north-south
routes coupled with cost increases from continuing high fuel oil prices and inland costs
in North America.
In these circumstances, “K” Line will continue to engage in conservative route op-
eration on the east-west trunk routes. Furthermore, together with partners in the CKYH
Green Alliance and our partners in cooperative ship allocation on intra-Asia routes and
north-south routes, we will continue efforts to reduce operating costs while maintaining
and improving service quality. Measures include optimization of transport capacity in line
with demand, streamlining of ship allocation through means such as adjustment of ports
of call, further promotion of eco-friendly slow steaming and promotion of the mutual use
of terminals and equipment. We plan to further promote the development of an organiza-
tion and business structure that will enable full utilization of operating assets—uniting ac-
count sales, ship operation and equipment management through further reinforcement of
groupwide information sharing among the world headquarters in Tokyo and the overseas
business sites (North America, Europe, Singapore and Hong Kong), and the rigorous ap-
plication of IT, which enables detailed profit management adapted to market conditions.
We will take a twofold approach to upgrading the fleet. We will prepare against the
risk of supply and demand fluctuations by means of fleet development involving the ac-
quisition of cost-competitive pre-owned vessels and an increase in the proportion of
vessels that can be scrapped or returned on short notice. At the same time, we will
consider next-generation large newbuildings with the aim of ensuring business scale in
line with cargo movements that are expected to continue to show stable growth. We will
pursue economies of scale through larger vessel size while also actively introducing new
technologies to protect the global environment.
In addition, we will seek well-balanced route operation by striving to maintain high-
quality service on the east-west trunk routes, while at the same time expanding and
upgrading services focused on intra-Asia and north-south routes, where future transport
volume growth is expected to mirror economic growth.
’06 ’07 ’08 ’09 ’100
80
60
40
20
100
(FY)
21
23
7
11
27
22
24
8
17
28
24
25
5
20
24
16
8
29
5
19
10
8
24
19
4
15
12
Change in the Number of Ships in Operation (Vessels)
Number of Ships in Operation (As of March 31, 2011)
(Vessels)
■ 8000 TEU type 8■ 5500 TEU type 19■ 3500 TEU type 24■ 2800 TEU type 4■ 2000 TEU type 15■ 1400 TEU or under 12
Total 82
We will provide our customers with stable, high-quality services by operating a network that covers numerous ports of call using state-of-the-art large containerships. The backbone for the east-west trunk routes, such as Asia-North America, Asia-Europe and Atlantic Ocean routes, is CKYH—the Green Alliance*, consisting of COSCON (China), “K” Line, Yang Ming (Taiwan) and Hanjin Ship-ping (South Korea). On intra-Asian routes linking the countries that comprise the large economic block centered on China, on north-south routes to fast-growing India and Brazil and to emerging countries in Africa and other regions where future economic development is expected, we will de-velop business flexibility by providing services adapted to customer needs, through responding to the distinct characteristics of shipping routes, and using cooperative ship allocation with lead-ing Japanese and foreign shipping companies. We will introduce leading-edge technologies and rigorously practice energy-saving ship operation to conserve energy resources and reduce green-house gas emissions. Furthermore, we will con-sider a fleet upgrade plan to include new next-generation large containerships as a strategic move for future development.
BuSiNeSS StRategy
Senior Managing Executive Officer eizo Murakami
*CKYH Green Alliance: The world’s largest shipping alliance, named using the initials of the four companies involved, COSCON (China), “K” Line, Yang Ming (Taiwan), Hanjin (Korea)
24 KAWASAKI KISEN KAISHA, LTD. 25ANNuAL REpORT 2011
Containership Business
Business Review and Outlook
TopicsCompletion of MAIZURU BENTEN, a dedicated vessel for The Kansai Electric Power Co. Inc.
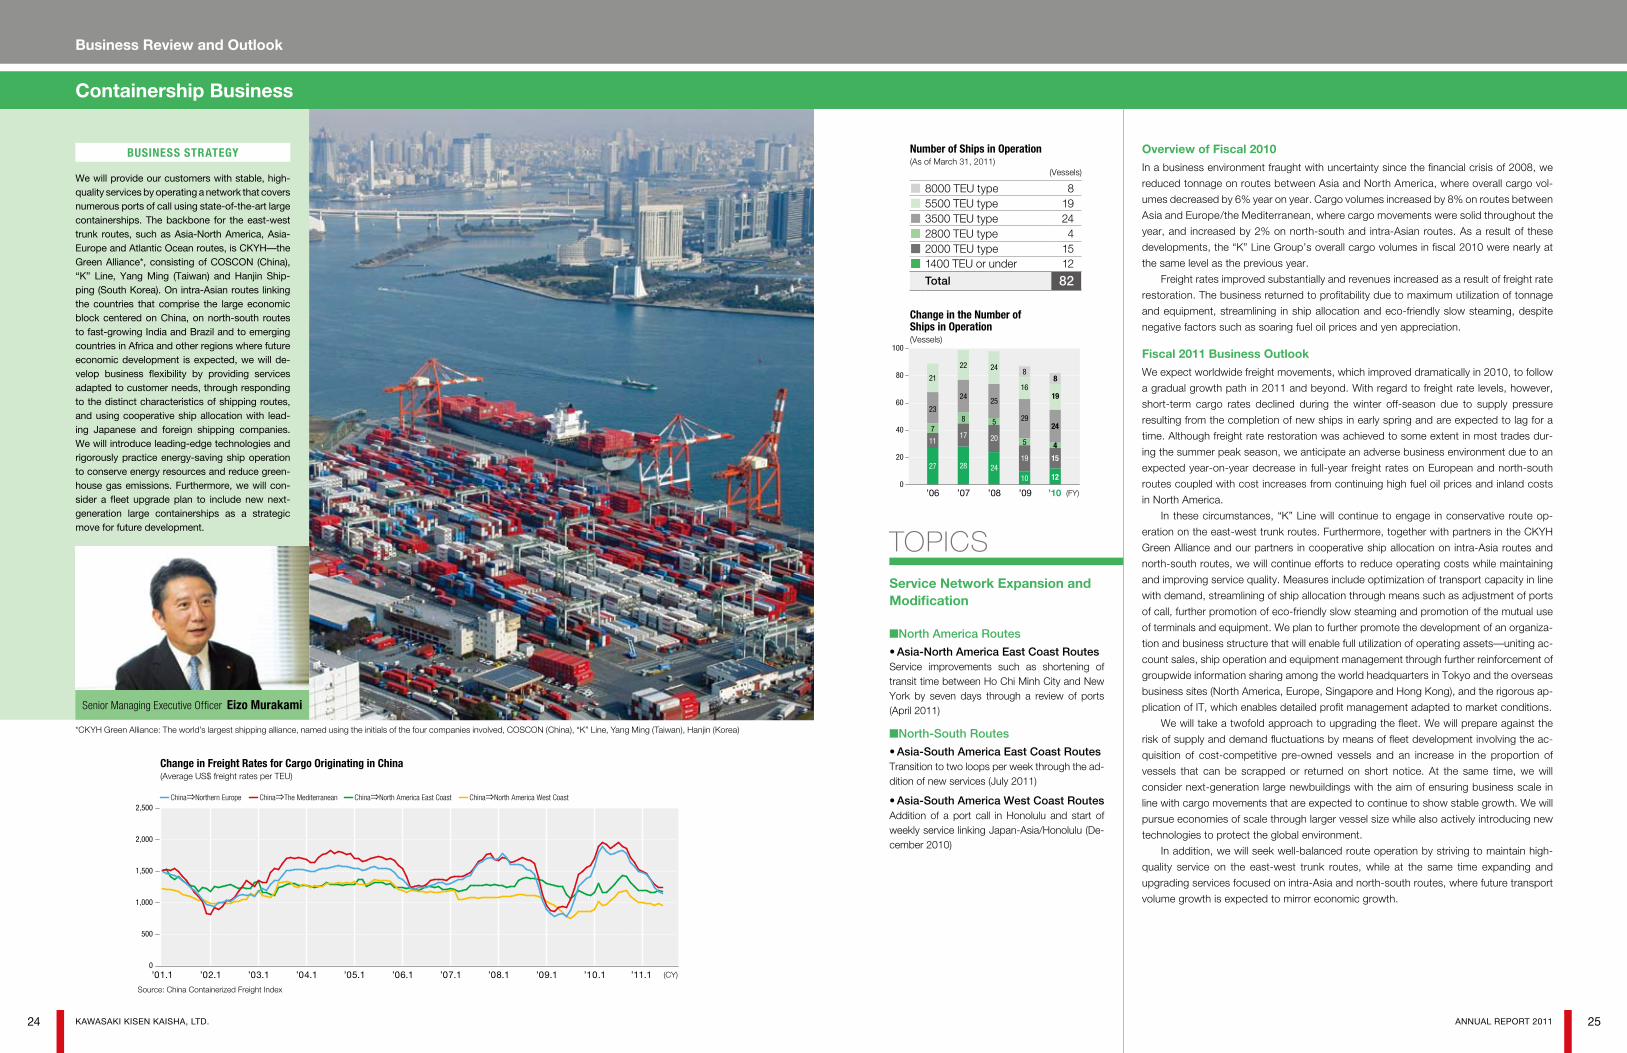
May 2010 marked the completion of construction at the Imabari Shipbuilding Co., Ltd. Marugame Headquarters of MAIZURU BENTEN, an 88,000 ton coal carrier (over-Panamax class) flying the Japanese flag. The vessel is a sister ship to the Corona series of wide-beam, shallow-draft ships independently developed by “K” Line as optimal carriers for electric power companies in Japan. MAIZURU BENTEN will be assigned as a dedi-cated vessel for the transport of imported coal to The Kansai Electric Power Co. Inc.’s Maizuru Power Station.
Overview of Fiscal 2010Although in fiscal 2010 market conditions for dry bulk carrier services didn’t fluctuate wildly,
unlike in the previous year, market conditions for capesize vessels deteriorated from the sec-
ond half onward due to factors including decreases in China’s iron ore import ratio and year-
on-year import volume, as well as higher supply pressure due to the completion of approxi-
mately 200 newbuildings. Market conditions for small and medium-size vessels remained
firm, supported by robust imports of coal and grain by China, India and other countries.
Although we strove for efficient ship allocation and further operating cost reductions, weak
market conditions due to flood damage in eastern Australia in the fourth quarter had a nega-
tive impact on the business, and fiscal 2010 full-year revenues and profits remained at the
prior-year level.
Fiscal 2011 Business OutlookAlthough a large number of newbuildings will be completed in fiscal 2011, cargo movements
are forecast to rise only slightly year on year. Consequentially, we expect an adverse market
environment throughout the year due to a widening gap between supply and demand. As
measured by the overhang of tonnage with respect to cargo movement, short-term mar-
ket conditions have weakened substantially in the first half. On the other hand, we look for
gradual recovery in market conditions in the second half, since transport demand for cargo
bound for China and India is firm, the scrapping of aged carriers, mainly capesize vessels, is
accelerating, and supply and demand adjustment mechanisms are expected to function.
The completion of newbuildings will soon bring the size of the Coal & Iron Ore Carrier
Group’s fleet to 100 capesize vessels. The group will establish a structure to ensure continu-
ation of stable earnings by focusing on business from medium-term and long-term contracts
with domestic and overseas customers. At the same time, the group will secure an appro-
priate free vessel ratio to maximize profits.
For the Bulk Carrier Group, the gap between supply and demand is of limited impact.
The group continues to steadily expand its fleet of small and medium-size vessels, which are
expected to quickly benefit from recovery in market conditions, and aims to double its fleet
size from the current level of approximately 50 ships by the mid-2010s. The group seeks a
balance between medium-term to long-term contracts and short-term contracts that will en-
able earnings maximization during market peaks.
The Thermal Coal, Woodchip and Pulp Group will further solidify its stable earnings
structure by basing its operations on long-term service contracts with electric power com-
panies in Japan while at the same time securing consecutive voyage contracts for dedicated
ships and ships on long-term service contracts on the basis of the safe operation of wide-
beam, shallow-draft Corona vessels, which have achieved market penetration as a high-
quality brand. The group will also proactively respond to increased transport demand for
thermal coal following the earthquake disaster. Furthermore, the group will promote the
superiority of Corona-type vessels to overseas customers in Taiwan and other countries.
With regard to woodchip and pulp transport to domestic customers, while maintaining
stable earnings by holding fleet size at the current level and using dedicated ship contracts,
we will continue to strengthen our close relationships with customers to secure replacement
demand for dedicated ships in the mid-2010s. At the same time, we will utilize free ships to
actively engage in transport between foreign countries with the aim of obtaining orders for
the transport of biomass chips and soybean cake in the Atlantic Ocean area and shipments
bound for China in the Pacific Ocean area.
The “K” Line Group has expanded its stable earnings base in dry bulk carrier services, fo-cusing on the transport of iron ore, thermal coal and other raw materials to Japan. Furthermore, in response to the expansion of resource trans-port attendant on sustained economic growth in China, India and other newly-industrialized coun-tries, we are vigorously implementing a strategy to achieve further growth. under the “K” LINE Vision 100 —New Challenges— medium-term management plan, launched in fiscal 2011, we aim to reach a fleet size of approximately 300 vessels by the mid-2010s. We will increase staff-ing levels in fast-growing China and India and accelerate business development at our busi-ness bases in Europe and Asia. At the same time, we will expand our business globally by putting in place a structure for providing meticu-lous service tailored to customer needs.
BuSiNeSS StRategy
Vice President Executive Officer takashi Saeki
’06 ’07 ’08 ’09 ’100
60,000
40,000
20,000
100,000
80,000
(FY)
92,248
75,84380,965
84,73784,704
Cargo tonnage Carried by Dry Bulk Carriers (In 1,000 kilotons)
Baltic Dry index (Freight rate index for ocean-going bulk carriers, as calculated by the Baltic Exchange in London.) (January 1985=1,000)
0
8,000
6,000
2,000
4,000
12,000
’04 ’05 ’06 ’07 ’08 ’09 ’10 ’11
10,000
(CY)
’06 ’07 ’08 ’09 ’100
200
150
100
50
250
(FY)
62
15
21
35
1115
15
61
42
241215
16
61
35
221517
18
68
44
271216
77
49
20
311316
Change in the Number of Ships in Operation (Vessels)
Number of Ships in Operation (As of March 31, 2011)
(Vessels)
■ Capesize 77■ Over-Panamax 20■ Panamax 49■ Handymax 31■ Small handy 13■ Chips and pulp 16
Total 206
26 KAWASAKI KISEN KAISHA, LTD. 27ANNuAL REpORT 2011
Dry Bulk Business
Business Review and Outlook

TopicsExperimental installation of LED lighting on car carriers
“K” Line has installed LED lighting in the cargo hold and crew quarters of Southern Highway, a car carrier with capacity for 3,900 vehicles, and begun a demonstration experiment. We have confirmed that the LED lights experimentally in-stalled in the cargo hold reduce power consump-tion by approximately 15% compared to conven-tional fluorescent lights, and future energy savings of approximately 30% are expected to result from the development of new LEDs that incorporate a new type of element. LED lighting not only saves energy, but also reduces waste disposal and crew fatigue because they require less frequent replacement than fluorescent lamps.
The “K” Line Group has been a pioneer in the transport of completed cars since the comple-tion of construction of TOYOTA MARu No. 1 in 1968. Our business approach since those early days has been to be a true business partner by identifying the problems our customers face and proposing solutions. We seek to expand and realign our route network and enhance ancillary services in re-sponse to changes in customer needs and the business environment while continuing our con-stant pursuit of safe operation and high-quality transport. In addition, we continuously imple-ment measures to reduce environmental impact. We aim to continue to adhere to these principles and take full advantage of the expertise we have accumulated over the years to return the car car-rier business to a growth trajectory and solidify the position of the “K” Line brand in the market.
BuSiNeSS StRategy
Managing Executive Officer Shigeo itaya
Overview of Fiscal 2010Worldwide automobile sales plunged following the onset of the global financial crisis in 2008 and began to emerge from the slump in fiscal 2009, easing into a gradual recovery path in fiscal 2010. Accompanying this trend, demand for ocean transport of completed cars improved dramatically year on year, resulting in an increase of more than 40% in the “K” Line Group’s full-year transport volume to 3.02 million vehicles. Analysis of reasons for the increase by region indicates shipments to resource-producing countries in South America and Africa showed an especially sharp increase, and the volume of shipments from North America and Europe to the booming market of China increased. On the other hand, cargo movements from Japan were comparatively lackluster due to the impact of yen appreciation and other factors. Although profit and loss was significantly affected by soaring fuel prices, especially from the second half onward, rigorous cost reduction measures, including the streamlining of ship allocation and eco-friendly slow steaming, resulted in a profit for the full year. The “K” Line Group reduced the number of vessels in operation to fewer than 80 at the end of fiscal 2009 in response to lower transport demand, but in the year under review we were able to increase the fleet to approximately 90 vessels to meet increased demand.
Fiscal 2011 Business OutlookAutomakers in Japan incurred extensive damage from the Great East Japan Earthquake in March 2011, sharply reducing demand for the transport of completed cars from Japan in the first quarter of fiscal 2011. In response to this situation, “K” Line implemented ton-nage adjustments that included the removal of four carriers from service. On the other hand, the outlook is for rapid recovery in transport demand from summer onward, and we will respond to the tonnage supply and demand situation by fully utilizing newbuildings scheduled for completion. A steady increase in overall worldwide automobile sales is forecast. We expect trans-port demand for completed cars to simultaneously expand and diversify due to factors including the diversification of production sites by automakers accompanying market expansion in newly industrializing countries—namely China, India and other Asian coun-tries, Russia and Brazil—and higher ocean transport demand for construction, mining and agricultural equipment. In response to this change in ocean transport demand, the “K” Line Group will further strengthen its trunk lines to win orders for cargo from developing regions in addition to cargo from Japan, the core business, and implement service enhancements within de-veloping regions. To accurately identify ever-changing customer needs, we will constantly pursue optimization of ship types and each service networks. Also, we will enhance fleet optimization for the long term and research new ship types with a view to developing a system capable of transporting more than 3.5 million vehicles by the mid-2010s.
’06 ’07 ’08 ’09 ’100
80
60
40
20
120
100
(FY)
86
4
20
23
28
13
30
24
145
14
17
32
25
115
12
22
26
21
10
104
24
21
416
76
Change in the Number of Ships in Operation (Vessels)
Number of Ships in Operation (As of March 31, 2011) (Capacity) (Vessels)
■ 6000 units 28■ 5000 units 23■ 4000 units 20■ 3000 units 4■ 2000 units 8■ 800 units 6
Total 89
0
3.0
2.0
1.0
4.0
(FY)’06 ’07 ’08 ’09 ’10
2.0
3.23.4
3.1 3.0
Completed Built-up Cars transported by Car Carriers (Million units)
Worldwide Freight Movement of Completed Built-up Cars (Excluding European short sea.) (Million units)
0
15.0
10.0
5.0
20.0
’01 ’02 ’03 ’04 ’05 ’06 ’07 ’08 ’09 ’10
14.2
11.0
16.516.9
12.9
10.9
7.67.57.27.7
(CY)
Experimentally installed LED lights
An LED light strip installed in the hold Source: “K” Line estimate based on multiple sources
28 KAWASAKI KISEN KAISHA, LTD. 29ANNuAL REpORT 2011
Car Carrier Business
Reinforce services to Russia
Expand Intra-Asia services
Increase the number ofloaded cars from China,
Thailand and India
Expand services to, within, andfrom the Mercosur region
Reinforce Measures to Create income Opportunities as Marine transport Demand Diversifies
Increase Loading of Construction Equipment, Heavy Vehicles,
Non-Self-Propelled Freight, etc.
upgrade the fleet through measures including research on new vessel types in response to the diversification ofdemand with the aim of creating a transport capacity in excess of 3.5 million units by the mid-2010s
Reinforce Trunk Lines For JapaneseFreight and Emerging Market Freight
(Using the “K” Line-operated terminal in Singapore)
Expand Services in Emerging Market Regions
Business Review and Outlook

Topics
Overview of Fiscal 2010In LNG carrier services, business for vessels under long-term contract developed favorably.
In the second half of the fiscal year, conditions in the spot charter market recovered as well,
and “K” Line carriers in spot service operated under medium-term contracts, contributing
to profit improvement. In the results for oil tanker services, although VLCC (large tankers)
under long-term contract continued to earn stable profits, market conditions for AFRAMAX
(mid-size tankers), oil product carriers and liquefied petroleum gas (LPG) carriers were less
favorable than expected as tonnage supply exceeded transport demand.
Fiscal 2011 Business OutlooksLNGCarrierServices
Stable operation of LNG carriers is forecast amid continuation of contracts from the previ-
ous year for carriers under long-term contract and carriers in spot service. Demand for
natural gas is expected to continue to steadily rise as a result of strong growth in energy
demand in newly-industrialized countries and increased awareness of environmental con-
servation. In this favorable operating environment, LNG transport is a market sector from
which substantial growth can be expected. “K” Line will provide services adapted to diver-
sifying customer needs, work to win orders for new business and expand the fleet.
sOilTankerServices
In the outlook for oil tanker services, since supply pressure from newbuildings remains
high, we expect market conditions to remain unchanged from the previous year due to
slow improvement in the supply and demand balance. We will seek to secure and expand
the stable earnings base for VLCCs by maintaining and extending existing contracts and
obtaining new overseas customers. We will work to improve earnings from AFRAMAX tank-
ers and oil product carriers by engaging in efficient ship allocation based on contracts with
regular customers and devising cost reduction measures.
sDevelopmentofEnergyTransportationServices
The first drillship (offshore resource drilling ship) in which “K” Line will participate was
launched without incident by Samsung Heavy Industries of South Korea in April 2011 and
is scheduled for completion at the end of this year. This ship will be chartered for up to 20
years by Petrobras of Brazil and is expected to earn stable, long-term profits. “K” Line plans
to develop the drillship business by participating in additional new projects.
In addition, in April of this year FLEX LNG, a company in which “K” Line is the largest
shareholder, entered into a basic agreement with InterOil, owner of gas field concessions in
Papua New Guinea, to realize its first floating LNG producer project. The project will involve
liquefaction of natural gas produced in the gas field using a floating LNG producer. The
two companies will finalize a basic design for the LNG producer by the end of this year and
engage in detailed discussions of the project with the aim of commencing operation at the
end of 2014. LNG is a clean energy source for which worldwide demand is expected to
increase, and “K” Line will support new gas field development projects involving the use of
floating LNG producers as a strategic partner of FLEX LNG.
In the energy transportation and tanker busi-ness, “K” Line will strengthen its business base and develop new business sectors on the ba-sis of a growth strategy adapted to structural changes in energy demand worldwide (such as higher demand for liquefied natural gas (LNG), a low environmental impact fuel) and accelera-tion of energy development. We will seek to increase transport demand for existing ves-sels and boost synergy by entering the drillship business, a new business sector, and entering upstream areas of energy development in the floating LNG producer business. In this way, we will aim to provide comprehensive solutions to customer needs by laying a solid service foun-dation in multiple fields to build an energy chain extending from energy resource development to transport. In our traditional business sectors, we will support energy lifelines in Japan, the world’s largest LNG importing country, and ac-tively engage in trilateral transport of resources between countries other than Japan using our LNG carriers and oil tankers.
BuSiNeSS StRategy
Managing Executive Officer Hiromichi aoki
’06 ’07 ’08 ’09 ’100
40
20
60
(FY)
23
6
19
5
22
15
53
23
18
55
25
19
6
5
24
23
6
5
Change in the Number of Ships in Operation (Vessels)
Number of Ships in Operation (As of March 31, 2011)
(Vessels)
■ LNG Carriers 23■ Oil Tankers 19■ Product Tankers 6■ LPG Carriers 5
Total 53
Worldwide Demand for Primary energy (Million ton oil equivalent)
index of VLCC* Freight Rates (VLCCs, Arabian Gulf / Japan in Worldscale)
Source: Prepared based on IEA World Energy Outlook 2010
0
1,600
1,200
400
800
2,000
1980 2000 2008 2020 2035
1,800
200
600
1,000
1,400
(年)
Coal
Average growth rate (2008–2035)
Oil Natural gas Nuclear power Hydropower Biomass Other renewable energy
5,281
5,026
4,039
1,0814391,715468
1.7%
0.8%
1.7%
1.6%1.7%1.3%6.3%
4,307
4,443
3,166
9153641,461239
3,315
4,059
2,596
7122761,22589
2,292
3,655
2,0856762251,03155
1,792
3,107
1,23418614874912
0
200
300
’05.1 ’06.1 ’07.1 ’08.1 ’09.1 ’10.1 ’11.1
100
Source: Clarkson*VLCC: Very Large Crude Carrier; 200,000~300,000 DWT tankers
The first drillship, to be chartered by Petrobras, the Brazilian state-owned oil company, is sched-uled for completion at the end of 2011.
“K” Line supports FLEX LNG Ltd.’s floating LNG producer projects as the company’s largest shareholder and strategic partner.
Involvement in Upstream Energy Development Sectors
Drillships
LNG FPSO Projects
30 KAWASAKI KISEN KAISHA, LTD. 31ANNuAL REpORT 2011
Energy Transportation and Tanker Business
Business Review and Outlook

BuSiNeSS StRategy
“K” Line has made the SAL Group, headquartered in Germany, a wholly owned subsidiary and aims to develop heavy lifter services into a core busi-ness. The SAL Group operates a fleet of 16 heavy lifters with lifting capacity ranging from 600 to 2,000 tons and provides wide-ranging transport services for everything from large cargo to me-dium weight and light weight cargo. It will make full use of state-of-the-art vessels equipped with a dynamic positioning system and actively com-pete for orders involving offshore-related trans-port, which has developed in recent years.
BuSiNeSS StRategy Overview of Fiscal 2010Movements of large cargo plummeted as a result of the impact of worldwide stag-nation in energy and infrastructure project investment following the global financial crisis of 2008. In addition, freight rates were low due to intensification of com-petition for spot medium and lightweight cargo. This resulted in a year-on-year de-cline in revenues and earnings.
Fiscal 2011 Business OutlookAlthough continuing high fuel prices put pressure on profits, cargo movements and freight rates are rising in step with global economic recovery, and in fiscal 2011 we ex-pect full-year profitability for the SAL Group on a non-consolidated basis. From a medium-term perspective as well, we anticipate higher infrastructure-relat-ed cargo movements, centered on the Middle East, and higher movements of offshore oil and gas development facilities and offshore wind power generation equipment. On June 30, 2011 “K” Line made the SAL Group a wholly owned subsidiary. We will work to expand the SAL Group’s customer base and strengthen its financial position while taking advantage of its powerful brand and wealth of experience and knowledge in the heavy lifter industry and to demonstrate synergy with the offshore-related businesses that “K” Line Group operates.
Managing Executive Officer toshiyuki Suzuki
Managing Executive Officer toshiyuki Suzuki
Offshore Support Vessel Business
Heavy Lifter Business
“K” Line will conclude long-term stable contracts with highly-respected customers and build a sta-ble earnings base by deploying a state-of-the-art fleet consisting of a total of seven vessels, com-prising anchor handling tug supply (AHTS) ves-sels with the world’s highest bollard pull capac-ity (390 tons) and platform supply vessels (pSV) having among the world’s largest deck plate surface areas (1,100 m2) to meet needs for ultra-deep and distant water energy development.
Overview of Fiscal 2010The activities of E&P (Exploration & Pro-duction) companies increased from the previous year, and demand for offshore support vessels rose. Nevertheless, since the deployment of newbuildings and other factors led to continued oversupply of ton-nage, market conditions remained at a low level, recovering only slightly from the pre-vious year. Although only one mid-sized PSV operated for the full year, business performance at K LINE OFFSHORE AS (KOAS) remained at the prior-year level due to a market slump in the first half of 2010.
Fiscal 2011 Business OutlookSince crude oil prices are expected to remain high, E&P expenditure from fiscal 2011 to 2012 is forecast to increase by 10% or more year on year, and we expect market condi-tions for offshore support vessels to recover year on year. Six previously ordered newbuildings were completed in June 2011, resulting in a fleet of seven state-of-the-art offshore support vessels. “K” Line aims to establish the “K” Line brand in the offshore support vessel business and to further expand the business to meet needs for ultra-deep and distant water energy development, for which demand is expected to increase apace, by continuing to provide competitive services made possible by this high-specification fleet.
Ferry Services
Liner Services
Specialized Carrier Services
RumoiOtaru Kushiro
MuroranTomakomai
Hachinohe
Niigata
Toyama
Sendai
HitachiHitachinaka
TokyoKawasaki
Yokohama ChibaChita
Kochi
MizushimaTokuyama
Hakata
Aburatsu
Hososhima
MojiKita-Kyushu
Tsukumi Suzaki
Niihama
Nagoya
Osaka
Kobe
Onahama
Akita
See for details.p.38
See for details.p.36
Overview of Fiscal 2010sShortSeaServicesRecovery in market conditions for bulk carriers of coal and other materials at the start of the fiscal year led to an advantageous situation for obtaining annual contracts and earnings improvement, and the transport volume of steel products bound for Southeast Asia increased.
sCoastalServicesThe operating rate for limestone transport to steel and cement com-panies increased, and we secured stable transport volumes for paper material carriers. At the same time, general cargo transport volumes increased as a result of actively working to obtain orders for new cargo for transport by RORO vessels, we maintained the schedule of four sailings per day on the Hachinohe-Tomakomai ferry route, and door-to-door parcel service and livestock product transport volumes developed favorably from the start of the fiscal year. Nevertheless, the Great East Japan Earthquake in March resulted in suspension of operations, and transport volumes until the end of the fiscal year stagnated.
Fiscal 2011 Business OutlooksShortSeaServicesIn tramp services, we will expand the fleet of coal and woodchip carriers and work to enter new markets and develop a stable profit structure. In liner ser-vices, we will seek to obtain stable transport volumes of steel materials and wood products shipped from Japan and appropriate freight rates, actively enter the market for trilateral transport in the Asia region and strive to improve earnings.
sCoastalServices In tramp services, we will vigorously proceed with new customer acquisition while carefully observing market conditions and cargo owner trends from a me-dium- to long-term perspective. In liner services, we diverted cargo to Keihin Port because Hitachi Port and Hitachinaka Port incurred extensive damage in the Great East Japan Earthquake, restoring service to the original route in late May. The earthquake affected ferry transport as well, preventing use of the harbor facilities at Hachinohe Port. Accordingly, we made temporary port calls at Aomori Port before restoring service to the original Hachi-nohe-Tomakomai route in July. We will work to expand vehicle and passenger transport volumes in preparation for the commissioning of a new replacement ferry in April 2012.
In Short Sea Services, we handle coal, wood-chips and other basic industrial materials as well as steel products and wood products, principally in Asian waters. In Coastal Services, we assist with the long-term stable transport of limestone, pulp and other raw materials and also transport fresh foods and other daily commodities familiar to consumers using a network of liner domestic routes. We also link Honshu and central eco-nomic zone in Hokkaido by ferry with the short-est possible routes and pursue maximum con-venience for door-to-door parcel services and passengers. We will continue to provide high-quality service in both service categories.
BuSiNeSS StRategy
Managing Executive Officer toshiyuki Suzuki
32 KAWASAKI KISEN KAISHA, LTD. 33ANNuAL REpORT 2011
Short Sea and Coastal Business
Business Review and Outlook
Kawasaki Kinkai Kisen Kaisha, Ltd.Service Network in Japan

TopicsPT. Kline Mobaru Diamond Indonesia (KMDI) is a member of the business group PT. K Line In-donesia, “K” Line’s subsidiary in Indonesia. The company has developed, jointly with an Indone-sian manufacturer, a three-level motorbike carrier for use in domestic road transport in anticipation of an era of high-volume transport of motorbikes in Asia. The new chassis, which increases load capacity by approximately 30% over previous two-level models, is a world-first groundbreaking transport mode that contributes to logistics cost reduction and CO2 reduction. The company has already obtained patents in Indonesia, Vietnam, Thailand, India and China.
Overview of Fiscal 2010In logistics services as a whole, both revenues and profits increased year on year, sup-ported by profits from the warehouse and port operations. In addition, ocean freight and air freight forwarding volumes steadily increased, supported by semiconductor-related and automotive export cargo from Japan. In the buyers consolidation business, profit-ability improved attendant on gradual business recovery in the United States.
Fiscal 2011 Business OutlookATE, a company headquartered in the U.S. in which “K” Line took an equity stake in January 2010, has already established a solid business base in the U.S. and Asia, including China. The company aims to further develop its business performance by also entering mar-kets in developing countries in Asia and Central and South America. KLL, headquartered in Japan, is building a solid operating base among Japanese customers, focusing on the air freight and ocean freight forwarding business. It will expand and upgrade its network in Asia to cope with further shifting of production lines to Asia by its customers. For instance, it established a subsidiary in Vietnam in May 2011. CDS, headquartered in the U.S., aims to leverage the Visibility Management System (VMS), the “K” Line Group’s logistics man-agement system and a key selling point, to engage in proposal-driven sales that anticipate customer needs and enthusiastically expand the customer base. These three core com-panies in the international logistics business will vigorously work to win orders to meet total logistics demand in the growing Asian market. “K” Line will also undertake expansion of existing businesses, primarily land transport and warehousing, at other Group companies involved in the logistics business in Japan and overseas. We forecast year-on-year increases in revenue and earnings in fiscal 2011.
“K” Line Logistics (KLL), Air Tiger Express (ATE) and Century Distribution Systems (CDS) are the three core companies in our international logistics business and the key to winning orders for logis-tics services in the fast-growing market in Asia. In Southeast Asia and China, we will undertake expansion of locally-based total logistics servic-es, notably vehicle logistics. We will continue to position the logistics business as a growth sec-tor and undertake reinforcement of the business base and expansion of business scale.
BuSiNeSS StRategy
Managing Executive Officer toshiyuki Suzuki
Position in the Worldwide Markets
Container Carriers Ranked by Operating Capacity (As of April 2011) Comparison of Operating Capacity by Alliance (As of April 2011)
Top-five Carriers Ranked by Number of Operating Car Carriers (The number of vessels of over 2,500 units) (As of December 2010)
Top-five Carriers Ranked by Owned Tonnage of Dry Bulkers (As of March 2011)
Number of Managed LNG Carriers (By shipping company) (As of March 2011)
Number of VLCC*1s in Operation (As of January 2011)
Number of Mid-sized Tankers*2 in Operation (As of January 2011)
Source: AXSliner*1 CKYH: COSCON, “K” Line, Yang Ming, Hanjin*2 GA: Grand Alliance Hapag-Lloyd, NYK LINE, OOCL*3 TNWA: The New World Alliance APL, Hyundai, Mitsui O.S.K. Lines
Source: Clarkson Tanker Register*1 VLCC: Very Large Crude Carrier; 200,000~300,000 DWT tankers*2 Tankers ranging from 80,000 to 120,000 DWT
Energy Transportation Carriers and Tankers
Containerships
Dry Bulk and Car Carriers
1717
0 10 20 30 40 50
Stasco (UK)
Mitsui O.S.K. Lines (Japan)
NYK LINE (Japan)
MISC (Malaysia)
“K” Line
Teekay (Canada)
BW Gas (Norway)
Golar (UK)
Pronav (Germany)
Exmar (Belgium)
(Vessel)
(TEU)0 1,000,000 1,500,000500,000 2,500,0002,000,000
Maersk (Denmark)
MSC (Switzerland)
CKYH *1
GA *2
TNWA *3
CMA CGM (France)
Evergreen (Taiwan)
CSAV (Chile)
CSCL (China)
Hamburg-Süd (Germany)
1,716,045
0 500,000 1,000,000 1,500,000 2,500,0002,000,000(TEU)
Maersk (Denmark)MSC (Switzerland)CMA CGM (France)
Hapag-Lloyd (Germany)Evergreen (Taiwan)
APL (Singapore)CSAV (Chile)
COSCON (China)Hanjin (Korea)CSCL (China)
Mitsui O.S.K. Lines (Japan)NYK LINE (Japan)
Hamburg-Süd (Germany)OOCL (Hong Kong)
Yang Ming (Taiwan)“K” Line
ZIM (Israel)Hyundai (Korea)PIL (Singapore)
UASC (6 countries in the Middle East)
328,669 328,669
(1,000 DWT)0 5,000 10,000 15,000 20,000 25,000
COSCO (China)
NYK LINE (Japan)
Mitsui O.S.K. Lines (Japan)
“K” Line
Zodiac Maritime Agy. (Israel)
13,260
Sales among the Top-five Listed Marine Transport Companies (2010)
(Billions of yen)0 500 1,000 1,500 2,000 2,500 3,000 3,500 4,000 4,500 5,000
Maersk (Denmark)
NYK LINE (Japan)
Mitsui O.S.K. Lines (Japan)
COSCO Holdings (China)
“K” Line 985985
(Vessel)0 60 10020 40 80
71
NYK LINE (Japan)
Mitsui O.S.K. Lines (Japan)
“K” Line
EUKOR (Korea)
WWL (Norway/Sweden)
Source: Clarkson Bulkcarrier Register Source: HESNES SHIPPING AG
Researched by “K” Line
Source: Bloomberg
Source: AXSliner
Total543
“K” Line 9
Total884
“K” Line 16
Logistics Business
34 KAWASAKI KISEN KAISHA, LTD. 35ANNuAL REpORT 2011
Business Review and Outlook

Infrastructuredevelopmentprojects,suchastheconstructionofoilrefiningandpetrochemicalplantsandthedevelopmentofrailroadsandtransportationnetworks,areadvancingworldwideinstepwithrecoveryintheglobaleconomy.Inaddition,thetransportofoffshorewindpowergenerationfacilitiesandotheroffshore-relatedfacilitiesisforecasttocontinueamidtheheightenedworldwideawarenessoftheimportanceofenvironmentalpreservationandincreasesincrudeoilprices.Thesecargoesarethetargetforheavyliftervessels.Inanticipationofdevelopmentoftheheavyfacilitiesmarinetransportsector,whichisessentialforenergyresourceandinfrastructuredevelopment,the“K”LineGrouphasmadetheSALGroup(head-quarteredinGermany)awhollyownedsubsidiaryandplanstodeveloptheheavylifterservicesasacorebusiness.
Expansion of the Heavy Lifter Business
The SVENJA and LONE, two heavy lifters owned by the SAL Group equipped with cranes with the world’s highest lifting capac-ity of 2,000 tons, were completed in Decem-ber 2010 and March 2011, respectively. On its maiden voyage, the LONE transported eight large reactors (oil refinery pressure units) from Japan to Trinidad and Tobago in Central America. The heaviest cargo item weighed 1,719 tons, the equivalent of about 110 large buses, and was the largest cargo ever
transported, even for the SAL Group, which has a wealth of expertise and experience in heavy facilities transport. The SVENJA and LONE, two of only four heavy lifters world-wide equipped with the Dynamic Positioning System (DPS), will meet needs for the trans-port of oil and gas development facilities and offshore-related facilities, which require ad-vanced transport techniques.
Completion of Construction of Vessels with the World’s Highest Lift Capacity
Offshore facilities transport Project cargo: An assembled module for an LNG production facility
Project cargo: Wind power generation equipment
Advanced technology is required for the safe transport and handling of cargo of various shapes and sizes. This requires not only high-performance vessels, but also personnel who have mastered specialized, exacting tech-niques in cargo handling. Each day at the SAL head office, top-flight crew members and engineering technicians engage in cooperative research into effective and safe, cargo stowage methods at sea and on land. In addition, for crew education and
training, SAL established a manning company in the Philippines for SAL’s exclusive use and also conducts training for SAL crew members at the “K” Line Group’s crew member train-ing facilities (the “K” Line Maritime Academy). SAL will continue to develop personnel who have mastered advanced techniques in the safe handling of cargo.
Safe Transport Supported by SAL Group Personnel
Computerized planning of the cargo loading and unloading work essential to safe cargo transport
Loading of a large reactor for an oil refinery
Special Feature 1
37ANNuAL REpORT 2011 36 37KAWASAKI KISEN KAISHA, LTD. ANNuAL REpORT 2011
The SAL Group is a specialty heavy lift servic-es company established in 1980 in Germany. SAL owns a fleet of 16 vessels equipped with cranes with lifting capacities ranging from 600 to 2,000 tons to meet demand for the trans-port of wide-ranging cargo and handles its own marketing, ship operation and ship man-agement. The company also meets the high-est environmental standards: for instance, it was the first shipping company offering heavy facilities transport services to obtain health, safety and environment (HSE) qualifications (OHASAS 18001*1 and ISO 14001*2). SAL has business sites in 12 locations around the world and aims to engage in business de-velopment utilizing selling capabilities under-pinned by SAL’s advanced maritime techni-cal capabilities and knowledge and “K” Line’s global network.
The SAL Group’s Global Network
*1 OHASAS 18001 is an international standard for occupational health and safety management systems based on British Standards 8800 that can be used for third-party audits. *2 ISO 14001 is a standard that prescribes environmental management system specifications. It includes matters that must be observed when developing environmental
management systems that comply with ISO standards.
a global Network Spanning 12 Countries Worldwide
“K”Line America
SAL Japan, Ltd.
SAL Heavy Lift Singapore Pte. Ltd.
SAL Heavylift Shipping Consulting (Shanghai)
Co Ltd
“K”Line Philippines
SAL Beijing Representative Office
SAL Heavy Lift France SARL
SAL Finland OY
“K”Line Italy
SAL UK Representative Office
SAL Shipping Australia Pty Ltd
SaL Head Office

s
There are two main types of offshore sup-port vessels: anchor handling tug supply (AHTS) vessels and PSVs. AHTSs engage in support activities when offshore drilling rigs are moved from location to location, such as raising anchors from the seabed, rig towing. AHTS also engages in support activities for seabed pipeline laying works. Two advanced AHTSs were delivered this year and are currently operating in the North Sea. These AHTSs have propeller out-put of 34,000 horsepower and world-class bollard pull power (towing power) of 390 tons. They are equipped with all the latest equipment and systems, including a dynamic positioning system (DPS) for maintaining the vessel in a fixed position using its propulsion system, remotely operated vehicles (ROV) for monitoring undersea work for use in the in-stallation, repair and maintenance of subsea equipment and a 250-ton A-frame for raising and lowering large subsea equipment. After the delivery, the AHTSs have steadily accumulated an operating track record by entering into short-term contracts with cus-tomers including major oil companies. K LINE OFFSHORE AS will utilize these high-speci-fication vessels to provide safe, efficient and environment-friendly high-quality offshore ser-vices in distant and ultra-deep offshore oil and gas field development, an industry expected to continue to develop apace.
In 2007, “K” Line established K LINE OFF-SHORE AS, an offshore support vessel op-erator headquartered in Norway, and placed orders for six high-specification newbuild-ings. In 2008, the new company chartered one platform supply vessel (PSV) and began vessel operation in the North Sea. By June 2011 the company had built a fleet of seven vessels, all of which are now in operation. In June 2010 the company concluded a contract for two PSVs with Petrobras, the Brazilian state-owned energy company. PSVs are “sea trucks” used mainly to trans-port materials and fuel to offshore rigs. The maximum term of the contract is eight years from the autumn of 2010. This deal has occasioned widespread recognition of the
“K” Line Group in the international offshore support vessel market. Furthermore, in February 2011 K LINE OFFSHORE AS entered into a contract for two large PSVs with the UK subsidiary of major US energy company ConocoPhillips. Under the contract, which has a maximum term of three years, the PSVs will supply ma-terials and transport fuel to offshore rigs in the North Sea. The company’s new PSVs are among the world’s largest, with deadweight capacity of 5,100 tons and deck area of 1,100 square meters. This contract indicates recognition in the market of the high-grade specifications of these vessels and the brand power of the “K” Line Group.
The First Long-Term Contract for an Offshore Support Vessel
AHTSs with World-Class Towing Power
Moving Ahead in the Offshore Energy E&P (Exploration and Production) Support Business
ActivityofoffshoreenergyE&Pisincreasinginstepwiththeheighteningofenergyneedsworldwide,andthe“K”LineGroupisactivelyenteringtheoffshoreenergyE&Psupportbusiness.Notably,subsidiarycompanyKLINEOFFSHOREASreceiveddeliveryoffinalNewbuildinginJune2011,andnowoperatessevenadvancedoffshoresupportvesselsoffshoreofBrazilandintheNorthSea,someunderlong-termchartercontractswithhighly-respectedcustomers.Wewillcontinuetocarryonthe“K”LinespiritbyvigorouslyandboldlydoingbusinessintheoffshoreEnergyE&Psupportbusinesssector,agrowthmar-ket,andseektowinnewbusiness.
The KL BREVIKFJORD, an advanced PSV chartered to Petrobras (Brazil)
Satellite positioning system (GPS, etc.)
Hydro-acoustic position reference system (HPR, etc.)
• Tunnel thruster (2)• Azimuth thruster (1)
Communication satellites
Transponders
• Main propellers (2)• Tunnel thruster (1)• Azimuth thruster (1)
Dynamic Positioning System (DPS)
DPS is a system that automatically controls the ship’s position by using seven propulsion units with respect to measured ship’s position by means of position reference systems such as a GPS and HPR.
A satellite positioning system is a system that measures a ship’s position by receiving radio waves from satellites.
A hydro-acoustic position reference system is a system that measures a ship’s position by receiving sound waves from transponders installed on the seabed using a receiver on the ship.
Special Feature 2
38 KAWASAKI KISEN KAISHA, LTD. 39ANNuAL REpORT 2011
As production at existing oil fields approaches its peak, it is inevitable to develop undevel-oped oil and gas fields in ultra-deep waters and remote areas to respond to steady ener-gy demand. Demand for advanced drillships and offshore support vessels used at those areas has rapidly increased. Notably, Brazil has succeeded in resource development in the pre-salt Santos Basin and is actively in-vesting in development. Anticipating this change in the business environment, in the Group’s medium-term management plan that began in fiscal 2008, “K” Line set forth a policy of expanding the scope of energy resource development busi-ness beyond conventional marine transport such as oil and gas tankers by developing new businesses in the upstream sector, such as offshore support vessels, drillships and LNG FPSOs*1. The “K” Line Group will establish a busi-ness model that will make possible participa-tion in wide-ranging transport operations from upstream to downstream in offshore energy resource businesses and development of a stable earnings base by further increasing synergy between energy resource transporta-tion services, heavy lifter vessel services and offshore support vessel services.
Business Development in the Midstream to Upstream Resource Development Sectors
*1 FPSO: Floating Production Storage and Offloading System*2 CNG tanker: compressed natural gas tanker*3 FSRU: Floating Storage and Regasification Unit
Development upstream
Midstream
Downstream
Exploration
The oil and natural gas
development processVessels and facilities used
Drilling equipment
Transport vessels
Receiving facilities
Production facilities
Development and
production
Transport
Refining and sale
tankers (crude oil, products, chemicals)gas tankers (LPg, LNg)
Jack-up rigs
Semi-submersible rigs
Oil FPSOs*1
Semi-submersible rigs
Drillships
LNg FPSOs*1
CNg carriers*2
FSRU*3
Offshore support vessels
Heavy lifter vessels
“K” Line’s business fields

Pirates rampant in the waters off the coast of Somalia, in the Gulf of Aden, and in the Arabian Sea have now expanded their scope to the Indian Ocean, threat-ening the security of shipping routes connecting Asia with the Persian Gulf and Europe. Unlike pirates in the Straits of Malacca and near the coast of West Africa who primarily aim to steal money and goods, these pirates aim to hijack ships and obtain large ransoms by taking crew members hostage; and they use ships they hijacked as mother ships for piracy over a wide area. In response, the Unit-ed Nations Security Council has called for uncompromising action against piracy. The International Maritime Organization has also requested that nations act to eliminate the problem. Based on these resolutions, international naval forces currently provide escorts for ships passing through the area, and aircraft from various countries conduct patrols of the affected area. The international commu-nity is also performing missions to recapture hijacked ships. In addition to receiving escorts by the Japan Maritime Self-Defense Force and international naval forces, we take a variety of measures that give top pri-ority to our crew members’ security. For example, we choose shipping routes that allow us to avoid attacks by heavily armed pirates. We also discourage boarding by pirates by sailing at high speed, using high-pressure water sprin-klers and installing razor wire. Crew members are made to wear bulletproof vests and helmets to protect themselves from gunfire. For low-speed ships and
ships with low decks, which are vulnerable to pirate attack, our precautionary measures include avoiding affected areas and sailing around the Cape of Good Hope at the southern end of Africa.
Efforts for preventing damage from pirate attacks
Initiatives for Safety in Navigation and Cargo Operations
Objective and Mission of Our CSR Activities
Social Responsibility:
We observe laws and regula-tions, respect social precepts,
engage in fair business activities, and strive to ensure safety in
navigation and cargo operations and environmental preservation.
Social Contribution:
We contribute to society through the business activities of our Group and proactively as
a good corporate citizen.
The Corporate Principles of the “K” Line Group say that “The basic principles of the “K” Line Group as a shipping business or-ganization centering on shipping lie in: (a) Diligent efforts for safety in navigation and cargo operations as well as for environ-mental preservation; (b) Sincere response to customer needs by making every possi-ble effort; and (c) Contributing to the world’s economic growth and stability through continual upgrading of service quality. The objective of our CSR activities is to embody these Corporate Principles. We recognize that the concept of CSR comprises two elements: a company’s so-cial responsibility and its social contribu-tion. We base our CSR activities on the policies above.
CSR Activities
Establishing and maintaining safety in navigation and cargo operation, protecting the environ-ment, and maintaining economically efficient operations are essential in operating a shipping business. Safe navigation and cargo operations are, above all, the foundation of our business. For this reason, and to protect the environment and operate efficiently, we are committed to building, executing and maintaining a secure system for safety in navigation and cargo operation.
Safety Management System (SMS)
Emergency Response Drills
To ensure safe navigation of ships, we need to take our own safety measures and provide different training for different kinds of ships, in addition, of course, to meeting requirements of international treaties and the laws and regulations of relevant countries. The SMS summa-rizes the necessary steps to take, based on their common recognition by crew members and ship management companies. An international treaty mandates maintaining of an SMS. Our strict application of the SMS is confirmed through internal safety audits conducted by auditors of ship management companies
and through regular examinations by the classification society that certifies our SMS. We immediately take corrective measures if any matters are pointed out in the audits and examinations. The SMS is also checked at calling ports through Port State Control (PSC)* to ensure its strict application.
* PSC: An inspection of a foreign ship by authorities of the calling port’s country. It aims at confirming there are no problems with the ship concerning safety and compliance, safety of human lives, and environmental preservation.
In November 2011, we conducted an emergency response drill as-suming a scenario in which our VLCC YAMATOGAWA had collided with a ferry in the Uraga Channel at the entrance of Tokyo Bay, result-ing in physical injuries, an oil spill and a vehicle fire on the ferry. In the drill, based on the Emergency Response Manual, we set up an emergency response headquarters and then responded to the accident appropriately by studying measures based on information sent there. We responded to inquiries from outside the company and issued press releases. We also held a simulated press conference,
after which we received comments from insurance companies, law-yers, consulting firms and other experts. An accident like the one in this case study must never take place, but we continue to take steps to prevent ac-cidents and to respond to emergencies based on the recognition that accidents are always a possibility.
Social Contribution Activities
The “K” Line Group operates globally in seeking to achieve mutual benefit with local communities in different countries. We do this through steady accrual of small efforts, including contributions to society with resources as a shipping business, development of the next generation and participation in volunteer activities.
Exchange Meeting with Children
Cooperating in Ocean Transport of Relief Supplies
In December 2010, the “K” Line Maritime Academy Philippines (KLMA Phil) invited 30 children from impoverished homes in Pasay, where the company is located. Staff members of “K” Line Group companies residing in the city, including those of KLMA, met with the children, had lunch together and gave them school bags containing stationery. Children enjoyed singing and dancing and all the participants had a good time together. Through this activity, which was in its third year, KLMA brought smiles to the children’s faces and cheered them up.
“K” LINE SHIPPING (SOUTH AFRICA) PTY LTD. (KLSSA) cooperates with the South African Primary Education Support Initiative (SAPESI), a non-profit organization supporting education of South African children. KLSSA provides free ocean transport and domestic land transport of educational materials for children. The first shipment took place in March 2011, when a “K” Line-operated ship, loaded with 1,000 English books and stationery for children, arrived at the city of Durban.
“K” Line Group’s Support for the Areas Affected by the Great East Japan Earthquake
We provide free transport of relief supplies for the disaster-hit areas, including marine transport of materials for constructing temporary houses, along with everyday commodities for victims. We also support recovery efforts behind the lines. For instance, we cooperate with the Japan Ground Self-Defense Force in transporting troops engaged in relief and recovery activities in the affected areas and the vehicles they use, and we offer our reefer containers for storing food for the troops in their garrisons. The “K” Line Group will continue to proactively take part in relief activ it ies by using our resources as a shipping company so the victims can return to normal lives as soon as possible. “K” Line supports employees who participate in volunteer activities by providing special leave. Volunteers are making use of the special leave system to participate in recovery support activities in areas affected by the Great East Japan Earthquake.
Loaning refrigerated containers to JGSDF Camp Iwate
Pasay children with KLMA staff members
KLSSA staff members (two people on the right) handing over transported cargo to the SAPESI representative
40 KAWASAKI KISEN KAISHA, LTD. 41ANNuAL REpoRT 2011
India
Pakistan
Iraq Iran
Saudi Arabia
Yemen
Djibouti
Oman
Somalia
Ethiopia
Arabian Sea
Area around the Gulf of Aden
Red Sea
Persian Gulf
Indian Ocean
Piracy affected areas
Gulf of Aden

Corporate Governance and Risk Management
Structure of Business Operations
We apply the Executive Officer System, under which we streamline our management through the transfer of authority and prompt deci-sion-making.Board of DirectorsThe Board of Directors meets at least once every month. At the Board, our directors make decisions on basic management policies, matters stipulated by laws and regulations, and other significant man-agement issues. They also supervise the performance of duties by executive officers and our staff members. Of the 13 directors, two are outside directors stipulated by the Companies Act of Japan.Executive Officers’ MeetingThis Meeting is held twice a month, in principle, and is attended by executive officers and auditors. Participants help the president to make decisions through frank discussions, in addition to sharing in-formation and ensuring compliance.
Auditors/Board of AuditorsThree of the five auditors are outside auditors specified in the Compa-nies Act of Japan. The audit policy, audit plans, and other related matters are determined by the Board of Auditors, aiming for a fast, functional auditing process. Among other activities, auditors attend meetings of the Board of Directors and other important meetings and inspect documents showing final decisions, auditing the work of di-rectors as an independent organization. We also appoint dedicated staff to assist auditors.Management ConferenceThe Management Conference holds discussions and exchanges opinions every week, in principle, and is attended mainly by senior managing executive officers and higher-level executive officers. De-pending on the agendum, others may be invited to the Conference.
Risk Management System
We need to recognize diverse management risks, prepare for them, and fulfill our corporate social responsibility when the risks become reality. To this end, we have established our own system for manag-ing crises and risks. Specifically, we have established four commit-tees for responding to four different types of risks: risks in ship opera-
tions, risks of disasters, risks concerning compliance and other risks related to management. We have also set up the Crisis Management committee as an organization to unify the four committees and facili-tate overall risk management.
Response to Large-scale Disasters
We have established BCPs* for two different types of disasters: an in-land earthquake in the Tokyo metropolitan area and a pandemic in-volving a highly virulent new influenza. We give top priority to the lives of people, and aim to continue important operations as an entity that is part of the social infrastructure by transferring operations to our do-mestic and overseas branches and subsidiaries or by shifting to tele-commuting. Also, to avoid the loss of data in a disaster, we have set
up a system in which backup data can be stored remotely. The Great East Japan Earthquake damaged an office belonging to a Group company located at a port in the disaster-hit area. However, our busi-ness continuity was not threatened by the disaster because Tokyo, where our nerve center is located, was not seriously damaged.
* BCP: Business Continuity Plan
Responding to Management Risks
Management risks are not limited to those concerning ship operations, major disasters, or compliance. There are many other risks, including terrorism, threats from anti-social forces, harmful rumors, fluctuations in exchange/interest rates, fluctuations in the fuel oil price and changes to the tax systems or economic policies of major trading partners, in-cluding North America, Europe, China and Japan. The adoption of protectionist trade policies are also among the risks we confront. To deal with the risk of terrorism, we participate in the C-TPAT program, a U.S. Customs' program aimed at preventing terrorism. The measures we take under this program include strict identification of persons who visit ships, the appropriate installation of fences and
lights at self-managed terminals and measures for ensuring informa-tion security. With respect to anti-social forces, we declare in the Charter of Conduct that we will “resolutely confront” such forces. We will deal with specific incidents in cooperation with the relevant authorities and our corporate lawyers. Concerning fluctuations in exchange rates and changes in polic-es, we constantly monitor the trends and hedge against risks appro-priately. If our operations are likely to be affected by the risks, our Management Risk Committee will take preventive action and respond appropriately when an impact actually occurs.
Internal Control System
The Board of Directors, and the executive officers and general man-agers in charge of specific business operations under the supervision of the Board establish the framework of internal controls, evaluate its effectiveness, and ensure that it functions properly. The Internal Audit Office assists directors in performing their duties with respect to the
establishment and maintenance of internal controls by providing feed-back from internal audits and suggesting improvements. Auditors oversee the processes by which directors build an internal control structure and confirm that it is functioning effectively.
Corporate Governance Structure
Appointment/Dismissal
Appointment/Dismissal
Appointment/Dismissal
Auditing
Reporting
Entrusting
Directing
Directing
Consulting
Advising
AdvisingAdvising
Investigation
Order for Investigation
Supervising
Supervising
Supervising
Auditing
Auditing Auditing
Interaction
Directors
Executive Officers and Auditors
Shareholders’ Meeting
Board of Directors
ExecutiveOfficers’ Meeting
CSR & ComplianceDivision
Internal AuditOffice
President & CEO, VP,Senior Managing Executive Officers.Chairperson of the Board
Auditors(Board of Auditors)
AccountingAuditor Management
ConferencePresident & CEO
Crisis Management Committee CSR & Environmental Committee
Lawyers and External ExpertsGroup Com
panies
Executive Officers
GroupManagementConference
ExecutiveOfficers
BusinessSector
Ship Safety Promotion Committee
Disaster Response Committee
Compliance Committee
Management Risk Committee
CSR Sub-Committee
Environmental Sub-Committee
(As of June 1, 2011)
Having served as an outside auditor for “K” Line for two years, I would like to ex-press some thoughts as a participant at board of directors meetings and execu-tive officers meetings during my tenure. Market conditions in the marine transport industry are affected by cycles of growth and stagnation in the global economy and changes in the supply-demand balance for ships, and external factors such as exchange rates and crude oil prices are beyond management control. Given these uncontrollable factors, it is essential that management efficiently seeks equilibrium in day-to-day business management. The board of directors and executive officers meeting seriously grapple with these difficult issues on the basis of free and frank exchanges of opinions. In short, corporate governance is fully functioning and “K” Line’s open manage-ment is visible within and beyond the company. Although routine business execution is considered and realized each fiscal year as an aspect of management planning, at the same time, I believe that management is struggling to develop a strategy that looks ahead five to ten years. This is because even in circumstances of external factors that manage-
ment cannot influence, a paradigm shift that will influence those external factors is already underway. That is to say, developing countries, principally the BRICs, continue to achieve rap-id growth. Europe and the U.S. are expected to show gradual growth. Japan is plagued by a number of issues, including rapid aging of the population as a result of declining birthrate, natural resource crunch and prolonged political stagnation. The nuclear accident in Japan may accelerate change in the global energy situation. These circumstances will create a vortex of change in global logistics, and no matter what direction it takes, the marine transport industry is fated to directly absorb its impact. Although it will be an extremely difficult undertaking, I think that a qualitative transformation to management resistant to the effects of external factors is called for. I envision a stalwart management team that boldly and bravely steers a course into the future for “K” Line as it takes on global business challenges.
outside Auditor’s Message outside Auditor Jiro Noguchi
Risk ManagementCorporate Governance
42 KAWASAKI KISEN KAISHA, LTD. 43ANNuAL REpoRT 2011

BeijingManilaMiddle East (Dubai)
Directors Executive Officers (As of July 1, 2011)
Director, Chairman Hiroyuki MaekawaRepresentative Director, President & CEO Jiro AsakuraRepresentative Director, Vice President Takashi Saeki
Representative Director Eizo Murakami
Representative Director Keisuke Yoshida
Representative Director Takashi Torizumi
Director Masami Sasaki
Director Toshiyuki Suzuki
Director Kenjiro Takenaga
Director Takashi Yamaguchi
Director Yukio Toriyama
Director Takashi Kobayashi*1
Director Mitoji Yabunaka*1
President & CEO Jiro AsakuraVice President Executive Officer Takashi Saeki Assistant to CEO, Drybulk Sector, Energy Transportation Sector
Senior Managing Executive Officer Eizo Murakami Containerships Sector, Port Business, Car Carrier Sector,
Technical, Environment, Marine SectorSenior Managing Executive Officer Keisuke Yoshida IR & PR, Information System, Corporate Planning, Finance
Senior Managing Executive Officer Takashi Torizumi General Affairs, Legal, Human Resources, Accounting,
CSR & Compliance, Internal AuditManaging Executive Officer Mamoru Mori Managing Director of KLINE (CHINA) LTD.
Managing Director of “K” LINE (HONG KONG) LIMITEDManaging Executive Officer Masami Sasaki Marine Sector
Managing Executive Officer Shigeo Itaya Car Carrier Sector
Managing Executive Officer Toshiyuki Suzuki IR & PR, Information System, Corporate Planning,
Group Business Promotion, Logistics, ResearchManaging Executive Officer Hiromichi Aoki Energy Transportation Sector, General Manager of
Energy Transportation Business Development Group
Executive Officer Kazutaka Imaizumi CEO of ‘K’ LINE (INDIA) PRIVATE LIMITED
Executive Officer Kenjiro Takenaga Technical, Environment
Executive Officer Yoshiyuki Aoki Car Carrier Sector
Executive Officer Takashi Yamaguchi General Affairs, Legal, Human Resources, CSR & Compliance
Executive Officer Eiji Kadono Marine Sector
Executive Officer Atsuo Asano Coal and Iron Ore Carrier Business, Drybulk Planning, General Manager of Coal and Iron Ore Carrier Group
Executive Officer Mitsuru Kochi President of “K” Line (Japan) Ltd.
Executive Officer Yukio Toriyama Accounting, General Manager of Accounting Group
Executive Officer Kenji Sakamoto Bulk Carrier Business, General Manager of Bulk Carrier Group
Executive Officer Kazuhiko Harigai Thermal Coal, Woodchip and Pulp Carrier Business, General Manager of Thermal Coal, Woodchip and Pulp Group
Executive Officer Yukikazu Myochin Containerships Business, Port Business
Executive Officer Kazuhiro Matsukawa President of “K” LINE AMERICA, INC.
Auditors
Auditor Tetsuo Shiota
Auditor Fumio Watanabe*2
Auditor Norio Tsutsumi
Auditor Haruo Shigeta*2
Auditor Jiro Noguchi*2
Vice President Executive OfficerTakashi Saeki*
Director, ChairmanHiroyuki Maekawa
President & CEOJiro Asakura*
Senior Managing Executive OfficerEizo Murakami*
Senior Managing Executive Officer
Keisuke Yoshida*
Senior Managing Executive Officer
Takashi Torizumi*
Shareholders’ Meeting
Board of Directors
President & CEO
President & CEO, VP, Senior Managing Executive Officers.Chairperson of the Board
Executive Officers and Auditors
Managem
ent Conference
Executive Officers’ M
eeting
Board of Auditors
Internal Audit Office
General Affairs Group
Legal Group
Human Resources Group
IR & PR Group
Information System Group
Corporate Planning Group
Finance Group
Accounting Group
Group Business Promotion Division
Port Business Group
Containerships Strategic Group
Containerships Business Management Group
Container Transport Management Group
Coal & Iron Ore Carrier Group
Thermal Coal, Woodchip and Pulp Group
Bulk Carrier Group
Assistant to Managing Executive Officer for Car Carrier Business Group
Car Carrier Planning & Development Group
Car Carrier Business Group
Energy Transportation BusinessDevelopment Group
LNG Group
Tanker Group
Marine Human Resources Group
Environment Management Division
Registered Head Office
Marine Safety Administration Group
Kobe General Affairs Group
“K” Line Training Center
Nagoya Branch
Ship Management Group
Kansai Branch
Technical Group
Overseas Representative Office
Environmental Sub-Committee
Ship Safety Promotion Sub-Committee
CSR Sub-Committee
LNG/Tanker Sub-Committee
Fuel Management Committee
Real Estate Management Committee
Proposition Committee
Health Enhancement Committee
(As of July 1, 2011)
Directors, Auditors and Executive Officers Organization
* Representative Director
*1 Outside Director *2 Outside Auditor
44 KAWASAKI KISEN KAISHA, LTD. 45ANNuAL REpoRT 2011
Ship Management Committee
Investment Committee
CSR & Environmental Committee
Crisis Management Committee
Ship Safety Promotion Committee
Disaster Response Committee
Compliance Committee
Management Risk Committee

DOMESTIC Company Name Ownership (%)*Paid-in Capital
(millions)Revenue
(millions)
Marine Transportation Kawasaki Kinkai Kisen Kaisha, Ltd. 50.7 2,369 38,684 Asahi Kisen Kaisha, Ltd. 100.0 100 438 Kobe pier Co., Ltd. 100.0 100 65
H Shibaura Kaiun Co., Ltd. 100.0 20 458 Shipping Agency “K” Line (Japan) Ltd. 100.0 150 2,419
H Shimizu Kawasaki Transportation Co., Ltd. 50.0 10 250 Ship Management “K” Line Ship Management Co., Ltd. 100.0 75 10,849
Taiyo Nippon Kisen Co., Ltd. 100.0 400 21,180 Escobal Japan Ltd. 100.0 10 489
Harbor Transportation/ Daito Corporation 100.0 843 23,301 Warehousing Nitto Total Logistics Ltd. 100.0 1,596 13,327
Hokkai Transportation Co., Ltd. 80.1 60 10,366 Seagate Corporation 100.0 270 7,623 Nitto Tugboat Co., Ltd. 100.0 150 3,921 Tokyo Kokusai Koun Kaisha, Ltd. 70.0 75 1,923
H Rinko Corporation 24.2 1,950 12,020 H Kokusai Logistics Co., Ltd. 83.3 100 1,103
Logistics “K” Line Logistics, Ltd. 91.9 600 17,498 Land Transportation Japan Express Transportation Co., Ltd. 100.0 100 4,796
Shinto Rikuun Kaisha, Ltd. 100.0 30 1,084 Maizuru Kousoku Yusou Co., Ltd. 100.0 25 795
Container Repairing Intermodal Engineering Co., Ltd. 100.0 40 871 Travel Business “K” Line Travel, Ltd. 100.0 100 7,443 Other Business “K” Line Engineering Co., Ltd. 100.0 50 2,009
Shinki Corporation 100.0 80 1,971 “K” Line Systems, Ltd. 100.0 40 1,281 KMDS Co., Ltd. 100.0 40 1,476 Kawaki Kosan Kaisha, Ltd. 100.0 30 743 Crown Enterprise Co., Ltd. 100.0 10 350 “K” Line Accounting and Finance Co., Ltd. 100.0 100 196
OVERSEAS Company Name Ownership (%)*Paid-in Capital
(millions)Revenue
(millions)
“K” Line Maritime (M) Sdn Bhd 57.5 MYR0.3 MYR13.3K Line Mexico SA de CV 100.0 uS$0.005 uS$0.29“K” Line (Nederland) B.V. 100.0 EuR0.1 EuR4.0K Line (Norway) AS 100.0 NoK0.1 NoK1.8“K” Line (portugal)-Agentes de Navagação, S.A. 51.0 EuR0.2 EuR2.0“K” Line (Scandinavia) Holding A/S 51.0 DKK1 DKK14.6“K” Line Shipping (South Africa) pty Ltd 51.0 ZAR0.0001 ZAR74.2“K” Line (Singapore) pte Ltd 95.0 S$1.5 S$15.6K Line (Sweden) AB 100.0 SEK0.1 SEK20.2“K” Line (Taiwan) Ltd. 60.0 NT$60 NT$332K Line (Thailand) Ltd. 34.0 BAT30 BAT1,837“K” Line (Vietnam) Limited 51.0 VND8,055 VND81,610pT. K Line Indonesia 95.0 Rp463.6 Rp55,698.3
Terminal Operator International Transportation Service, Inc. 100.0 uS$20 uS$173H Husky Terminal & Stevedoring, Inc. 50.0 uS$0.1 uS$49
Freight Consolidation Century Distribution Systems, Inc. 100.0 uS$2.3 uS$9Century Distribution Systems (Europe) B.V. 100.0 EuR0.02 EuR0.9Century Distribution Systems (Hong Kong) Limited 100.0 HK$0.08 HK$74Century Distribution Systems (Shenzhen) Limited 100.0 RMB6.5 RMB116Century Distribution Systems (International) Limited 100.0 HK$1.8 HK$75Century Distribution Systems (Shipping) Limited 100.0 HK$0.000001 (R2)
Warehousing universal Logistics System, Inc. 100.0 uS$12.3 uS$0.7universal Warehouse Co. 100.0 uS$0.05 uS$4.3universal Warehouse Co. (NW) 100.0 uS$0.0001 uS$0.5
Logistics “K” Line Logistics (Hong Kong) Ltd. 100.0 HK$8 HK$192“K” Line Logistics (u.K.) Ltd. 100.0 £0.2 £4“K” Line Logistics (u.S.A.) Inc. 100.0 uS$0.5 uS$35“K” Line Logistics (Singapore) pte. Ltd. 100.0 S$1.15 S$15K Line Logistics (Thailand) Ltd. 86.4 BAT20 BAT382K Line Logistics (South East Asia) Ltd. 95.0 BAT73 BAT0
Land Transportation James Kemball Limited 100.0 £0.01 £14uLS Express, Inc. 100.0 uS$0.05 uS$5
Container Repairing H Multimodal Engineering Corporation 100.0 uS$0.15 uS$9Financing “K” Line New York, Inc. 100.0 uS$17.1 uS$29Holding Company Kawasaki (Australia) pty. Ltd. 100.0 A$4.8 A$1.5
“K” Line Holding (Europe) Limited 100.0 £20 £0“K” Line Heavy Lift (uK) Limited 100.0 EuR22 EuR-7.910
Other Business Connaught Freight Forwarders Limited 100.0 HK$0.01 HK$0.07Cygnus Insurance Company Limited 100.0 uS$3 uS$3“K” Line TRS S.A. 100.0 uS$0.006 uS$0.0Marinus Consulting, Inc. 100.0 uS$0.5 uS$0
H “K” Line Auto Logistics pty Ltd. 50.0 A$27 A$0.02
OVERSEAS Company Name Ownership (%)*Paid-in Capital
(millions)Revenue
(millions)
Marine Transportation “K” Line pte Ltd 100.0 uS$1.1 uS$428“K” Line Bulk Shipping (uK) Limited 100.0 uS$34 uS$285“K” Line European Sea Highway Services GmbH 100.0 EuR5 EuR85.1“K” Line LNG Shipping (uK) Limited 100.0 uS$6 uS$59
H Northern LNG Transport Co.,ⅠLtd. 49.0 uS$40 uS$16H Northern LNG Transport Co.,ⅡLtd. 36.0 uS$42 uS$17
SAL Schiffahrtskontor Altes Land GmbH & Co.KG 50.0 EuR0.2 EuR138 (R1)
K Line offshore AS 95.3 NoK460.6 NoK29.8Shipping Agency “K” Line America, Inc. 100.0 uS$15.5 uS$75
“K” Line (Australia) pty Limited 100.0 A$0.0001 A$13.6“K” Line (Belgium) 51.0 EuR0.06 EuR3.1“K” Line Canada Ltd. 100.0 uS$0.09 uS$1.50K Line (China) Ltd. 100.0 uS$2 uS$26“K” Line (Deutschland) GmbH 100.0 EuR0.2 EuR7.5“K” Line (Europe) Limited 100.0 £0.01 £16“K” Line (Finland) oY 51.0 EuR0.01 EuR1.3“K” Line (France) SAS 100.0 EuR0.5 EuR3.3“K” Line (Hong Kong) Limited 100.0 HK$15 HK$247“K” Line (Korea) Ltd. 100.0 WoN400 WoN8,846
H Subsidiaries and Affiliates Accounted for the Equity Method* Includes Holdings of Subsidiaries
¥: Japanese yen£: pounds sterlingA$: Australian dollarsRMB: Chinese renminbi
BAT: Thai bahtRp: Indonesian rupiahS$: Singapore dollarsEuR: Euro
HK$: Hong Kong dollarsMYR: Malaysian ringgituS$: united States dollarsNT$: New Taiwan dollars
WoN: Korean wonC$: Canadian dollarsMXN: Mexican pesoDKK: Danish krone
NoK: Norwegian kroneSEK: Swedish kroneVND: Vietnamese dongZAR: South African rand
Major Subsidiaries and Affiliates
(As of March 31, 2011)
(R1) Operating revenues of SAL Schiffahrtskontor Altes Land (GmbH & Co.KG) for Fiscal 2010 are aggregated with those of 14 SAL group Heavy Lifter owning companies in which “K” Line has 50% of shares each as of March 31, 2011 (as per our consolidated accounts).
(R2) Operating revenues of Century Distribution Systems (Shipping) Limited for Fiscal 2010 are aggregated with those of its parent company, Century Distribution Systems (International) Limited.
46 KAWASAKI KISEN KAISHA, LTD. 47ANNuAL REpoRT 2011
D
C E
B
A
F
Memphis
Dallas
HefeiHangzhou
Zheng Zhou
Wuhan
ChongqingChengdu
Guangzhou
Shenzhen
Hong Kong
Dhaka
Ho-ChiMinh City
Antwerp
Bangkok Hanoi
Singapore
Jakarta
Sydney
Brisbane
Adelaide
Melbourne
Fremantle
Manila
Le Havre
★
Dubai
Dakar KamsarBissau
Conakry
Nouadhibou
Mohammedia
Nouakchott
Casablanca
Algiers
Bethioua
Tunis
Algeciras
Sagunto
Setubal
LisbonMadrid
Leixoes
SantanderVigo
Valencia
Barcelona Malta/Valletta
NaplesCagliari
Salerno
Gioia Tauro
Istanbul
Izmir
Aliaga
Thessaloniki
Piraeus
Milazzo
Taranto
Tripoli
Benghazi
MisrataZareis
Abuzenima
Port Sudan
Bashayer
Ashdod
YanbuAqaba
AshkelonSokhna
Ain Sukhna
RabighJiddah
Ras Isa
HodeidahAden
Tartous Mersin
AlexandriaDamietta
Idku
Port Said
LimassolLarnaca Beirut
HaifaHadera
Bilbao
Tarragona
Hanko
Oslo
Wallhamn
Malmö
Gothenburg
Halmstad
Banjul
Freetown
MonroviaDouala
Qua Iboe
Bonny IslandPort Harcourt
CotonouLagos
Lome
Abidjan
Tema
LibrevillePointe Noire
KizombaMatadi
Boma
Luanda
Walvis Bay
Saldanha Bay
Cape Town
Maputo
Pointe de Galets
Port Louis
Karachi Port Qasim
Mundra
DahejPipavav
Mumbai
Delhi
Nhava Sheva
GoaNew Mangalore
Chennai
Calcutta
Tuticorin
Vishakhapatnam
Colombo
Richards Bay
DurbanEast London
Port Elizabeth
Darsalaam
Mombasa
Vostochny
Cape Flattery
WeipaGoveDarwin Bayu Undan
Broome
Port Hedland
Dampier
Wooly Butt
Port Walcott
Legendre
WandooVaranus Island
Griffin Venture
Cossack PioneerBarrow Island
Van GoghEnfield
GeelongWestern Port
Withnell BayGeraldton
Cape Cuvier
KwinanaBunbury Esperance
AlbanyBurnie
Launceston
Hobart
Abbot Point
HaypointDalrymple Bay
Townsville
Gladstone
Newcastle
Botany Bay
Eden
Napapa
Tangguh
Noumea
Port Kembla
FelixstoweSeoul
Qingdao
Prigorodnoye
FosLivorno
CivitavecchiaLa Spezia
Shah Alam
HamburgBremen
Genoa
Hamina
Paldiski
GdanskStockholm
St. Petersburg
Gijon
Novorossiysk
KoperTrieste
Venice
Unsikaupunki
Melkøya
Sodertalje
Savona
Reykjavik
Sikka
Ilichevsk
Odessa
VarnaConstantzaLondon
Dalian
Nanjing
NingboSuzhou
Shanghai
Tianjin
Haiphong
Port Campha
Xiamen
KeelungFuzhou
Taipei
Helsinki
Beijing
Changchun
Head office
Rotterdam
Vienna
BremerhavenCopenhagen
Arendal
StavangenBergen
Prague
Drammen
Johannesburg
Seattle
San Francisco
Lakewood
Toronto
ChicagoMinneapolis
St. Louis
Cleveland
Columbus
Sao PauloRio de Janeiro
Lima
Santiago
Ponta da Maderia
Vila Do Conde
Manaus
San Vicente
San Antonio
Valparaiso
VancouverPrince Rupert
New WestminsterRoberts Bank
Kenai
PortlandCoos Bay
Benicia
Sacramento
Port Hueneme
Honolulu
San Diego
Costa AzulEnsenada
Cedros Island
Manzanillo
TopolobampoMazatlan Altamira
VeracruzuAcapulco
Lazano Caldenas
RichmondStockton
HalifaxCanaport
Seven Islands
Boston
Philadelphia
Montreal
Vitoria
Tubarao
Itaguai
Praia Mole
Rio GrandeMontevideo
Buenos AiresZarateCampana
Matarani
Esmeraldas
Guayaquil
Callao
Arica
IquiqueMejillones
Antofagasta
GuibaSantos
Taharoa
TniNapier
Lyttelton
Whangarei
Macae
Belem
FortalezaSuape
Ponta Do Ubu
Salvador/Miguel de Oliveira
Huasco
LirquenBahia Blanca
Guayacan
Manta
Buenaventura
Paranagua
Sao Francisco do Sul NavegantesItajai
Mexico City
Tacoma
Oakland
Atlanta
Detroit
Houston
Los Angeles
Long Beach Richmond
Charlotte
Norfolk
Charleston
Gdynia
Kumport
Yantian
New York/New JerseyBaltimore
New Orleans
Gibraltar
DerinceGemlik
FD E
KakogawaMizushima
Himeji/Hirohata
TachibanaKomatsujima
Iyomishima
SakaideFukuyama
NoshiroAkita
Sakata
Niigata-Higashi
NiigataToyama
Nanao
Ishinomaki
SoumaHaramachi
KashimaKimitsuChiba
Futtu
Tokyo
Tsuruga
Tonda
Maizuru
Misumi
KawasakiYokohama
TagonouraShimizu
OmaezakiToyohashi/Tahara
AtsumiKinuura
Nagoya
YokkaichiOwase
Osaka
Kawagoe
Chita
WakayamaSakai-Senboku
TakeharaSakaiminato
Shibushi
TsukumiHososhima
Aburatsu
OitaKanda
SendaiReihoku
Matsushima
MatsuuraHakata
Hibikinada
MojiNakanoseki
TokuyamaUbeYanaiIwakuni
HiroshimaKure
Tomakomai
KushiroMuroran
Nakagusuku
Sendai
OfunatoKamaishi
OnahamaHitachi
Hitachinaka
Kiire
Kikuma
Senipah
Surabaya
BalonganJakarta
Semarang
Tuban
Balikpapan
Tanjung Bara
SantanBontang
VillanuevaIligan
CebuSriracha
PenangKrabi
Surat ThaniDulang
MalongBelida
Kota Kinabalu
SandakanTawau
Muara
BintuluMiri
Labuan
Seria
Kuching
Blang Lancang
Port Kelang
Karimun
Dumai
Tanjong PelapasWiduri
Cinta
Cigading
Vung Tau
North Plau LautBanjarmasin
Manila
Batangas/Banan
Bangkok
Bunga KekwaLaem Chabang
Ho Chi Minh City
Danang
Belanak
SnTuDenRang Dong
Van Phong Bay
Kuantan
Tanjung Sulong (Kemaman)
Pasir GudangSingapore
Cartagena
Manzanillo
Puerto CabelloLa Guaira
GuantaPuerto Sucre
Point Fortin
Port of SpainSt. George’s
Bridgetown
CastriesSt. John’s
RoseauPointe-a-Pitre
BasseterrePhilipsburg
Frederiksted
San Juan
Fort de France
KingstownBonaire
CuracaoAruba
Balboa
Caldera
Santo Tomas de Castilla
Puerto Cortes
CristobalPuerto Limon
CorintoSan LorenzoAcajutla
Puerto Quetzal
Kingston
Port-au-Prince
Santo Domingo
Nassau
Hamilton
Freeport
Port EvergladesMiami
New OrleansLoop
Veracruz
Houston
Galveston
Freeport
Altamira
Lake CharlesSabine Pass Mobile
Jacksonville
BrunswickSavannah
WilmingtonMorehead City
Charleston
Elba IslandPortsmouth
BaltimoreWilmington
Cove Point
Sparrows Point
NorfolkNew York/Newark
BostonDavisville
Niihama
Tobata
Punta Arenas
Kobe
Higashiharima
Gamagori
A B C
Mina Jabel Ali
Fujairah
Sohar
Bandar Abbas
Sharjah
Zirku Island
Halul Island
Das Island
Kuwait
Khor Fakkan
Kharg IslandMina al AhmadiShuaiba
Mina Abdulla Ras al Khafji
JubailJuaymah
Ras TanuraDammam
Sitra
BahrainAl Shaheen
Ras LaffanDoha
MesaieedJebel Dhanna
Ruwais
Sirri Islands
Abu Dhabi
Mina al Fahal
Ras AL Khaimah
P.S. Qaboos
Al Basrah
Bandar Imam KhomeiniUmm Qasr
Assaluyeh
Emden
Copenhagen
FredericiaAarhus
Dublin
Immingham
Felixstowe
GrimsbySheerness
Shell Haven
Isle of Grain
SouthamptonPort Talbot
Fawley
Bristol
Milford Haven
Cherbourg
DunkirkLe Harve
Ghent
Antwerp
FlushingRotterdam
Montoir
Aberdeen
Zeebrugge
Ijmuiden
CuxhaverBremerhaven
HamburgCork
Teesport
Redcar ThamesportHunterston
NantongBaoshan
Shanghai
YantaiQingdao
Xingang
Mailiao
Lianyungang
Rizhao
DalianQinhuangdao
MajishanNingbo
Kaohsiung
Chiwan
Nansha
Xinsha/Huangpu
Da chan BayWenchang
Taichung
KeelungTaipei
Yung Ann
Shenshen
Hong Kong
HuizhouYantian
Shekou
Ulsan
Inchon
PyongtaekKunsan
Gwangyong
Yosu
Busan
Kwangyang
Daesan Pohang
Caojing
Xiamen
Masan
Southwold
“K” Line Overseas Major Affiliates and Representative Offices
Ports of Call (Including Ports for DST & Feeder Services)
“K” Line’s World Headquarters
Global Service Network
48 KAWASAKI KISEN KAISHA, LTD. 49ANNuAL REpoRT 2011

1919• Established as Kawasaki Kisen Kaisha, Ltd.
1941• At the start of World War ll, owned 36 ships, 260,108
deadweight tons.
1945• At the end of World War ll, owned 12 ships, 31,111
deadweight tons.
1948• The rebuilding of the compa-
ny fleet began with the re-floatation of the KIYOKAWA MARU, sunk during the war.
1951• The Japan / Bangkok liner route was established as
the first step toward resumption of service. Other principal liner routes were reopened or established later.
1957• Work on developing an oil tanker fleet was begun
with the building of the FUJIKAWA MARU.
1960• Work on developing a specialized carrier fleet was
begun with the building of the ore carrier FUKUKA-WA MARU.
1964• Merged with Iino Kisen Kaisha to become the core
company of the Kawasaki Kisen group, capitalized at 9 billion yen.
1968• “K” Line’s 1st full container-
ship GOLDEN GATE BRIDGE put into the Japan / California service route.
• Started the Japan-Far East / Europe liner route with Mae-rsk Lines of Denmark.
• Work on developing a specialized car carrier fleet was begun with the car / bulk carrier TOYOTA MARU NO. 1.
1969• Containership Service began on Japan / East Aus-
tralia route.
1970• Service with containerships began on Japan / Pacific
Northwest Coast routes.• Completion of Japan’s first PCC (Pure Car Carrier)
TOYOTA MARU NO.10.
1971• International Transportation Service, Inc. was estab-
lished as the company’s overseas container terminal in Long Beach, California.
1972• Service with containerships began on the Japan-Far
East / New York route.
1974• Joined the Far Eastern Freight Conference.
1975• The ACE Group established as a consortium for the
joint operation of containerships on the Japan-Far East / Europe route.
1983• Completion of first Japanese flag LNG carrier BISHU
MARU. Managed by “K” Line.
1986• The first Japanese shipping company to begin oper-
ation of an exclusive Double-stack Train (DST) in North America.
1989• Reorganized the ACE Group on the European route,
and switched to a consortium with two overseas shipping companies.
1994• Newly-built wide-beam / shallow-draft coal carrier
CORONA ACE put into service.
1995• Listing of Kawasaki Kinkai Kisen Kaisha, a subsid-
iary, on the Tokyo Stock Exchange.
1996• Joint ship assignment with Yang Ming Line of Taiwan
started on the Japan-Far East / North America and Japan-Far East / Europe routes.
1999• Car Carrier Department and KMDS Co., Ltd’s Tokyo
Documentation Center received ISO9002.
2000• Taiyo Kaiun Kabushiki Kaisha merged with Kobe
Nippon Kisen Kaisha, Ltd. Taiyo Nippon Kisen Co., Ltd. was founded. Reformation of our subsidiary companies for ship management and administration completed.
2001• Established “K” Line Group’s Environmental Charter.• “K” Line Pte Ltd, started their business as a shipping
company in Singapore.• “K” Line, COSCON, Yang Ming and Hanjin (Senator)
agreed to establish CKYH alliance.
2002• Acquisition ISO 14001 in recognition of Environmen-
tal Management System from Nippon Kaiji Kyokai (NK).
• Founded a new company “K” Line Total Logistics, LLC (KLTL) to promote “K” Line group companies logistics capabilities.
• Established “K” Line (Japan) Ltd. for strengthening container sales activities in Japan.
2003• Started our own short sea car carrier services in Eu-
rope by establishment of “K” Line European Sea Highway Services GmbH (KESS)
• Founded a new company named Oriental Sea High-way Services Co., Ltd. in China
2004• Decided to place new orders
for two 38,000 m3 fully refrig-erated Ammonia/LPG carriers under a long-term time char-ter agreement with Yara, as our first contracts for this type of Gas carrier.
2005• Concluded 20-year time charter agreement for three
new LNG carriers for Tangguh LNG Project.• KYH (“K” Line, Yang Ming, Hanjin) & PSA HNN set
up a joint venture company, Antwerp International Terminal NV, to operate a container Terminal. The opening was in January 2006.
• Concluded a time charter contract with Exxon Mobil, the world biggest oil major, for a VLCC.
2006• Delivery of a brand new 140,000 cbm type LNG car-
rier ARCTIC DISCOVERER for the Snohvit Project• Established “K” Line Logistics, Ltd. by merger of “K”
Line Air Service, Ltd. and “K” Logistics, Ltd.
2007• Started a new joint venture with SAL for heavy lifter
service.• Established “K” Line Maritime Academy (India) to
foster marine technical personnel.• Established K Line Off Shore AS with C.H. Sorensen
Management AS (CHSM) in Norway to invest in Busi-ness of Offshore Support Vessels.
2008• Established “K” Line Maritime Academy (Philippines).• Giant en bloc deal for consecutive voyage charter
with 10 vessels signed with JSW Group in India.• First “Unimax Ore”-300,000
D W T t y p e o r e c a r r i e r GRANDE PROGRESSO de-livered.
• Invested in FLEX LNG., which was promoting offshore LNG production.
2009• Together with PSA Corporation and NYK Line, “K”
Line established Asia Automobile Terminal (Singa-pore) Private Limited for terminal operation exclu-sively for car carriers.
• “K” Line and five other companies participated in an ultra-deepwater drillship project led by Petroleo Brasileiro S.A (“Petrobras”) of Brazil.
2010• ¥38.3 billion raised through a public offering and the
issuance of new shares through third-party allot-ment.
• Invested capital in US Logistics Provider, Air Tiger Express Companies Inc.
• Completion of construction of the KL BREVIKFJORD, the first large platform supply vessel owned and op-erated by K LINE OFFSHORE AS and the first off-shore support vessel built by the “K” Line Group.
2011• The SAL Group, a heavy lifter services specialist, be-
comes a wholly owned subsidiary.
Corporate History
2011 2010
Owned Chartered Total Total
Type of Vessel No. DWT (MT) No. DWT (MT) No. DWT (MT) No. DWT (MT)
Containerships 8 413,335 74 3,770,570 82 4,183,905 87 4,375,597
Dry Bulk Carriers 58 6,988,471 148 15,484,597 206 22,473,068 185 19,955,593
Car Carriers 31 439,283 58 830,599 89 1,269,882 78 1,101,115
Energy Transport Carriers*1 33 3,449,309 22 2,894,667 55 6,343,976 59 6,820,144
Heavy Lifter Vessels 15 153,488 0 0 15 153,488 14 140,988
Others 26 235,480 26 247,155 52 482,635 53 482,410
Total 171 11,679,366 328 23,227,588 499 34,906,954 476 32,875,847
“K” Line Group Composition of Fleet (As of March 31, 2011)
Note: The number of owned vessels includes co-owned vessels, and deadweight tonnage includes the ownership interest of other companies in co-owned vessels.*1 Including offshore support vessels
Terminals Location Berth Length Berth Depth Total Area Container Storage Space
Japan
“K” Line Tokyo Container Terminal Tokyo ohi 660m 15m 259,500m2 4,370 TEu*2
“K” Line Yokohama Container Terminal Yokohama Honmoku 400m 12m 133,591m2 1,968 TEu
“K” Line osaka Container Terminal osaka Nanko 350m 14m 63,031m2 1,082 TEu
“K” Line Kobe Container Terminal Kobe Rokko 700m 14m 278,445m2 4,416 TEu
U.S.A.
International TransportationService, Inc. Long Beach 1,920m 13-16m 955,000m2 15,905 TEu
Husky Terminal and Stevedoring, Inc. Tacoma 830m 16m 376,000m2 4,800 TEu
Belgium (Note: Capital Participation Realized by Joint Management)
Antwerp International Terminal NV Antwerp 340m 15.5m 175,000m2 2,990 TEu
“K” Line On-Dock Terminals (As of March 31, 2011)
*2 TEU: Twenty Foot Equivalent Unit
Fleet and Container Terminals
50 KAWASAKI KISEN KAISHA, LTD. 51ANNuAL REpoRT 2011

Financial Analysis
Funding RequirementsThe “K” Line Group’s major working capital requirement comes from shipping business expenses in connection with container-ship services and bulk shipping services. These expenses in-clude operating costs such as port charges, cargo handling costs and fuel costs; vessel expenses such as crew expenses and repair expenses of vessels; and chartering expenses. Other expenses are costs of service operations such as labor cost in connection with the operation of the logistics/harbor transpor-tation business and general administrative expenses for the Group’s business operations, such as personnel expenses, in-formation processing costs and other non-personnel expenses. Capital requirements are investments in vessels, logistics facili-ties and terminal facilities. In fiscal year 2010, the Company made capital investments of ¥148,993 million.
Financial Policy The Company places importance on securing low-cost, stable funds to support the “K” Line Group’s business continuity and expansion. The Company meets long-term funding requirements mainly by means of long-term debt from financial institutions, supplemented by the issuance of bonds and the issuance of new shares. The Company procures short-term operating funds by means of bank loans and the issuance of commercial paper and invests temporary surplus funds in highly stable and liquid finan-cial assets. The Company employs a cash management system to effectively utilize surplus funds of Group companies in Japan and overseas. The Company secures liquidity by preparing for any urgent capital requirements by means of a commercial paper issuance program of up to ¥60.0 billion, a ¥51.0 billion line of credit es-tablished under overdraft agreements with financial institutions and the establishment of a ¥10.0 billion commitment line with financial institutions in Japan. “K” Line has been rated by two Japanese and one overseas rating firm. As of June 24, 2011, the Company has a rating of A- from Japan Credit Rating Agency, Ltd. (JCR), BBB+ from Rating and Investment Information, Inc. (R&I) and BB+ by Stan-dard & Poor’s (S&P). The Company also has short-term credit ratings of j-1 from JCR and a-2 from R&I.
Financial PositionTotal assets on March 31, 2011 were ¥1,032,505 million, a de-crease of ¥11,380 million from the end of the previous fiscal year. Current assets increased by ¥1,519 million to ¥262,845 million, mainly due to an increase in marketable securities. Fixed assets decreased by ¥12,899 million from the end of the previous fiscal year to ¥769,660 million. Vessels, property and equipment decreased by ¥6,134 million to ¥583,728 million, mainly due to depreciation of vessels and the sale of buildings. Investments and other assets decreased by ¥3,173 million to ¥175,569 million, mainly due to a decrease in investment in secu-rities attributable to a decline in the market value of listed stocks.
Cash FlowsCash and cash equivalents were ¥94,430 million at the end of fiscal year 2010, an increase of ¥2,308 million from the previous year. The details of cash flows are as follows. Net cash provided by operating activities was ¥84,902 mil-lion, an increase of ¥108,843 million from the previous year. The increase is mainly due to income before income taxes and mi-nority interests of ¥50,210 million and depreciation and amorti-zation of ¥44,722 million. Net cash used in investing activities was ¥54,117 million, a decrease of ¥9,620 million from the previous year. The decrease is mainly due to purchases of vessels, property and equipment of ¥147,382 million and proceeds from sales of vessels, prop-erty and equipment of ¥92,464 million. Net cash used in financing activities was ¥24,797 million, a decrease of ¥134,207 million from the previous year. The de-crease is mainly due to a net decrease in long-term loans of ¥7,585 million, a net decrease in short-term loans and commer-cial paper of ¥11,703 million, redemption of bonds of ¥2,523 million and cash dividends paid of ¥3,086 million.
Analysis of Sources of Capital and Liquidity
Operating RevenuesConsolidated operating revenues for fiscal year 2010 (from April 1, 2010 to March 31, 2011) were ¥985,085 million, an increase of 17.6% year on year. By business segment, operating reve-nues from containership services rose by 24.1% year on year to ¥444,971 million, an increase mainly attributable to improve-ment in freight rates from freight rate restorations. Operating revenues from bulk shipping services rose by 13.7% year on year to ¥447,111 million as a result of strong cargo movements in dry bulk services due to robust coal and grain import demand in China, India and other developing countries and recovery in movements of completed built-up cars in car carrier services. Operating revenues from other ser-vices rose by 7.6% to ¥93,003 million.
Cost of Sales, Selling, General and Administrative ExpensesCost of sales rose by ¥37,974 million (4.6%) from ¥824,023 million for the previous year to ¥861,997 million, mainly due to soaring fuel oil prices and yen appreciation. The cost of sales ratio fell by 10.8 points to 87.5%. Selling, general and administrative expens-es fell by ¥1,607 million (2.4%) year on year to ¥64,478 million.
Operating IncomeConsolidated operating income was ¥58,610 million, compared to operating loss of ¥52,075 million for the previous year.
Other (Non-operating) Income (Expenses) The net balance of financial income and expenses was negative ¥5,815 million (negative ¥6,015 million for the previous year). The Company recorded an exchange loss of ¥7,224 million (a loss of
¥1,893 million for the previous year) and equity in earnings of af-filiates of ¥102 million (equity in losses of affiliates of ¥380 million). As a result of these and other factors, other (non-operating) in-come (expenses) came to a loss of ¥8,400 million (a loss of ¥44,281 million for the previous year).
Income before Income Taxes and Minority InterestsAs a result of a net gain on sales of fixed assets, a gain on can-cellation of chartered vessels and the increase in operating in-come, income before income taxes and minority interests was ¥50,210 million (a loss of ¥96,356 million for the previous year).
Income TaxesIncome taxes increased by ¥48,585 million to ¥18,300 million from negative ¥30,285 million for the previous year, mainly as a result of an increase in income before income taxes at the filing company.
Minority InterestsMinority interests were ¥1,307 million (¥2,650 million for the pre-vious year). The change is mainly attributable to a decrease in the minority interest in income of the SAL Group, specializing in the transport of heavy lift cargo.
Net IncomeConsolidated net income was ¥30,603 million, compared to net loss of ¥68,721 million for the previous year. Net income per share was ¥40.08, compared to net loss per share of ¥106.24 for the previous year.
Results of Operations
Financial Section
Contents
Financial Analysis 52
Selected Financial Data 54
Business Risks 56
Consolidated Balance Sheets 58
Consolidated Statements of Operations 60
Consolidated Statement of Comprehensive Loss 61
Consolidated Statements of Changes in Net Assets 62
Consolidated Statements of Cash Flows 63
Notes to Consolidated Financial Statements 65
Report of Independent Auditors 84
Total liabilities on March 31, 2011 were ¥717,519 million, an increase of ¥5,499 million from the end of the previous fiscal year. Current liabilities increased by ¥12,758 million to ¥203,712 million, mainly due to an increase in trade accounts payable. Long-term liabilities decreased by ¥7,259 million to ¥513,807 million, mainly due to decreases in bonds and long-term debt. Net assets on March 31, 2011 were ¥314,986 million, a de-crease of ¥16,879 million from the end of the previous fiscal year. Shareholders’ equity was ¥372,097 million. The change in shareholders’ equity is mainly attributable to an increase in re-tained earnings of ¥28,415 million. Accumulated other compre-hensive loss increased by ¥44,929 million from the end of the previous fiscal year to negative ¥80,427 million, mainly attribut-able to ¥6,590 million in the net unrealized holding loss on in-vestments in securities, ¥26,370 million in the deferred loss on hedges and ¥12,002 million in translation adjustments.
Basic Dividend Policy and Dividend Payment for the Current and Following Fiscal YearThe Company considers it an important priority to maximize shareholder returns while giving due consideration to the main priority in the management plan, which is to maintain the inter-nal reserves necessary for capital investment for sustained growth and for improvement and strengthening of the corpo-rate structure. Our policy is to increase the dividend payout ra-tio as a percentage of consolidated net income by one percent-age point each year with the aim of achieving a payout ratio of 30% in the mid-2010s. The dividend payout ratio for fiscal 2010 was 24%, as planned. Nevertheless, we reduced the amount of the year-end dividend by ¥0.5 from the previously announced ¥10.0 to ¥9.5 (including the interim dividend of ¥4.0 paid earlier) due to a decline in earnings in the fourth quarter. Although the Company will bear in mind the fiscal 2011 tar-get of a 25% dividend payout ratio, a decision on the dividend for fiscal 2011 has not been made at this time in view of the extreme uncertainty in the business environment. A further an-nouncement about the dividend will be made once the Com-pany has determined that a forecast is possible, taking into consideration factors holistically, such as the outlook for the full year and the financial situation. In a business environment in which exchange rate and bunker price trends defy optimistic prediction amid adverse and hard-to-forecast conditions in the marine transport mar-ket, for the time being the Company has made the mainte-nance of financial soundness the highest management priority and will continue to rigorously pursue rationalization and cost reductions while making maximum efforts to secure distribut-able income.
Dividend Policy
52 KAWASAKI KISEN KAISHA, LTD. 53ANNuAL REPORT 2011

Selected Financial Data
Millions of yen
Consolidated 2006 2007 2008 2009 2010 2011
Operating revenues ¥940,819 ¥1,085,539 ¥1,331,048 ¥1,244,317 ¥838,033 ¥985,085
Operating income 87,976 61,357 129,649 71,604 (52,075) 58,610
As a percentage of operating revenues 9.4% 5.7% 9.7% 5.8% — 5.9%
Net income 62,424 51,514 83,012 32,421 (68,721) 30,603
Total assets 757,040 900,439 968,630 971,603 1,043,885 1,032,505
Shareholders’ equity (until 2006)/Net assets (since 2007)
257,810 357,625 376,277 356,153 331,865 314,986
As a percentage of total assets 34.1% 38.3% 36.7% 34.5% 29.5% 28.2%
Interest-bearing liabilities 278,234 326,187 329,716 439,622 516,001 483,363
As a percentage of total assets 36.8% 36.2% 34.0% 45.2% 49.4% 46.8%
Debt-to-equity ratio 1.08 0.95 0.93 1.31 1.67 1.66
Return on equity 28.4% 17.1% 23.7% 9.4% — 10.2%
Interest coverage ratio 16.16 15.97 27.69 12.61 — 9.81
Financial income and expenses (1,122) 1,468 1,441 (1,218) (6,015) (5,815)
Depreciation and amortization 28,623 32,294 36,362 39,427 45,281 44,722
Millions of yen
Non-Consolidated 2006 2007 2008 2009 2010 2011
Operating revenues ¥742,569 ¥857,279 ¥1,063,705 ¥960,109 ¥631,747 ¥772,322
Operating income 56,679 28,103 89,715 24,613 (59,463) 41,657
As a percentage of operating revenues 7.6% 3.3% 8.4% 2.6% — 5.4%
Net income 38,820 25,250 58,939 799 (56,950) 24,620
Total assets 481,542 518,501 541,450 498,022 569,028 580,087
Shareholders’ equity (until 2006)/Net assets (since 2007)
188,966 241,181 258,075 225,505 205,952 203,643
As a percentage of total assets 39.2% 46.5% 47.7% 45.3% 36.2% 35.1%
Interest-bearing liabilities 145,129 133,109 91,124 177,027 238,690 221,870
As a percentage of total assets 30.1% 25.7% 16.8% 35.5% 41.9% 38.2%
Debt-to-equity ratio 0.77 0.55 0.35 0.79 1.16 1.09
Return on equity 23.4% 11.7% 23.6% 0.3% — 12.0%
Interest coverage ratio 18.98 8.64 39.03 — — 14.26
Financial income and expenses 1,342 5,523 5,531 4,117 9,674 3,662
Depreciation and amortization 7,503 6,815 7,329 8,371 6,171 9,666
Kawasaki Kisen Kaisha, Ltd. and Consolidated SubsidiariesYears ended March 31
Notes: (1) Effective the year ended March 31, 2007, the Company has ad-opted “Accounting Standard for Presentation of Net Assets in the Balance Sheet” (ASBJ Statement No. 5) and “Guidance on Ac-counting Standard for Presentation of Net Assets in the Balance Sheet” (ASBJ Guidance No. 8). Total shareholders’ equity at March 31, 2007 under the previous method of presentation amounted to ¥330,260 million.
(2) Effective the year ended March 31, 2008, the Company and certain consolidated subsidiaries have recognized the revenues from con-tainer vessels in accordance with the course of transportation time on each cargo. The effect of this adoption was decrease marine transportation and other operating revenues, operating income, and income before income taxes and minority interests decreased by ¥11,791 million for the year ended March 31, 2008.
(3) Effective the year ended March 31, 2008, the Company and domes-tic consolidated subsidiaries have changed their method of depre-ciation based on an amendment to the Japanese Corporation Tax Law (Law for Partial Amendment of Income Tax Law, etc. (Law No. 6 of March 30, 2007) and Cabinet Order for Partial Amendment of Enforcement Order of Corporation Tax Law (Cabinet Order No. 83 , March 30, 2007) for tangible fixed assets acquired on or after April 1, 2007. The effect of this adoption on profit and loss was immate-rial for the year ended March 31, 2008.
(4) Effective the year ended March 31, 2008, the Company and domes-tic consolidated subsidiaries have changed their method of depre-ciation based on an amendment to the Corporation Tax Law of Ja-pan for tangible fixed assets acquired on or prior to March 31, 2007. Such tangible fixed assets are to be depreciated based on the dif-ference between the equivalent of 5% of acquisition cost and mem-orandum value over a period of 5 years once they have been fully depreciated to the limits of their respective depreciable amounts effective April 1, 2007. The effect of this adoption was to decrease marine transportation and other operating revenues, operating in-come, and income before income taxes by ¥609 million for the year ended March 31, 2008.
(5) Effective the year ended March 31, 2009, the Company and domes-tic consolidated subsidiaries have adopted “Accounting Standard for Lease Transactions” (Financial Accounting Council on June 17, 1993, and revised by the Accounting Standards Board of Japan (“ASBJ”) on March 30, 2007) and “Guidance on Accounting Stan-dard for Lease Transactions” (Financial Accounting Standard Im-plementation Guidance No. 16, originally issued by the Accounting System Committee of the Japanese Institute of Certified Public Ac-countants on January 18, 1994, and revised by the ASBJ on March 30, 2007). There was no material impact on the financial statements as a result of the adoption of the accounting standards for the year ended March 31, 2009.
(6) Effective the year ended March 31, 2009, the Company has ad-opted “Practical Solution on unification of Accounting Policies Ap-plied to Foreign Subsidiaries for Consolidated Financial State-ments” and made necessary amendments to the consolidated financial statements (Accounting Standards Board of Japan (ASBJ) PITF No. 18, issued on May 17, 2006). The adoption of this ac-counting guideline had slight effect on the consolidated statements of income for the year ended March 31, 2009.
(7) Effective the year ended March 31, 2011, the Company and its do-mestic consolidated subsidiaries have adopted “Accounting Stan-dard for Asset Retirement Obligations” (Accounting Standards Board of Japan (“ASBJ”) Statement No. 18 issued on March 31, 2008) and “Guidance on Accounting Standard for Asset Retirement Obligations” (ASBJ Guidance No. 21 issued on March 31, 2008). As a result of this adoption, operating income decreased by ¥3 million and income before income taxes and minority interests decreased by ¥385 million for the year ended March 31, 2011 from the amounts which would have been recorded under the method applied in the previous year.
Notes: (1) Effective the year ended March 31, 2007, the Company has ad-opted “Accounting Standard for Presentation of Net Assets in the Balance Sheet” (ASBJ Statement No. 5) and “Guidance on Ac-counting Standard for Presentation of Net Assets in the Balance Sheet” (ASBJ Guidance No. 8). Total shareholders’ equity at March 31, 2007 under the previous method of presentation amounted to ¥231,961 million.
(2) Effective the year ended March 31, 2008, the Company has recog-nized the revenues from container vessels in accordance with the course of transportation time on each cargo. The effect of this adoption was a decrease in marine transportation and other operat-ing revenues with operating income, income before taxes and mi-nority interests each decreasing by ¥11,669 million for the year ended March 31, 2008.
(3) Effective the year ended March 31, 2008, the Company has changed its method of depreciation based on an amendment to the Japa-nese Corporation Tax Law (Law for Partial Amendment of Income Tax Law, etc. (Law No. 6 of March 30, 2007) and Cabinet Order for Partial Amendment of Enforcement Order of Corporation Tax Law (Cabinet Order No. 83, March 30, 2007) for tangible fixed assets acquired on or after April 1, 2007. The effect of this adoption on profit and loss was immaterial for the year ended March 31, 2008.
(4) Effective the year ended March 31, 2008, the Company has changed its method of depreciation based on an amendment to the Corpora-tion Tax Law of Japan for tangible fixed assets acquired on or prior to March 31, 2007. Such tangible fixed assets are to be depreciated based on the difference between the equivalent of 5% of acquisi-tion cost and memorandum value over a period of 5 years once they have been fully depreciated to the limits of their respective depreciable amounts effective April 1, 2007. The effect of this adop-tion was to decrease marine transportation and other operating revenues, operating income, and income before income taxes by ¥425 million for the year ended March 31, 2008.
(5) Effective the year ended March 31, 2009, the Company has ad-opted “Accounting Standard for Lease Transactions” (Financial Ac-counting Council on June 17, 1993, and revised by the Accounting Standards Board of Japan (“ASBJ”) on March 30, 2007) and “Guid-ance on Accounting Standard for Lease Transactions” (Financial Accounting Standard Implementation Guidance No.16, originally is-sued by the Accounting System Committee of the Japanese Insti-tute of Certified Public Accountants on January 18, 1994, and re-vised by the ASBJ on March 30, 2007). There was no material impact on the financial statements as a result of the adoption of the accounting standards for the year ended March 31, 2009.
(6) Effective the year ended March 31, 2011, the Company and its do-mestic consolidated subsidiaries have adopted “Accounting Stan-dard for Asset Retirement Obligations” (Accounting Standards Board of Japan (“ASBJ”) Statement No. 18 issued on March 31, 2008) and “Guidance on Accounting Standard for Asset Retirement Obligations” (ASBJ Guidance No. 21 issued on March 31, 2008). As a result of this adoption, income before income taxes and minority interests decreased by ¥363 million for the year ended March 31, 2011 from the amounts which would have been recorded under the method applied in the previous year.
54 KAWASAKI KISEN KAISHA, LTD. 55ANNuAL REPORT 2011

Business Risks
The “K” Line Group is developing its business internationally. When unpredictable events occur, whether they are caused by sociopolitical or natural phenomena, they can have a negative impact on business in related areas and markets. Furthermore, in the Group’s main business field, marine transport, market conditions for cargo handling and marine transportation are heavily influenced by international factors such as economic trends in various countries, product market conditions, supply and demand balance for ships, as well as competitive relation-ships. Changes in any of those factors can have a negative im-pact on the “K” Line Group’s marketing activities and business results. In particular, a change in tax systems or economic pol-icies, or an invocation of protective trade policies in major trad-ing regions and countries like North America, Europe, Japan, China and so on can result in a decrease in shipping volume and worsen conditions for the freight market. This can have a serious impact on the “K” Line Group’s financial situation and operating results. Other major risks that can have a negative impact on the “K” Line Group’s business activities include the following:
1. Rate FluctuationsA large percentage of the “K” Line Group’s business earnings come in revenue denominated in u.S. dollars. The revenues as converted to Japanese yen can therefore be negatively affected by fluctuations in exchange rates. The Group works to minimize negative impacts from exchange rate fluctuations by incurring costs in dollars and creating currency hedges, but a stronger yen against the u.S. dollar can still have a negative influence on the “K” Line Group’s financial situation and operating results.
2. Fuel Oil Price FluctuationsFuel oil prices account for a major portion of the “K” Line Group’s ship operation costs. Fluctuations in fuel oil prices are influenced mainly by factors with which the “K” Line Group has no influence, such as crude oil supply and demand bal-ance, production and pricing policies adopted by OPEC and other oil-producing nations, as well as political conditions and fluctuations in oil production performance in producing coun-tries. Such factors are extremely difficult to predict. The Group utilizes futures contracts in order to mitigate the impact of un-stable elements on its bottom line, but remarkable and sus-tained rises in fuel oil prices along with decreased supplies can force the “K” Line Group’s business costs upwards. This would have a negative impact on the Group’s financial situa-tion and operating results.
3. Interest Rate FluctuationsThe “K” Line Group carries out ongoing capital investment in its shipbuildings and so on. The Group strives to reduce inter-est-bearing debt to the greatest extent possible by investing its own capital and engaging in off-balance sheet deals such
as operating leases, but in a high percentage of cases, still must rely on borrowing from financial institutions. In addition, we are investing in the working capital needed to carry out our business operations. With regard to capital procurement, we are taking out loans above a certain scale at fixed interest rates and also using interest rate swap (swap into fixed rate) for capital investment ships and equipment, but the rise in fu-ture interest rates has led to an increase in the cost of capital procurement, and this can have a negative impact on the “K” Line Group’s financial situation and operating results.
4. Public RegulationsMarine transportation business in general is influenced by inter-national treaties on ship operations, registration and construc-tion, as well as business licensing, taxes and other laws and regulations in various individual countries and territories. It is possible that in the future, new laws or regulations will be en-acted that constrain the “K” Line Group’s business develop-ment or increase its business costs. This would result in a neg-ative impact on the “K” Line Group’s financial situation and operating results. Ships that the “K” Line Group operates are managed and operated in compliance with existing laws and regulations, and they carry appropriate hull insurance. Nevertheless, relevant legal regulations could change, and compliance with new regu-lations could generate additional costs.
5. Serious Marine Incidents, Environmental Destruction, Conflicts, etc.
The “K” Line Group regards thoroughly safe ship operation and environmental preservation as its highest priorities as it maintains and improves its safe operation standards and cri-sis management system. If an accident, especially an acci-dent involving an oil spill, should occur despite these efforts and causes ocean pollution, it could have a negative impact on the “K” Line Group’s financial situation and operating re-sults. Furthermore, increasing losses due to piracy, operation in areas of political instability or conflict and the increasing risk of terrorism directed at ships could cause major damage to “K” Line Group ships and place its crews in danger. These factors could have a negative impact on the “K” Line Group’s safe ship operations, voyage planning and management as well as marine transport business as a whole.
6. Competitive Environment, etc.The “K” Line Group carries out business development in the international marine transportation market. In its competitive relationships with leading groups of marine transportation com-panies from Japan and abroad, the Group’s industry position and operating results can be negatively impacted by the degree to which other companies allocate their management resources to each sector and by differences in competitiveness such as
costs and technologies. In the highly competitive environment of the containership sector, the Group is striving to maintain and improve the com-petitiveness of its services by participating in alliances with for-eign marine transportation companies. However, factors over which the “K” Line Group has no control, such as other compa-nies deciding on their own to end alliances, could have a nega-tive impact on the Group’s marketing activities, financial situa-tion and operating results.
7. Natural DisastersThe “K” Line Group must be able to maintain business opera-tions in the event of a natural disaster, as we provide a vital role for society, and because doing so is critical to the existence of our company. If a major earthquake were to occur at the heart of the Tokyo metropolitan area, the effect on buildings, trans-portation and other lifelines is expected to be immense. There are also concerns that if a highly-virulent new form of influenza emerged and spread globally (becoming a pandemic) it would have devastating effects, affecting the health of countless peo-ple. In addition, there are concerns regarding the spread of harmful rumors following a natural disaster or a secondary di-saster. Although the “K” Line Group has drawn up business continuity plans for these contingencies, and our goal is to maintain operations to the greatest degree possible, there is a possibility of considerable adverse effects to our overall busi-ness in the event that a natural disaster occurs.
8. Business Partners’ Failure to Perform ContractsWhen providing services or choosing business partners, wher-ever possible the “K” Line Group looks into the reliability of the other party. However, a full or partial breach of a contract can subsequently occur for reasons such as the worsening financial position of the business partner. As a result, the financial posi-tion and operating results of the “K” Line Group may be ad-versely affected.
9. Non-achievement of “K” LINE Medium-Term Management Plan
In April 2011, the “K” Line Group revised the KV2010 Medium-Term Management Plan and adopted the “K” LINE Vision 100—New Challenges—. Going forward, the Group will make every effort to carry out the Medium-Term Management Plan. None-theless, it is possible that the measures for carrying out the Me-dium-Term Management Plan will be affected by the various external factors discussed above and the group may not be able to achieve the goals of that plan.
10. Non-achievement of Investment PlansThe “K” Line Group is making plans for the investments neces-sary to upgrade its fleet. If, however, owing to future trends in shipping markets and official regulations, progress is not made
in accordance with the projections in the plans, the financial position and operating results of the “K” Line Group may be adversely affected. Moreover, the Group’s financial position and operating results may also be adversely affected if, at the time the newbuildings are delivered, the demand for cargo transport falls below projections.
11. Losses from Disposal of Vessels, etc.The “K” Line Group endeavors to implement fleet upgrades that are flexible and appropriate to the market. There are times, however, when we dispose of our vessels because of a wors-ening in the supply-demand balance or obsolescence due to technological innovation, as well as the case where a charter contract for a chartered vessel is terminated early, and such cases may adversely affect the “K” Line Group’s financial posi-tion and operating results.
12. Fixed Asset Impairment Losses With respect to fixed assets such as vessels owned by the “K” Line Group, recovery of the amount invested may not be possible due to a downturn in profitability. The “K” Line Group’s financial position and operating results may be adversely affected when such asset impairment losses are realized.
13. Reversal of Deferred Tax AssetsBased on estimated future taxable income, the “K” Line Group assesses the possibility of recognition of deferred tax assets. When a conclusion is reached that, due to a decline in earning capacity, it cannot be guaranteed that there will be sufficient taxable income in the future, deferred tax assets are reversed and a tax expense incurred. This may adversely affect the “K” Line Group’s financial position and operating results.
Note: Matters referring to the future are as judged by the “K” Line Group at the issue date of
financial statements of June 24, 2011. In addition, the items discussed here do not
necessarily represent every risk to the “K” Line Group.
56 KAWASAKI KISEN KAISHA, LTD. 57ANNuAL REPORT 2011

Consolidated Balance Sheets
Millions of yen
Thousands of U.S. dollars(Note 1(a))
Assets 2011 2010 2011
Current assets:
Cash and deposits (Notes 14 and 17) ¥ 74,064 ¥ 96,059 $ 890,728
Marketable securities (Notes 3 and 14) 24,999 0 300,649
Accounts and notes receivable—trade (Note 14) 78,314 76,675 941,840
Allowance for doubtful receivables (527) (493) (6,338)
Inventories (Note 4) 34,577 26,595 415,839
Prepaid expenses and deferred charges 32,448 27,082 390,235
Deferred income taxes (Note 8) 2,224 11,537 26,747
Other current assets 16,746 23,871 201,394
Total current assets 262,845 261,326 3,161,094
Investments and other assets:
Investments in and advances to unconsolidated subsidiaries and affiliates (Note 14)
37,561 42,856 451,726
Investments in securities (Notes 3, 7 and 14) 74,789 83,201 899,447
Long-term loans receivable 7,519 7,567 90,427
Deferred income taxes (Note 8) 42,989 33,232 517,005
Other assets 14,014 17,452 168,538
Allowance for doubtful receivables (1,303) (5,566) (15,670)
Total investments and other assets 175,569 178,742 2,111,473
Vessels, property and equipment:
Vessels (Notes 5 and 7) 636,678 623,776 7,656,981
Buildings, structures and equipment (Note 7) 97,498 105,941 1,172,556
Accumulated depreciation (317,280) (317,252) (3,815,755)
416,896 412,465 5,013,782
Land (Notes 5, 7 and 12) 30,718 30,995 369,429
Construction in progress (Note 5) 136,114 146,402 1,636,969
Vessels, property and equipment, net 583,728 589,862 7,020,180
Intangible assets:
Goodwill, net (Note 6) 4,518 7,393 54,336
Other intangible assets 5,845 6,562 70,295
Total intangible assets 10,363 13,955 124,631
Total assets (Note 19) ¥1,032,505 ¥1,043,885 $12,417,378
Millions of yen
Thousands of U.S. dollars(Note 1(a))
Liabilities and net assets 2011 2010 2011
Current liabilities:
Short-term loans (Notes 7 and 14) ¥ 9,144 ¥ 11,545 $ 109,970
Commercial paper (Note 7) — 9,000 —
Current portion of long-term debt (Notes 7 and 14) 62,017 52,938 745,845
Accounts and notes payable—trade (Note 14) 76,750 70,311 923,031
Advances received 20,053 19,010 241,167
Current portion of obligations under finance leases 2,805 1,080 33,734
Accrued income taxes (Note 8) 3,362 3,126 40,433
Deferred income taxes (Note 8) 4 1,292 48
Other current liabilities 29,577 22,652 355,706
Total current liabilities 203,712 190,954 2,449,934
Long-term liabilities:
Long-term debt, less current portion (Notes 7 and 14) 407,432 439,097 4,899,964
Allowance for employees’ retirement benefits (Note 10) 7,794 8,009 93,734
Allowance for directors’ and corporate auditors’ retirement benefits 1,978 2,002 23,788
Accrued expenses for overhaul of vessels 17,709 17,771 212,977
Obligations under finance leases, less current portion 1,964 2,340 23,620
Deferred income taxes (Note 8) 2,314 2,431 27,829
Deferred income taxes on land revaluation (Note 12) 2,633 2,633 31,666
Derivative liabilities 67,917 42,827 816,801
Other long-term liabilities 4,066 3,956 48,899
Total long-term liabilities 513,807 521,066 6,179,278
Commitments and contingent liabilities (Note 13)
Net assets:
Shareholders’ equity (Note 11):
Common stock: Authorized — 2,000,000,000 shares in 2011 and 2010 Issued — 765,382,298 shares in 2011 and 2010
65,032 65,032 782,105
Capital surplus 49,893 49,877 600,036
Retained earnings (Note 20) 258,076 229,661 3,103,740
Less treasury stock, at cost—1,589,909 shares in 2011, and 1,808,450 in 2010
(904) (950) (10,872)
Total shareholders’ equity 372,097 343,620 4,475,009
Accumulated other comprehensive income (loss):
Net unrealized holding gain on investments in securities (Note 3) 1,955 8,545 23,512
Deferred loss on hedges (Note 15) (55,306) (28,936) (665,136)
Revaluation reserve for land (Note 12) 2,078 2,045 24,991
Translation adjustments (29,154) (17,152) (350,619)
Total accumulated other comprehensive loss, net (80,427) (35,498) (967,252)
Minority interests in consolidated subsidiaries 23,316 23,743 280,409
Total net assets 314,986 331,865 3,788,166
Total liabilities and net assets ¥1,032,505 ¥1,043,885 $12,417,378
Kawasaki Kisen Kaisha, Ltd. and Consolidated SubsidiariesMarch 31, 2011 and 2010
The accompanying notes are an integral part of the consolidated financial statements.
58 KAWASAKI KISEN KAISHA, LTD. 59ANNuAL REPORT 2011

Consolidated Statements of Operations Consolidated Statement of Comprehensive Loss
Millions of yen
Thousands of U.S. dollars(Note 1(a))
2011 2010 2011
Marine transportation and other operating revenues (Note 19) ¥985,085 ¥ 838,033 $11,847,084
Marine transportation and other operating costs and expenses 861,997 824,023 10,366,771
Gross operating income 123,088 14,010 1,480,313
Selling, general and administrative expenses 64,478 66,085 775,442
Operating income (loss) (Note 19) 58,610 (52,075) 704,871
Other income (expenses):
Interest and dividend income 2,749 2,744 33,061
Interest expense (8,564) (8,759) (102,995)
Equity in earnings (losses) of affiliates 102 (380) 1,227
Exchange loss, net (7,224) (1,893) (86,879)
Loss on cancellation of derivatives contracts — (6,915) —
Gain on sales of vessels, property and equipment, net 5,213 10,529 62,694
Loss on impairment of fixed assets (Note 5) — (8,906) —
Loss on devaluation of investments in securities, net (444) (433) (5,340)
Gain (loss) on cancellation of chartered vessels, net 990 (22,420) 11,906
Loss on amendments to shipbuilding contracts — (11,319) —
Loss on liquidation of subsidiaries and affiliates (1,091) — (13,121)
Loss on compensation for damages (790) — (9,501)
Other, net 659 3,471 7,925
(8,400) (44,281) (101,023)
Income (loss) before income taxes and minority interests 50,210 (96,356) 603,848
Income taxes (Note 8):
Current 5,297 3,847 63,704
Deferred 13,003 (34,132) 156,380
Total income taxes 18,300 (30,285) 220,084
Net income (loss) before minority interests 31,910 (66,071) 383,764
Minority interests 1,307 2,650 15,718
Net income (loss) ¥ 30,603 ¥ (68,721) $ 368,046
Millions of yen
Thousands of U.S. dollars(Note 1(a))
2011 2011
Net income before minority interests ¥ 31,910 $ 383,764
Other comprehensive loss:
Net unrealized holding loss on investments in securities (6,517) (78,376)
Deferred loss on hedges (26,953) (324,149)
Translation adjustments (13,219) (158,978)
Share of other comprehensive loss of subsidiaries and affiliates accounted for by the equity method
(772) (9,284)
Total other comprehensive loss (47,461) (570,787)
Comprehensive loss (15,551) (187,023)
(Breakdown)
Comprehensive loss attributable to shareholders of Kawasaki Kisen Kaisha, Ltd. (14,358) (172,676)
Comprehensive loss attributable to minority shareholders of consolidated subsidiaries (1,193) (14,347)
The accompanying notes are an integral part of the consolidated financial statements.
Kawasaki Kisen Kaisha, Ltd. and Consolidated SubsidiariesYears ended March 31, 2011 and 2010
Kawasaki Kisen Kaisha, Ltd. and Consolidated SubsidiariesYear ended March 31, 2011
The accompanying notes are an integral part of the consolidated financial statements.
60 KAWASAKI KISEN KAISHA, LTD. 61ANNuAL REPORT 2011

Consolidated Statements of Changes in Net Assets
Millions of yen
Thousands of U.S. dollars(Note 1(a))
2011 2010 2011
Shareholders’ equity:Common stock:
Balance at beginning of year ¥ 65,032 ¥ 45,869 $ 782,105 Issuance of new shares — 19,163 —
Balance at end of year 65,032 65,032 782,105 Capital surplus:
Balance at beginning of year 49,877 30,714 599,844 Issuance of new shares — 19,163 —Disposal of treasury stocks 16 — 192
Balance at end of year 49,893 49,877 600,036 Retained earnings:
Balance at beginning of year 229,661 298,638 2,762,008 Cash dividends (3,056) — (36,753)Net income (loss) 30,603 (68,721) 368,046 Disposal of treasury stock (9) (6) (108)Reversal of the revaluation reserve for land 161 3 1,936 Net change in retained earnings resulting from inclusion or exclusion of subsidiaries and other
716 (253) 8,611
Balance at end of year 258,076 229,661 3,103,740 Treasury stock, at cost:
Balance at beginning of year (950) (938) (11,425)Purchase of treasury stock (19) (27) (229)Disposal of treasury stock 65 15 782
Balance at end of year ¥ (904) ¥ (950) $ (10,872)
Accumulated other comprehensive income (loss):Net unrealized holding gain (loss) on investments in securities:
Balance at beginning of year ¥ 8,545 ¥ (4,875) $ 102,766 Net changes during the year (6,590) 13,420 (79,254)
Balance at end of year 1,955 8,545 23,512 Deferred loss on hedges:
Balance at beginning of year (28,936) (17,708) (347,998)Net changes during the year (26,370) (11,228) (317,138)
Balance at end of year (55,306) (28,936) (665,136)Revaluation reserve for land:
Balance at beginning of year 2,045 2,048 24,594 Net changes during the year 33 (3) 397
Balance at end of year 2,078 2,045 24,991 Translation adjustments:
Balance at beginning of year (17,152) (18,975) (206,278)Net changes during the year (12,002) 1,823 (144,341)
Balance at end of year (29,154) (17,152) (350,619)Minority interests in consolidated subsidiaries:
Balance at beginning of year 23,743 21,380 285,544 Net changes during the year (427) 2,363 (5,135)
Balance at end of year 23,316 23,743 280,409 Total net assets ¥314,986 ¥331,865 $3,788,166
Kawasaki Kisen Kaisha, Ltd. and Consolidated SubsidiariesYears ended March 31, 2011 and 2010
The accompanying notes are an integral part of the consolidated financial statements.
Consolidated Statements of Cash Flows
Millions of yen
Thousands of U.S. dollars(Note 1(a))
2011 2010 2011
Cash flows from operating activities:
Income (loss) before income taxes and minority interests ¥50,210 ¥(96,356) $ 603,848
Adjustments to reconcile income (loss) before income taxes and minority interests to net cash provided by (used in) operating activities:
Depreciation and amortization 44,722 45,281 537,847
Reversal of employees’ retirement benefits (225) (519) (2,706)
Increase (decrease) in accrued expenses for overhaul of vessels 71 (2,488) 854
(Reversal of) provision for directors’ and corporate auditors’ retirement benefits (20) 57 (241)
Interest and dividend income (2,749) (2,744) (33,061)
Interest expense 8,564 8,759 102,995
Gain on sales of vessels, property and equipment, net (5,213) (10,529) (62,694)
Loss on impairment of fixed assets — 8,906 —
(Gain) loss on cancellation of chartered vessels, net (990) 22,420 (11,906)
Loss on amendments to shipbuilding contracts — 11,319 —
Loss on liquidation of subsidiaries and affiliates 1,091 — 13,121
Loss on cancellation of derivatives contracts — 6,915 —
Loss on compensation for damages 790 — 9,501
Changes in operating assets and liabilities:
Increase in accounts and notes receivable—trade (4,298) (1,620) (51,690)
Increase in other current assets (10,190) (3,865) (122,550)
Increase in accounts and notes payable—trade 8,468 6,326 101,840
Increase (decrease) in other current liabilities 5,624 (2,041) 67,637
Increase in inventories (8,424) (6,473) (101,311)
Other, net 9,165 13,623 110,224
Subtotal 96,596 (3,029) 1,161,708
Interest and dividends received 2,824 2,756 33,963
Interest paid (8,658) (8,539) (104,125)
Income taxes paid (5,070) (5,300) (60,974)
Income taxes refunded — 16,937 —
Payment for cancellation of derivatives contracts — (3,473) —
Payment for cancellation of chartered vessels — (22,832) —
Payment for amendments to shipbuilding contracts — (461) —
Payment for compensation for damages (790) — (9,502)
Net cash provided by (used in) operating activities ¥84,902 ¥(23,941) $1,021,070
Kawasaki Kisen Kaisha, Ltd. and Consolidated SubsidiariesYears ended March 31, 2011 and 2010
62 KAWASAKI KISEN KAISHA, LTD. 63ANNuAL REPORT 2011

Millions of yen
Thousands of U.S. dollars(Note 1(a))
2011 2010 2011
Cash flows from investing activities:
Purchases of marketable securities and investments in securities ¥ (3,097) ¥ (9,023) $ (37,246)
Proceeds from sales of marketable securities and investments in securities 1,064 2,926 12,796
Purchases of vessels, property and equipment (146,462) (178,174) (1,761,419)
Proceeds from sales of vessels, property and equipment 92,464 119,642 1,112,014
Increase in intangible assets (920) (1,671) (11,064)
Increase in long-term loans receivable (3,823) (22,210) (45,977)
Collection of long-term loans receivable 9,468 27,551 113,867
Other, net (2,811) (2,778) (33,807)
Net cash used in investing activities (54,117) (63,737) (650,836)
Cash flows from financing activities:
Decrease in short-term loans, net (2,703) (896) (32,508)
Decrease in commercial paper (9,000) (13,000) (108,238)
Proceeds from long-term loans 56,763 102,816 682,658
Repayment of long-term loans and obligations under finance leases (64,348) (51,140) (773,879)
Proceeds from issuance of bonds — 35,111 —
Redemption of bonds (2,523) (189) (30,343)
Proceeds from issuance of common stock — 38,105 —
Cash dividends paid (3,086) (38) (37,114)
Cash dividends paid to minority shareholders (338) (3,186) (4,065)
Proceeds from stock issuance to minority shareholders 439 1,844 5,280
Other, net (1) (17) (11)
Net cash (used in) provided by financing activities (24,797) 109,410 (298,220)
Effect of exchange rate changes on cash and cash equivalents (4,560) 546 (54,840)
Net increase in cash and cash equivalents 1,428 22,278 17,174
Cash and cash equivalents at beginning of year 92,122 69,700 1,107,901
Increase in cash and cash equivalents arising from initial consolidation of subsidiaries
880 144 10,583
Cash and cash equivalents at end of year (Note 17) ¥ 94,430 ¥ 92,122 $ 1,135,658
The accompanying notes are an integral part of the consolidated financial statements.
Notes to Consolidated Financial Statements
1. Summary of Significant Accounting Policies(a) Basis of preparation
The accompanying consolidated financial statements of Kawasaki
Kisen Kaisha, Ltd. (the “Company”) and its consolidated subsidiar-
ies have been prepared on the basis of accounting principles gen-
erally accepted in Japan, which are different in certain respects as
to the application and disclosure requirements of International Fi-
nancial Reporting Standards, and are compiled from the consoli-
dated financial statements prepared by the Company as required
by the Financial Instruments and Exchange Act of Japan. In prepar-
ing the accompanying consolidated financial statements, certain
reclassifications and rearrangements have been made to present
them in a form which is familiar to readers outside Japan. However,
no adjustments have been made which would change the financial
position or the results of operations presented in the original con-
solidated financial statements.
Certain reclassifications of previously reported amounts have
been made to conform the consolidated financial statements for the
year ended March 31, 2010 to the 2011 presentation. Such reclas-
sifications had no effect on consolidated net loss or net assets.
The translation of yen amounts into u.S. dollar amounts is in-
cluded solely for convenience and has been made, as a matter of
arithmetic computation only, at ¥83.15=u.S.$1.00, the approximate
rate of exchange prevailing on March 31, 2011. Furthermore, the
translation should not be construed as a representation that yen
have been, could have been, or could in the future be, converted
into u.S. dollars at that or any other rate.
(b) Principles of consolidation
The accompanying consolidated financial statements include the
accounts of the Company and 316 and 319 subsidiaries for the
years ended March 31, 2011 and 2010, respectively. The principles
of consolidation are to include significant subsidiaries, whose vot-
ing interests are owned 40 per cent or more by the consolidated
group and whose decision-making control over their operations is
significantly affected by the consolidated group through financial or
technical support, personnel, transactions, and so forth. In addi-
tion, significant affiliates whose decision-making control over their
operations is significantly affected by the consolidated group in
various ways are accounted for by the equity method.
For the purposes of consolidation, all significant intercompany
transactions, account balances and unrealized profit among the
consolidated group companies have been eliminated.
Goodwill and negative goodwill are, as a rule, amortized by the
straight-line method over a period of five years.
(c) Accounting period
Most of the consolidated subsidiaries have a December 31 year
end which does not accord with that of the Company. As a result,
adjustments have been made for any significant transactions which
took place during the period between the year end of these subsid-
iaries and the year end of the Company.
(d) Translation of foreign currencies
All monetary assets and liabilities denominated in foreign curren-
cies other than those hedged by forward foreign exchange con-
tracts are translated into yen at the rates of exchange in effect at
the balance sheet date. Gain or loss resulting from the settlement of
these items is credited or charged to income.
(e) Translation of accounts of overseas consolidated subsidiaries
The accounts of the overseas consolidated subsidiaries, except for
the components of net assets excluding minority interests of con-
solidated subsidiaries, are translated into yen at the rates of ex-
change in effect at the balance sheet date. The components of net
assets excluding minority interests of consolidated subsidiaries are
translated at their historical exchange rates. Differences arising from
translation are presented as translation adjustments and minority
interests in the accompanying consolidated financial statements.
(f) Cash and cash equivalents
Cash and cash equivalents include cash on hand and in banks and
other highly liquid investments with maturities of three months or
less when purchased.
(g) Allowance for doubtful receivables
An allowance for doubtful receivables is provided at an amount cal-
culated based on the historical experience of bad debts on ordinary
receivables plus an additional estimate of probable specific bad
debts from customers experiencing financial difficulties.
(h) Inventories
Inventories are stated at the lower of cost or net selling value, cost
being determined by the moving average method.
(i) Investments in securities
Securities are classified into three categories: trading securities,
held-to-maturity debt securities or other securities. Trading securi-
ties, consisting of debt and marketable equity securities, are stated
at fair value. Gain or loss, both realized and unrealized, are credited
or charged to income. Held-to-maturity debt securities are stated at
their amortized cost. Marketable securities classified as other secu-
rities are carried at fair value with any changes in unrealized holding
gain or loss, net of the applicable income taxes, reported as a sep-
arate component of net assets. Non-marketable securities classi-
fied as other securities are carried at cost determined by the mov-
ing average method.
under the Corporation Law of Japan (the “Law”), unrealized
holding gain on other securities, net of the related taxes, is not
available for distribution as dividends.
Kawasaki Kisen Kaisha, Ltd. and Consolidated SubsidiariesMarch 31, 2011
64 KAWASAKI KISEN KAISHA, LTD. 65ANNuAL REPORT 2011

(j) Vessels, property and equipment and depreciation
Depreciation of vessels is computed by the straight-line or the de-
clining-balance method over the estimated useful lives of the re-
spective vessels.
Depreciation of property and equipment is computed princi-
pally by the declining-balance method over the estimated useful
lives of the respective assets.
Maintenance, repairs and minor improvements are charged to
income as incurred. Major improvements are capitalized.
(k) Capitalization of interest expense
Interest expense is generally charged to income as incurred. How-
ever, interest expense incurred in the construction of certain ves-
sels is capitalized and included in the costs of the assets if the
construction period is substantially long and the amount of interest
incurred during the period is significantly large.
(l) Leases
Leased assets under finance lease transactions that transfer own-
ership to the lessee are depreciated by the same methods used for
owned fixed assets.
Leased assets under finance lease transactions that do not
transfer ownership to the lessee are depreciated to a residual value
of zero by straight-line method over the lease term.
Finance lease transactions that do not transfer ownership to
the lessee, starting on or before March 31, 2008 are accounted for
as operating lease transactions.
(m) Research and development costs and computer software
Research and development costs are charged to income as incurred.
Expenditures relating to the development of computer software
intended for internal use are charged to income when incurred, un-
less these are deemed to contribute to the generation of future in-
come or cost savings. Such expenditures are capitalized as assets
and amortized by the straight-line method over their estimated use-
ful life of 5 years.
(n) Retirement benefits
The Company and its domestic consolidated subsidiaries have tax-
qualified defined benefit pension plans and retirement benefit plans.
However, during the year ended March 31, 2011, the Company has
transferred a tax-qualified defined benefit plan to a defined benefit
pension plan. Certain overseas consolidated subsidiaries also have
employees’ defined benefit pension plans.
The employees’ retirement benefit plans provide for a lump-sum
payment determined by reference to the current rate of pay, length
of service and conditions under which the termination occurs.
An allowance for employees’ retirement benefits has been pro-
vided based on the amount of the projected benefit obligation re-
duced by the pension plan assets at fair value at the end of the year.
Actuarial differences are amortized in the year following the year
in which the differences are recognized by the straight-line method
principally over a period of nine years, which falls within the esti-
mated average remaining years of service of the eligible employees.
Past service cost is amortized by the straight-line method prin-
cipally over a period of nine years, which falls within the estimated
average remaining years of service of the eligible employees.
Certain consolidated subsidiaries also provide for retirement
benefits to directors and corporate auditors based on their internal
rules at the amount which would be required to be paid if all direc-
tors and corporate auditors retired at the balance sheet date.
(o) Accrued expenses for overhaul of vessels
Vessels of the Company and its consolidated subsidiaries are sub-
ject to periodic overhaul. An accrual is provided on the basis of the
estimated amount of total expenses expected to be incurred for
overhauling the vessels.
(p) Derivatives and hedging activities
The Company and its consolidated subsidiaries utilize derivatives
to hedge the risk arising from fluctuation in foreign currency ex-
change rates, interest rates and market prices. under their deriva-
tives policies, trading in derivatives is not entered into for specula-
tive purposes.
Derivatives positions are carried at fair value with any changes
in unrealized gain or loss credited or charged to income, except for
those which meet the criteria for deferral hedge accounting under
which unrealized gain or loss, net of the applicable income taxes, is
reported as a component of net assets.
If interest rate swap contracts are used as hedges and meet
certain hedging criteria, the net amount to be paid or received un-
der the interest rate swap contract is added to or deducted from
the interest on the assets or liabilities for which the swap contract
is executed.
Forward foreign exchange contracts which meet certain criteria
are accounted for by the allocation method which requires that rec-
ognized foreign currency receivables or payables be translated at
the corresponding contract rates.
(q) Income taxes
Deferred income taxes have been recognized with respect to the
differences between financial reporting and the tax bases of the
assets and liabilities. Deferred income taxes are measured at the
rates which are expected to apply to the period when each asset or
liability is realized, based on the tax rates which have been enacted
as of the balance sheet date or are subsequently enacted.
(r) Distribution of retained earnings
under the Law and the Company’s Articles of Incorporation, the
distribution of retained earnings with respect to a given fiscal year
end is made by resolution of the shareholders at a general meeting
held subsequent to the close of the financial year. The distribution
of retained earnings with respect to the interim financial period is
made by resolution of the Board of Directors.
(s) Revenues and related costs
Revenues of the Company and its consolidated subsidiaries from
cargo freight and the related costs and expenses, except for those
from container vessels, are recognized in full as of the dates on
which the vessels complete their respective voyages (the voyage
completion method). Revenues from container vessels are recog-
nized, based on the passage of the transportation period (the com-
plex transportation progress method). The related costs and ex-
penses are charged to income as incurred. Revenues and costs with
respect to charter services are accounted for on an accrual basis.
2. Changes in Method of Accounting(a) Accounting Standard for Asset Retirement Obligations
Effective the year ended March 31, 2011, the Company and its do-
mestic consolidated subsidiaries have adopted “Accounting Stan-
dard for Asset Retirement Obligations” (Accounting Standards
Board of Japan (“ASBJ”) Statement No. 18 issued on March 31,
2008) and “Guidance on Accounting Standard for Asset Retirement
Obligations” (ASBJ Guidance No. 21 issued on March 31, 2008). As
a result of this adoption, operating income decreased by ¥3 million
($36 thousand) and income before income taxes and minority inter-
ests decreased by ¥385 million ($4,630 thousand) for the year end-
ed March 31, 2011 from the amounts which would have been re-
corded under the method applied in the previous year.
(b) Accounting Standard for Equity Method of
Accounting for Investments
Effective the year ended March 31, 2011, the Company and its con-
solidated subsidiaries have adopted “Accounting Standard for Eq-
uity Method of Accounting for Investments” (ASBJ Statement No. 16
issued on March 10, 2008) and “Practical Solution on unification of
Accounting Policies Applied to Associates Accounted for using the
Equity Method” (ASBJ Practical Issue Task Force No. 24 issued on
March 10, 2008). The effect of this adoption on the consolidated op-
erating results for the year ended March 31, 2011 was nil.
(c) Accounting Standard for Presentation of
Comprehensive Income
Effective the year ended March 31, 2011, the Company and its con-
solidated subsidiaries have adopted “Accounting Standard for Pre-
sentation of Comprehensive Income” (ASBJ Statement No. 25 is-
sued on June 30, 2010). The amount of accumulated other
comprehensive income and total accumulated other comprehen-
sive income in the consolidated balance sheets for the year ended
March 31, 2010 were previously presented as valuation and trans-
lation adjustments and total valuation and translation adjustments
in the prior years’ consolidated balance sheet, respectively.
(d) Accounting Standard for Business Combinations
Effective the year ended March 31, 2011, the Company and its con-
solidated subsidiaries have adopted “Accounting Standard for
Business Combinations” (ASBJ Statement No. 21 issued on De-
cember 26, 2008) and “Revised Guidance on Accounting Standard
for Business Combinations and Accounting Standard for Business
Divestitures” (ASBJ Guidance No. 10, Revised 2008).
(e) Accounting Standard for Disclosures about Segments of an
Enterprise and Related Information
Effective the year ended March 31, 2011, the Group has adopted
“Revised Accounting Standard for Disclosures about Segments of
an Enterprise and Related Information” (ASBJ Statement No. 17 re-
vised on March 27, 2009) and “Guidance on the Accounting Stan-
dard for Disclosures about Segments of an Enterprise and Related
Information” (ASBJ Guidance No. 20 revised on March 21, 2008).
(f) Accounting Standard for Employees’ Retirement Benefits
Effective the year ended March 31, 2010, the Company and its con-
solidated subsidiaries adopted “Partial Amendments to Accounting
Standard for Retirement Benefits (Part 3)” (ASBJ Statement No.19,
issued on July 31, 2008). The adoption of this standard had no ef-
fect on the consolidated operating results for the year ended March
31, 2010.
(g) Accounting Standard for Financial Instruments
Effective the year ended March 31, 2010, the Company and its con-
solidated subsidiaries adopted “Accounting Standard for Financial
Instruments” (ASBJ Statement No. 10, revised on March 10, 2008)
and “Guidance on Disclosures about Fair Value of Financial Instru-
ments” and (ASBJ Guidance No. 19, issued on March 10, 2008).
3. Marketable Securities and Investments in SecuritiesAt March 31, 2011, marketable securities and investments in secu-
rities with quoted market prices classified as held-to-maturity debt
securities are summarized as follows:
Millions of yen
2011Carrying
valueEstimatedfair value
Unrealizedloss
Securities whose estimated fair value does not exceed their carrying value:
Government and municipal bonds ¥24,999 ¥24,998 ¥(1)
Total ¥24,999 ¥24,998 ¥(1)
Thousands of U.S. dollars
2011Carrying
valueEstimatedfair value
Unrealizedloss
Securities whose estimated fair value does not exceed their carrying value:
Government and municipal bonds $300,649 $300,637 $(12)
Total $300,649 $300,637 $(12)
66 KAWASAKI KISEN KAISHA, LTD. 67ANNuAL REPORT 2011

At March 31, 2011 and 2010, marketable securities and invest-
ments in securities with quoted market prices classified as other
securities are summarized as follows:Millions of yen
2011Carrying
valueAcquisition
costsUnrealizedgain (loss)
Securities whose carrying value exceeds their acquisition costs:
Equity securities ¥64,281 ¥58,117 ¥6,164
Securities whose carrying value does not exceed their acquisition costs:
Equity securities 310 365 (55)
Total ¥64,591 ¥58,482 ¥6,109
Thousands of U.S. dollars
2011Carrying
valueAcquisition
costsUnrealizedgain (loss)
Securities whose carrying value exceeds their acquisition costs:
Equity securities $773,073 $698,941 $74,132
Securities whose carrying value does not exceed their acquisition costs:
Equity securities 3,728 4,390 (662)
Total $776,801 $703,331 $73,470
Millions of yen
2010Carrying
valueAcquisition
costsUnrealizedgain (loss)
Securities whose carrying value exceeds their acquisition costs:
Equity securities ¥71,812 ¥56,199 ¥15,613
Securities whose carrying value does not exceed their acquisition costs:
Equity securities 536 576 (40)
Total ¥72,348 ¥56,775 ¥15,573
* The above table does not include unlisted equity securities (as reflected in the accompanying consolidated balance sheet in the amounts of ¥8,421 million at March 31, 2010) due to the difficulty of measuring fair value without available quoted market prices.
Proceeds from sales of investments in securities classified as other
securities for the years ended March 31, 2011 and 2010 are sum-
marized as follows:
Millions of yenThousands of U.S. dollars
2011 2010 2011
Proceeds from sales ¥860 ¥2,006 $10,343
Aggregate gain 35 182 421
Aggregate loss (0) (183) (0)
During the year ended March 31, 2011, securities classified as in-
vestments in unconsolidated subsidiaries and affiliates of ¥2,079
million ($25,003 thousand) were reclassified as investments in se-
curities due to a reduction in the Company’s ownership ratio of
certain unconsolidated subsidiaries and affiliates.
4. InventoriesInventories as of March 31, 2011 and 2010 are summarized as
follows:
Millions of yenThousands of U.S. dollars
2011 2010 2011
Raw materials and supplies ¥34,412 ¥26,511 $413,855
Others 165 84 1,984
Total ¥34,577 ¥26,595 $415,839
5. Loss on Impairment of Fixed AssetsLoss on impairment of fixed assets for the year ended March 31,
2010 was as follows:Millions of yen
Asset Description Usage Classification 2010
Assets for containership business
Assets for containership business
Vessels and construction in progress
¥ 8,898
Others Idle assets Land 8
Total ¥ 8,906
Disclosure of loss on impairment for the year ended March 31, 2011
was omitted because the amount was immaterial.
The Company and its consolidated subsidiaries group fixed as-
sets for business use based on the smallest identifiable groups of
assets generating cash flows considering income and expenditure
generating units; however, they group other business use assets
and idle assets individually.
For the year ended March 31, 2010, since profitability of the
containership business showed marked deterioration, the carrying
value was reduced to the respective recoverable amount and a loss
on impairment was recognized. The recoverable amount was mea-
sured as the net selling value, and the net selling value was reason-
ably measured by a third party.
Since the idle assets’ carrying value was deemed to be irre-
trievably lower than the respective recoverable amount mainly due
to decreasing land prices, the carrying value was reduced to their
respective recoverable amount and the loss on impairment was
recognized. The recoverable amount was measured as the net sell-
ing value, and the net selling value was reasonably measured main-
ly by appraisers.
6. GoodwillGoodwill and negative goodwill as of March 31, 2011 and 2010 are
summarized as follows:
Millions of yenThousands of U.S. dollars
2011 2010 2011
Goodwill ¥4,552 ¥7,456 $54,745
Negative goodwill (34) (63) (409)
Net ¥4,518 ¥7,393 $54,336
7. Short-Term Loans, Commercial Paper and Long-Term DebtShort-term loans from banks and insurance companies principally represent loans on deeds with average interest rates of 0.69 per cent and
0.86 per cent per annum at March 31, 2011 and 2010, respectively.
Commercial paper had an average interest rate of 0.16 per cent per annum at March 31, 2010.
Long-term debt at March 31, 2011 and 2010 consisted of the following:
Millions of yenThousands of U.S. dollars
2011 2010 2011
Loans from banks and insurance companies due in installments from April 2011 through December 2028 at average interest rates of 1.16 per cent and 1.24 per cent per annum at March 31, 2011 and 2010, respectively
¥379,120 ¥399,183 $4,559,471
Euroyen zero coupon convertible bonds with stock acquisition rights in Japanese yen, due March 22, 2011 — 2,145 —
Euroyen zero coupon convertible bonds with stock acquisition rights in Japanese yen, due April 4, 2013 25,496 25,496 306,626
1.48 per cent bonds in Japanese yen, due December 14, 2011 15,000 15,000 180,397
1.83 per cent bonds in Japanese yen, due April 14, 2014 15,000 15,000 180,397
1.46 per cent bonds in Japanese yen, due June 19, 2014 30,000 30,000 360,794
Bonds in Japanese yen, interest rate indexed to TIBOR, due July 16, 2019 4,833 5,211 58,124
Total 469,449 492,035 5,645,809
Less: Current portion (62,017) (52,938) (745,845)
¥407,432 ¥439,097 $4,899,964
The Euroyen zero coupon convertible bonds with stock acquisition
rights due 2013 are convertible at ¥851 ($10.23) per share subject
to adjustment for certain events including stock splits.
At March 31, 2011, if all the outstanding convertible bonds had
been converted at the above conversion price, 29,960 thousand
new shares of common stock would have been issuable.
The aggregate annual maturities of long-term debt subsequent to
March 31, 2011 are summarized as follows:
Year ending March 31, Millions of yenThousands of U.S. dollars
2012 ¥ 62,017 $ 745,845
2013 51,151 615,165
2014 90,726 1,091,112
2015 95,330 1,146,482
2016 26,714 321,275
2017 and thereafter 143,511 1,725,930
Total ¥469,449 $5,645,809
A summary of assets pledged as collateral at March 31, 2011 for
short-term loans and the current portion of long-term loans in the
amount of ¥25,415 million ($305,652 thousand), long-term loans of
¥217,196 million ($2,612,099 thousand) and loans to be incurred in
the future is presented below:
Millions of yenThousands of U.S. dollars
Vessels at net book value ¥299,282 $3,599,302
Buildings and structures at net book value 12,014 144,486
Investments in securities 6,831 82,153
Other 5,560 66,867
Total ¥323,687 $3,892,808
Investments in securities of ¥6,831 million ($82,153 thousand) were
pledged as collateral to secure future loans for investments in ves-
sels and equipment of subsidiaries and affiliates. Therefore, no cor-
responding liabilities existed as of March 31, 2011.
Out of above vessels at net book value of ¥299,282 million
($3,599,302 thousand), ¥5,320 million ($63,981 thousand) were
pledged as collateral for entrusted guarantees.
8. Income TaxesThe Company and its domestic consolidated subsidiaries are sub-
ject to a number of taxes based on income, which, in the aggre-
gate, resulted in a statutory tax rate of approximately 37.6 per cent
for the years ended March 31, 2011 and 2010.
A reconciliation between the statutory tax rate and the effective
tax rate as a percentage of income before income taxes and minor-
ity interests for the year ended March 31, 2011 has been omitted
because the difference between these tax rates was less than 5%
of the statutory tax rate.
A reconciliation between the statutory tax rate and the effective
tax rate as a percentage of income before income taxes and minor-
ity interests for the year ended March 31, 2010 has been omitted
because a loss before income taxes and minority interests was re-
corded for the year ended March 31, 2010.
68 KAWASAKI KISEN KAISHA, LTD. 69ANNuAL REPORT 2011

The tax effects of temporary differences which gave rise to significant portions of the deferred tax assets and liabilities at March 31, 2011 and
2010 are analyzed as follows:
Millions of yenThousands of U.S. dollars
2011 2010 2011
Deferred tax assets:
Allowance for employees’ retirement benefits ¥ 2,752 ¥ 2,900 $ 33,097
Loss on impairment of fixed assets 880 1,643 10,583
Elimination of intercompany profit 991 1,100 11,918
Non-deductible allowances 7,580 13,925 91,161
Accounts and notes payable—trade 3,495 3,653 42,032
Deferred loss on hedges 18,641 7,974 224,185
unrealized holding loss on investments in securities 1,062 — 12,772
Net operating loss carry forwards 16,172 24,311 194,492
Other 1,830 3,723 22,009
Gross deferred tax assets 53,403 59,229 642,249
Valuation allowance (2,737) (3,164) (32,916)
Total deferred tax assets 50,666 56,065 609,333
Deferred tax liabilities:
Reserve for special depreciation (999) (1,313) (12,014)
Deferred gain on tangible fixed assets for tax purposes (1,818) (2,191) (21,864)
unrealized holding gain on investments in securities (1,463) (7,487) (17,595)
Accelerated depreciation in overseas subsidiaries (1,624) (1,371) (19,531)
Tax effect of undistributed earnings of overseas subsidiaries and affiliates accounted for by the equity method (539) (489) (6,482)
Other (1,328) (2,168) (15,972)
Total deferred tax liabilities (7,771) (15,019) (93,458)
Net deferred tax assets ¥42,895 ¥ 41,046 $515,875
Future minimum lease payments subsequent to March 31, 2011 for
finance leases accounted for as operating leases are summarized
as follows:
Year ending March 31, Millions of yenThousands of U.S. dollars
2012 ¥ 4,527 $ 54,444
2013 and thereafter 18,940 227,781
Total ¥23,467 $282,225
Future minimum lease payments or receipts subsequent to March
31, 2011 for non-cancellable operating leases are summarized as
follows:
(As lessees)
Year ending March 31, Millions of yenThousands of U.S. dollars
2012 ¥ 24,492 $ 294,552
2013 and thereafter 116,398 1,399,856
Total ¥140,890 $1,694,408
(As lessors)
Year ending March 31, Millions of yenThousands of U.S. dollars
2012 ¥ 280 $ 3,367
2013 and thereafter 834 10,030
Total ¥1,114 $13,397
10. Retirement BenefitsThe following table sets forth the funded and accrued status of the
pension plans and the amounts recognized in the accompanying
consolidated balance sheets as of March 31, 2011 and 2010 for the
Company’s and its consolidated subsidiaries’ defined benefit pen-
sion plans:
Millions of yenThousands of U.S. dollars
2011 2010 2011
Retirement benefit obligation* ¥(24,596) ¥(25,724) $(295,803)
Fair value of pension plan assets 15,990 16,179 192,303
Net unfunded benefit obligation (8,606) (9,545) (103,500)
unrecognized actuarial differences 1,130 1,923 13,590
unrecognized past service cost 486 544 5,845
Net retirement benefit obligation (6,990) (7,078) (84,065)
Prepaid pension cost 804 931 9,669
Allowance for employees’ retirement benefits ¥ (7,794) ¥ (8,009) $ (93,734)
* Certain domestic consolidated subsidiaries have calculated their retirement benefit obliga-tion based on the amount which would be payable at the year end if all eligible employees terminated their services voluntarily.
During the year ended March 31, 2011, the Company has trans-
ferred a tax-qualified defined benefit pension plan to a defined ben-
efit pension plan. This transfer has no effect on the results of opera-
tions for the year ended March 31, 2011.
During the year ended March 31, 2009, an overseas consolidated
subsidiary has transferred a portion of its above defined benefit
pension plan to a defined contribution pension plan.
The effect of the transfer as of March 31, 2010 is outlined as
follows:
Millions of yen
2010
Decrease in retirement benefit obligation ¥(550)
unrecognized actuarial differences 347
Decrease in allowance for employees’ retirement benefits ¥(203)
The components of retirement benefit expenses for the years end-
ed March 31, 2011 and 2010 are outlined as follows:
Millions of yenThousands of U.S. dollars
2011 2010 2011
Service cost* ¥1,785 ¥1,687 $21,467
Interest cost 396 396 4,762
Expected return on pension plan assets (145) (246) (1,744)
Amortization:
Actuarial differences 364 632 4,379
Past service cost 125 165 1,503
Retirement benefit expenses ¥2,525 ¥2,634 $30,367
Gain on transfer of defined benefit pension plan to a defined contribution pension plan
— (203) —
Contribution to defined contribution pension plan 80 96 962
Total retirement benefit expenses ¥2,605 ¥2,527 $31,329
* Retirement benefit expenses for certain domestic consolidated subsidiaries, whose benefit obligation is calculated based on the amount which would be payable at the year end if all eligible employees terminated their services voluntarily (a simplified method), have been fully included in service cost.
The assumptions used in accounting for the above plans for the
years ended March 31, 2011 and 2010 are as follows:
2011 2010
Discount rate Mainly 2.0% Mainly 2.0%
Expected rates of return on plan assets Mainly 0.80% Mainly 2.25%
11. Shareholders’ Equity The Law provides that an amount equal to 10% of the amount to be
disbursed as distributions of capital surplus (other than the capital
reserve) and retained earnings (other than the legal reserve) be
transferred to the capital reserve and the legal reserve, respectively,
until the sum of the capital reserve and the legal reserve equals
25% of the capital stock account. Such distributions can be made
9. LeasesThe following pro forma amounts represent the acquisition costs,
accumulated depreciation and net book value of the leased prop-
erty at March 31, 2011 and 2010, which would have been reflected
in the accompanying consolidated balance sheets if finance lease
accounting had been applied to the finance leases currently ac-
counted for as operating leases:
Millions of yen
At March 31, 2011Vessels Equipment Other Total
Acquisition costs ¥22,413 ¥ 34,844 ¥ 2,284 ¥ 59,541
Accumulated depreciation (4,070) (27,374) (1,322) (32,766)
Net book value ¥18,343 ¥ 7,470 ¥ 962 ¥ 26,775
Thousands of U.S. dollars
At March 31, 2011Vessels Equipment Other Total
Acquisition costs $269,549 $ 419,050 $ 27,468 $ 716,067
Accumulated depreciation (48,948) (329,212) (15,899) (394,059)
Net book value $220,601 $ 89,838 $ 11,569 $ 322,008
Millions of yen
At March 31, 2010Vessels Equipment Other Total
Acquisition costs ¥22,413 ¥ 38,745 ¥ 2,887 ¥ 64,045
Accumulated depreciation (3,096) (27,187) (1,526) (31,809)
Net book value ¥19,317 ¥ 11,558 ¥ 1,361 ¥ 32,236
Lease payments related to finance leases accounted for as operat-
ing leases and depreciation and interest expense for the years
ended March 31, 2011 and 2010 are summarized as follows:
Millions of yenThousands of U.S. dollars
2011 2010 2011
Lease payments ¥5,578 ¥6,738 $67,084
Depreciation 5,414 6,570 65,111
Interest expense 818 1,039 9,838
70 KAWASAKI KISEN KAISHA, LTD. 71ANNuAL REPORT 2011

at any time by resolution of the shareholders, or by the Board of
Directors if certain conditions are met.
The Company’s legal reserve included in retained earnings at
March 31, 2011 and 2010 amounted to ¥2,540 million ($30,547
thousand).
In accordance with the former Commercial Code of Japan (the
“Code”), stock option plans for certain directors and certain em-
ployees of the Company and certain directors of certain subsidiar-
ies were approved at annual general meetings of the shareholders
of the Company. The 2002 stock option plan (the 2002 plan) was
approved by shareholders of the Company on June 27, 2002. The
2003 stock option plan (the 2003 plan) was approved by sharehold-
ers of the Company on June 27, 2003. The 2004 stock option plan
(the 2004 plan) was approved by shareholders of the Company on
June 29, 2004. The 2005 stock option plan (the 2005 plan) was ap-
proved by shareholders of the Company on June 29, 2005.
The stock option plans of the Company are summarized as follows:
Stock option plan Date of grant Exercisable period
The 2002 plan September 2, 2002 From June 28, 2004 up to and including June 27, 2012
The 2003 plan July 24, 2003 From June 28, 2005 up to and including June 27, 2013
The 2004 plan August 9, 2004 From June 30, 2006 up to and including June 29, 2014
The 2005 plan July 25, 2005 From June 30, 2007 up to and including June 29, 2015
Movements in the number of stock options for each stock option plan of the Company during the years ended March 31, 2011 and 2010 are
summarized as follows:The 2002 plan The 2003 plan The 2004 plan The 2005 plan
Number of stock options*:
Outstanding as of March 31, 2009 22 263 106 194
Vested — — — —
Exercised — 8 — 7
Expired — — — —
Outstanding as of March 31, 2010 22 255 106 187
Vested — — — —
Exercised 4 16 — —
Expired — — — —
Outstanding as of March 31, 2011 18 239 106 187
* One stock option gives the holder the right to purchase one thousand shares of the Company’s common stock.
The unit price of stock options for each stock option plan of the Company during the years ended March 31, 2011 and 2010 is summarized
as follows:Yen
The 2002 plan The 2003 plan The 2004 plan The 2005 plan
unit price of stock options:
Exercise price as of March 31, 2010 ¥156 ¥278 ¥633 ¥693
Average market price per share at exercise during the year ended March 31, 2010 — 408 — 352
Exercise price as of March 31, 2011 156 278 633 693
Average market price per share at exercise during the year ended March 31, 2011 355 348 — —
U.S. dollars
The 2002 plan The 2003 plan The 2004 plan The 2005 plan
unit price of stock options:
Exercise price as of March 31, 2011 $1.88 $3.34 $ 7.61 $8.33
Average market price per share at exercise during the year ended March 31, 2011 4.27 4.19 — —
The exercise prices above are subject to adjustment in the case of certain events including stock splits.
Movements in common stock and treasury stock of the Company for the years ended March 31, 2011 and 2010 are summarized as follows:
Number of shares (Thousands of units)
March 31, 2010 Increase Decrease March 31, 2011
Common stock 765,382 — — 765,382
Treasury stock 1,809 52 271 1,590
Number of shares (Thousands of units)
March 31, 2009 Increase Decrease March 31, 2010
Common stock 638,882 126,500 — 765,382
Treasury stock 1,738 95 24 1,809
12. Land RevaluationThe Company and certain domestic consolidated subsidiaries re-
valued the land used in their business in accordance with the Land
Revaluation Law (Law No. 34, March 31, 1998) and the Law to Par-
tially Revise the Land Revaluation Law (Law No. 19, March 31,
2001). The effect of this revaluation has been recorded as revalua-
tion reserve for land in net assets, excluding the related deferred
income taxes on land revaluation.
The timing of the revaluation was effective March 31, 2002.
Certain affiliates accounted for by the equity method also reval-
ued the land used in their business in accordance with the Land Re-
valuation Law (Law No. 34, March 31, 1998) and the Law to Partially
Revise the Land Revaluation Law (Law No. 19, March 31, 2001).
At March 31, 2011 and 2010, the fair value of these lands were
lower than its carrying value after revaluation by ¥899 million
($10,812 thousand) and ¥629 million, respectively.
13. Commitments and Contingent LiabilitiesAt March 31, 2011, commitments made by the Company and its
consolidated subsidiaries for the construction of vessels amounted
to ¥303,100 million ($3,645,219 thousand).
Contingent liabilities for guarantees of loans to affiliates and
third-party companies, reservation of guarantees mainly for swap
contracts, and joint indebtedness principally related to co-owner-
ship of vessels as of March 31, 2011 are as follows:
Millions of yenThousands of U.S. dollars
Guarantee of loans ¥16,756 $201,515
Reservation of guarantee 1,721 20,698
Joint indebtedness 4,836 58,160
Total ¥23,313 $280,373
14. Financial InstrumentsStatus of financial instruments
The Company and its consolidated subsidiaries (the “Group”) ob-
tains necessary funding, mainly through bank loans and the issu-
ance of bonds, in accordance with their capital expenditure pro-
grams. Excess funds are invested in highly liquid financial assets,
and operating funds are financed by bank loans and commercial
paper. The Group utilizes derivatives only for reducing risks, but
does not utilize them for speculation.
Trade accounts and notes receivables are exposed to credit risk
in the event of the nonperformance by counterparties. As revenues
from marine transportation are mainly denominated in foreign cur-
rencies, trade receivables are exposed to foreign currency exchange
risk and a portion of them, net of trade payables denominated in the
same foreign currencies, are hedged by forward foreign exchange
contracts. Future trade receivables such as for freight and chartered
vessels, are exposed to market risks, and some of them are hedged
by forward freight agreements. The Group holds marketable securi-
ties and investments in securities, which are mainly issued by com-
panies who have a business relationship or capital alliance with the
Group, and these securities exposed to the risk of fluctuation in
market prices. The Group also has long-term loans receivable main-
ly from other subsidiaries and affiliates.
The Group has trade account and notes payables which have
payment due dates within one year. Funds for certain capital expen-
ditures, such as construction of vessels denominated in foreign cur-
rency, are exposed to foreign currency exchange risk, some of
which are hedged by forward foreign exchange contracts. Future
trade payables such as payments for bunker fuel are exposed to the
risk of fluctuation of market prices, and some of them are hedged by
swap contracts. Loans payable, bonds, bonds with stock acquisi-
tion rights and lease obligations for finance lease contracts are taken
out principally for the purpose of making capital investments. The
repayment dates of long-term debt extend up to seventeen years
subsequent to the balance sheet date. Certain elements of these
transactions are exposed to interest rate fluctuation risk. The Group
hedges this risk by entering into interest rate swap transactions. The
Group has entered into currency swap contracts to minimize foreign
currency exchange risk against trade payables.
Regarding derivatives, the Group has entered into: 1) forward
foreign exchange contracts and currency swaps to hedge foreign
currency exchange risk arising from receivables and payables de-
nominated in foreign currencies and funds for business investment;
2) bunker swaps to hedge the risk of bunker fuel price fluctuation;
3) forward freight agreements to hedge the risk of fluctuation of
market prices; and 4) interest-rate swaps to hedge the risk of inter-
est rate fluctuation arising from interest payables for long-term pay-
ables and bonds.
72 KAWASAKI KISEN KAISHA, LTD. 73ANNuAL REPORT 2011

For information on hedge accounting policies of the Group, see
1. Summary of Significant Accounting Policies (p) Derivatives and
hedging activities.
The Company monitors regularly the condition of significant
business partners by each related business division with whom the
Company has accounts receivable for business or loans receivable,
and manages the outstanding balances and due dates by counter-
parties, to minimize the risk of default arising from any decline in the
financial condition of counterparties. Its consolidated subsidiaries
also monitor the condition of accounts receivables and loan receiv-
ables under a similar management policy.
The Group believes that the credit risk of derivatives is insig-
nificant, as the Group enters into derivatives transactions only with
financial institutions that have a sound credit profile.
For trade receivables and payables denominated in foreign cur-
rencies and future loans related investment in vessels, the Company
has entered into currency swap and forward foreign exchange con-
tracts to hedge foreign currency exchange risk rate fluctuation, and
interest-rate swaps to minimize interest rate fluctuation risk of loans
and bonds. For marketable securities and investments in securities,
the Company continuously reviews the condition of holding securi-
ties, considering the stock market and the relationship with issuing
companies, taking into account market value of securities and finan-
cial condition of issuing in accordance with internal regulations.
The Company enters into derivative transactions with the ap-
proval from authorized officers in accordance with internal regula-
tions, which set forth transaction authority and maximum upper limit
on positions. Results of derivative transactions are regularly reported
at the executive officers meeting. Its consolidated subsidiaries also
manage derivative transactions under the same regulations.
The Company manages liquidity risk by maintaining liquid in-
struments based on reports from each business group.
The fair value of financial instruments is based on market value,
if available. When there is no market price, fair value is reasonably
estimated. Fair value can fluctuate because different assumptions
may be adopted for calculation of fair value considering various
factors. In addition, the notional amount of derivatives in Note 15.
Derivatives and Hedging Activities are not necessarily indicative of
the actual market exposure involved in the derivative transactions.
Millions of yen
2010Carrying
valueEstimatedfair value
Unrealizedloss
Assets
Cash and deposits ¥ 96,059 ¥ 96,059 ¥ —
Accounts and notes receivable—trade 76,675 76,675 —
Investments in securities 76,905 73,854 (3,051)
Total assets ¥249,639 ¥246,588 ¥(3,051)
Liabilities
Accounts and notes payable—trade ¥ 70,311 ¥ 70,311 ¥ —
Short-term loans, inclusive of current portion of long-term loans
61,960 62,137 (177)
Bonds 90,329 90,391 (62)
Long-term debt, exclusive of bonds 348,768 349,989 (1,221)
Total liabilities ¥571,368 ¥572,828 ¥(1,460)
Derivative transactions* ¥ (40,885) ¥ (41,912) ¥(1,027)
* The value of assets and liabilities arising from derivative transactions is shown at net value, and the amounts in parentheses represent net liability position.
Fair value of cash and deposits, and accounts and notes receiv-
able-trade is based on carrying value as most of them are settled
within a short term.
Fair value of investments in securities is based on market prices.
Fair value of accounts and notes payable-trade, and short-term
loans is based on carrying value as most of them are settled within
a short-term, except for the current portion of long-term loans
whose fair value is based on same method as long-term loans.
Fair value of bonds is based on mainly market prices.
Fair value of long-term loans is mainly based on the present
value of the total amount including principal and interest, discount-
ed by the expected interest rate assuming a new borrowing of the
same loan using the balance as of the end of the period.
The financial instruments whose fair value is difficult to determine
as of March 31, 2011 and 2010 are summarized as follows.
Millions of yenThousands of U.S. dollars
2011 2010 2011
unlisted investments in securities ¥33,598 ¥36,011 $404,065
For unlisted investments in securities, there is neither market value
nor estimated future cash flow, and it is difficult to determine the
fair value. Therefore, the fair value of unlisted investments in securi-
ties is not included in investments in securities in the summary table
of financial instruments.
Estimated Fair Value of Financial Instruments
The carrying value of financial instruments on the consolidated bal-
ance sheets as of March 31, 2011 and 2010 and unrealized losses
are shown in the following table. The table does not include finan-
cial instruments for which it is extremely difficult to determine the
fair value.Millions of yen
2011Carrying
valueEstimatedfair value
Unrealizedloss
Assets
Cash and deposits ¥ 74,064 ¥ 74,064 ¥ —
Accounts and notes receivable—trade 78,314 78,314 —
Investments in securities 67,716 65,282 (2,434)
Total assets ¥220,094 ¥217,660 ¥(2,434)
Liabilities
Accounts and notes payable—trade ¥ 76,750 ¥ 76,750 ¥ —
Short-term loans, inclusive of current portion of long-term loans
55,783 56,049 (266)
Bonds 74,951 75,618 (667)
Long-term loans 332,481 334,377 (1,896)
Total liabilities ¥539,965 ¥542,794 ¥(2,829)
Derivative transactions* ¥ (77,567) ¥ (78,419) ¥ (852)
Thousands of U.S. dollars
2011Carrying
valueEstimatedfair value
Unrealizedloss
Assets
Cash and deposits $ 890,728 $ 890,728 $ —
Accounts and notes receivable—trade 941,840 941,840 —
Investments in securities 814,383 785,111 (29,272)
Total assets $2,646,951 $2,617,679 $(29,272)
Liabilities
Accounts and notes payable—trade $ 923,031 $ 923,031 $ —
Short-term loans, inclusive of current portion of long-term loans
670,872 674,071 (3,199)
Bonds 901,395 909,417 (8,022)
Long-term loans 3,998,569 4,021,371 (22,802)
Total liabilities $6,493,867 $6,527,890 $(34,023)
Derivative transactions* $ (932,856) $ (943,103) $(10,247)
The redemption schedule as of March 31, 2011 and 2010 for cash and deposits, financial instruments receivable or payable and held-to-
maturity debt securities are summarized as follows:Millions of yen
2011
Within 1 year Over 1 year within 5 years
Over 5 years within 10 years Over 10 years
Cash and deposits ¥ 74,064 ¥ — ¥— ¥—
Accounts and notes receivable—trade 78,314 — — —
Investments in securities
Held-to-maturity securities
(1) Government and municipal bonds 24,997 1 1 —
(2) Corporate bonds — 2,078 — —
Accounts and notes payable—trade 76,750 — — —
Total ¥254,125 ¥2,079 ¥ 1 ¥—
Thousands of U.S. dollars
2011
Within 1 year Over 1 year within 5 years
Over 5 years within 10 years Over 10 years
Cash and deposits $ 890,728 $ — $— $—
Accounts and notes receivable—trade 941,840 — — —
Investments in securities
Held-to-maturity securities
(1) Government and municipal bonds 300,625 12 12 —
(2) Corporate bonds — 24,991 — —
Accounts and notes payable—trade 923,031 — — —
Total $3,056,224 $25,003 $12 $—
74 KAWASAKI KISEN KAISHA, LTD. 75ANNuAL REPORT 2011

Thousands of U.S. dollars
2011
Method of hedge accounting Transaction Major hedged item
Contract value (notional principal
amount)
Contract value (notional principal
amount) over one year Estimated fair value
Deferral hedge Forward exchange contract
Buying:
uSD Capital expenditures $1,489,657 $ 519,687 $(161,191)
JPY Capital expenditures 95,238 68,070 (8,924)
EuR Capital expenditures 505 — 24
Currency swaps
Receiving uSD, paying JPY Chartering expense and lease expense 3,912,435 3,596,332 (602,598)
Receiving uSD, paying EuR Chartering expense 105,496 92,784 (12)
Receiving EuR, paying uSD Accounts receivable—trade 29,850 29,850 (301)
Currency options positions
Buying:
uSD Lease expense, others 3,271 1,924 (589)
uSD Accounts receivable—trade 698 — (12)
Selling:
uSD Accounts receivable—trade 697 — 25
Total $5,637,847 $4,308,647 $(773,578)
Millions of yen
2010
Method of hedge accounting Transaction Major hedged item
Contract value (notional principal
amount)
Contract value (notional principal
amount) over one year Estimated fair value
Deferral hedge Forward exchange contract
Buying:
uSD Capital expenditures ¥158,372 ¥ 82,259 ¥ (5,479)
JPY Capital expenditures 10,509 7,919 88
Other — 2,794 — 592
Currency swaps
Receiving uSD, paying JPY Chartering expense and lease expense 348,158 324,807 (23,196)
Receiving uSD, paying EuR Chartering expense 9,914 8,720 (424)
Currency options positions
Buying:
uSD Lease expense, others 495 272 (33)
Selling:
uSD Accounts receivable—trade 111 — (3)
Total ¥530,353 ¥423,977 ¥(28,455)
Interest-rate related transactionsMillions of yen
2011
Method of hedge accounting Transaction Major hedged item
Contract value (notional principal
amount)
Contract value (notional principal
amount) over one year Estimated fair value
Deferral hedge Interest rate swap
Receive floating/Pay fixed Long-term loans payable ¥141,921 ¥130,050 ¥(13,244)
Special treatment interest rate swap
Interest rate swap
Receive floating/Pay fixed Long-term loans payable 22,284 17,559 (852)
Total ¥164,205 ¥147,609 ¥(14,096)
Millions of yen
2010
Within 1 year Over 1 year within 5 years
Over 5 years within 10 years Over 10 years
Cash and deposits ¥ 96,059 ¥ — ¥— ¥—
Accounts and notes receivable—trade 76,675 — — —
Investments in securities
Held-to-maturity securities
(1) Government and municipal bonds — 2 1 —
(2) Corporate bonds — 2,326 — —
Accounts and notes payable—trade 70,311 — — —
Total ¥243,045 ¥2,328 ¥ 1 ¥—
15. Derivatives and Hedging ActivitiesThe Company and its consolidated subsidiaries have derivatives contracts such as foreign currencies exchange contracts, and currency
swaps and currency options positions to minimize the impact of fluctuation in foreign exchange rates on forecasted foreign currency transac-
tions. The Company and its consolidated subsidiaries have also entered into interest-rate swaps to minimize the impact of fluctuation in inter-
est rates related to their outstanding debt and lease transactions. In addition, the Company and its consolidated subsidiaries have entered
into bunker fuel swaps and freight futures in order to minimize the impact of market movements.
The estimated fair value of the derivatives positions outstanding qualifying for deferral hedge accounting March 31, 2011 and 2010 are sum-
marized as follows:
Currency-related transactionsMillions of yen
2011
Method of hedge accounting Transaction Major hedged item
Contract value (notional principal
amount)
Contract value (notional principal
amount) over one year Estimated fair value
Deferral hedge Forward exchange contract
Buying:
uSD Capital expenditures ¥123,865 ¥ 43,212 ¥(13,403)
JPY Capital expenditures 7,919 5,660 (742)
EuR Capital expenditures 42 — 2
Currency swaps
Receiving uSD, paying JPY Chartering expense and lease expense 325,319 299,035 (50,106)
Receiving uSD, paying EuR Chartering expense 8,772 7,715 (1)
Receiving EuR, paying uSD Accounts receivable—trade 2,482 2,482 (25)
Currency options positions
Buying:
uSD Lease expense, others 272 160 (49)
uSD Accounts receivable—trade 58 — (1)
Selling:
uSD Accounts receivable—trade 58 — 2
Total ¥468,787 ¥358,264 ¥(64,323)
76 KAWASAKI KISEN KAISHA, LTD. 77ANNuAL REPORT 2011

Thousands of U.S. dollars
2011
Method of hedge accounting Transaction Major hedged item
Contract value (notional principal
amount)
Contract value (notional principal
amount) over one year Estimated fair value
Deferral hedge Interest rate swap
Receive floating/Pay fixed Long-term loans payable $1,706,807 $1,564,041 $(159,278)
Special treatment interest rate swap
Interest rate swap
Receive floating/Pay fixed Long-term loans payable 267,998 211,172 (10,247)
Total $1,974,805 $1,775,213 $(169,525)
Millions of yen
2010
Method of hedge accounting Transaction Major hedged item
Contract value (notional principal
amount)
Contract value (notional principal
amount) over one year Estimated fair value
Deferral hedge Interest rate swap
Receive floating/Pay fixed Long-term loans payable ¥165,794 ¥140,608 ¥(12,578)
Receive fixed/Pay floating Long-term loans payable 156 — 0
Special treatment interest rate swap
Interest rate swap
Receive floating/Pay fixed Long-term loans payable 28,330 22,220 (1,027)
Total ¥194,280 ¥162,828 ¥(13,605)
OtherMillions of yen
2010
Method of hedge accounting Transaction Major hedged item
Contract value (notional principal
amount)
Contract value (notional principal
amount) over one year Estimated fair value
Deferral hedge Bunker swap Bunker fuel purchases ¥3,420 — ¥147
Total ¥3,420 — ¥147
Fair value is based on relevant prices quoted by financial institutions and others.
16. Consolidated Statement of Comprehensive LossComprehensive loss for the year ended March 31, 2010 for com-
parative purposes is as follows:Millions of yen
Comprehensive loss attributable to shareholders of the Company ¥(64,705)
Comprehensive income attributable to minority shareholders of consolidated subsidiaries 3,164
Total comprehensive loss ¥(61,541)
Other comprehensive income for the year ended March 31, 2010
for comparative purposes is as follows:Millions of yen
Net unrealized holding gain on investments in securities ¥ 12,678
Deferred loss on hedges (11,231)
Translation adjustments 1,926
Share of other comprehensive income of subsidiaries and affiliates accounted for by the equity method 1,157
Total other comprehensive income ¥ 4,530
Effective the year ended March 31, 2010, International Terminal Ser-
vice of Augusta S.r.l. has been excluded from consolidation because
of the sale of its shares. The book value of assets and liabilities ex-
cluded from consolidation as of the sale date was as follows:
Millions of yen
Current assets ¥ 784
Non-current assets 1,862
Total assets ¥2,646
Current liabilities ¥ —
Long-term liabilities —
Total liabilities ¥ —
18. Amounts per ShareAmounts per share at March 31, 2011 and 2010 and for the years
then ended are as follows:Yen U.S. dollars
2011 2010 2011
Net assets ¥381.87 ¥ 403.53 $4.59
Net income (loss):
Basic 40.08 (106.24) 0.48
Diluted 38.41 — 0.46
Cash dividends applicable to the year 9.50 — 0.11
Net assets per share have been computed based on the number of
shares of common stock outstanding at year end.
Basic net income per share has been computed based on the
net income attributable to shareholders of common stock and the
weighted-average number of shares of common stock outstanding
during the year. Diluted net income per share has been computed
based on the amount of net income attributable to the shareholders
of common stock and the weighted-average number of shares of
common stock outstanding during each year after giving effect to
the dilutive potential of the shares of common stock to be issued
upon the exercise of the stock options and the conversion of con-
vertible bonds.
17. Supplementary Information on Consolidated Statements of Cash Flows
Cash and cash equivalents in the accompanying consolidated
statements of cash flows for the years ended March 31, 2011 and
2010 are reconciled to cash and deposits reflected in the accompa-
nying consolidated balance sheets as of March 31, 2011 and 2010
as follows:
Millions of yenThousands of U.S. dollars
2011 2010 2011
Cash and deposits ¥74,064 ¥96,059 $ 890,728
Time deposits with a maturity of more than three months after the purchase date
(4,631) (3,937) (55,695)
Marketable securities 24,997 — 300,625
Cash and cash equivalents ¥94,430 ¥92,122 $1,135,658
However, diluted net income per share for the year ended
March 31, 2010 has not been presented because a net loss for the
year was recorded.
Cash dividends per share represent the cash dividends appli-
cable to the respective years together with the interim cash divi-
dends paid.
19. Segment Information(a) Segments information for the year ended March 31, 2011
1. Overview of reporting segments
The Company’s reporting segments are its structural units, for
which separate financial information is available, and which are
subject to periodic review by the Board of Directors in order to as-
sist decision-making on the allocation of managerial resources and
assessment of business performance.
The Group is a shipping business organization centering on
marine transportation service and has two reporting segments,
which are the containership business segment and the bulk ship-
ping business segment, considering the economic characteristics,
service contents and method of the provision and categorization of
the market and customers.
In addition, the bulk shipping business includes the following
services: dry bulk carrier service, car carrier service, energy trans-
portation and tanker service, heavy lift service and short sea, coast-
al and ferry service.
2. Calculation method of reporting segment income (loss)
Reporting segment income represents ordinary income (loss),
which consists of operating income (loss) and nonoperating in-
come/expenses. Nonoperating income/expenses mainly include
interest income, dividend income, interest expense, equity in earn-
ings (losses) of affiliates.
Intra-group revenues and transfers are intra-group transactions
which are based on market price and other.
78 KAWASAKI KISEN KAISHA, LTD. 79ANNuAL REPORT 2011

under the new segmentation policy applied by the Company, effective the year ended March 31, 2011, reporting segment information for the
year ended March 31, 2010 would have been presented as follows:Millions of yen
Year ended March 31, 2010
Containership Bulk shipping Other*1 TotalAdjustments and
eliminations*2 Consolidated
1. Revenues:
(1) Operating revenues from customers ¥358,525 ¥393,105 ¥ 86,403 ¥ 838,033 ¥ — ¥ 838,033
(2) Intra-group revenues and transfers 2,389 2,042 43,110 47,541 (47,541) —
2. Total Revenues 360,914 395,147 129,513 885,574 (47,541) 838,033
3. Segment (Loss) Income*3 ¥ (65,625) ¥ 1,071 ¥ 2,332 ¥ (62,222) ¥ (4,050) ¥ (66,272)
4. Segment Assets ¥170,402 ¥698,584 ¥155,879 ¥1,024,865 ¥ 19,020 ¥1,043,885
(1) Depreciation and amortization ¥ 5,189 ¥ 33,677 ¥ 5,527 ¥ 44,393 ¥ 888 ¥ 45,281
(2) Amortization of goodwill (58) 2,899 16 2,857 — 2,857
(3) Interest income 396 882 272 1,550 (405) 1,145
(4) Interest expenses 677 7,626 838 9,141 (383) 8,758
(5) Equity in earnings (loss) of affiliates 38 (661) 244 (379) — (379)
(6) Investments in affiliates accounted for by the equity method 6,407 6,957 5,021 18,385 — 18,385
(7) Increase in vessels, property and equipment, and intangible assets 24,022 149,359 6,509 179,890 1,598 181,488
*1 “Other” segment mainly consists of logistics and harbor transportation services.*2 (1) The adjustment and elimination of segment income of ¥4,050 million includes the following elements: ¥475 million of intersegment transaction eliminations and ¥3,575 million of corporate
profit, which are not distributed to specific segments. (2) The adjustment and elimination of segment assets of ¥19,020 million includes the following elements: ¥69,333 million of intersegment transaction eliminations and ¥88,353 million of corpo-
rate assets, which are not distributed to specific segments. (3) The adjustment and elimination of depreciation and amortization of ¥888 million is depreciation and amortization of assets that belong to the entire company, which are not distributed to
specific segments. (4) The adjustment and elimination of interest income of ¥405 million includes the following elements: ¥492 million of intersegment transaction eliminations and ¥87 million of interest income,
which are not distributed to specific segments. (5) The adjustment and elimination of interest expenses of ¥383 million includes the following elements: ¥492 million of intersegment transaction eliminations and ¥109 million of interest ex-
penses, which are not distributed to specific segments. (6) The adjustment of increase in vessels, property and equipment, and intangible assets of ¥1,598 million is the increase in assets that belong to the entire group, which are not distributed to
specific segments.*3 Segment (Loss) income is adjusted for the ordinary income (loss) as described in 2. Calculation method of reporting segment income (loss).
Revenues by countries or geographical areas for the year ended March 31, 2011 are summarized as follows:
Millions of yen
Year ended March 31, 2011Japan U.S.A. Europe Asia Other Total
Revenues ¥414,373 ¥182,447 ¥155,796 ¥198,980 ¥33,489 ¥985,085
Thousands of U.S. Dollars
Year ended March 31, 2011Japan U.S.A. Europe Asia Other Total
Revenues $4,983,440 $2,194,191 $1,873,674 $2,393,025 $402,754 $11,847,084
At March 31, 2011, vessels, property and equipment by countries or geographical areas are summarized as follows:
Millions of yen Thousands of U.S. Dollars
Year ended March 31, 2011 Year ended March 31, 2011Japan Other Total Japan Other Total
Vessels, property and equipment ¥437,431 ¥146,297 ¥583,728 $5,260,746 $1,759,434 $7,020,180
3. Information on operating revenues, income or loss, assets, and other items by each reporting segment
Reporting segment information for the years ended March 31, 2011 consisted of the following:
Millions of yen
Year ended March 31, 2011
Containership Bulk shipping Other*1 TotalAdjustments and
eliminations*2 Consolidated
1. Revenues:
(1) Operating revenues from customers ¥444,971 ¥ 447,111 ¥ 93,003 ¥ 985,085 ¥ — ¥ 985,085
(2) Intra-group revenues and transfers 2,438 1,736 41,619 45,793 (45,793) —
2. Total Revenues 447,409 448,847 134,622 1,030,878 (45,793) 985,085
3. Segment Income*3 ¥ 29,006 ¥ 16,991 ¥ 4,739 ¥ 50,736 ¥ (3,386) ¥ 47,350
4. Segment Assets ¥174,629 ¥ 659,509 ¥153,163 ¥ 987,301 ¥ 45,204 ¥1,032,505
(1) Depreciation and amortization ¥ 3,889 ¥ 34,314 ¥ 5,548 ¥ 43,751 ¥ 971 ¥ 44,722
(2) Amortization of goodwill (29) 2,895 7 2,873 — 2,873
(3) Interest income 315 552 147 1,014 (122) 892
(4) Interest expenses 695 7,442 531 8,668 (104) 8,564
(5) Equity in earning (loss) of affiliates 386 (381) 97 102 — 102
(6) Investments in affiliates accounted for by the equity method 5,804 5,435 5,110 16,349 — 16,349
(7) Increase in vessels, property and equipment, and intangible assets 27,882 116,797 3,576 148,255 738 148,993
Thousands of U.S. dollars
Year ended March 31, 2011
Containership Bulk shipping Other*1 TotalAdjustments and
eliminations*2 Consolidated
1. Revenues:
(1) Operating revenues from customers $5,351,425 $5,377,162 $1,118,497 $11,847,084 $ — $11,847,084
(2) Intra-group revenues and transfers 29,321 20,878 500,529 550,728 (550,728) —
2. Total Revenues 5,380,746 5,398,040 1,619,026 12,397,812 (550,728) 11,847,084
3. Segment Income*3 $ 348,839 $ 204,342 $ 56,993 $ 610,174 $ (40,721) $ 569,453
4. Segment Assets $2,100,168 $7,931,557 $1,842,008 $11,873,733 $ 543,645 $12,417,378
(1) Depreciation and amortization $ 46,771 $ 412,676 $ 66,723 $ 526,170 $ 11,677 $ 537,847
(2) Amortization of goodwill (349) 34,817 84 34,552 — 34,552
(3) Interest income 3,788 6,639 1,768 12,195 (1,467) 10,728
(4) Interest expenses 8,358 89,501 6,386 104,245 (1,250) 102,995
(5) Equity in earning (loss) of affiliates 4,642 (4,582) 1,167 1,227 — 1,227
(6) Investments in affiliates accounted for by the equity method 69,802 65,364 61,455 196,621 — 196,621
(7) Increase in vessels, property and equipment, and intangible assets 335,322 1,404,654 43,007 1,782,983 8,875 1,791,858
*1 “Other” segment mainly consists of logistics and harbor transportation services.*2 (1) The adjustment and elimination of segment income of ¥3,386 million ($40,721 thousand) includes the following elements: ¥134 million ($1,612 thousand) of intersegment transaction elimina-
tions and ¥3,520 million ($42,333 thousand) of corporate profit, which are not distributed to specific segments. (2) The adjustment and elimination of segment assets of ¥45,204 million ($543,645 thousand) includes the following elements: ¥64,054 million ($770,342 thousand) of intersegment transaction
eliminations and ¥109,258 million ($1,313,987 thousand) of corporate assets, which are not distributed to specific segments. (3) The adjustment and elimination of depreciation and amortization of ¥971 million ($11,677 thousand) is depreciation and amortization of assets that belong to the entire company, which are
not distributed to specific segments. (4) The adjustment and elimination of interest income of ¥122 million ($1,467 thousand) includes the following elements: ¥231 million ($2,778 thousand) of intersegment transaction eliminations
and ¥109 million ($1,311 thousand) of interest income, which are not distributed to specific segments. (5) The adjustment and elimination of interest expenses of ¥104 million ($1,250 thousand) includes the following elements: ¥231 million ($2,777 thousand) of intersegment transaction elimina-
tions and ¥127 million ($1,527 thousand) of interest expenses, which are not distributed to specific segments. (6) The adjustment and elimination of increase in vessels, property and equipment, and intangible assets of ¥738 million ($8,875 thousand) is the increase in assets that belong to the entire
group, which are not distributed to specific segments.*3 Segment income is adjusted for the ordinary income as described in 2. Calculation method of reporting segment income (loss).
80 KAWASAKI KISEN KAISHA, LTD. 81ANNuAL REPORT 2011

The amortization and balance of goodwill for the year ended and as of March 31, 2011 are as follows:
Millions of yen
Year ended March 31, 2011
Containership Bulk shippingOther (Note)
Adjustments and eliminations Total
Amortization for the year ¥— ¥2,898 ¥ 6 ¥— ¥2,904
Balance at the year end — 4,532 20 — 4,552
Thousands of U.S. Dollars
Year ended March 31, 2011
Containership Bulk shippingOther (Note)
Adjustments and eliminations Total
Amortization for the year $— $34,853 $ 72 $— $34,925
Balance at the year end — 54,504 241 — 54,745
The amortization and balance of negative goodwill for the year ended and as of March 31, 2011 related to a business combination prior to
April 1, 2010 is as follows:Millions of yen
Year ended March 31, 2011
Containership Bulk shippingOther (Note)
Adjustments and eliminations Total
Amortization for the year ¥28 ¥3 ¥— ¥— ¥31
Balance at the year end 28 6 — — 34
Thousands of U.S. Dollars
Year ended March 31, 2011
Containership Bulk shippingOther (Note)
Adjustments and eliminations Total
Amortization for the year $337 $36 $— $— $373
Balance at the year end 337 72 — — 409
Note: “Other” mainly consists of logistics and harbor transportation services.
(b) Segment information for the year ended March 31, 2010
under the former segmentation policy applied by the Company up to the year ended March 31, 2010, segment information for the year
ended March 31, 2010 was as follows:
1. Business segment information
Businesses of the Group were classified into three segments: Marine transportation, logistics/harbor transportation, and other. The related
information was presented as follows:Millions of yen
Year ended March 31, 2010
Marine transportation
Logistics/harbor transportation Other Total Eliminations Consolidated
1. Revenues:
(1) Operating revenues from customers ¥729,684 ¥ 87,918 ¥20,431 ¥ 838,033 ¥ — ¥ 838,033
(2) Intra-group revenues and transfers 9,646 45,166 40,209 95,021 (95,021) —
Total revenues 739,330 133,084 60,640 933,054 (95,021) 838,033
2. Costs and expenses 798,390 128,358 58,464 985,212 (95,104) 890,108
Operating (loss) income ¥ (59,060) ¥ 4,726 ¥ 2,176 ¥ (52,158) ¥ 83 ¥ (52,075)
3. Total assets, depreciation and amortization, loss on impairment of fixed assets and capital expenditures:
(1) Total assets ¥914,429 ¥143,342 ¥67,505 ¥1,125,276 ¥(81,391) ¥1,043,885
(2) Depreciation and amortization 37,921 6,316 1,044 45,281 — 45,281
(3) Loss on impairment of fixed assets 8,903 3 — 8,906 — 8,906
(4) Capital expenditures 173,343 7,055 1,091 181,489 — 181,489
under the former segmentation policy applied by the Company up to the year ended March 31, 2010, segment information for the year
ended March 31, 2010 was as follows:
2. Geographical segment information
Each geographical segment principally covered the following countries or regions:
North America: u.S.A. and Canada
Europe: u.K., Germany, the Netherlands and France
Asia: Hong Kong, Singapore, Thailand, Indonesia, South Korea, Malaysia and the People’s Republic of China
Other: Australia
Related information was as follows:Millions of yen
Year ended March 31, 2010Japan North America Europe Asia Other Total Eliminations Consolidated
1. Revenues:
(1) Operating revenues from customers ¥731,521 ¥18,725 ¥ 50,900 ¥36,570 ¥ 317 ¥ 838,033 ¥ — ¥ 838,033
(2) Intra-group revenues and transfers 8,696 20,441 9,167 10,843 655 49,802 (49,802) —
Total revenues 740,217 39,166 60,067 47,413 972 887,835 (49,802) 838,033
2. Costs and expenses 796,470 39,131 56,819 46,434 1,056 939,910 (49,802) 890,108
Operating (loss) income ¥ (56,253) ¥ 35 ¥ 3,248 ¥ 979 ¥ (84) ¥ (52,075) ¥ (0) ¥ (52,075)
3. Total assets ¥855,760 ¥24,166 ¥127,851 ¥92,751 ¥5,463 ¥1,105,991 ¥(62,106) ¥1,043,885
under the former segmentation policy applied by the Company up to the year ended March 31, 2010, segment information for the year
ended March 31, 2010 was as follows:
3. International business information
International revenues consisted mainly of revenues from the marine transportation business earned outside Japan.
Each segment principally covered the following countries or regions:
North America: u.S.A. and Canada
Europe: u.K., Germany, the Netherlands and France
Asia: South-east Asia, the Middle East, the People’s Republic of China and India
Oceania: Australia and New Zealand
Other: Central and South America and Africa
International revenues for the year ended March 31, 2010 were summarized as follows:Millions of yen
Year ended March 31, 2010North America Europe Asia Oceania Other Total
1. International revenues ¥184,069 ¥146,383 ¥213,767 ¥79,377 ¥84,718 ¥708,314
2. Consolidated revenues ¥838,033
3. International revenues as a percentage of consolidated revenues 21.9% 17.5% 25.5% 9.5% 10.1% 84.5%
20. Subsequent EventThe following distribution of retained earnings of the Company, which has not been reflected in the accompanying consolidated financial
statements for the year ended March 31, 2011, was approved at a meeting of the Company’s shareholders held on June 24, 2011:
Millions of yenThousands of U.S. dollars
Cash dividends (¥5.50 = $0.07 per share) ¥4,202 $50,535
82 KAWASAKI KISEN KAISHA, LTD. 83ANNuAL REPORT 2011

Outline of the Company / Stock Information
Outline of the Company (As of March 31, 2011) Stock Information (As of March 31, 2011)
Principal Shareholders
Stock Price Range & Trading Volume (Tokyo Stock Exchange)
0
100
200
300
400
500(¥)
(Thousands)
2009Mar. Apr. May Jun. Jul. Aug. Sep. Oct. Nov. Dec.
2010Jan. Feb. Mar. Apr. May Jun. Jul. Aug. Sep. Oct. Nov. Dec.
2011Jan. Feb. Mar.
0
100,000
200,000
300,000
400,000
500,000
Shareholders
Number ofShares Held(thousands)
Percentageof VotingRights (%)
Japan Trustee Services Bank, Ltd. (trust account) 66,126 8.63
The Master Trust Bank of Japan, Ltd. (trust account) 60,033 7.84
Trust & Custody Services Bank, Ltd. (Kawasaki Heavy Industries, Ltd. retirement ben-efit trust account re-entrusted by Mizuho Trust and Banking Co., Ltd.) 30,000 3.91
JFE Steel Corporation 28,174 3.68
Sompo Japan Insurance Inc. 27,295 3.56
Japan Trustee Services Bank, Ltd. (trust account 9) 25,779 3.36
Tokio Marine & Nichido Fire Insurance Co., Ltd. 23,911 3.12
GOLDMAN, SACHS & CO.REG 15,869 2.07
Nippon Life Insurance Company 14,331 1.87
THE BANK OF NEW YORK - JASDECTREATY ACCOUNT 14,079 1.83
Name Kawasaki Kisen Kaisha, Ltd. (“K” Line)Established April 5, 1919Paid-in Capital ¥65,031.56 millionPresident Jiro Asakura
(taking over presidency on May 13, 2011)Employees On-land Duty 437
At-sea Duty 186Total 623
Business Lines Marine transportation, Land transportation, Air transportation, Through transportation involving marine, land and air transportation, Harbor transportation, etc.
OfficesHead Office(From October, 2011)
Iino Building1-1, Uchisaiwaicho 2-chome,Chiyoda-ku, Tokyo 100-0011, JapanPhone: (+81) 3-3595-5063 Fax: (+81) 3-3595-5001
Registered Head Office
Shinko Building, 8 Kaigandori, Chuo-ku, Kobe 650-0024, JapanPhone: (+81) 78-332-8020 Fax: (+81) 78-858-6509
Branches Nagoya:11th Fl. Nagoya International Center Building, 47-1, Nagono 1-chome, Nakamura-ku, Nagoya 450-0001, JapanPhone: (+81) 52-589-4510 Fax: (+81) 52-589-4585
Kansai:5th Fl. Daidouseimei Kobe Building, 2-7, Sakaemachidori 1-chome,Chuo-ku, Kobe 650-0023, JapanPhone: (+81) 78-325-8727 Fax: (+81) 78-393-2676
Overseas Offices Beijing, Manila, Middle East (Dubai)Overseas Agents Korea, Hong Kong, China, Taiwan, Thailand,
the Philippines, Singapore, Malaysia, Indonesia, Vietnam, India, Australia, U.K., Germany, France, Nederlands, Belgium, Italy, Finland, Denmark, Norway, Sweden, Spain, Portugal, Turkey, Canada, U.S.A., Mexico, Chile, Peru, Brazil, South Africa etc.
Affiliated Companies(to be consolidated)
26 (Domestic), 290 (Overseas)
Authorized 2,000,000,000 shares of common stockIssued 765,382,298 shares of common stockNumber of Shareholders 39,495Shareholder Registry Administrator
The Chuo Mitsui Trust & Banking Co., Ltd.33-1, Shiba 3-chome, Minato-ku, Tokyo 105-0014
Listing of Shares “K” Line’s shares are listed for trading on the following stock exchanges:Tokyo, Osaka, Nagoya and Fukuoka
Report of Independent Auditors
84 KAWASAKI KISEN KAISHA, LTD. 85ANNuAL REPORT 2011
Higher ValueSteaming Toward
Ka
wa
sa
Ki K
ise
n K
ais
ha
, LTD
. an
nu
aL R
ep
oR
T 2011
Iino Building1-1,
Uchisaiwaicho 2-chome,
Chiyoda-ku, Tokyo 100-0011, Japan
Phone: (+81) 3-3595-5063 (IR & PR Group)
Fax : (+81) 3-3595-5001
URL : http://www.kline.co.jp
Printed in Japan
Annual Report 2011 for the year ended March 31, 2011


![MEGALINE building1 [Режим совместимости]megaline.ua/presentation/Portfolio-Mega.pdf · 2017-10-12 · Panorama view Village Budachiya Balka 2006 - 2007 Refrigeration](https://img.dokumen.tips/doc/110x75/5e88319ad130e220437672b3/megaline-building1-2017-10-12-panorama.jpg)