Embed Size (px)
Citation preview
URS QUEENSLAND COKE& ENERGY
II Appendix D
Noise and Vibration
Queensland Coke & Power Plant Project Noise Aspects of Environmental Impact Study
(Stanwell)
CONSULTING ENGINEERS ABN 95 064 952 030
Corner Wickham Terrace & Leichhardt Street, Spring Hill Q 4000. PO Box 50 I, Spring Hi ll Q 4004. T07 383 1 7511 107 383 1 766 1 [email protected] Wwww.askce.com
3329R03VO I .doc
30 June 2006
Prepared for
URS
CONSULTING ENGINEERS
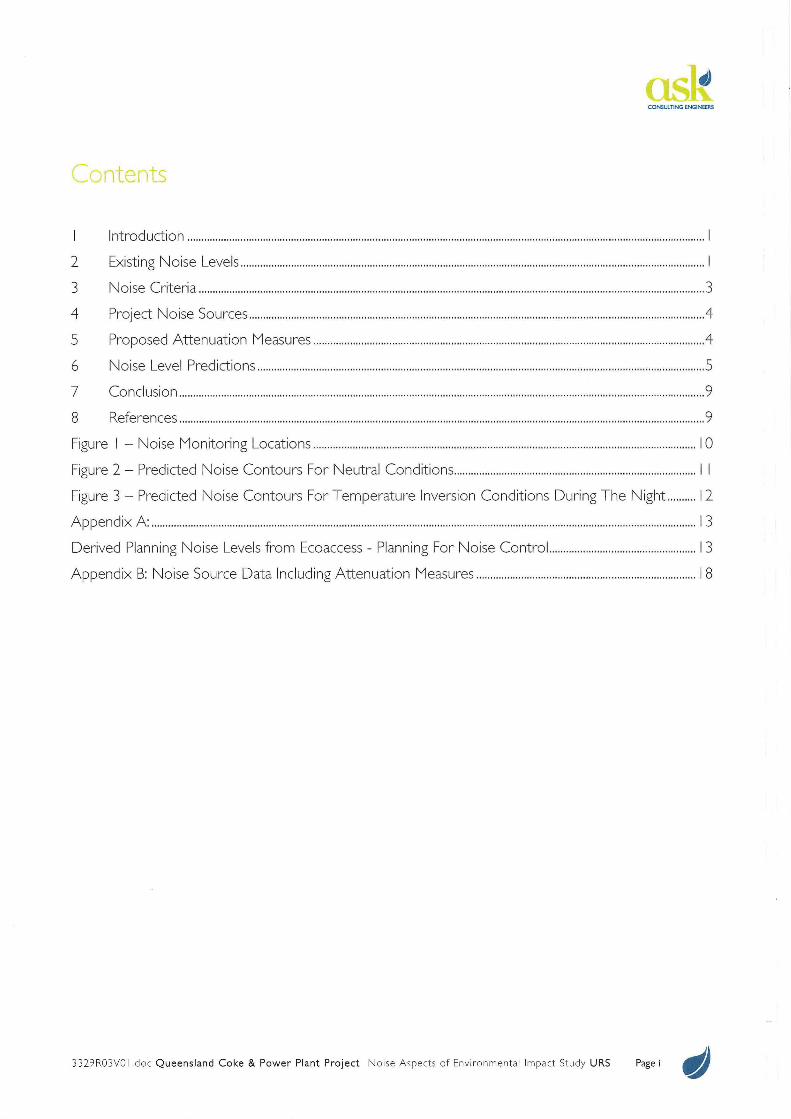
Contents
I Introduction ............................................................................................................................................... ........... .. ........... ........... ...... I
2 Existing Noise Levels ......................... ............ .............................. ..... .. ................. .. ..... ............................ .. ................................. .... I
3 Noise Criteria .... ........................... .. .. ....................... .... .. ........ ........... .. ... ....... ........... ..... .. ................... .............................. ........... .. .. ... 3
4 Project Noise Sources ..... ............ ................................................................................................................................................. 4
5 Proposed Attenuation Measures .............................................................................................................. ............................. 4
6 Noise Level Predictions ............... ... ...... ........ ...................... ...... ............. ..... ..... ............ .... .. ........................ ... ........... .. .................. 5
7 Conclusion ............. .......... .............. ..... ................................................................................................................. .......................... ...... 9
8 References ... ....... ................. .. ............................ ... ....... ....... .................... ... ................................... .......... ............ ................................ . 9
Figure I - Noise Monitoring Locations .............................................................................. .......................................................... I 0
Figure 2 - Predicted Noise Contours For Neutral Conditions ........................................................ ............................ .. I I
Figure 3 - Predicted Noise Contours For Temperature Inversion Conditions During The Night.. ........ 12
Append ix A: ......... ... .................... ....... .. .... .. .......................................................... ...... ................. .................................................................. I 3
Derived Planning Noise Levels from Ecoaccess - Planning For Noise Control .................................................... 13
Appendix B: Noise Source Data Including Attenuation Measures .. .. ............. ... .. ...... .... .............. ........................... ..... I 8
3329R03VO I .doc Queensland Coke & Power Plant Project Noise Aspects of Environmental Imp act Study URS Page i tl)
CONSULTING ENGINEERS
Introduction
ASK Consulting Engineers Pty Ltd (ASK) provided the acoustic report component of the EIS for the Queensland Coke & Power Plant Project (our ref: 3329RO I V03.doc, dated 24/ I I /2005).
Since that report, the EPA has commented on the EIS, and has eleven (I I) issues and recommendations with respect to the Noise & Vibration component of the EIS. Queensland Rail and Queensland Health have one issue each as well.
In addition a number of changes to the plant layout and noise control measures have been made.
This report is an update of the original EIS and deals with the above changes.
2 Existing Noise Levels
Additional noise monitoring has been carried out in and around Stanwell during March 2006 and June 2006 to provide an update to the August 2000 background noise levels reported in the EIS.
Since the critical time in terms of noise impact is the night-time period, the emphasis has been placed on the night-time period. In essence the results show that if the night-time noise limits are met, then the day and evening noise limits would also be met.
The night-time background noise levels refer to the L90 noise levels obtained between I 0 pm and ?am. Additional data was collected at location BI, B2, VI and V4 over a period of 7 days in March 2006 and 7 days in June 2006.
For each of these monitoring periods the L90 value was calculated as per the Ecoaccess guideline. The results are summarised in Table I and also include results for August 2000, reported in the original EIS.
Figure I shows the noise monitoring locations.
3329R03VO I .doc Queensland Coke & Power Plant Project Noise Aspects of Environmental Impact Study URS Page I tJ/)
CONSULTING ENGINEERS
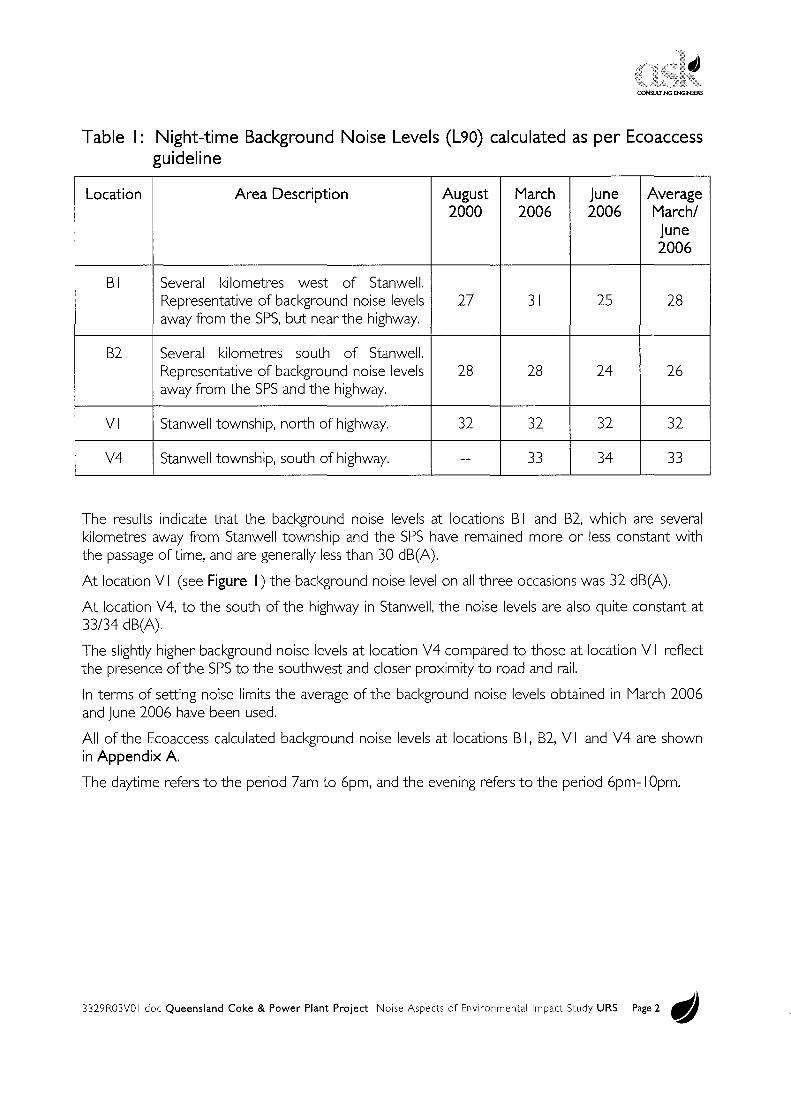
Table I: Night-time Background Noise Levels (L90) calculated as per Ecoaccess guideline
Location Area Description August March June Average 2000 2006 2006 March/
June 2006
BI Several kilometres west of Stanwell. Representative of background noise levels 27 31 25 28 away from the SPS, but near the highway.
B2 Several kilometres south of Stanwell. Representative of background noise levels 28 28 24 26 away from the SPS and the highway.
VI Stanwell township, north of highway. 32 32 32 32
V4 Stanwell township, south of highway. -- 33 34 33
The results indicate that the background noise levels at locations BI and B2, which are several kilometres away from Stanwell township and the SPS have remained more or less constant with the passage of time, and are generally less than 30 dB(A).
At location VI (see Figure I) the background noise level on all three occasions was 32 dB(A).
At location V4, to the south of the highway in Stanwell, the noise levels are also quite constant at 33/34 dB(A).
The slightly higher background noise levels at location V4 compared to those at location VI reflect the presence of the SPS to the southwest and closer proximity to road and rail.
In terms of setting noise limits the average of the background noise levels obtained in March 2006 and June 2006 have been used.
All of the Ecoaccess calculated background noise levels at locations BI, B2, VI and V4 are shown in Appendix A
The daytime refers to the period 7am to 6pm, and the evening refers to the period 6pm-I Opm.
3329R03VO I .doc Queensland Coke & Power Plant Project Noise Aspects of Environmental Impact Study URS Page 2 tl)
CONSULTING ENGINEERS
3 Noise Criteria
The noise limits according to Ecoaccess have been determined as follows.
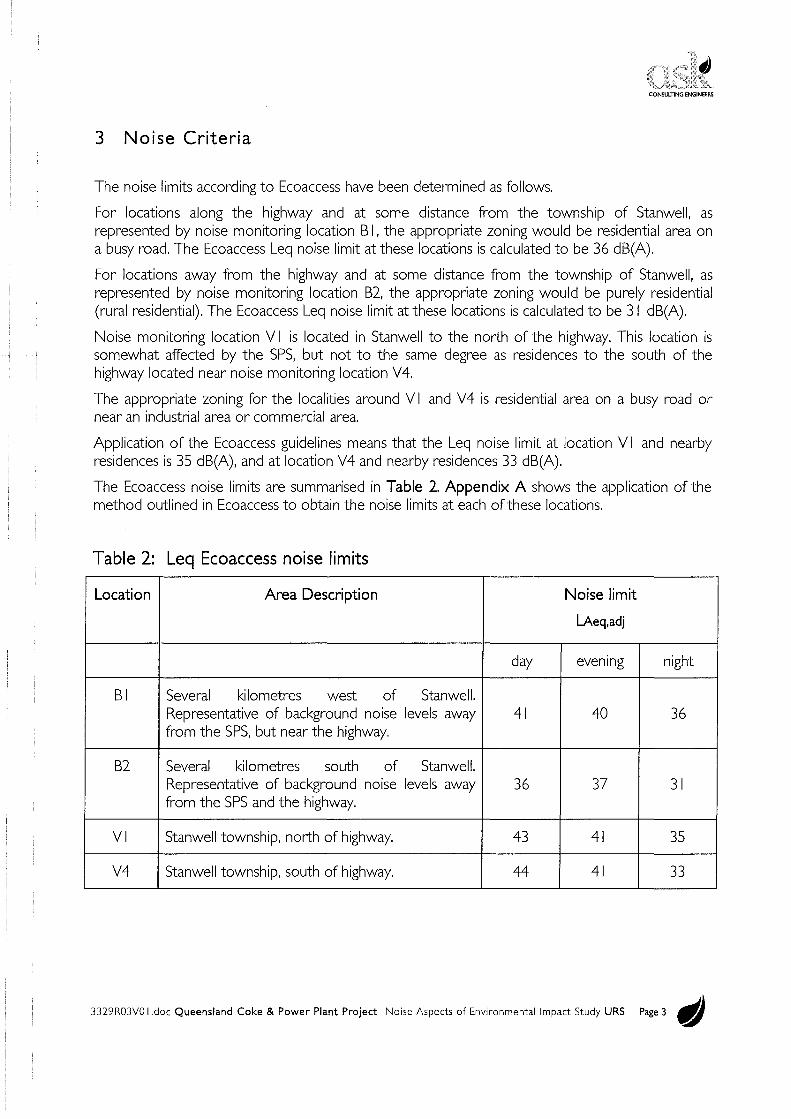
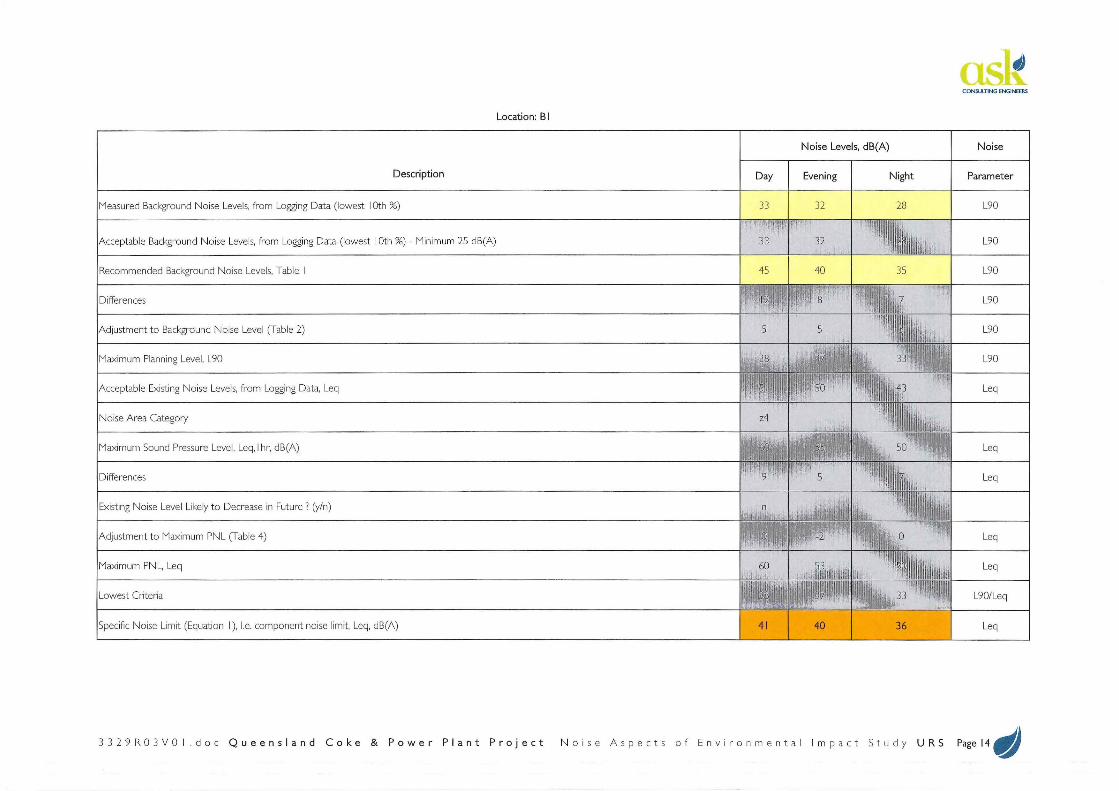
For locations along the highway and at some distance from the township of Stanwell, as represented by noise monitoring location BI, the appropriate zoning would be residential area on a busy road. The Ecoaccess Leq noise limit at these locations is calculated to be 36 dB(A).
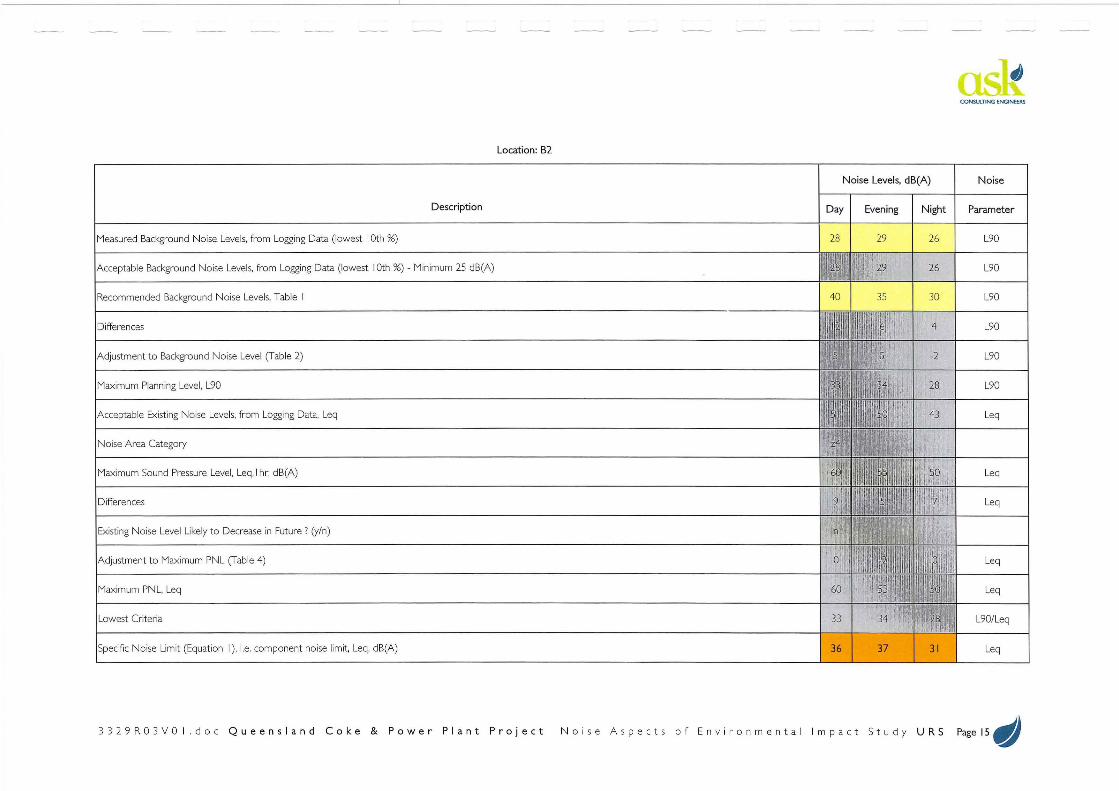
For locations away from the highway and at some distance from the township of Stanwell, as represented by noise monitoring location B2, the appropriate zoning would be purely residential (rural residential). The Ecoaccess Leq noise limit at these locations is calculated to be 31 dB(A).
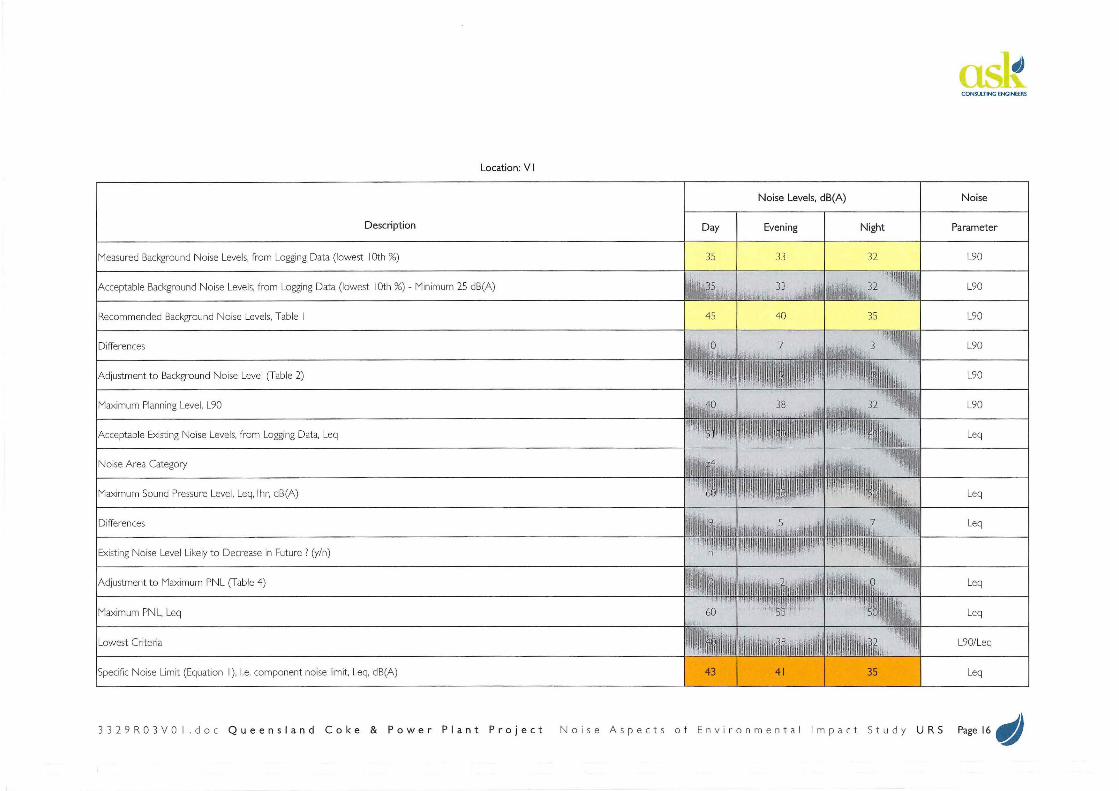
Noise monitoring location VI is located in Stanwell to the north of the highway. This location is somewhat affected by the SPS, but not to the same degree as residences to the south of the highway located near noise monitoring location V4.
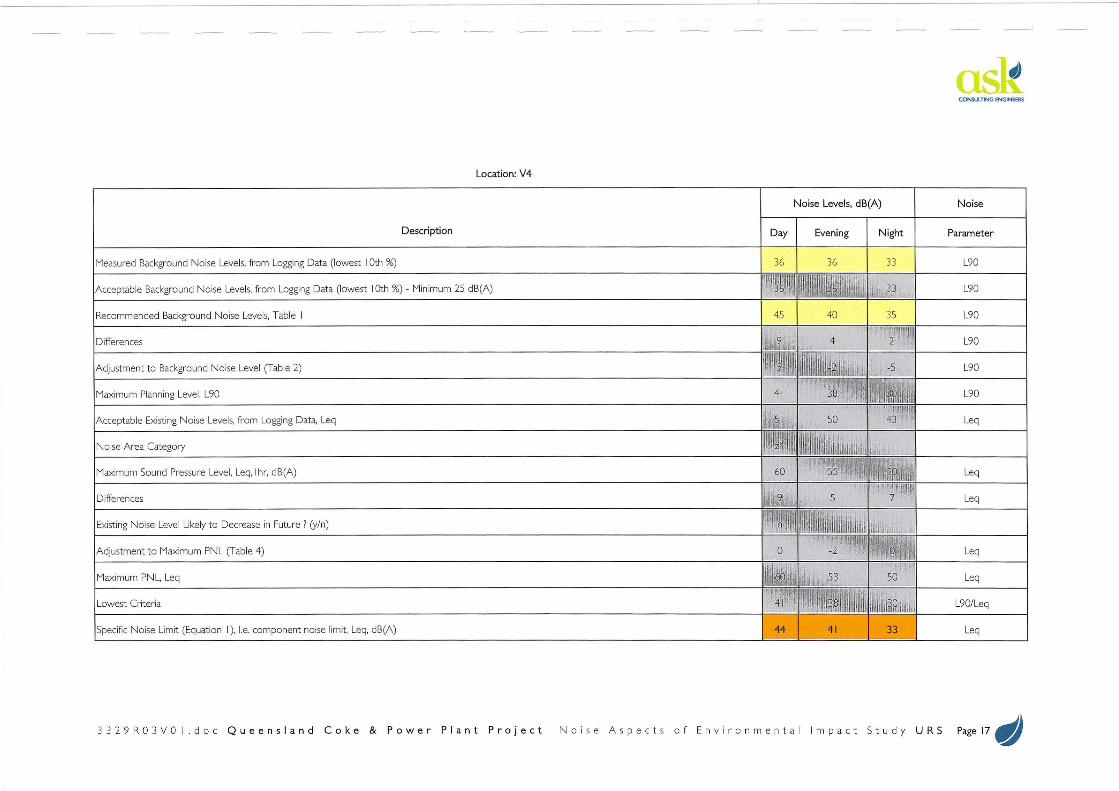
The appropriate zoning for the localities around VI and V4 is residential area on a busy road or near an industrial area or commercial area.
Application of the Ecoaccess guidelines means that the Leq noise limit at location VI and nearby residences is 35 dB(A), and at location V4 and nearby residences 33 dB(A).
The Ecoaccess noise limits are summarised in Table 2. Appendix A shows the application of the method outlined in Ecoaccess to obtain the noise limits at each of these locations.
Table 2: Leq Ecoaccess noise limits
Location Area Description Noise limit
LAeq,adj
day evening night
BI Several kilometres west of Stanwell. Representative of background noise levels away 41 40 36 from the SPS, but near the highway.
B2 Several kilometres south of Stanwell. Representative of background noise levels away 36 37 31 from the SPS and the highway.
VI Stanwell township, north of highway. 43 41 35
V4 Stanwell township, south of highway. 44 41 33
3329R03VO I .doc Queensland Coke & Power Plant Project Noise Aspects of Environmental Impact Study URS Page 3 tl)
CONSULTING ENGINEERS
4 Project Noise Sources
Since the noise report for the EIS was prepared, ASK has been provided with additional information on the materials handling processes in the Project. This information has been used to reassess the noise emissions.
The materials handling aspect of the Project is considered to be the likely dominant noise source due to the processes involved and the closer proximity to Stanwell township. The noise data for the coke oven component of the development is based on theoretical calculations of sound power associated with expected noise sources. At this stage, no measured noise data has been obtained for the coke oven component of the development.
Some of the handling facilities have been relocated to the eastern part of the site in close proximity to Flagstaff Hill. The hill will provide some acoustic shielding for these noise sources.
5 Proposed Attenuation Measures
To reduce the noise emission levels from the project, the following noise mitigation measures are proposed and these have been incorporated in the latest modelling:
• Enclosure of the coal crusher and screen station. Construction may consist of a sheet metal wall lined internally with I OOmm insulation and perforated metal/foil, mounted on vibration isolation mounts around the sides of the station: I 0 dB(A) reduction; located on the N/NW part of the plant.
• Relocation of the crushing and screening station further west towards the stockpiles; located on the N/NW part of the plant.
• Enclosure of conveyors, aside from those required to be open for coke stacker/reclaimer and coal stacker: 5 dB(A) reduction; located on the N,W and E parts of the plant.
• Reduction of speed of coal conveyor from stockpiles to crusher/screener to coke ovens and use of super low noise idlers: 5 dB(A) reduction; located on the N,W and E parts of the plant.
• Stacker - Adoption of noise minimisation techniques such as (i) controlled trajectory chute at the tripper discharge, (ii) fully enclosed tripper discharge chute; (iii) low height tripper transfer discharge; (iv) fully enclosed boom conveyor load skirts; and (v) low noise electric motor on the boom conveyor drive (Mills, Bridges and Juillerat): 8 dB(A) reduction; located on the W part of the plant.
• Reclaimer - Adoption of noise minimisation techniques such as (i) ball bearing type chain guide rollers; (ii) vibration absorbing rubber plates attached to chain guide liners; (iii) large diameter chain sprockets and guide rollers and tumblers; (iv) low noise motors on harrow sled drive; and (v) fully enclosed impact loading table at discharge to yard conveyor (Mills, Bridges and Juillerat): 4 dB(A) reduction; located on the N part of the plant.
3329R03VO I .doc Queensland Coke & Power Plant Project Noise Aspects of Environmental Impact Study URS Page 4 t!I)
CONSULTING ENGINEERS
• Maintain a bed of coke in the breeze and nut bins such that new material is not falling onto bare metal (Mills, Bridges and Juillerat): I 0 dB(A) reduction; located on the E part of the plant.
• Construction of enclosures leading into and out of the rail load-out facility, upgrade overall construction in terms of wall and roof transmission loss performance, and maintain bed of coke in rail-load out bin: I 0 dB(A) reduction; located on the W part of the plant.
• Adoption of high performance attenuators on the cooling tower fans, and coke oven stack fans (small stacks have no fans but the large stacks have fans at the base of the stack): 15 dB(A) reduction; located on the SE part of the plant.
• Modification of dozer D I I with assistance of Caterpillar, using treatments to tracks and muffler: 5 dB( A) reduction; located on the E part of the plant.
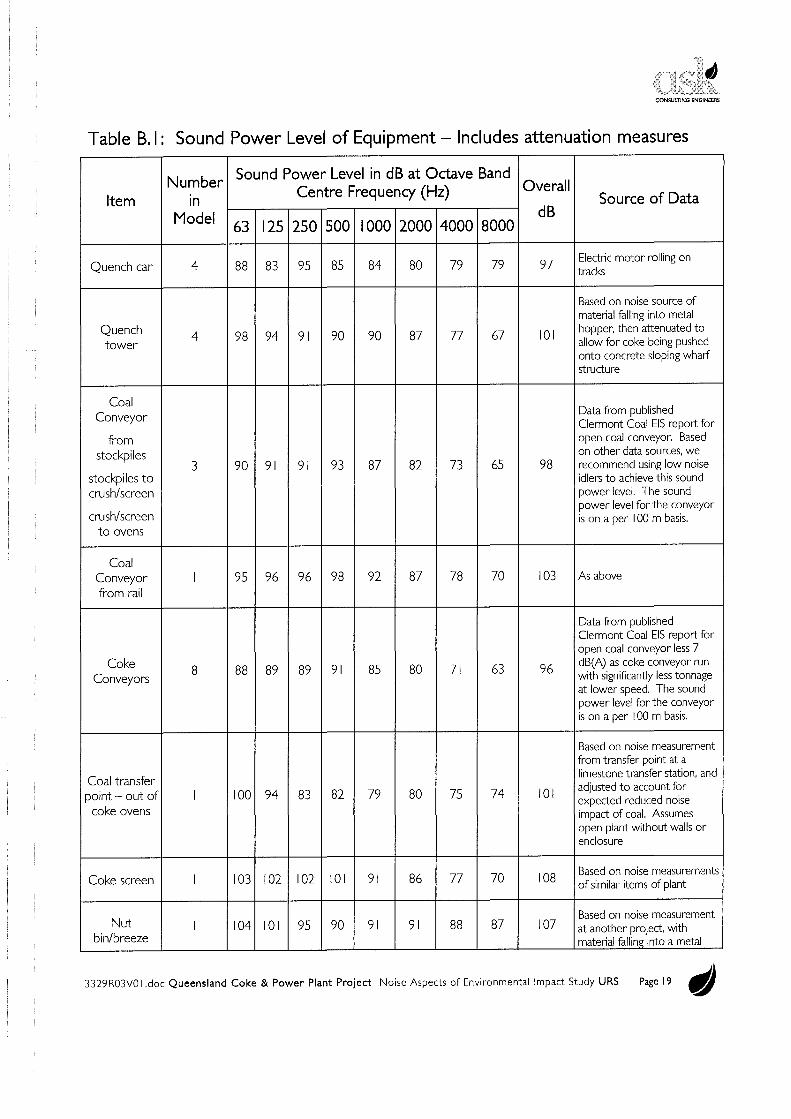
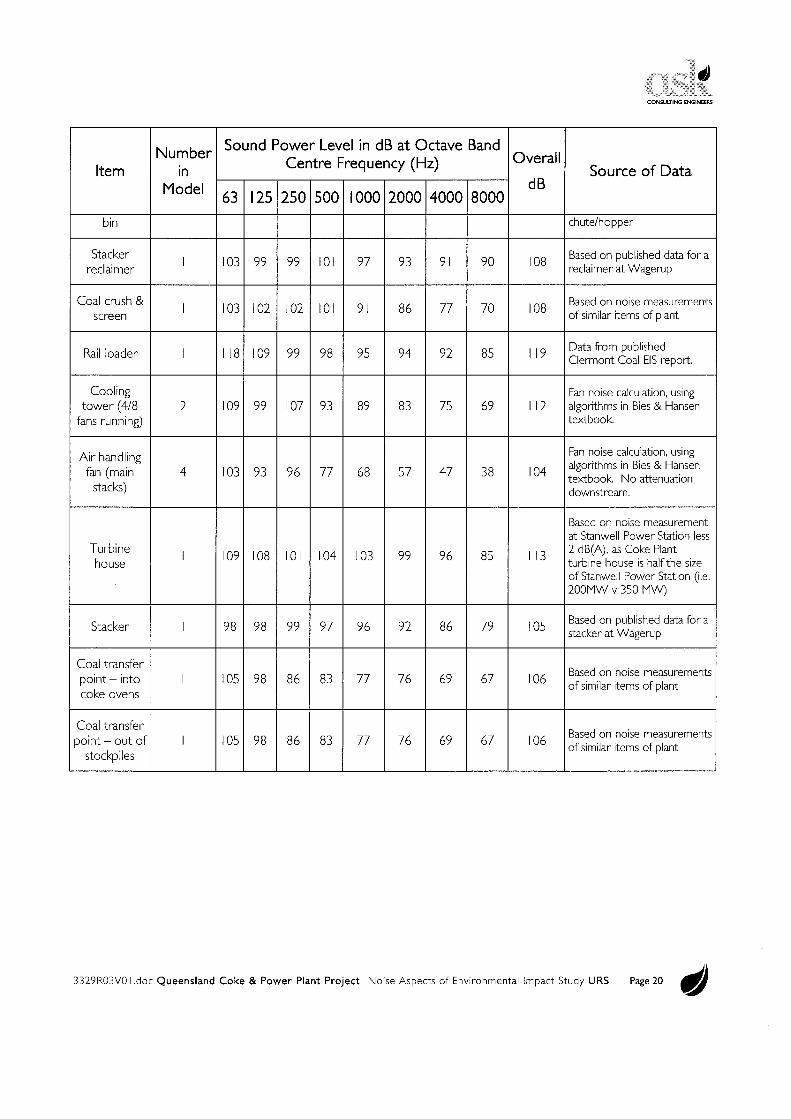
The sound power data in terms of dB per octave band is listed in Table B. I. This data is taken from various sources and is considered indicative of the equipment proposed in this project based on the information available to ASK.
Another potentially annoying noise from industrial projects is reverse beepers from mobile equipment. This has not been assessed in detail at this stage, however, the following noise controls should be considered:
• Use of background noise detecting reverse beepers;
• Designing vehicle paths to minimise time spent reversing;
• Use of flashing lights in lieu of reverse beepers; and/or
• Noise barriers and/or bunding around areas where reverse beepers are used.
It should be noted that all of these noise sources are to the south or southwest of the township of Stanwell.
6 Noise Level Predictions
The noise level predictions have been carried out using the PEN (propagation of environmental noise) model. This model takes into account attenuation of noise due to distance, ground effects, barriers, and atmospheric attenuation. The noise source data is in terms of octave bands raning from 63 Hz to 8000 Hz.
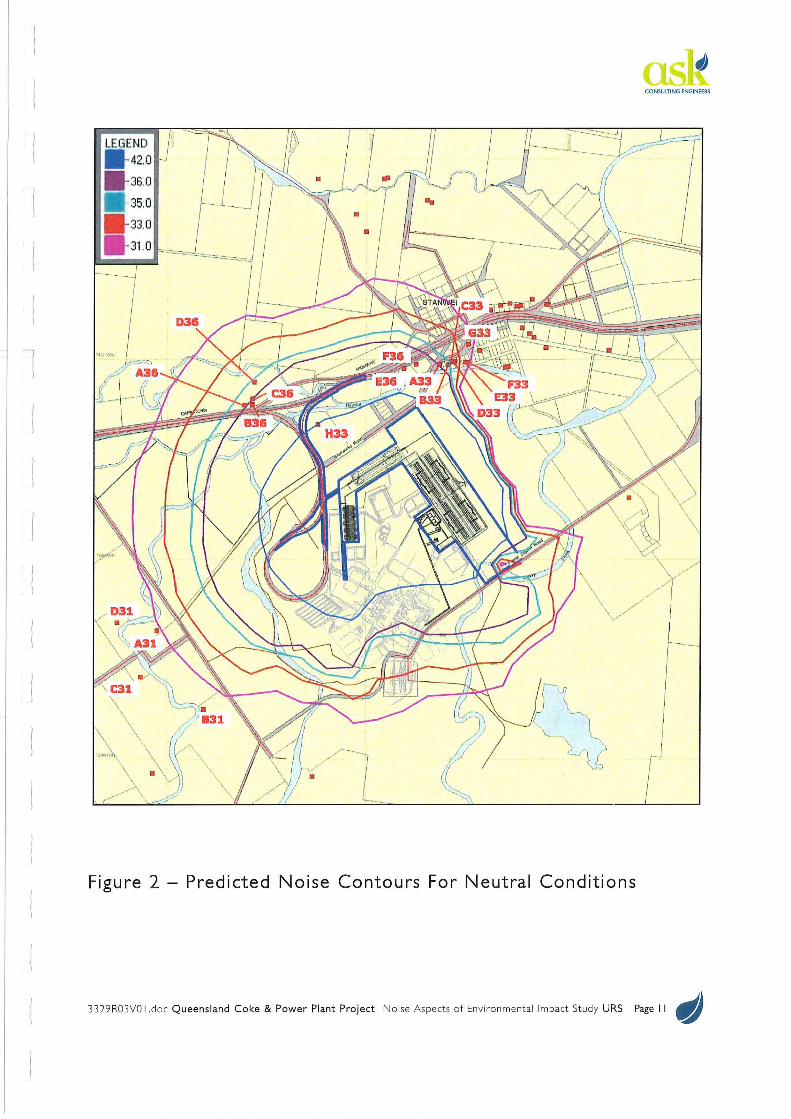
The noise level predictions in terms of Leq (as required by Ecaccess) for two meteorological scenarios have been modelled. The first scenario represents a neutral atmosphere with no wind. These conditions are commonly experienced both during the day and during the night.
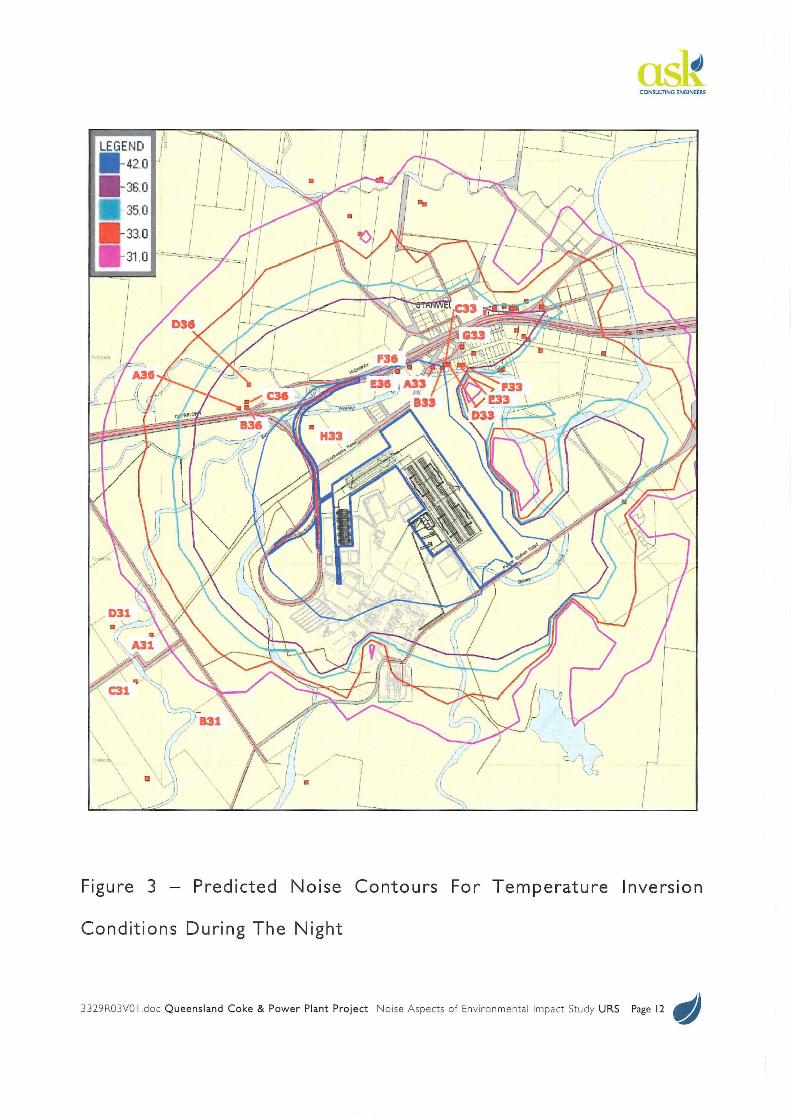
The second scenario represents temperature inversion atmospheric conditions. These conditions are conducive to enhancement of noise levels, since the noise rays tend to bend back towards the earth rather than bend upward as normally occurs. Temperature inversions only occur during the night in the cooler months when there is little or no wind under clear skies. It has been assumed that the wind speed is I m/s from the SW and that the strength of the temperature inversion is
3329R03VO I .doc Queensland Coke & Power Plant Project Noise Aspects of Environmental Impact Study URS Page 5 tl)
CONSULTING ENGINEERS
3°C/ I 00 m. This scenario was modelled to indicate typical worst-case noise impact conditions. Inversion conditions generally occur during light wind condition from the west or south west
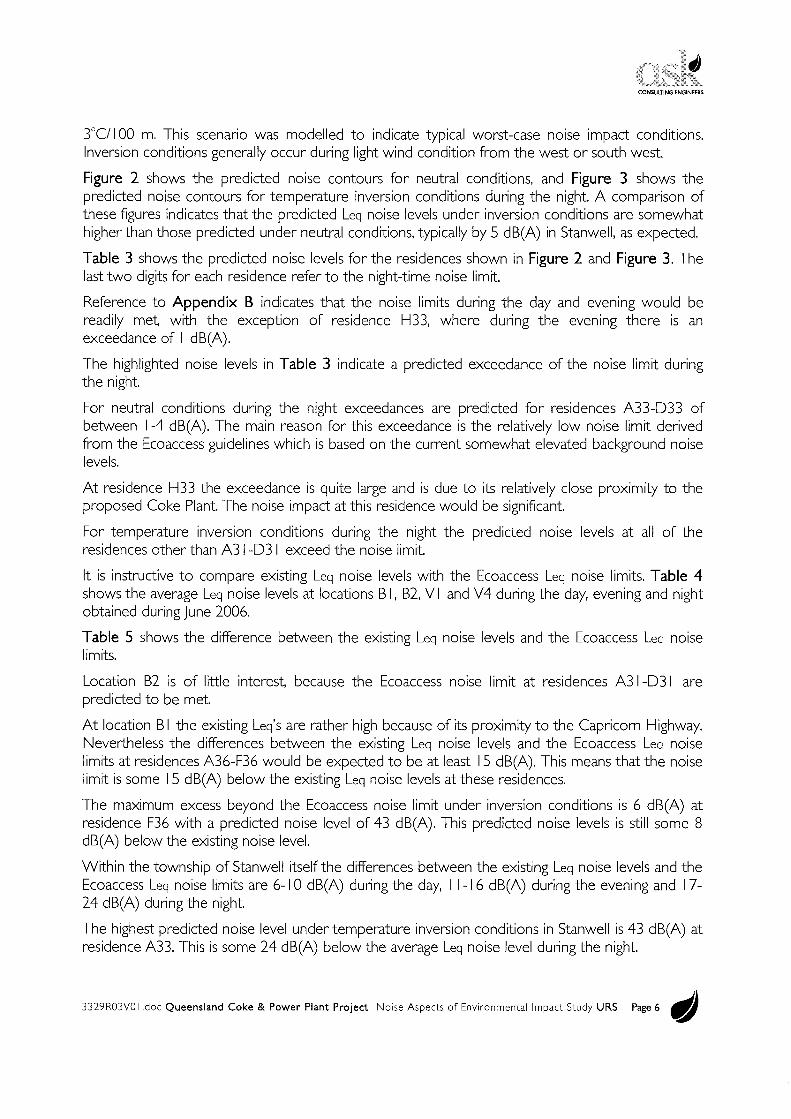
Figure 2 shows the predicted noise contours for neutral conditions, and Figure 3 shows the predicted noise contours for temperature inversion conditions during the night A comparison of these figures indicates that the predicted Leq noise levels under inversion conditions are somewhat higher than those predicted under neutral conditions, typically by 5 dB(A) in Stanwell, as expected.
Table 3 shows the predicted noise levels for the residences shown in Figure 2 and Figure 3. The last two digits for each residence refer to the night-time noise limit
Reference to Appendix B indicates that the noise limits during the day and evening would be readily met, with the exception of residence H33, where during the evening there is an exceedance of I dB(A).
The highlighted noise levels in Table 3 indicate a predicted exceedance of the noise limit during the night
For neutral conditions during the night exceedances are predicted for residences A33-D33 of between 1-4 dB(A). The main reason for this exceedance is the relatively low noise limit derived from the Ecoaccess guidelines which is based on the current somewhat elevated background noise levels.
At residence H33 the exceedance is quite large and is due to its relatively close proximity to the proposed Coke Plant The noise impact at this residence would be significant.
For temperature inversion conditions during the night the predicted noise levels at all of the residences other than A3 I -D3 I exceed the noise limit
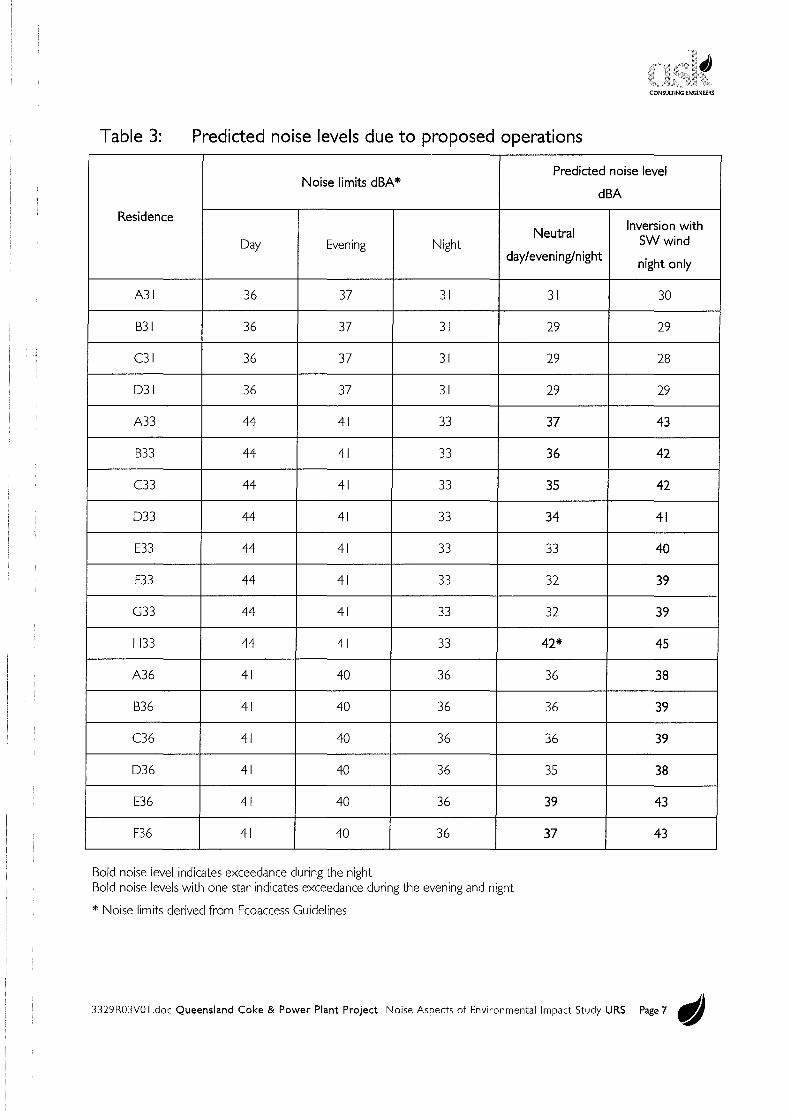
It is instructive to compare existing Leq noise levels with the Ecoaccess Leq noise limits. Table 4 shows the average Leq noise levels at locations BI, B2, VI and V4 during the day, evening and night obtained during June 2006.
Table 5 shows the difference between the existing Leq noise levels and the Ecoaccess Leq noise limits.
Location B2 is of little interest, because the Ecoaccess noise limit at residences A3 I -D3 I are predicted to be met
At location BI the existing Leq's are rather high because of its proximity to the Capricorn Highway. Nevertheless the differences between the existing Leq noise levels and the Ecoaccess Leq noise limits at residences A36-F36 would be expected to be at least 15 dB(A). This means that the noise limit is some 15 dB(A) below the existing Leq noise levels at these residences.
The maximum excess beyond the Ecoaccess noise limit under inversion conditions is 6 dB(A) at residence F36 with a predicted noise level of 43 dB(A). This predicted noise levels is still some 8 dB(A) below the existing noise level.
Within the township of Stanwell itself the differences between the existing Leq noise levels and the Ecoaccess Leq noise limits are 6-10 dB(A) during the day, I I 16 dB(A) during the evening and 17-24 dB(A) during the night
The highest predicted noise level under temperature inversion conditions in Stanwell is 4 3 dB(A) at residence A33. This is some 24 dB(A) below the average Leq noise level during the night
3329R03VO I .doc Queensland Coke & Power Plant Project Noise Aspects of Environmental Impact Study URS Page 6 t!I)
CONSULTING ENGINEERS
Table 3: Predicted noise levels due to proposed operations
Predicted noise level Noise limits dBA*
dBA
Residence Inversion with
Neutral Day Evening Night SW wind
day/evening/night night only
A31 36 37 31 31 30
B31 36 37 31 29 29
C31 36 37 31 29 28
D31 36 37 31 29 29
A33 44 41 33 37 43
B33 44 41 33 36 42
C33 44 41 33 35 42
D33 44 41 33 34 41
E33 44 41 33 33 40
F33 44 41 33 32 39
G33 44 41 33 32 39
H33 44 41 33 42* 45
A36 41 40 36 36 38
B36 41 40 36 36 39
C36 41 40 36 36 39
D36 41 40 36 35 38
E36 41 40 36 39 43
F36 41 40 36 37 43
Bold noise level indicates exceedance during the night Bold noise levels with one star indicates exceedance during the evening and night
* Noise limits derived from Ecoaccess Guidelines
3329R03VO I .doc Queensland Coke & Power Plant Project Noise Aspects of Environmental Impact Study URS Page 7 tl)
CONSULTING ENGINEERS
Table 4: Existing Leq noise levels
Noise levels Location Area Description
day evening night
Several kilometres west of Stanwell. BI Representative of background noise levels away 63 63 62
from the SPS, but near the highway.
Several kilometres south of Stanwell. B2 Representative of background noise levels away 45 35 34
from the SPS and the highway.
VI Stanwell township, north of highway. 49 52 52
V4 Stanwell township, south of highway. 54 57 57
Table 5: Difference between existing Leq and Leq Ecoaccess noise limits
Noise level difference Location Area Description
day evening night
Several kilometres west of Stanwell. BI Representative of background noise levels away 22 23 26
from the SPS, but near the highway.
Several kilometres south of Stanwell. B2 Representative of background noise levels away 9 -2 3
from the SPS and the highway.
VI Stanwell township, north of highway. 6 11 17
V4 Stanwell township, south of highway. 10 16 24
3329R03VO I .doc Queensland Coke & Power Plant Project Noise Aspects of Environmental Impact Study URS Page 8 t!I)
CONSln.TING ENGINEERS
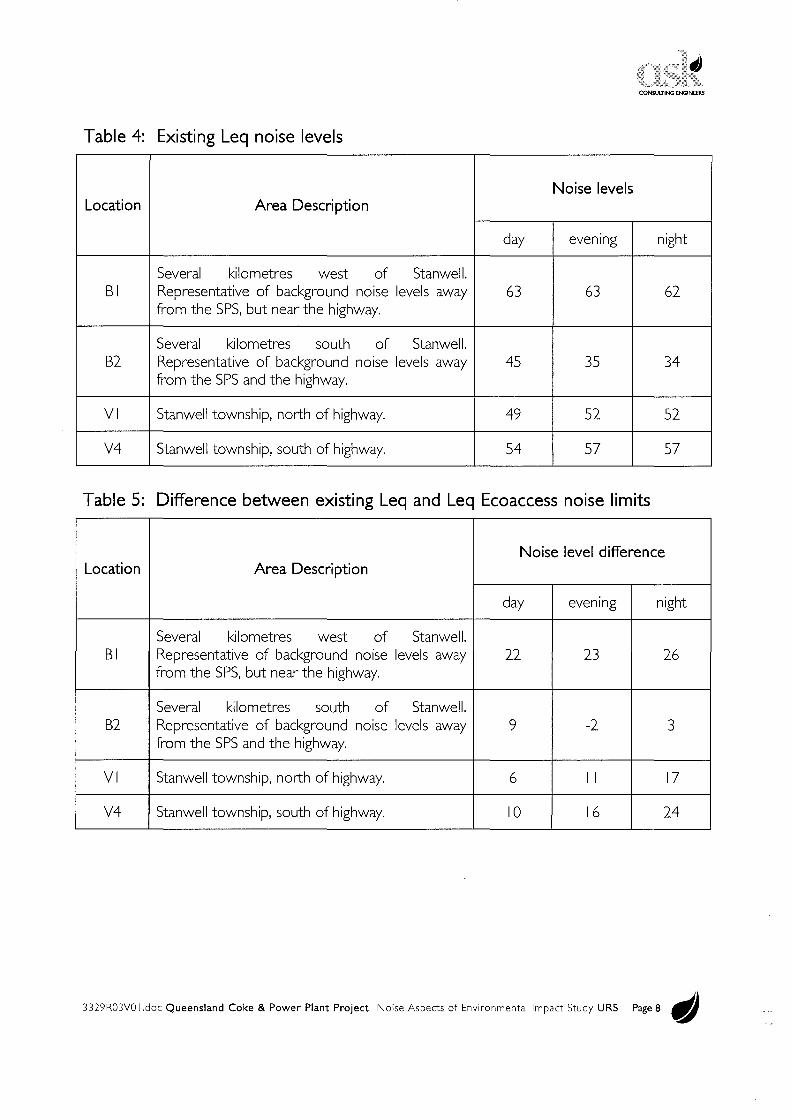
7 Conclusion
This updated noise section of the EIS indicates that, subject to the incorporation of the noise control measures outlined in this report, under neutral conditions the Ecoaccess daytime noise limits are able to be complied with. During the evening the Ecoaccess noise limit wou ld be exceeded at I residence (H33).
Under typical night-time temperature inversion conditions the Ecoaccess noise limits would be exceeded at most nearby residences to the northeast of the Project.
A comparison of existing Leq noise levels with Leq noise levels due to the proposed plant indicates that existing noise levels are significantly higher than those predicted due to the proposed plant
8 References
Bies, D. and Hanson, C. ( 1997)
Engineering noise control - Theory and practice
E&FN Spon, London.
Mills, P. Bridges, M. and Juillerat, E. (2000)
Noise reduction in new open-cut coal mines, coal handling and preparation plants
Proceedings of the Bth Australian Coal P1·eparation Society Conference at Port Stephens, November 12-16 2000, pp 26-42.
Ecoaccess Guideline Noise - Planning for noise control (2005)
Environmental Proctection Agency
3 329R03VO I .doc Queensland Coke & Power Plant Project Noise Aspects of Environmental Impact Study URS Page 9 t!/)
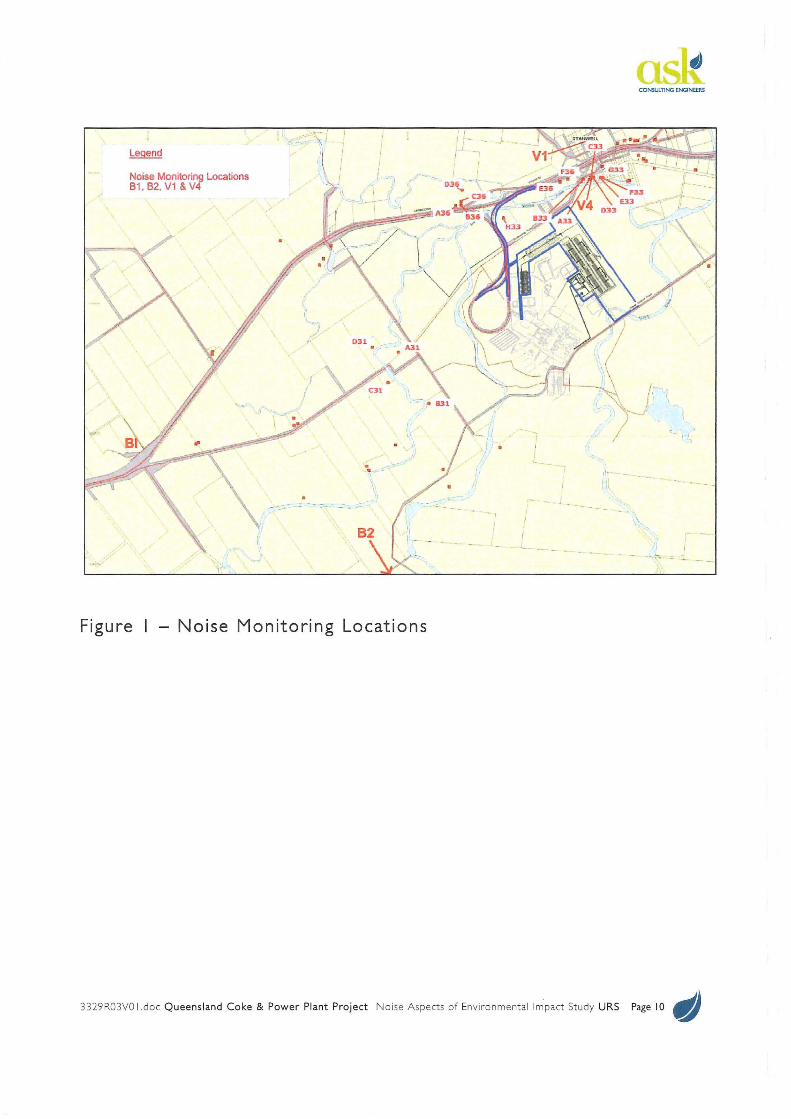
Noise Monitoring Locations 81, 82. V1 & V4
, ... - , :-- ..... _. - ..) f -
\ f _, .J
··' \.
.- ... _:.-~ -- -- -- :=
B2
Figure - Noise Monitoring Locations
'' I I - -
CONSULTING ENGINEERS
Lf--;~ I: -'~, )_'
' I I j - . -
- ,I \·-._," I --
\
I I
~-- = :1.
3329R03VO I .doc Queensland Coke & Power Plant Project Noise Aspects of Environmenta l Im pact Study URS Page 10 t!I)
CONSULTING ENGINEERS
Figure 2 - Predicted Noise Contours For Neutral Conditions
3329R03VO I .doc Queensland Coke & Power Plant Project Noise Aspects of Environmental Impact Study URS Page 11 t!I)
LEGEND l -11-42.0
11-36.0
35.0
33.0
31 .0
~ '\
CONSULTING ENGINEERS
I I
Figure 3 - Predicted Noise Contours For Temperature Inversion
Conditions During The Night
3329R03VO I .doc Queensland Coke & Power Plant Project Noise Aspects of En vi ron mental Impact Study URS Page 12 t!)
CONSULTING ENGINEERS
Appendix A:
Derived Planning Noise Levels from Ecoaccess - Planning For Noise
Control
3329R03VO I .doc Queensland Coke & Power Plant Project No ise Aspects of En vi ronmental Impact Study URS Page 13 tl)
CONSLR.TING ENGINEERS
Location: BI
Noise Levels, dB(A) Noise
Description Day Evening Night Parameter
Measured Background Noise Levels, from Logging Data (lowest I Oth %) 33 32 28 L90
33 32 ' ~.1:~1:111
Acceptable Background N oise Levels, from Logging Data (lowest I Oth %) - Minimum 25 dB(A) L90
Recommended Background Noise Levels, Table I 45 40 35 L90
Differences L90
Adjustment to Background Noise Level (Table 2) L90
Maximum Planning Level, L90 L90
Acceptab le Existing Noise Levels, from Logging Data, Leq Leq
Noise Area Category
Maximum Sound Pressure Level , Leq, I hr, dB(A) Leq
Differences Leq
Existing Noise Level Likely to Decrease in Fut ure? (y/n)
Adjustment t o Maximum PNL (Table 4) Leq
Maximum PNL, Leq Leq
Lowest Criteria L90/Leq
Specific Noise Limit (Equation I), I.e. component noise limit. Leq, dB( A) Leq
3329 R0 3VOl .d oc Queensland Coke & Power Plant Project N o i s e A s p e c t s o f E n v i r o n m e n t a I I m p a c t S t u d y U R S Page 14 tl)
CONSLA.TING ENGINEERS
Location: B2
Noise Levels, dB(A) Noise
Description Day Evening Night Parameter
Measured Background Noise Levels, from Logging Data (lowest I Oth %) 28 29 26 L90
Acceptable Background N oise Levels, from Logging Data (lowest I Oth %) - Minimum 25 dB( A) L90
Recommended Background Noise Levels, Table I L90
Differences L90
Adjustment to Background Noise Level (Table 2) L90
Maximum Planning Level, L90 L90
Acceptab le Existing Noise Levels, from Logging Data, Leq Leq
Noise Area Category
Maximum Sound Pressure Level, Leq, I hr, dB(A) Leq
Differences Leq
Existing Noise Level Likely to Decrease in Future? (y/n)
Adjustment to Maximum PNL (Table 4) Leq
Maximum PNL, Leq Leq
Lowest Criteria L90/Leq
Specific Noise Limit (Equation I), I.e. component noise limit, Leq, dB( A) 36 37 31 Leq
3329R03VO l .doc Queensland Coke & Power Plant Project N o i se Aspects o f Env i ronme n tal I mpact Study URS Pagels tl)
CONSULTING ENGINEERS
Location: VI
Noise Levels, dB(A) Noise
Description Day Evening Night Parameter
Measured Background Noise Levels, from Logging Data (lowest I Oth %) 35 33 32 L90
Acceptable Background Noise Levels, from Logging Data (lowest IOth %) - Minimum 25 dB(A) L90
Recommended Background Noise Levels, Table I L90
Differences L90
A djustment to Background N oise Level (Table 2) L90
Maximum Planning Level, L90 L90
A cceptab le Existing Noise Levels, from Logging Data, Leq Leq
Noise Area Category
Maximum Sound Pressure Level, Leq, I hr, dB(A) Leq
Differences Leq
Existing Noise Level Likely to Decrease in Future 7 (y/n)
Adjustment t o Maximum PNL (Table 4) Leq
Maximum PNL, Leq Leq
Lowest Criteria L90/Leq
Specific Noise Limit (Equation I). I.e. component noise limit. Leq, dB(A) Leq
3329R03VO I .doc Queensland Coke & Power Plant P ro ject Noise Aspects o f En v ir o nm e nt a I Im pact St ud y URS Page 16 t1)
CONSU..TING ENGINEERS
Location: V4
Noise Levels, dB(A) Noise
Description Day Evening Night Parameter
Measured Background N oise Levels. from Logging Data (lowest I Oth %) 36 36 33 L90
Acceptable Background Noise Levels, from Logging Data (lowest IOth %) - Minimum 25 dB(A) L90
Recommended Background N oise Levels, Table I L90
Differences L90
Adjustment to Background Noise Level (Table 2) L90
Maximum Planning Level, L90 L90
Acceptable Existing N oise Levels. from Logging Dat a. Leq Leq
N oise Area Category
Maximum Sound Pressure Level, Leq. I hr. dB( A) Leq
Differences Leq
Existing Noise Level Likely to Decrease in Future ? (yin)
Adjustment to Maximum PNL (Table 4) Leq
Maximum PNL. Leq Leq
Lowest Criteria L90/Leq
Specific Noise Limit (Equation I), I.e. component noise limit, Leq, dB( A) Leq
3329R03VO l. doc Queensland Coke & Power Plant Project Noise Aspects of Environmental Im p ac t S t udy URS Page17 t!/)
CONSULTING ENGINEERS
Appendix B: Noise Source Data Including Attenuation Measures
3329R03VO I .doc Queensland Coke & Power Plant Project Noise Aspects of Environmental Im pact Study URS Page 18 tl)
CONSULTING ENGINEERS
Table B. I: Sound Power Level of Equipment - Includes attenuation measures
Number Sound Power Level in dB at Octave Band Centre Frequency (Hz) Overall
Item In Source of Data Model dB
63 125 250 500 1000 2000 4000 8000
Quench car 4 88 83 95 85 84 80 79 79 97 Electric motor rolling on tracks
Based on noise source of material falling into metal
Quench 4 98 94 91 90 90 87 77 67 IOI hopper, then attenuated to
tower allow for coke being pushed onto concrete sloping wharf structure
Coal
Conveyor Data from published Clermont Coal EIS report for
from open coal conveyor. Based
stockpiles on other data sources, we
3 90 91 91 93 87 82 73 65 98 recommend using low noise stockpiles to idlers to achieve this sound
crush/screen power level. The sound
crush/screen power level for the conveyor is on a per I 00 m basis.
to ovens
Coal
Conveyor I 95 96 96 98 92 87 78 70 103 As above
from rail
Data from published Clermont Coal EIS report for open coal conveyor less 7
Coke 8 88 89 89 91 85 80 71 63 96 dB(A) as coke conveyor run
Conveyors with significantly less tonnage at lower speed. The sound power level for the conveyor is on a per I 00 m basis.
Based on noise measurement from transfer point at a
Coal transfer limestone transfer station, and
point - out of I 100 94 83 82 79 80 75 74 IOI adjusted to account for expected reduced noise
coke ovens impact of coal. Assumes open plant without walls or enclosure
Coke screen I 103 102 102 IOI 91 86 77 70 108 Based on noise measurements of similar items of plant
Nut Based on noise measurement
I 104 IOI 95 90 91 91 88 87 107 at another project, with bin/breeze material falling into a metal
3329R03VO I .doc Queensland Coke & Power Plant Project Noise Aspects of Environmental Impact Study URS Page 19 tl)
CONSULTING ENGINEERS
Number Sound Power Level in dB at Octave Band Centre Frequency (Hz) Overall
Item in Source of Data Model dB
63 125 250 500 1000 2000 4000 8000 bin chute/hopper
Stacker I 103 99 99 IOI 97 93 91 90 108 Based on published data for a
reclaimer reclaimer at Wagerup
Coal crush & I 103 102 102 IOI 91 86 77 70 108 Based on noise measurements
screen of similar items of plant
Rail loader I 118 109 99 98 95 94 92 85 119 Data from published Clermont Coal EIS report.
Cooling Fan noise calculation, using tower (4/8 2 109 99 107 93 89 83 75 69 112 algorithms in Bies & Hansen
fans running) textbook
Air handling Fan noise calculation, using
fan (main 4 103 93 96 77 68 57 47 38 104 algorithms in Bies & Hansen textbook No attenuation
stacks) downstream.
Based on noise measurement at Stanwell Power Station less
Turbine I 109 108 IOI 104 103 99 96 85 113 2 dB(A), as Coke Plant
house turbine house is half the size of Stanwell Power Station (i.e. 200MW v 350 MW)
Stacker I 98 98 99 97 96 92 86 79 105 Based on published data for a stacker at Wagerup
Coal transfer Based on noise measurements
point- into I 105 98 86 83 77 76 69 67 106 of similar items of plant
coke ovens
Coal transfer Based on noise measurements
point - out of I 105 98 86 83 77 76 69 67 106 of similar items of plant
stockpiles
3329R03VO I .doc Queensland Coke & Power Plant Project Noise Aspects of Environmental Impact Study URS Page 20 t!I)