Embed Size (px)
Citation preview
IFRS CONVERGENCE AND EARNINGS FORECASTS: MALAYSIAN IPO COMPANIES
By
ZULAIKHA RABITAH ZAIDI
Thesis Submitted to the Othman Yeop Abdullah Graduate School of Business,
Universiti Utara Malaysia, in Partial Fulfillment of the Requirement for the Master of Science (International
Accounting)

ii
PERMISSION TO USE
In presenting this dissertation in partial fulfillment of the requirements for a postgraduate
degree from the Universiti Utara Malaysia, I agree that the University Library make a
freely available for inspection. I further agree that permission for copying of this
dissertation in any manner, in whole or in part, for scholarly purpose may be granted by
my supervisor or, in their absence by the Dean of Othman Yeop Abdullah Graduate
School of Business. It is understood that any copying or publication or use of this
dissertation or parts thereof for financial gain shall not be given to me and to Universiti
Utara Malaysia for any scholarly use which may be made of any material from my
dissertation.
Request for permission to copy or make other use of materials in this dissertation/project
paper, in whole or in part should be addressed to:
Dean of Othman Yeop Abdullah Graduate School of Business
Universiti Utara Malaysia
06010 UUM Sintok
Kedah Darul Aman
iii
ABSTRACT
The study sheds light on the Malaysian initial public offering (IPO) management earnings forecasts by examining the effect of International Financial Reporting Standards (IFRS) convergence and the forecast errors. It examines whether the convergence of IFRS is a credible signal of improved quality of financial information. Besides, the study also investigates the other factors that influence the forecast errors of the earnings forecasts. A sample of 98 IPO companies that went public during the period 2004-2007 is used. The time frame of this study includes the years 2004 to 2005 (i.e., pre-IFRS convergence) and years 2006 to 2007 (i.e., post-IFRS convergence). Forecast errors as a dependent variable is used to proxy the earnings forecast error and to represent financial disclosure quality.
By examining the forecast errors in two different periods (i.e., pre-IFRS convergence & post-IFRS convergence), the study finds that the forecast errors has increased under the post-IFRS convergence. In addition, the findings reveal the size of the company is significantly negative with the forecast errors. This study has implications on the disclosure regulations of earnings forecasts in the prospectuses in Malaysia and provides evidence regarding disclosure of the earnings forecasts being changed from mandatory to voluntary in Malaysia.
iv
ABSTRAK
Kajian ini menyiasat tentang kesan penggunaan Piawai Kewangan Laporan Antarabangsa (PLKA) terhadap unjuran pendapatan pengurusan iaitu ralat ramalan sama ada ralat ramalan menurun atau meningkat selepas penumpuan PLKA. Kajian ini menyiasat sama ada PLKA merupakan salah satu faktor yang menyumbang kepada kualiti penyata kewangan di Malaysia. Selain itu, kajian ini juga menyiasat faktor-faktor lain yang mempengaruhi ralat ramalan kepada ramalan pendapatan. Sampel kajian ini terdiri daripada 98 buah syarikat-syarikat tawaran awam permulaan yang tersenarai di Bursa Malaysia pada tahun 2004 sehingga 2007. Tempoh masa kajian ini meliputi tahun 2004 hingga 2005 (iaitu, sebelum penggunaan PLKA) dan tahun 2006 hingga 2007 (iaitu, selepas penggunaan PLKA). Ralat ramalan digunakan sebagai pembolehubah bersandar untuk mengukur ralat ramalan pendapatan dan mewakili kualiti penyata kewangan.
Dengan membandingkan ralat ramalan dalam dua tempoh yang berbeza iaitu (iaitu sebelum dan selepas penggunaan PKLA), kajian ini mendapati ralat ramalan meningkat selepas penggunaan PKLA. Tambahan pula, hasil kajian ini mendapati saiz syarikat merupakan faktor yang paling mempengaruhi ralat ramalan dan penting secara statistiknya. Kajian ini memberi implikasi terhadap polisi di Malaysia dalam melaporkan ramalan pendapatan dalam prospektus di Malaysia dan menyediakan bukti tentang perubahan dalam melaporkan ramalan pendapatan daripada wajib kepada sukarela.

v
ACKNOWLEDGEMENTS
First of all, I would like to express my deepest appreciation to my dissertation supervisor,
Assoc. Prof. Dr. Nurwati Ashikkin Binti Ahmad Zaluki, whose contribution in
stimulating suggestions and encouragement. This dissertation would never have been
completed without her guidance and constant supervision. Besides, I would like to thank
her for spending valuable time to review my works. I am highly indebted to her.
Besides, I would like to express my gratitude and thanks to my husband and family
members who always giving their consideration, supports and unending love. My
appreciations also go to all my friends who had assisted and guiding me in finishing this
dissertation. Last but not least, I am thankful to those who had helped me.
vi
TABLE OF CONTENT
PERMISSION TO USE.......................................................................................................ii
ABSTRACT.......................................................................................................................iii
ABSTRAK .........................................................................................................................iv
ACKNOWLEDGEMENTS...............................................................................................v
LIST OF TABLES .............................................................................................................ix
LIST OF FIGURE.............................................................................................................x
LIST OF ABBREVIATIONS..........................................................................................xi
CHAPTER ONE .................................................................................................................1
INTRODUCTION ..............................................................................................................1
1.1 Background of the study .........................................................................................1
1.2 Problem Statement……...........................................................................................5
1.3 Research Objectives….............................................................................................6
1.4 Research Questions…..............................................................................................6
1.5 Significance of the study..........................................................................................7
1.6 Scope of the study…………....................................................................................9
1.7 Organization of the study…….................................................................................9
CHAPTER TWO...............................................................................................................11
LITERATURE REVIEW..................................................................................................11
2.0 Introduction.....................................................................................................…...11
2.1 Theoretical framework ..........................................................................................11
2.2 Conceptual framework of management earnings forecast……………………….15
2.3 IFRS convergence in many countries including Malaysia…………………….21
vii
2.4 Roles of MASB towards the convergence of IFRS……………………………...24
2.5 Empirical results on IFRS, IPOs and earnings forecasts………………………...28
2.6 Factors that influence the earnings forecasts error………………………………34
2.6.1 Age of the company………………………………………………………..36
2.6.2 Size of the company………………………………………………………..37
2.6.3 Forecast interval (horizon)…………………………………………………39
2.6.4 Leverage (the gearing ratio)………………………………………………..41
2.6.5 Auditors’ reputation………………………………………………………..42
2.6.6 Industry…………………………………………………………………….45
2.6.7 IFRS convergence…………………………………………………………45
2.7 Summary…………………………………………………………………………47
CHAPTER THREE……………………………………………………………………...49
METHODS………………………………………………………………………………49
3.0 Introduction………………………………………………………………………49
3.1 Research frameworks…………………………………………………………….50
3.2 Hypotheses development………………………………………………………...50
3.2.1 IFRS Convergence………………………………………………………..50
3.2.2 Age…………………………………………………………………………51
3.2.3 Size…………………………………………………………………………51
3.2.4 Forecast horizon……………………………………………………………52
3.2.5 Leverage……………………………………………………………………53
3.2.6 Auditors’ reputation………………………………………………………..54
3.2.7 Classification of Industry…………………………………………………..55
viii
3.3 Sample size………………………………………………………………………56
3.4 Research design………………………………………………………………….58
3.4.1 Definition and Measurement of Variables…………………………………58
3.4.2 Research Model……………………………………………………………63
3.5 Summary…………………………………………………………………………65
CHAPTER FOUR………………………………………………………………………..66
RESULTS AND DISCUSSIONS………………………………………………………..66
4.0 Introduction………………………………………………………………………66
4.1 Descriptive statistics……………………………………………………………..66
4.1.1 Descriptive Statistic of Dependent variable………………………………..66
4.1.2 Descriptive Statistic for Independent variable……………………………..71
4.1.3 Distribution of FE………………………………………………………….74
4.1.4 Univariate analyses………………………………………………………...77
4.2 Regression result…………………………………………………………………80
4.3 Summary…………………………………………………………………………87
CHAPTER FIVE………………………………………………………………………...88
CONCLUSION AND RECOMMENDATION………………………………………….88
5.0 Introduction………………………………………………………………………88
5.1 Findings of the study……………………………………………………………..88
5.2 Limitations of the study and recommendations………………………………….91
5.3 Summary…………………………………………………………………………93
REFERENCES…………………………………………………………………………..92
APPENDIX…………………………………………………………………………….99
ix
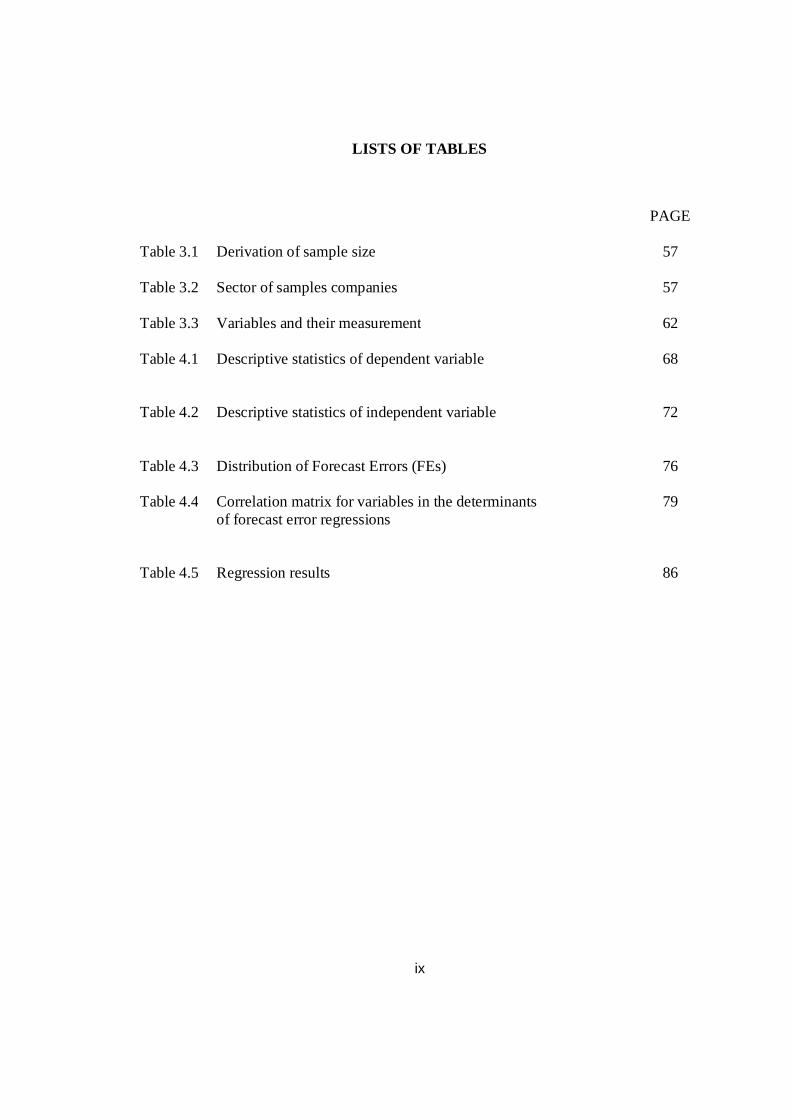
LISTS OF TABLES
PAGE
Table 3.1 Derivation of sample size 57
Table 3.2 Sector of samples companies 57
Table 3.3 Variables and their measurement 62
Table 4.1 Descriptive statistics of dependent variable
68
Table 4.2 Descriptive statistics of independent variable
72
Table 4.3 Distribution of Forecast Errors (FEs) 76
Table 4.4 Correlation matrix for variables in the determinants of forecast error regressions
79
Table 4.5 Regression results 86

x
LIST OF FIGURE
PAGE
Figure 3.1 Research framework 49
xi
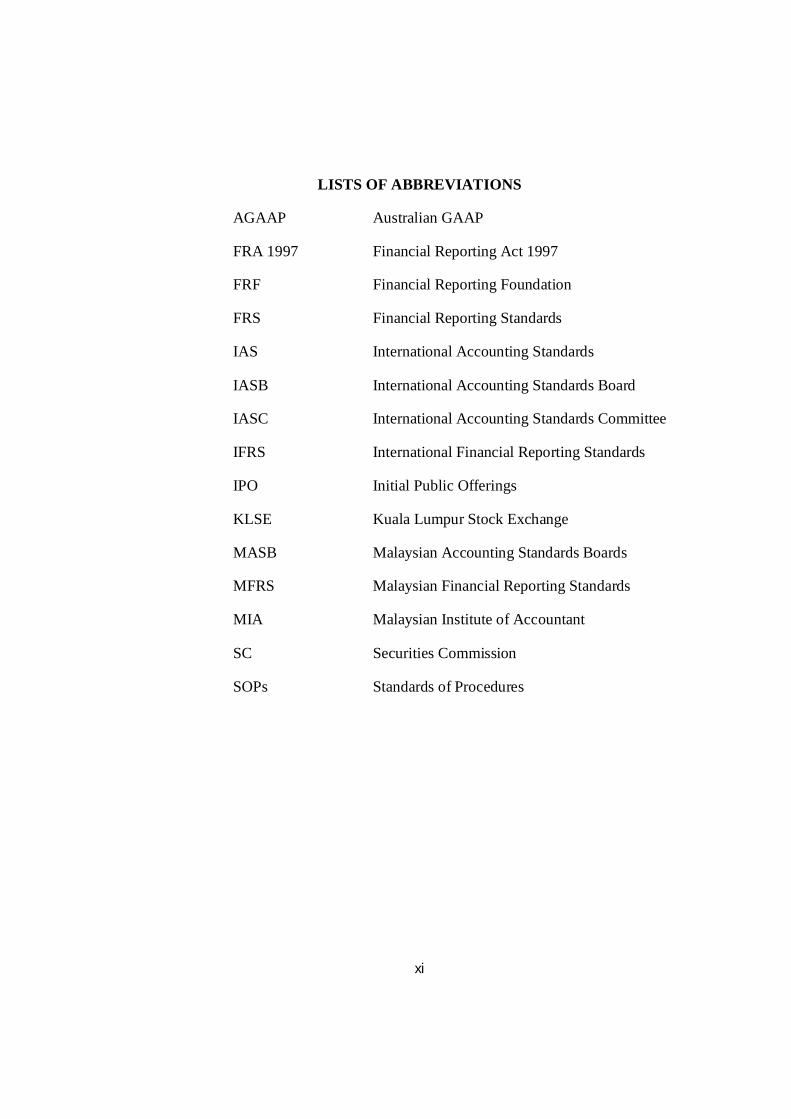
LISTS OF ABBREVIATIONS
AGAAP Australian GAAP
FRA 1997 Financial Reporting Act 1997
FRF Financial Reporting Foundation
FRS Financial Reporting Standards
IAS International Accounting Standards
IASB International Accounting Standards Board
IASC International Accounting Standards Committee
IFRS International Financial Reporting Standards
IPO Initial Public Offerings
KLSE Kuala Lumpur Stock Exchange
MASB Malaysian Accounting Standards Boards
MFRS Malaysian Financial Reporting Standards
MIA Malaysian Institute of Accountant
SC Securities Commission
SOPs Standards of Procedures
1
CHAPTER ONE
INTRODUCTION
1.1 Background of the Study
The interconnectedness of the capital market across the globe has fuelled the demand for
the harmonization of the accounting language. Harmonized accounting language, which
is widely postulated in literature will add more value to reporting quality, and at the same
time, understandability of financial information across different regulatory settings
(Stovall, 2010). The International Accounting Standards Board (IASB) has been at the
forefront in the course of accounting standards harmonization. The body previously
known as the International Accounting Standards Committee (IASC) is committed to
developing a single set of accounting standards that can be applied globally. Interestingly,
international organizations, like the United Nations, the International Organization of
Securities Commissions, the World Bank and the World Trade Organization have
endorsed the International Financial Reporting Standards (IFRS) as a set of global high
quality accounting standards (Stovall, 2010).
The adoption of IFRS in many reporting jurisdictions will improve financial reporting
transparency and comparability and consequently contribute to the efficient functioning
of the global capital market (Firth, Gounopoulus and Pulm, 2013). The IFRS has now
become a global trend with many countries in the European Union, Asia, Africa and
some other continents converting their local standards to IFRS. The IFRS are principle-
based accounting standards. Compared to rule-based accounting standards, principle-

The contents of
the thesis is for
internal user
only

93
REFERENCES
Ahmad-Zaluki, N.A., Campbell, K. and Goodacre, A. (2007), “The long run share price performance of Malaysian initial public offerings (IPOs)”, Journal of Business Finance & Accounting, Vol.34, pp. 78-110.
Ahmad-Zaluki, N.A. and Wan-Hussin, W.N. (2010), “Corporate governance and earnings forecasts accuracy”, Asian Review of Accounting, Vol.18 No .1, pp. 50-67.
Akerlof, G. (1970), “The market for lemons: qualitiative uncertainty and the market mechanism,” Quarterly Journal of Economics, Vol. 84, pp. 488-500.
Anabila, A. and Whang, E. Y. (2014), “Determinants of the bias and inaccuracy of management earnings forecasts”, Accounting & Taxation, Vol. 6 No.1, pp. 1-12.
Jeny, A. C. and Jeanjean, T. (2007), “Levels of voluntary disclosure in IPO prospectuses: an empirical analysis”, Review of Accounting and Finance, Vol. 6 No. 2, pp.131 – 149.
Ashbaugh, H., and Pincus, M. (2001), “Domestic accounting standards, international accounting standards, and the predictability of earnings”, Journal of Accounting Research, Vol. 39 No. 3, pp. 417-434.
A compilation of articles on FRS, (2005). Retrieved August 5, 2013 from http://www2.accaglobal.com/pubs/malaysia/members/resources/frs_articles/2552629.pdf
About the IFRS Foundation and the IASB, (2014). Retrieved April 10, 2014 from http://www.ifrs.org/The-organisation/Pages/IFRS-Foundation-and-the-IASB.aspx
Ball, R., Robin, A. and Wu, J. S. (2003), “Incentives versus standards: properties of accounting income in four East Asian countries”, Journal of Accounting and Economics, Vol. 36, pp. 235-270.
Ball, R. (2006), “International financial reporting standards: pros and cons for investors”, Accounting and Business Research, International Accounting Policy Forum, pp. 5-27.
Barth, M. E., Landsman, W. R. and Lang, M. H. (2008), “International Accounting Standards and accounting quality”, Journal of Accounting Research, Vol. 46 No. 3, pp. 467-497.
94
Bédard, J. Coulombe, D. and Courteau, L. (2008), “Audit committee, underpricing of ipos, and accuracy of management earnings forecasts”, Corporate Governance: An International Review, Vol. 16 No.6, pp. 519-535.
Bilson, C. M., Powell, J. G. and Shi, J. (2006), “Valuation uncertainty risk compensation and IPO prospectus earnings forecasts”, Applied Economics Letters. Vol. 15 No. 5, pp. 331-335.
Blouin, M. C. (2012), “Does other information improve the usefulness of management earnings forecasts for analysts?”, Review of Accounting and Finance, Vol. 11 No. 1, pp.93-112.
Brown, P. (2003), “Discussion of voluntary disclosure of management earnings forecasts in IPO prospectuses”, Journal of Business Finance & Accounting, Vol. 30 No. 1/2, pp. 169-173.
Byard, D., Li, Y. and Yu, Y. (2011), “The effect of mandatory IFRS adoption on financial analysts’ information environment”, Journal of Accounting Research, Vol. 49, pp. 69-96.
Cairns, D. (2003), Plenary Address, European Accounting Association Annual Meeting. April 9. Seville, Spain.
Chan, A.M.Y., Sit, C.L.K., Tong, M.M.L., Wong, D.C.K. and Chan, R.W.Y. (1996), “Possible factors of the accuracy of prospectus earnings forecasts in Hong Kong”, The International Journal of Accounting, Vol. 31 No. 3, pp. 381–398.
Cheng, T.Y. and Firth, M. (2000), “An empirical analysis of the bias and rationality of profit forecasts published in new issue prospectuses”, Journal of Business Research and Accounting, Vol. 27 No. 3/4, pp. 423-45.
Chen, G.M. and Firth, M. (1999), “The accuracy of profit forecasts and their role and association with IPO firm valuations”, Journal of International Financial Management and Accounting, Vol. 10 No. 3, 202-226.
Chen, G., Firth, M. and Krishnan, G. (2001), “Earnings forecast errors in IPO prospectuses and their associations with initial stock returns”, Journal of Multinational Finance Management, Vol. 11, pp. 225-240.
Choi, F.D.S. and Meek, G. International Accounting, 5th edition, Prentice-Hall (2005).
Clarkson, P.M., Dontoh, A., Richardson, G. and Sefcik, S. E. (1992), “The voluntary inclusion of earnings forecasts in IPO prospectuses”, Contemporary Accounting Research, Vol.8 No. 2, pp. 601–616.
95
Cotter, J., Tarca, A. and Wee, M. (2012), “IFRS adoption and analysts’ earnings forecasts: Australian evidence”, Accounting & Finance, Vol. 52 No.2, pp. 395–419.
Covrig, V. M., Defond, M. L. and Hung, M. (2007), “Home bias, foreign mutual fund holdings, and the voluntary adoption of international accounting standards”, Journal of Accounting Research, Vol. 45, pp. 41-70.
Daske, H., Hail, L., Leuz, C. and Verdi, R. (2008), “Mandatory IFRS reporting around the world: early evidence on the economic consequences”, Journal of Accounting Research, Vol. 46 No. 5, pp. 1085–1142.
De Angelo, L. (1981), “Auditor size and audit quality”, Journal of Accounting and Economics, Vol. 3, pp. 183-199.
Dev, S. and Webb, M. (1972), “The accuracy of company profit forecasts”, Journal of Business Finance, Vol. 4 No. 3, pp. 26-39.
El-Rajabi, M. T. A. and Gunasekaran, A. (2006), “The accuracy of earnings forecasts disclosed in the prospectuses of newly formed public companies in Jordan”, Managerial Auditing Journal, Vol. 21 No. 2, pp.117-131.
Ferris, K.R. and Hayes, D.C. (1977), “Some evidence on the determinants of profit forecast accuracy in the United Kingdom,” The International Journal of Accounting Education and Research, (Spring), pp. 27-36.
Firth, M. and Smith, A. (1992), “The accuracy of profits forecasts in initial public offering prospectuses”, Accounting and Business Research, Vol. 22, pp. 239–247.
Firth, M., Kwok, B.C.H., Liau-Tan, C.K. and Yeo, G.H.H. (1995), “Accuracy of profit forecasts contained in IPO prospectuses”, Accounting and Business Review, Vol. 2, pp. 55–83.
Firth, M. (1998), “IPO earnings forecasts and their role in signaling firm value and explaining post-listing returns”, Applied Financial Economics, Vol. 8, pp. 29-39.
Firth, M., Gounopoulos, D. and Pulm, J. (2013), “IFRS adoption and management earnings forecasts of Australian IPOs”, http://ssrn.com/abstract=2199034
Yau, F. S. Chun., L. S. (1999), “Earnings forecast accuracy and bias in initial public offerings in Malaysia”, Singapore Management Review. , Vol. 21 No. 2, pp. 89-108.
Full convergence with IFRS in 2012, (2008). Retrieved August 15, 2013, from http://www.mia.org.my/at/at/200810/06.pdf
96
Gebhardt, G. and Faskas, Z. N. (2011), “Mandatory IFRS adoption and accounting quality of European banks”, Journal of Business Finance & Accounting, Vol. 38 No. 3-4, pp. 289–333.
Gounopoulos, D. (2011), Government Securities Market (Bulgarian National Bank). 2011 Supplement, pp. 235-272.
Hagerman, R.L. and Ruland, W. (1979), “The accuracy of management forecasts and forecasts of simple alternative models,” Journal of Economics and Business, pp. 172-179.
Hartnett, N. and Romcke, J. (2000), “The predictability of management forecast error: a study of Australian IPO disclosure”, Multinational Finance Journal, Vol. 4, pp. 101-132.
Horton, J., Serafeim, G. and Serafeim, I. (2013), “Does mandatory IFRS adoption improve the information environment”, Contemporary Accounting Research, Vol. 30, pp. 388-423.
Hussin, M. B., Sulong, F., and Osman, S. (2004), “The effect of forecast earnings errors in IPO prospectus on shareholders return”, UNITEN International Business Management Conference, 6-7 December.
IASB. (2013). About the IFRS Foundation and the IASB. Retrieved August 30, 2013, from IASB Official Website: http://www.ifrs.org/The-organisation/Pages/IFRSFoundation-and-the IASB.aspx
IASB. (2013). The move towards global standards. Retrieved August 31, 2013, from IASB Official Website: http://www.ifrs.org/use-around-the-world/Pages/use-aroundthe-world.aspx
Ismail, N. and Weetman, P. (2008), “Regulatory profit targets and earnings management in initial public offerings: the case of Malaysia”, Journal of Financial Reporting and Accounting, Vol. 6 No. 1, pp. 91-115.
Jaggi, B. (1997), “Accuracy of forecast information disclosed in the IPO prospectuses of Hong Kong companies”, The International Journal of Accounting, Vol. 32 No. 3, pp. 301–319.
Jaggi, B., Chin, C., Lin, H.W. and Lee, P. (2006), “Earnings forecast disclosure regulation and earnings management: evidence from Taiwan IPO firms”, Review of Quantitative Finance & Accounting, Vol. 26 Issue 3, pp. 275-299.
97
Jeanjean, T. and Stolowy, H. (2008), “Do accounting standards matter? an exploratory analysis of earnings management before and after IFRS adoption”, Journal Accounting Public Policy, Vol. 27, pp. 480-494.
Jelic, R., Saadouni, B. and Briston, R. (1998), “The accuracy of earnings forecasts in IPO prospectuses on the Kuala Lumpur stock exchange 1984–1995”, Accounting and Business Research, Vol.29 No. 3, pp. 57–62.
Jog, V. and McConomy, B.J. (1999), “Voluntary disclosure of management earnings forecasts in IPOs and the impact on underpricing and post-issue return performance”, Working paper, School of Business, Carlton University, Ottawa.
Jog, V. and McConomy, B. (2003). “Voluntary Disclosure of Management Earnings Forecasts in IPO Prospectuses”, Journal of Business, Finance & Accounting, 30(1)(2), pp. 125-167.
Karamanou, I. and Vafeas, N. (2005), “The association between corporate boards, audit committees, and management earnings forecasts: an empirical analysis”, Journal of Accounting Research, Vol. 43, pp. 453-486.
Karim, W., Ahmed, K. and Hasan, T. (2013), “Impact of audit quality and ownership structure on the bias and accuracy of earnings forecasts issued in IPO prospectuses: evidence from a frontier market”, Studies in Economics and Finance, Vol. 30 No. 4, pp.288 – 316.
Keasey, K. and McGuinness, P. (1991), “Prospectus earnings forecasts and the pricing of new issues on the unlisted securities market”, Accounting and Business Research, Vol. 21 No.82, pp. 133-145.
Landsman, W. R., Maydew, E.L. and Thornock, J.R. (2011), “The information content of annual earnings announcements and mandatory adoption of IFRS”, Journal of Accounting and Economics, Vol. 53, pp. 34-54.
Lee, P.J., Taylor, S.J. and Taylor, S.L. (2006), “Auditor conservatism and audit quality: evidence from IPO earnings forecasts”, International Journal of Auditing, Vol. 10, pp. 183-99.
Leuz, C. and Verrecchia, R. E., (2000), “The economic consequences of increased disclosure”, Journal of Accounting Research, Vol. 38, (Supplement: Studies on Accounting Information and the Economics of the Firm), pp. 91-124.
Lonkani, R. and Firth, M. (2005), “The accuracy of IPO earnings forecasts in Thailand and their relationships with stock market valuation”, Accounting and Business Research, Vol. 35, pp. 269-286.
98
Mak, Y.T. (1989), “The determinants of accuracy of management earnings forecasts: a New Zealand study,” The International Journal of Accounting, Vol. 24, pp: 267-280.
Malaysia’s convergence with IFRS in 2012, (2008). Retrieved August 1, 2013 from http://www.masb.org.my/index.php?option=com_content&view=article&id=1239:malays
Malaysian Accounting Standards Board. (2013). MASB Profile. Retrieved August 31, 2013, from MASB Official Website.
MASB. (2013). Transition to IFRS. Retrieved August 30, 2013, from MASB Official Website: http://www.masb.org.my/index.php?option=com_content&view=article&id=1376&Itemid=63
Mohamad, S., Nassir, A., Kuing, T.K. and Ariff, M. (1994), “The accuracy of profit forecasts of Malaysian IPOs”, Capital Markets Review, Vol. 2 No. 2, pp. 46–69.
Prospectuses Guideline, Chapter 13, Securities Commission (SC, 2008).
Regulation (EC) No 1606/2002 of the European Parliament and of the Council of 19 July 2002 on the application of international accounting standards.
Stovall, J.D. (2010), “The transition to IFRS: what can we learn?”, The Business Review,
Cambridge, Vol. 16 No.1, pp. 120-126. Tan, H., Wang, S. and Welker, M. (2011), “Analyst following and forecast accuracy after
mandated IFRS adoptions”, Journal of Accounting Research, Vol. 49 No. 5, pp. 1307-1357.
Watts, R. L. and Zimmerman, J. L. (1986), Positive Accounting Theory. Englewood
Cliffs, NJ: Prentice-Hall. Yu, G. (2010), “Accounting standards and international portfolio holdings: Analysis of
cross-border holdings following mandatory adoption of IFRS”, Working paper, University of Michigan.
99
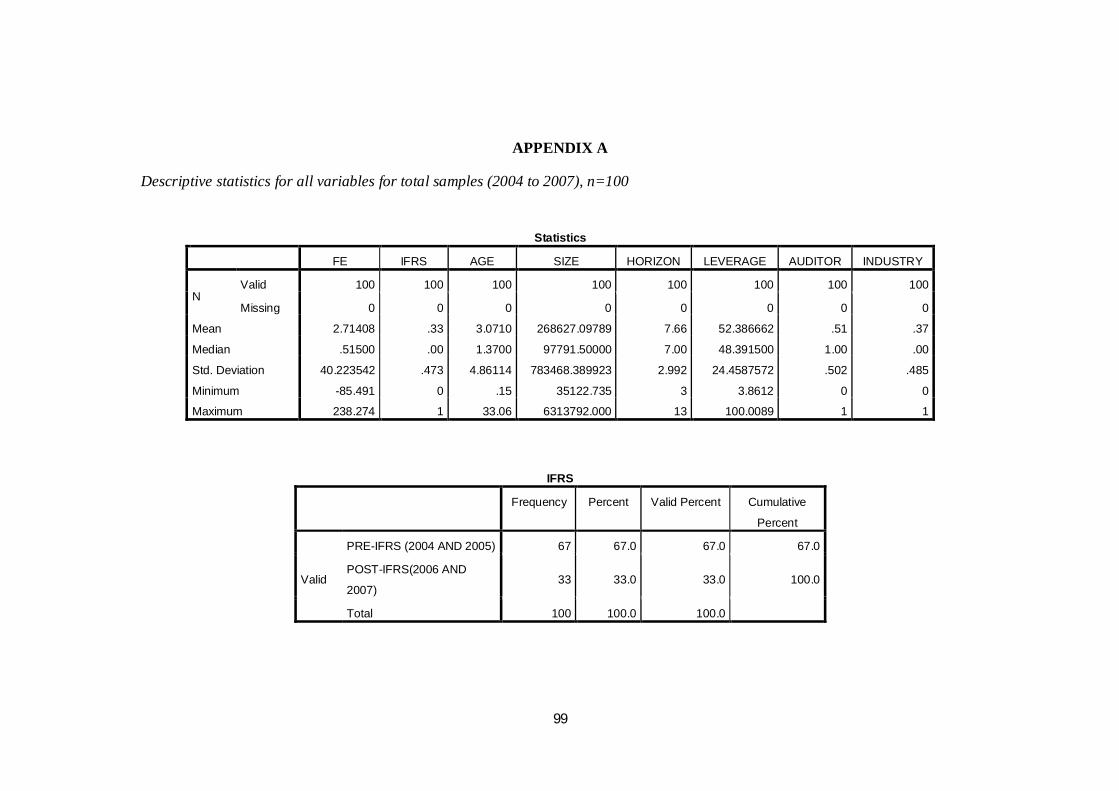
APPENDIX A
Descriptive statistics for all variables for total samples (2004 to 2007), n=100
Statistics
FE IFRS AGE SIZE HORIZON LEVERAGE AUDITOR INDUSTRY
N Valid 100 100 100 100 100 100 100 100
Missing 0 0 0 0 0 0 0 0
Mean 2.71408 .33 3.0710 268627.09789 7.66 52.386662 .51 .37
Median .51500 .00 1.3700 97791.50000 7.00 48.391500 1.00 .00
Std. Deviation 40.223542 .473 4.86114 783468.389923 2.992 24.4587572 .502 .485
Minimum -85.491 0 .15 35122.735 3 3.8612 0 0
Maximum 238.274 1 33.06 6313792.000 13 100.0089 1 1
IFRS
Frequency Percent Valid Percent Cumulative
Percent
Valid
PRE-IFRS (2004 AND 2005) 67 67.0 67.0 67.0
POST-IFRS(2006 AND
2007) 33 33.0 33.0 100.0
Total 100 100.0 100.0
100
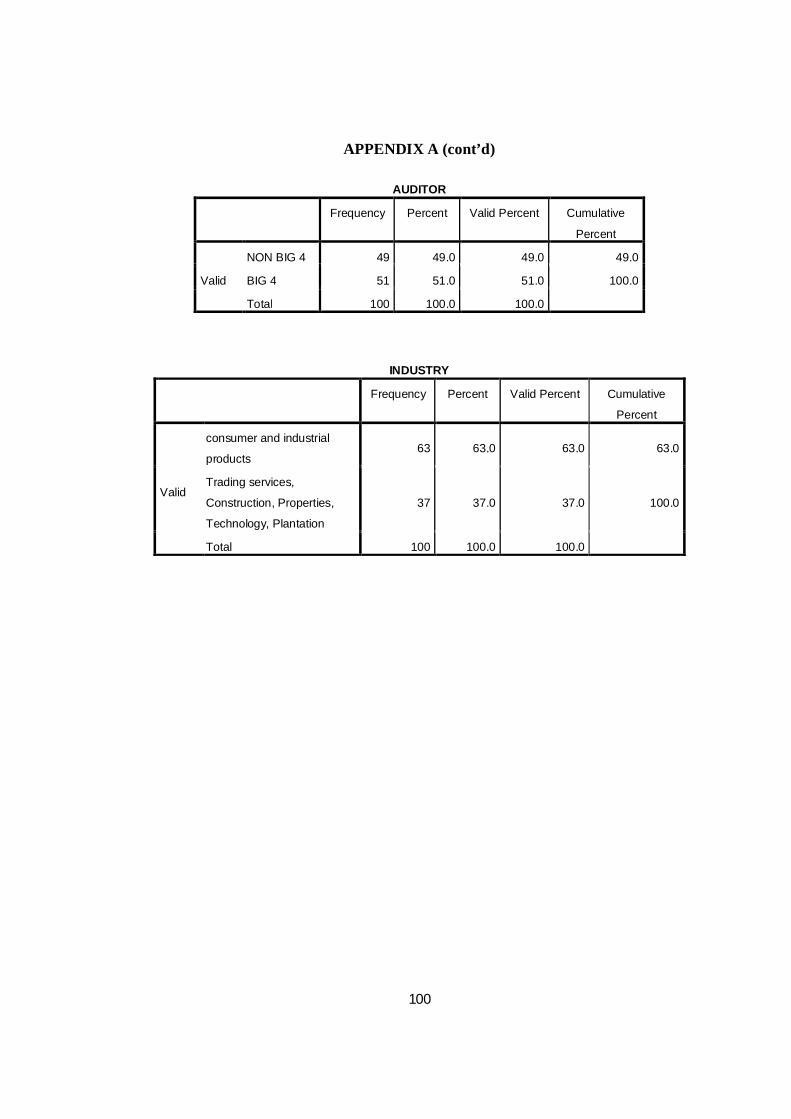
APPENDIX A (cont’d)
AUDITOR
Frequency Percent Valid Percent Cumulative
Percent
Valid
NON BIG 4 49 49.0 49.0 49.0
BIG 4 51 51.0 51.0 100.0
Total 100 100.0 100.0
INDUSTRY
Frequency Percent Valid Percent Cumulative
Percent
Valid
consumer and industrial
products 63 63.0 63.0 63.0
Trading services,
Construction, Properties,
Technology, Plantation
37 37.0 37.0 100.0
Total 100 100.0 100.0
101
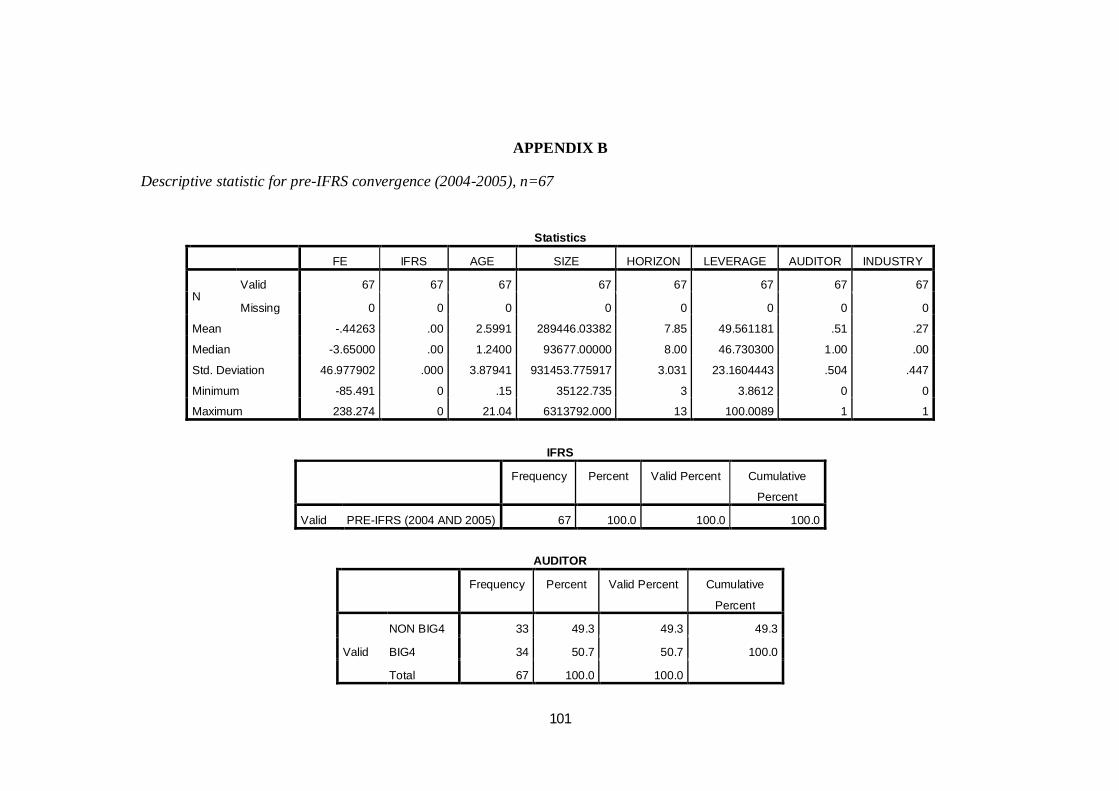
APPENDIX B
Descriptive statistic for pre-IFRS convergence (2004-2005), n=67
Statistics
FE IFRS AGE SIZE HORIZON LEVERAGE AUDITOR INDUSTRY
N Valid 67 67 67 67 67 67 67 67
Missing 0 0 0 0 0 0 0 0
Mean -.44263 .00 2.5991 289446.03382 7.85 49.561181 .51 .27
Median -3.65000 .00 1.2400 93677.00000 8.00 46.730300 1.00 .00
Std. Deviation 46.977902 .000 3.87941 931453.775917 3.031 23.1604443 .504 .447
Minimum -85.491 0 .15 35122.735 3 3.8612 0 0
Maximum 238.274 0 21.04 6313792.000 13 100.0089 1 1
IFRS
Frequency Percent Valid Percent Cumulative
Percent
Valid PRE-IFRS (2004 AND 2005) 67 100.0 100.0 100.0
AUDITOR
Frequency Percent Valid Percent Cumulative
Percent
Valid
NON BIG4 33 49.3 49.3 49.3
BIG4 34 50.7 50.7 100.0
Total 67 100.0 100.0
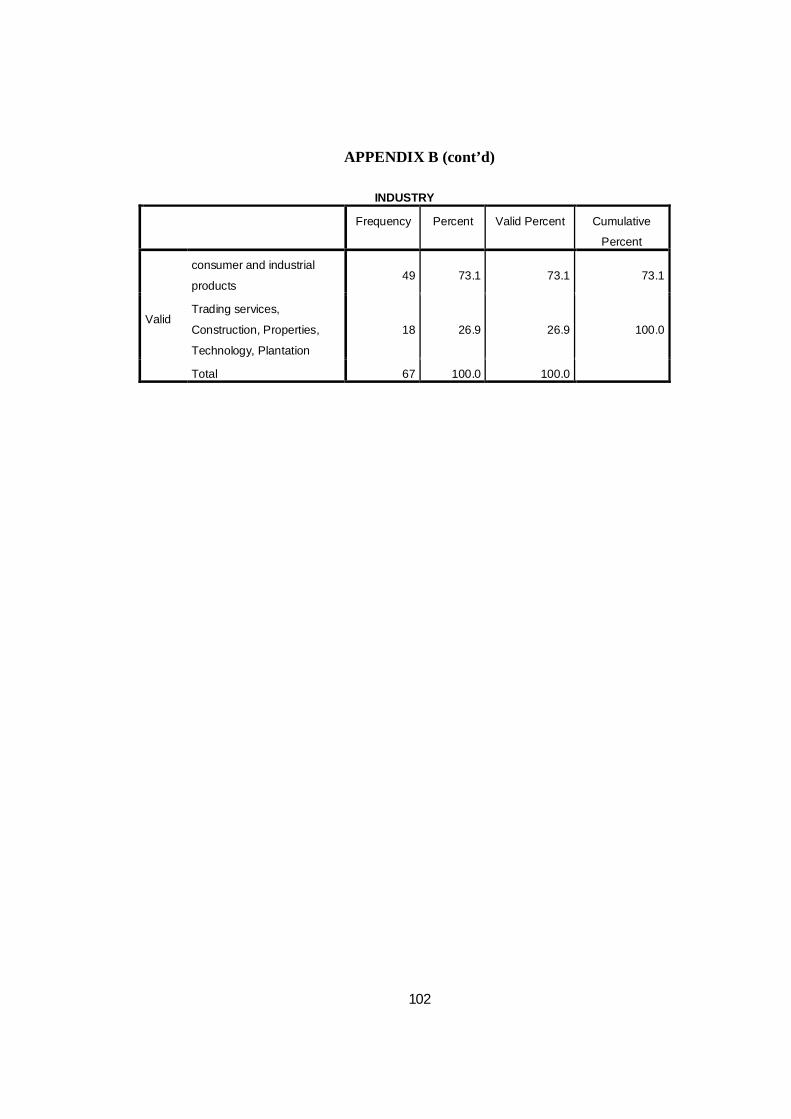
102
APPENDIX B (cont’d)
INDUSTRY
Frequency Percent Valid Percent Cumulative
Percent
Valid
consumer and industrial
products 49 73.1 73.1 73.1
Trading services,
Construction, Properties,
Technology, Plantation
18 26.9 26.9 100.0
Total 67 100.0 100.0
103
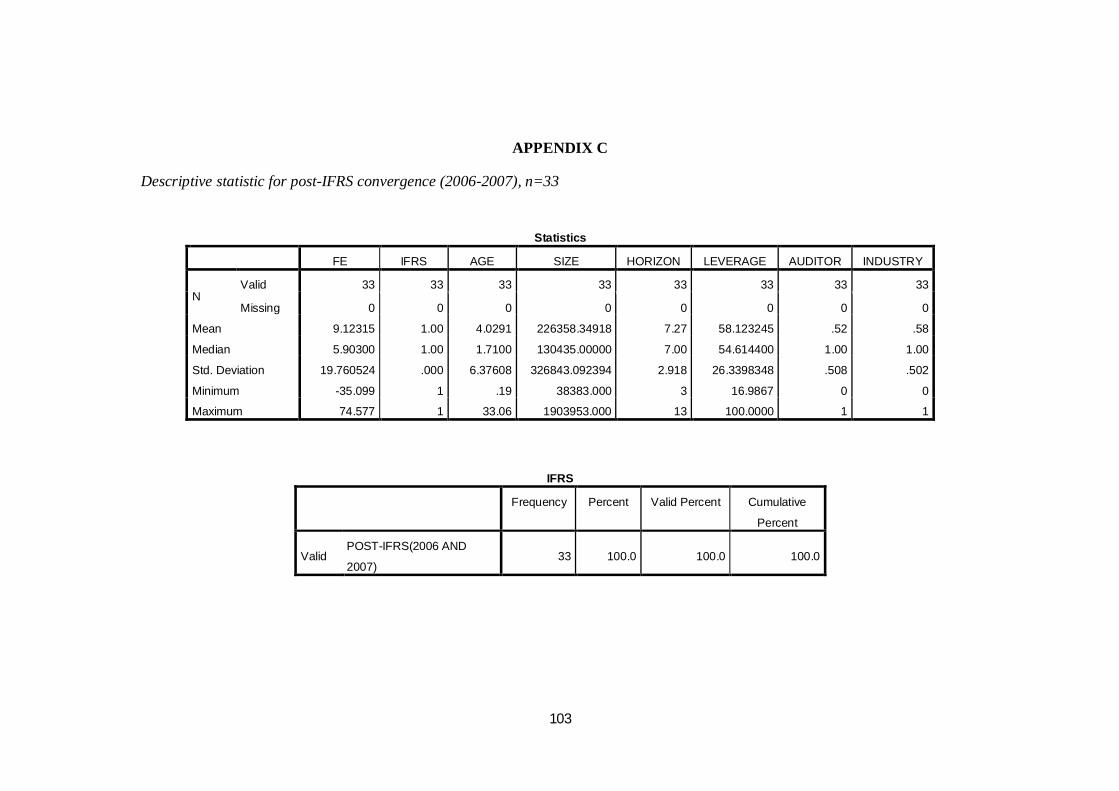
APPENDIX C
Descriptive statistic for post-IFRS convergence (2006-2007), n=33
Statistics
FE IFRS AGE SIZE HORIZON LEVERAGE AUDITOR INDUSTRY
N Valid 33 33 33 33 33 33 33 33
Missing 0 0 0 0 0 0 0 0
Mean 9.12315 1.00 4.0291 226358.34918 7.27 58.123245 .52 .58
Median 5.90300 1.00 1.7100 130435.00000 7.00 54.614400 1.00 1.00
Std. Deviation 19.760524 .000 6.37608 326843.092394 2.918 26.3398348 .508 .502
Minimum -35.099 1 .19 38383.000 3 16.9867 0 0
Maximum 74.577 1 33.06 1903953.000 13 100.0000 1 1
IFRS
Frequency Percent Valid Percent Cumulative
Percent
Valid POST-IFRS(2006 AND
2007) 33 100.0 100.0 100.0
104
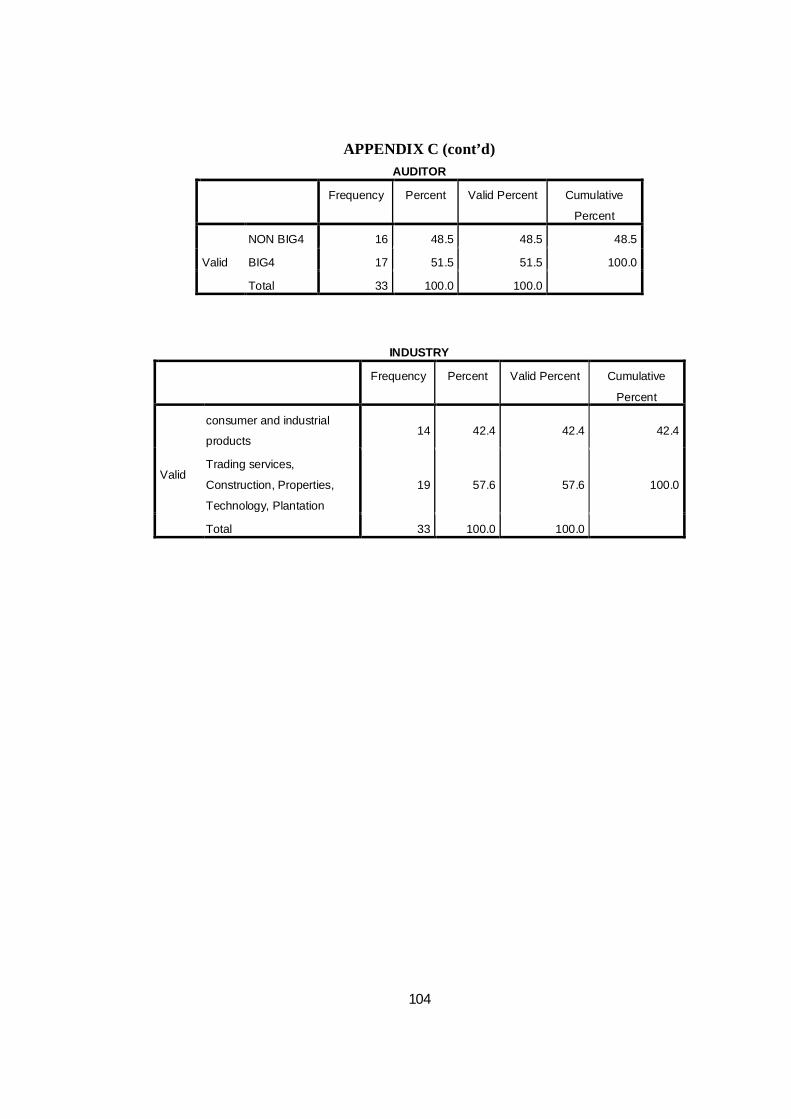
APPENDIX C (cont’d) AUDITOR
Frequency Percent Valid Percent Cumulative
Percent
Valid
NON BIG4 16 48.5 48.5 48.5
BIG4 17 51.5 51.5 100.0
Total 33 100.0 100.0
INDUSTRY
Frequency Percent Valid Percent Cumulative
Percent
Valid
consumer and industrial
products 14 42.4 42.4 42.4
Trading services,
Construction, Properties,
Technology, Plantation
19 57.6 57.6 100.0
Total 33 100.0 100.0

105
APPENDIX D
Descriptive statistics for variables after remove the outliers
Total sample (2004-2007), n=98
Statistics
FE AGE SIZE HORIZON LEVERAGE AUDITOR INDUSTRY IFRS
N Valid 98 98 98 98 98 98 98 98
Missing 0 0 0 0 0 0 0 0
Mean -1.04345 3.0954 272670.92642 7.64 52.779039 .52 .62 .34
Median .28250 1.3450 97947.00000 7.00 48.967850 1.00 1.00 .00
Std. Deviation 29.723785 4.90786 790979.835479 2.999 24.4601690 .502 .487 .475
Minimum -85.491 .15 35122.735 3 3.8612 0 0 0
Maximum 93.433 33.06 6313792.000 13 100.0089 1 1 1 Pre-IFRS convergence (2004-2005), n=65
Statistics
FE IFRS AGE SIZE HORIZON AUDITOR LEVERAGE INDUSTRY
N Valid 65 65 65 65 65 65 65 65
Missing 33 33 33 33 33 33 33 33
Mean -6.20495 .00 2.6214 296183.46563 7.83 .52 50.065826 .28
Median -3.65400 .00 1.1900 94414.00000 8.00 1.00 46.730300 .00
Std. Deviation 32.610863 .000 3.93727 945076.079207 3.044 .503 23.1883960 .451
Minimum -85.491 0 .15 35122.735 3 0 3.8612 0
Maximum 93.433 0 21.04 6313792.000 13 1 100.0089 1
106
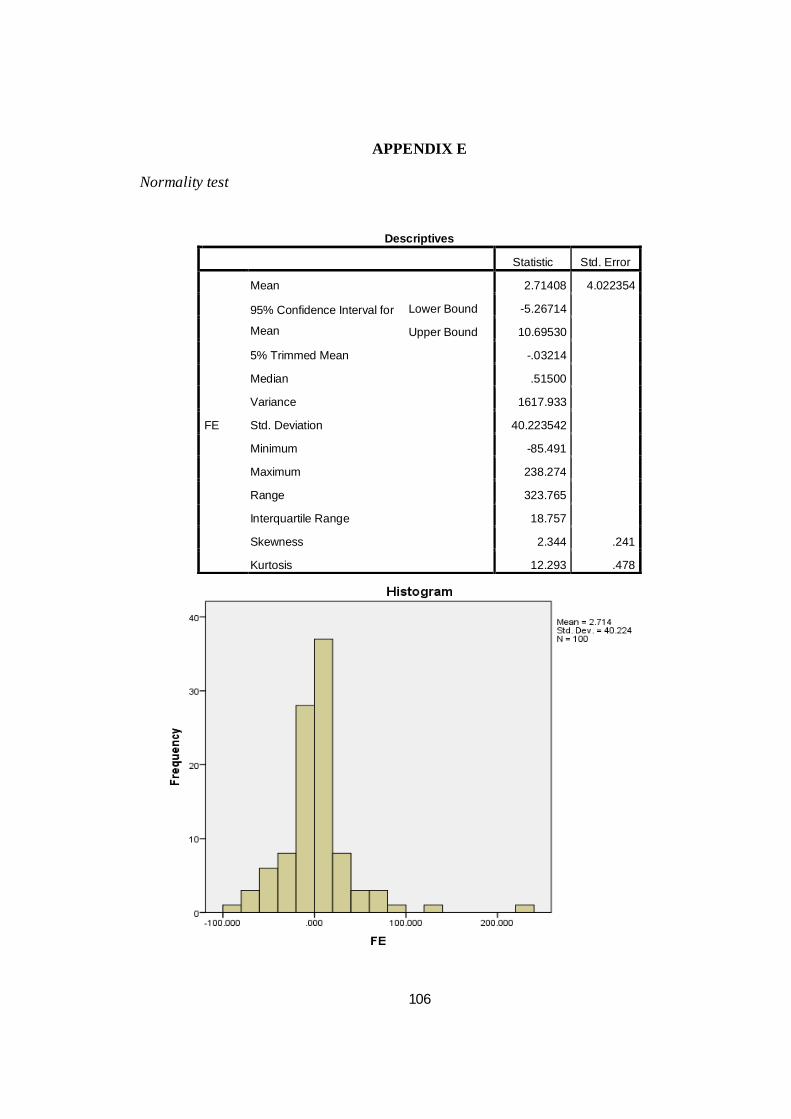
APPENDIX E
Normality test
Descriptives
Statistic Std. Error
FE
Mean 2.71408 4.022354
95% Confidence Interval for
Mean
Lower Bound -5.26714
Upper Bound 10.69530
5% Trimmed Mean -.03214
Median .51500
Variance 1617.933
Std. Deviation 40.223542
Minimum -85.491
Maximum 238.274
Range 323.765
Interquartile Range 18.757
Skewness 2.344 .241
Kurtosis 12.293 .478
107
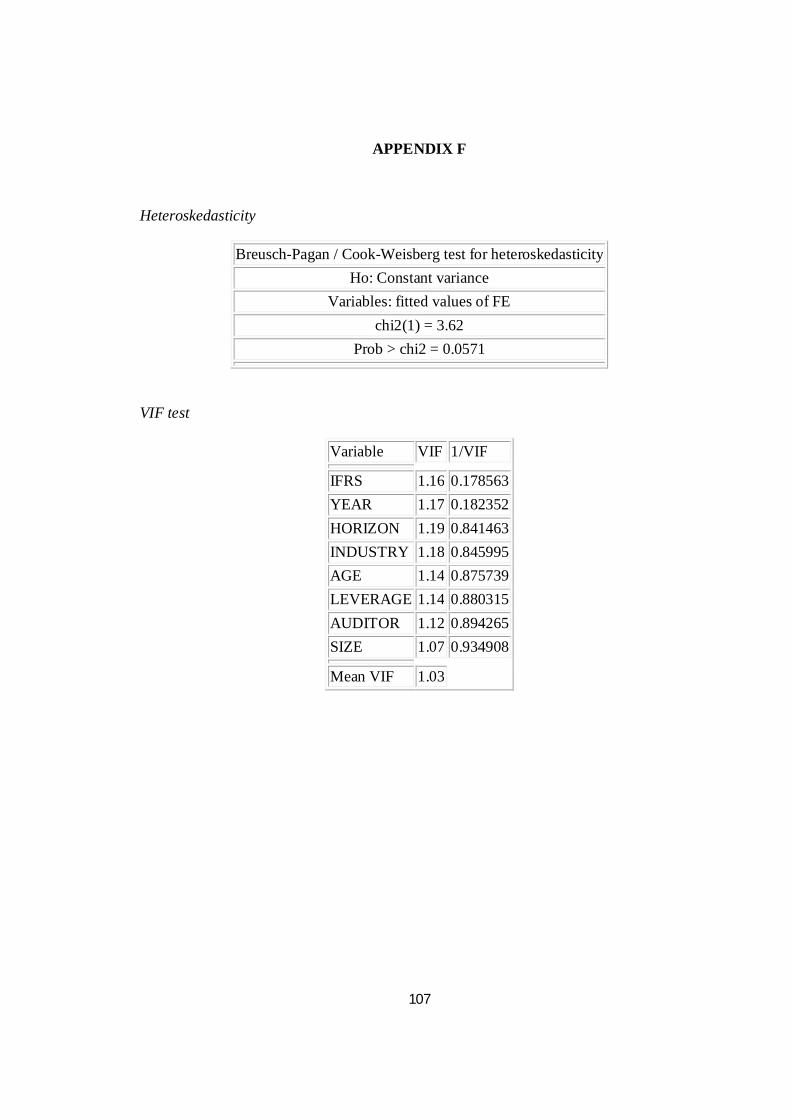
APPENDIX F
Heteroskedasticity
Breusch-Pagan / Cook-Weisberg test for heteroskedasticity Ho: Constant variance
Variables: fitted values of FE chi2(1) = 3.62
Prob > chi2 = 0.0571
VIF test
Variable VIF 1/VIF
IFRS 1.16 0.178563 YEAR 1.17 0.182352 HORIZON 1.19 0.841463 INDUSTRY 1.18 0.845995 AGE 1.14 0.875739 LEVERAGE 1.14 0.880315 AUDITOR 1.12 0.894265 SIZE 1.07 0.934908
Mean VIF 1.03
108
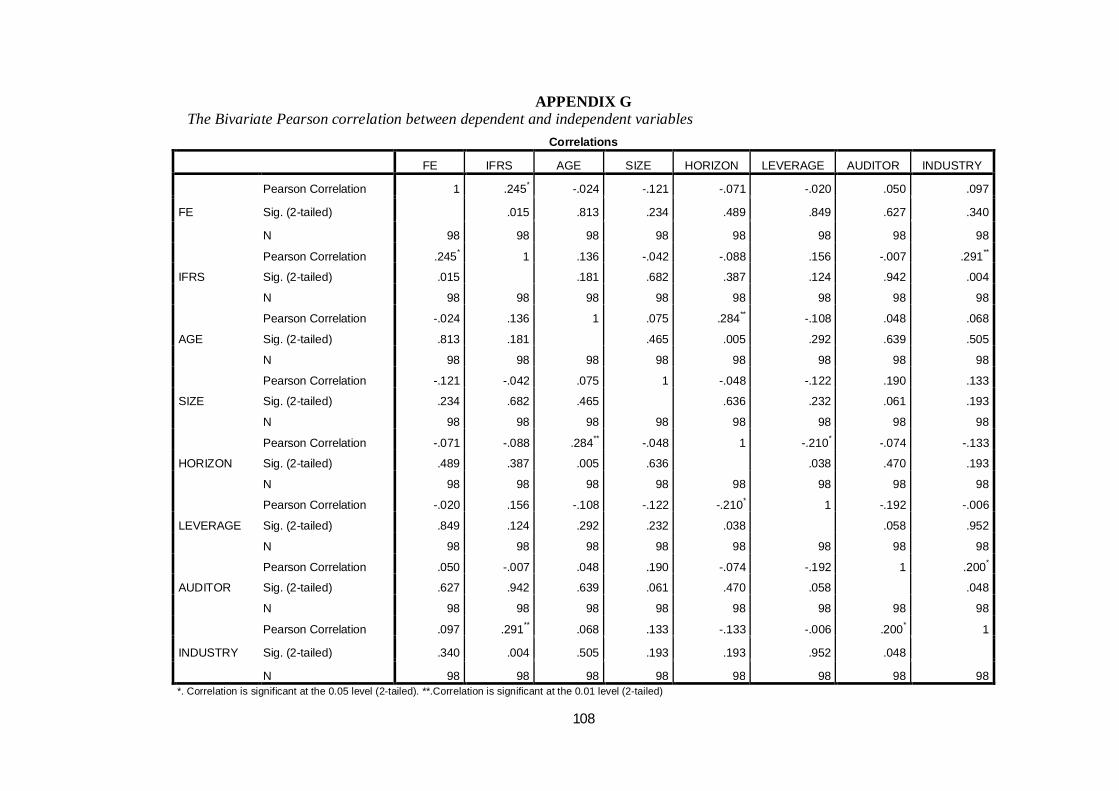
APPENDIX G The Bivariate Pearson correlation between dependent and independent variables
Correlations
FE IFRS AGE SIZE HORIZON LEVERAGE AUDITOR INDUSTRY
FE
Pearson Correlation 1 .245* -.024 -.121 -.071 -.020 .050 .097
Sig. (2-tailed) .015 .813 .234 .489 .849 .627 .340
N 98 98 98 98 98 98 98 98
IFRS
Pearson Correlation .245* 1 .136 -.042 -.088 .156 -.007 .291**
Sig. (2-tailed) .015 .181 .682 .387 .124 .942 .004
N 98 98 98 98 98 98 98 98
AGE
Pearson Correlation -.024 .136 1 .075 .284** -.108 .048 .068
Sig. (2-tailed) .813 .181 .465 .005 .292 .639 .505
N 98 98 98 98 98 98 98 98
SIZE
Pearson Correlation -.121 -.042 .075 1 -.048 -.122 .190 .133
Sig. (2-tailed) .234 .682 .465 .636 .232 .061 .193
N 98 98 98 98 98 98 98 98
HORIZON
Pearson Correlation -.071 -.088 .284** -.048 1 -.210* -.074 -.133
Sig. (2-tailed) .489 .387 .005 .636 .038 .470 .193
N 98 98 98 98 98 98 98 98
LEVERAGE
Pearson Correlation -.020 .156 -.108 -.122 -.210* 1 -.192 -.006
Sig. (2-tailed) .849 .124 .292 .232 .038 .058 .952
N 98 98 98 98 98 98 98 98
AUDITOR
Pearson Correlation .050 -.007 .048 .190 -.074 -.192 1 .200*
Sig. (2-tailed) .627 .942 .639 .061 .470 .058 .048
N 98 98 98 98 98 98 98 98
INDUSTRY
Pearson Correlation .097 .291** .068 .133 -.133 -.006 .200* 1
Sig. (2-tailed) .340 .004 .505 .193 .193 .952 .048
N 98 98 98 98 98 98 98 98 *. Correlation is significant at the 0.05 level (2-tailed). **.Correlation is significant at the 0.01 level (2-tailed)

109
APPENDIX H Ordinary Least Square regression analysis for overall samples during period 2004-2007(PanelA) Panel A (1) - Regression controlling for heteroskedasticity
Robust FE Coef. Std. Err. t P>t [95% Conf. Interval]
IFRS 10.87971 14.45221 0.75 0.454 -17.83653 39.59595 AGE -.2722865 .4094349 -0.67 0.508 -1.085825 .5412519 HORIZON -.5380634 .9881346 -0.54 0.587 -2.501466 1.425339 SIZE -5.02e-06 2.01e-06 -2.49 0.015 -9.02e-06 -1.02e-06 AUDITOR 3.219171 6.125887 0.53 0.601 -8.952836 15.39118 LEVERAGE -.0938925 .1015118 -0.92 0.357 -.2955942 .1078092 INDUSTRY 1.537956 5.761333 0.27 0.790 -9.90969 12.9856 YEAR 2.069747 6.278306 0.33 0.742 -10.40511 14.54461 _cons -4145.801 12583.14 -0.33 0.743 -29148.24 20856.63 R-squared = 0.0893 F-Static = 2.21
Panel A (2) - Regression controlling for heteroskedasticity without Year and Industry
Robust FE Coef. Std. Err. t P>t [95% Conf. Interval]
IFRS 15.87954 5.734449 2.77 0.007 4.488762 27.27032 AGE -.2726505 .4195818 -0.65 0.517 -1.106098 .5607972 HORIZON -.5383066 .9392115 -0.57 0.568 -2.403935 1.327322 SIZE -4.92e-06 2.02e-06 -2.44 0.017 -8.93e-06 -9.07e-07 AUDITOR 3.51086 5.958189 0.59 0.557 -8.32435 15.34607 LEVERAGE -.0972637 .0981634 -0.99 0.324 -.2922533 .0977259 _cons 3.215309 8.83267 0.36 0.717 -14.3297 20.76032 R-squared = 0.0875 F-Static= = 2.96

110
APPENDIX G
Ordinary Least Square regression analysis for pre-IFRS convergence during period
2004-2005(Panel B)
Panel B(1) - Regression for pre-IFRS
Robust FE Coef. Std. Err. t P>t [95% Conf. Interval]
IFRS (omitted) AGE -.5361422 .5207235 -1.03 0.308 -1.578873 .5065886 HORIZON -.9352006 1.336276 -0.70 0.487 -3.611048 1.740647 SIZE -5.05e-06 2.04e-06 -2.47 0.016 -9.14e-06 -9.57e-07 AUDITOR 7.102965 8.549632 0.83 0.410 -10.01738 24.22331 LEVERAGE -.1053226 .1621379 -0.65 0.519 -.4299981 .219353 INDUSTRY -1.212431 7.79777 -0.16 0.877 -16.8272 14.40234 YEAR 1.502613 9.025112 0.17 0.868 -16.56986 19.57509 _cons -3005.925 18086.5 -0.17 0.869 -39223.51 33211.66 R-squared = 0.0472 F -Static = 1.56
Panel B(2) - Regression for pre-IFRS without year and industry
Robust FE Coef. Std. Err. t P>t [95% Conf. Interval]
IFRS (omitted) AGE -.5714527 .5145517 -1.11 0.271 -1.601068 .4581629 HORIZON -.8900926 1.244588 -0.72 0.477 -3.380508 1.600323 SIZE -5.09e-06 1.94e-06 -2.62 0.011 -8.98e-06 -1.21e-06 AUDITOR 7.058407 8.596574 0.82 0.415 -10.1433 24.26011 LEVERAGE -.1015892 .1623852 -0.63 0.534 -.4265213 .2233429 _cons 5.165769 13.06756 0.40 0.694 -20.98235 31.31389 R-squared = 0.0464 F-Static = 2.04
111
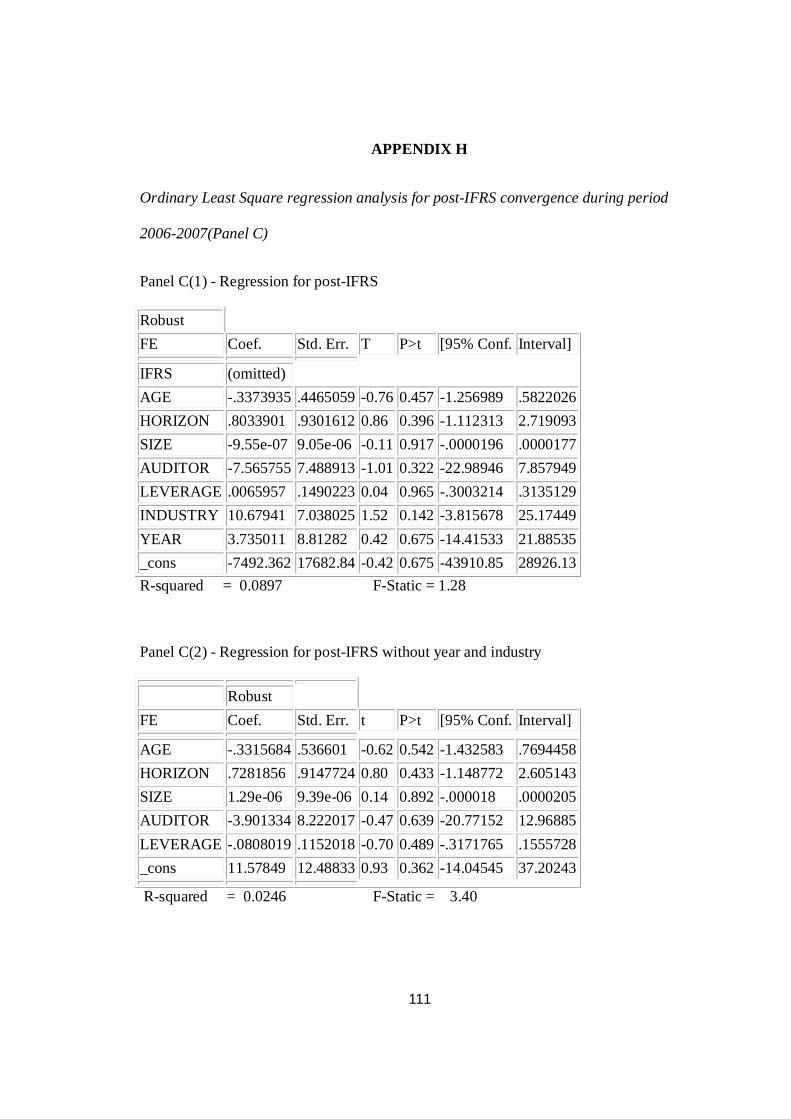
APPENDIX H
Ordinary Least Square regression analysis for post-IFRS convergence during period
2006-2007(Panel C)
Panel C(1) - Regression for post-IFRS
Robust FE Coef. Std. Err. T P>t [95% Conf. Interval]
IFRS (omitted) AGE -.3373935 .4465059 -0.76 0.457 -1.256989 .5822026 HORIZON .8033901 .9301612 0.86 0.396 -1.112313 2.719093 SIZE -9.55e-07 9.05e-06 -0.11 0.917 -.0000196 .0000177 AUDITOR -7.565755 7.488913 -1.01 0.322 -22.98946 7.857949 LEVERAGE .0065957 .1490223 0.04 0.965 -.3003214 .3135129 INDUSTRY 10.67941 7.038025 1.52 0.142 -3.815678 25.17449 YEAR 3.735011 8.81282 0.42 0.675 -14.41533 21.88535 _cons -7492.362 17682.84 -0.42 0.675 -43910.85 28926.13 R-squared = 0.0897 F-Static = 1.28
Panel C(2) - Regression for post-IFRS without year and industry
Robust FE Coef. Std. Err. t P>t [95% Conf. Interval]
AGE -.3315684 .536601 -0.62 0.542 -1.432583 .7694458 HORIZON .7281856 .9147724 0.80 0.433 -1.148772 2.605143 SIZE 1.29e-06 9.39e-06 0.14 0.892 -.000018 .0000205 AUDITOR -3.901334 8.222017 -0.47 0.639 -20.77152 12.96885 LEVERAGE -.0808019 .1152018 -0.70 0.489 -.3171765 .1555728 _cons 11.57849 12.48833 0.93 0.362 -14.04545 37.20243
R-squared = 0.0246 F-Static = 3.40