Embed Size (px)
Citation preview
Chapter 4
Structured Analysis and Functional
Architecture Design
Dr. Eng. Shady Aly
1
Modeling IIS
• This is the first step in the design of IIS for an industrial enterprise.
• The design proceeds from a definition of a business modelof the enterprise. This business model (IS model ) is a description of
– the functions of the business,
– the data requirements, and
– the interactions between the functions and data requirements.
• Functional or activity architecture describes a conceptual model of the activities that operate the business and the relationships between those activities.
2
Modeling IIS
• The word architecture denotes the fact that
the model has a layered structure مكون من
طبقات
• A related conceptual model of the firm is the
informational or data architecture. This is a
model of the information requirements needed
to perform the functions of the business.
3
Modeling IIS
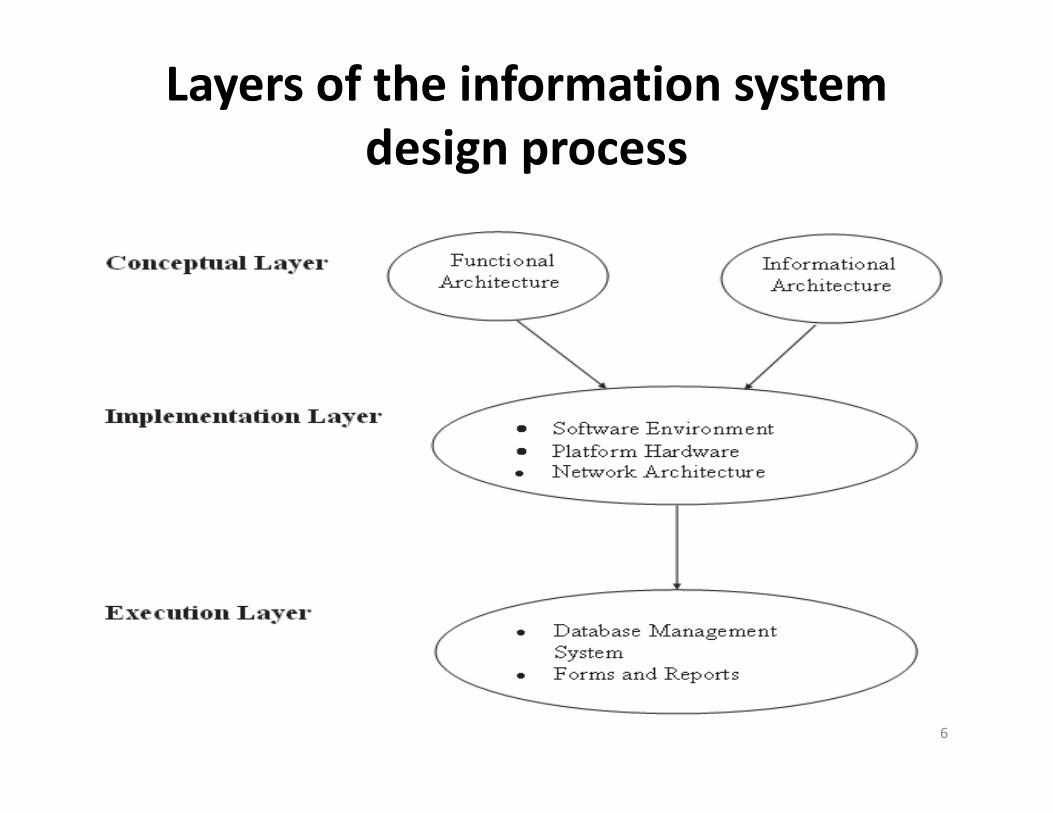
• There are three layers of system design to consider in an information system project: conceptual, implementation and execution
• The conceptual layer consists of the logical design of function and data requirements
• When a conceptual design is complete, the next step is to implement the blueprint in hardware and software. This is the implementation layer that requires the selection of a database management system, hardware platforms, and a communication medium.
4
Modeling IIS
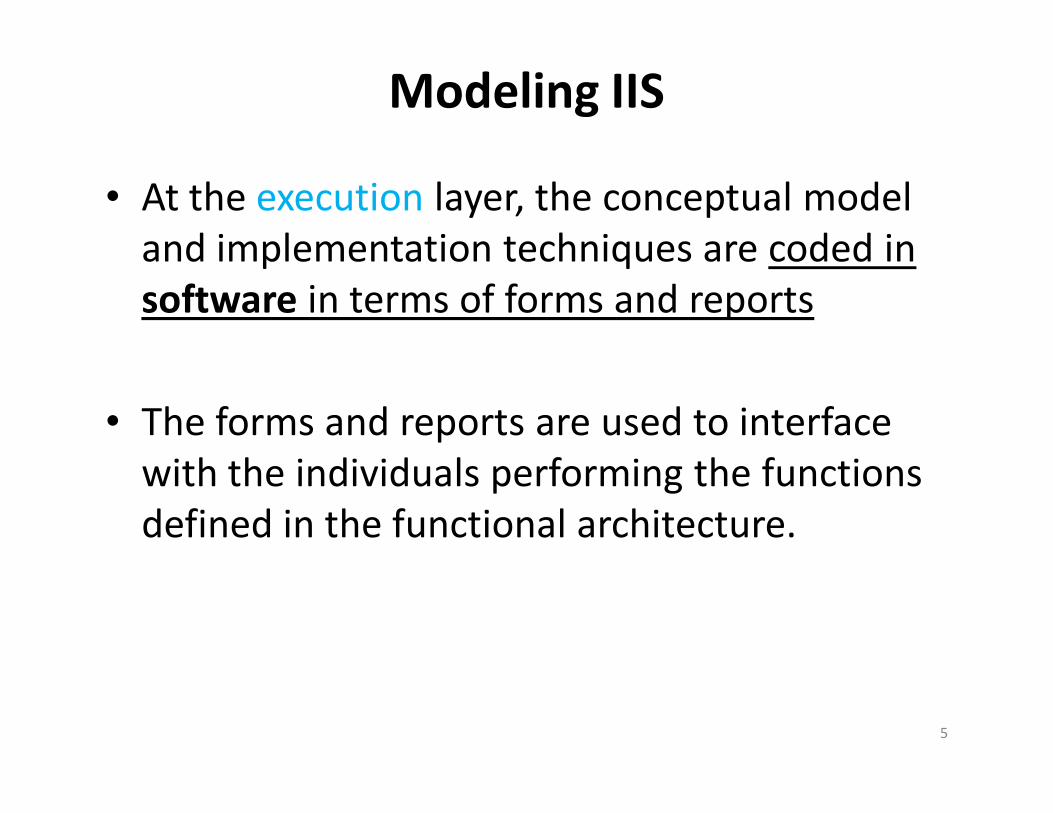
• At the execution layer, the conceptual model
and implementation techniques are coded in
software in terms of forms and reports
• The forms and reports are used to interface
with the individuals performing the functions
defined in the functional architecture.
5
Layers of the information system
design process
6
Functional modeling
Integrated computer-aided
manufacturing definition 0 (IDEF0)
7
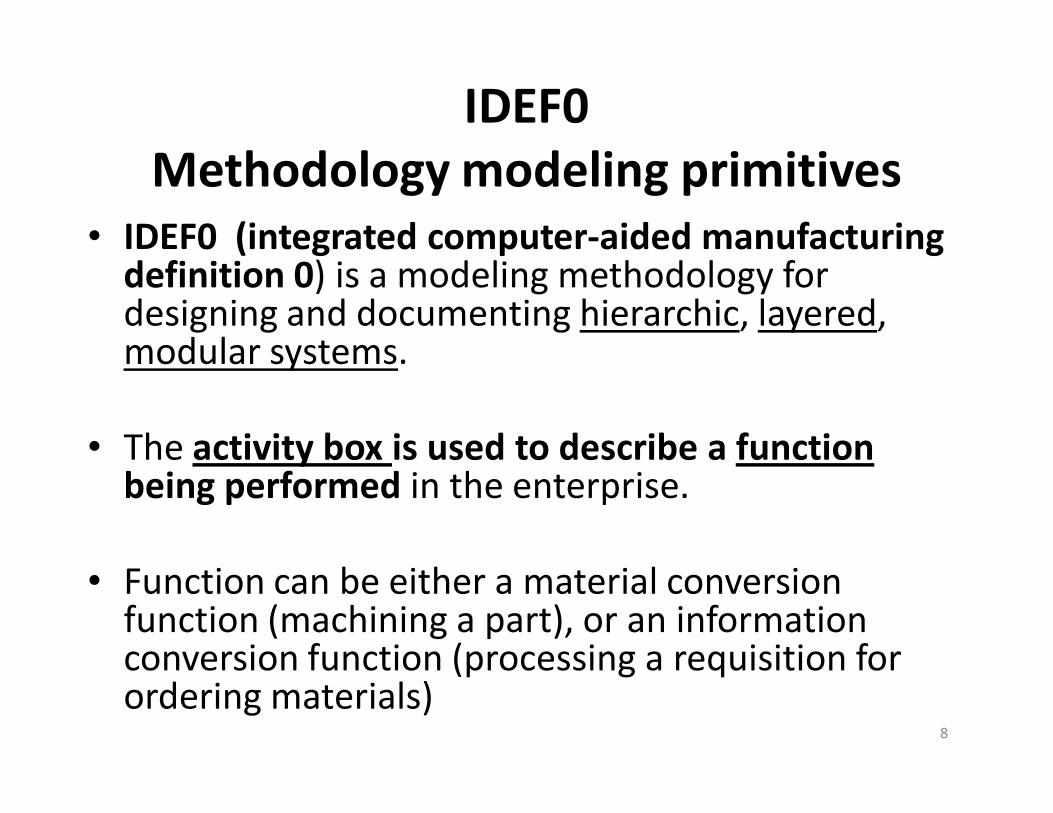
IDEF0
Methodology modeling primitives
• IDEF0 (integrated computer-aided manufacturing definition 0) is a modeling methodology for designing and documenting hierarchic, layered, modular systems.
• The activity box is used to describe a functionbeing performed in the enterprise.
• Function can be either a material conversion function (machining a part), or an information conversion function (processing a requisition for ordering materials)
8
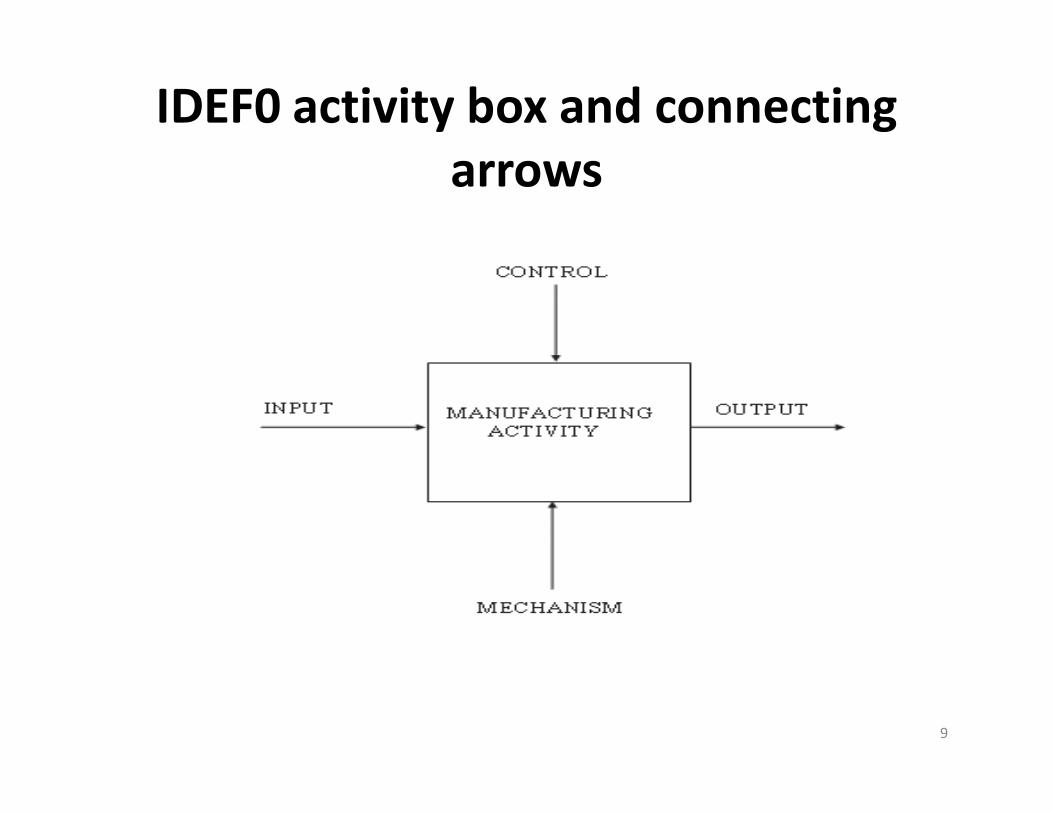
IDEF0 activity box and connecting
arrows
9
IDEF0 activity
• Inputs are those things that are transformed by
the function (a work piece to be machined, or
an requisition information to be transformed
into a purchase order
• Outputs are the result of the transformation
process provided by the activity (finished
component after machining, or a purchase
order)
10
IDEF0 activity
• Mechanisms are the means by which a function is realized
• The mechanism in the material conversion of a work-piece to a finished component might require a lathe and lathe operator as mechanisms
• The information conversion to process a requisition into a purchase order could involve a purchasing agent as the mechanism.
11
IDEF0 activity
• A control is a condition or set of conditions that
guide or constrain (ترشد أو تقيد) the performance
of the activity
• For example, the machining activity may require
a numerical control parts program. An example
of information conversion, the requisition
processing function may require adherence to a
set of company rules or purchasing policy (e.g.,
purchasing only from approved vendors).
12
IDEF0 activity
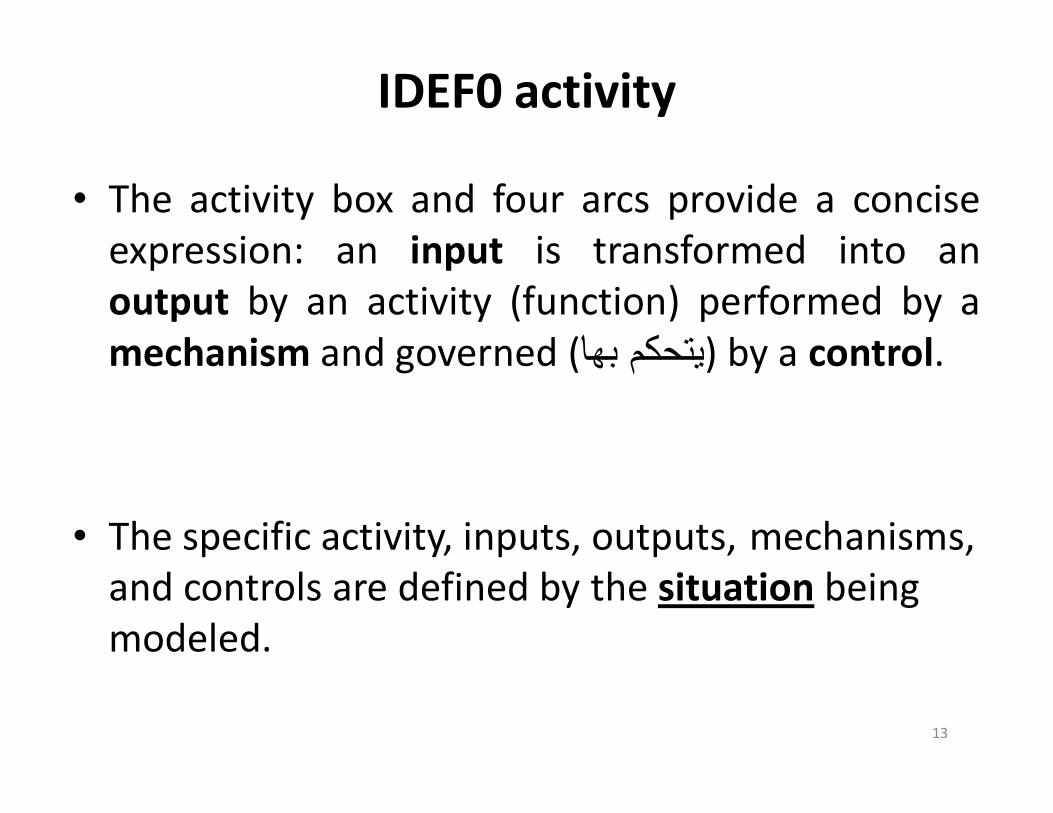
• The activity box and four arcs provide a concise
expression: an input is transformed into an
output by an activity (function) performed by a
mechanism and governed ( بھا يتحكم ) by a control.
• The specific activity, inputs, outputs, mechanisms,
and controls are defined by the situation being
modeled.
13
IDEF0 activity
• Grammatical convention used in naming
activities and arcs.
• Activities represent actions being performed
and are labeled with verb phrases أفعال.
• Inputs, outputs, mechanisms, and controls
represent things and are labeled with noun
phrases أسماء.14
IDEF0 Hierarchic decomposition
التحليل التسلسي الھرمي
• IDEF0 is a top-down modeling approach
)نمذجة متسلسلة من الوظائف الرئيسية إلى الوظائف الجزئية(
• The first layer is a single activity box that describes the overall function of the enterprise, organization, or process within the enterprise that is the subject of the model
• This overall activity is then decomposed تحلل أو تفكك إلى into its major sub-activities ا&نشطة الجزئية ا&ولية at the second layer
• Functions are related to each other by their material flows and information flows. For example, the output material or information of one activity may provide the input to another activity.
15
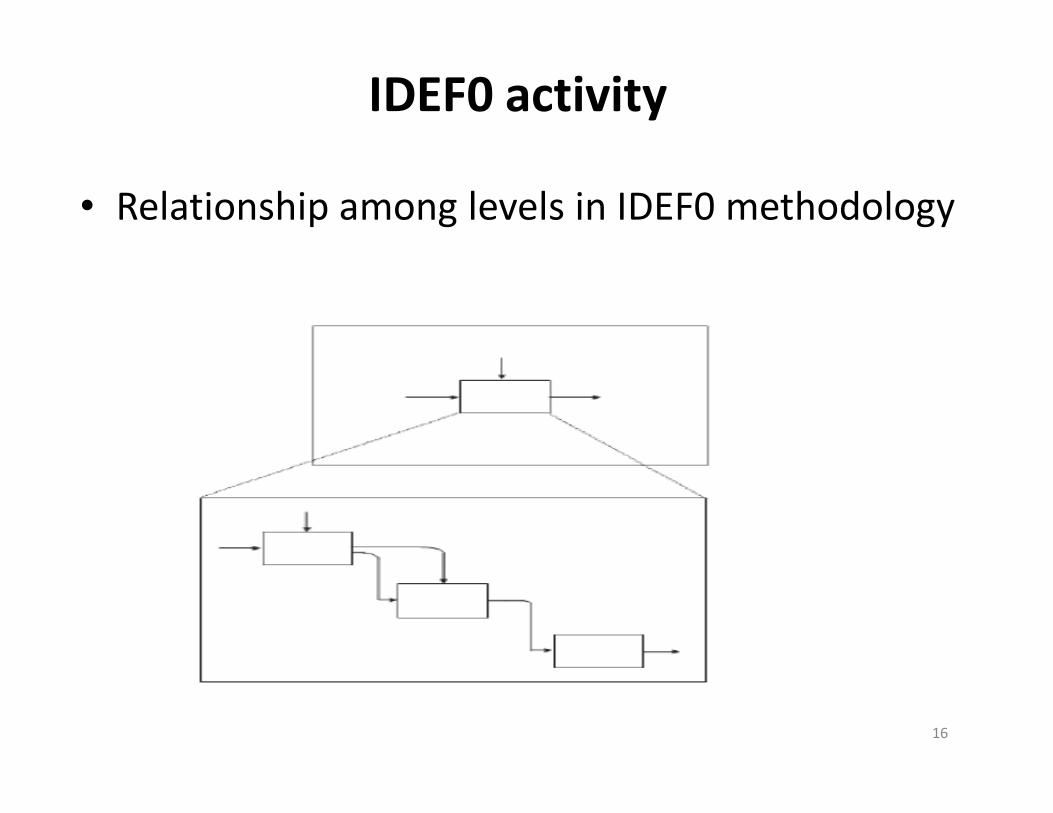
IDEF0 activity
• Relationship among levels in IDEF0 methodology
16
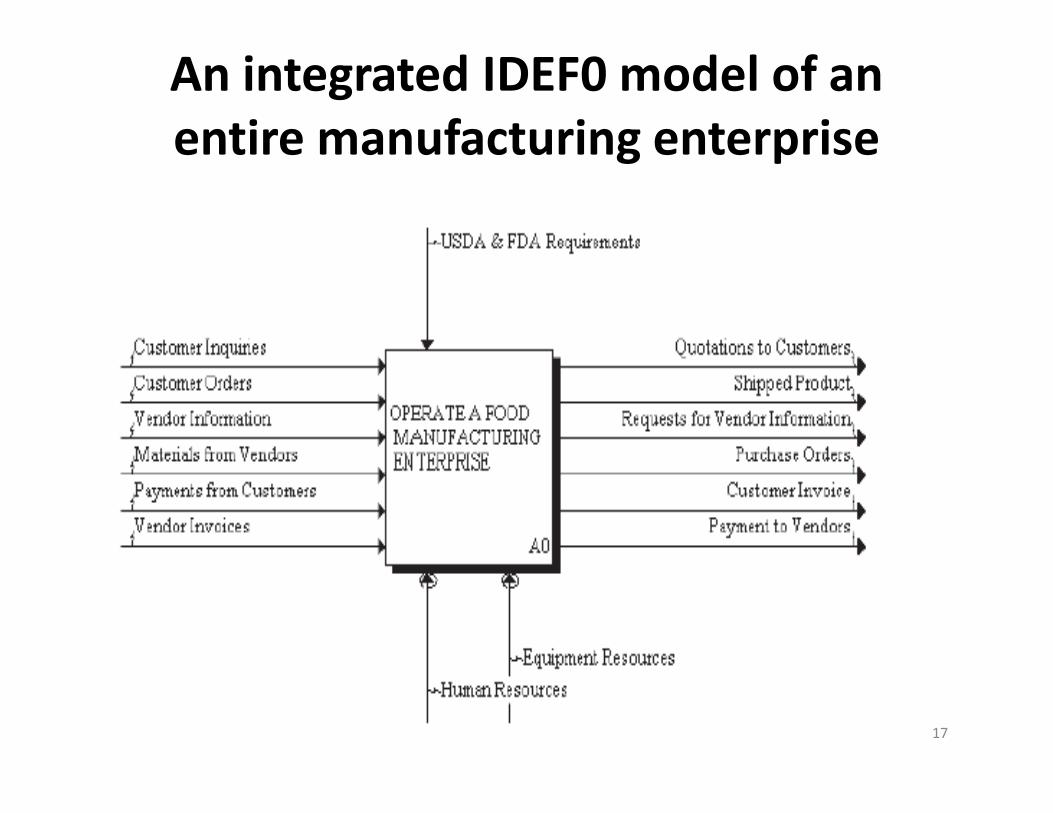
An integrated IDEF0 model of an
entire manufacturing enterprise
17
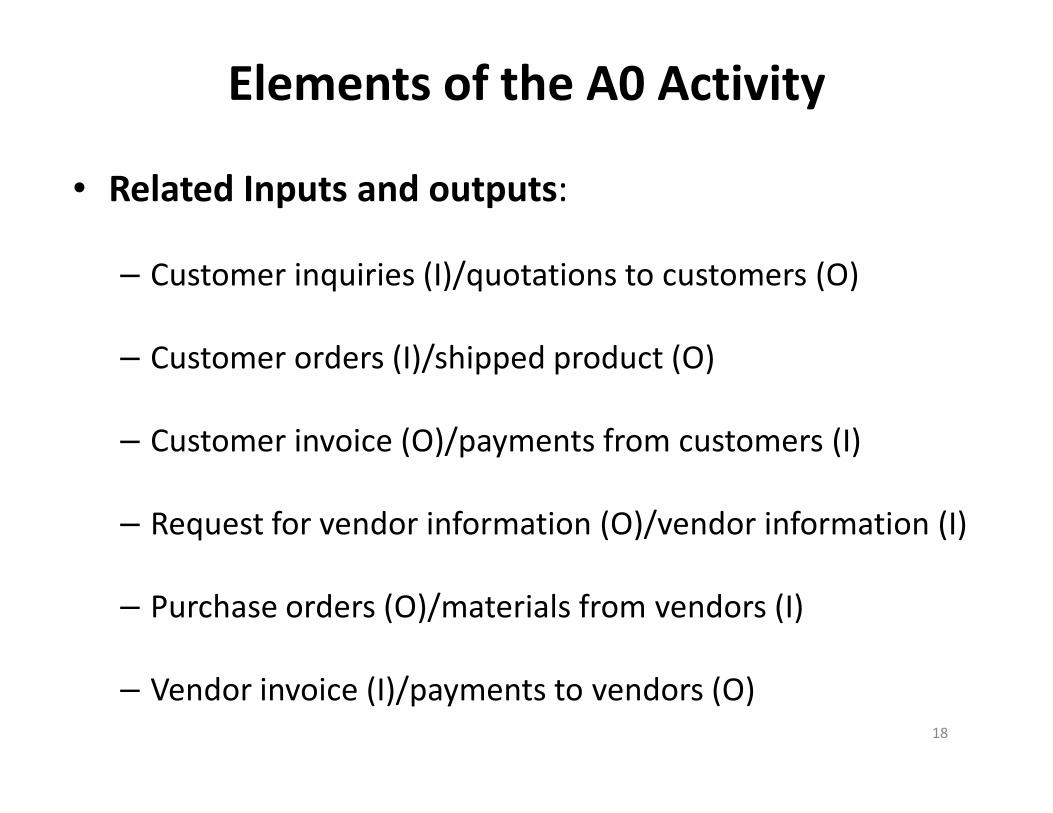
Elements of the A0 Activity
• Related Inputs and outputs:
– Customer inquiries (I)/quotations to customers (O)
– Customer orders (I)/shipped product (O)
– Customer invoice (O)/payments from customers (I)
– Request for vendor information (O)/vendor information (I)
– Purchase orders (O)/materials from vendors (I)
– Vendor invoice (I)/payments to vendors (O)18
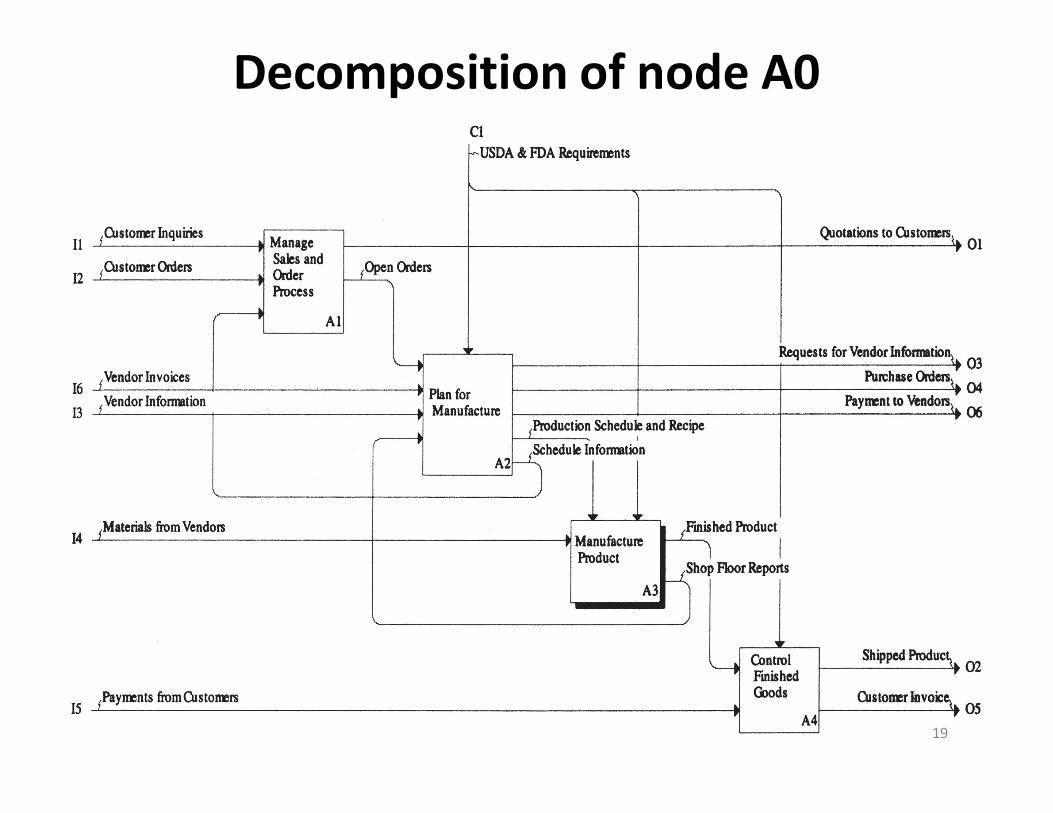
Decomposition of node A0
19
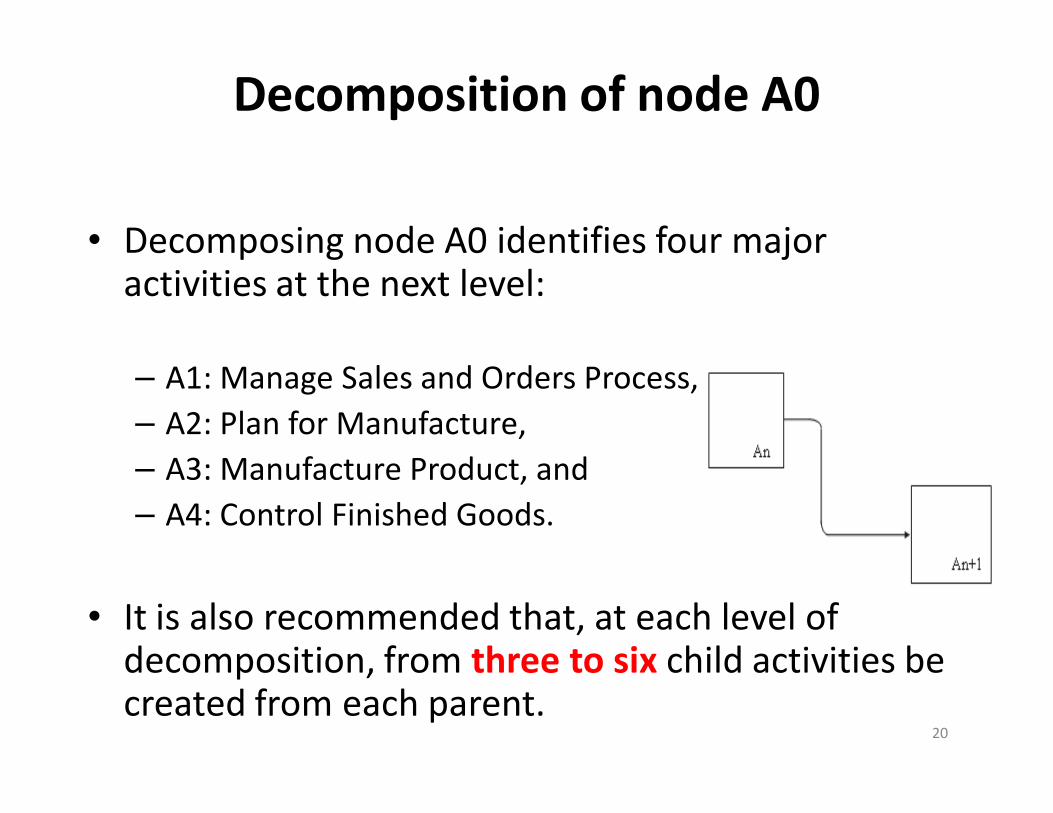
Decomposition of node A0
• Decomposing node A0 identifies four major activities at the next level:
– A1: Manage Sales and Orders Process,
– A2: Plan for Manufacture,
– A3: Manufacture Product, and
– A4: Control Finished Goods.
• It is also recommended that, at each level of decomposition, from three to six child activities be created from each parent.
20
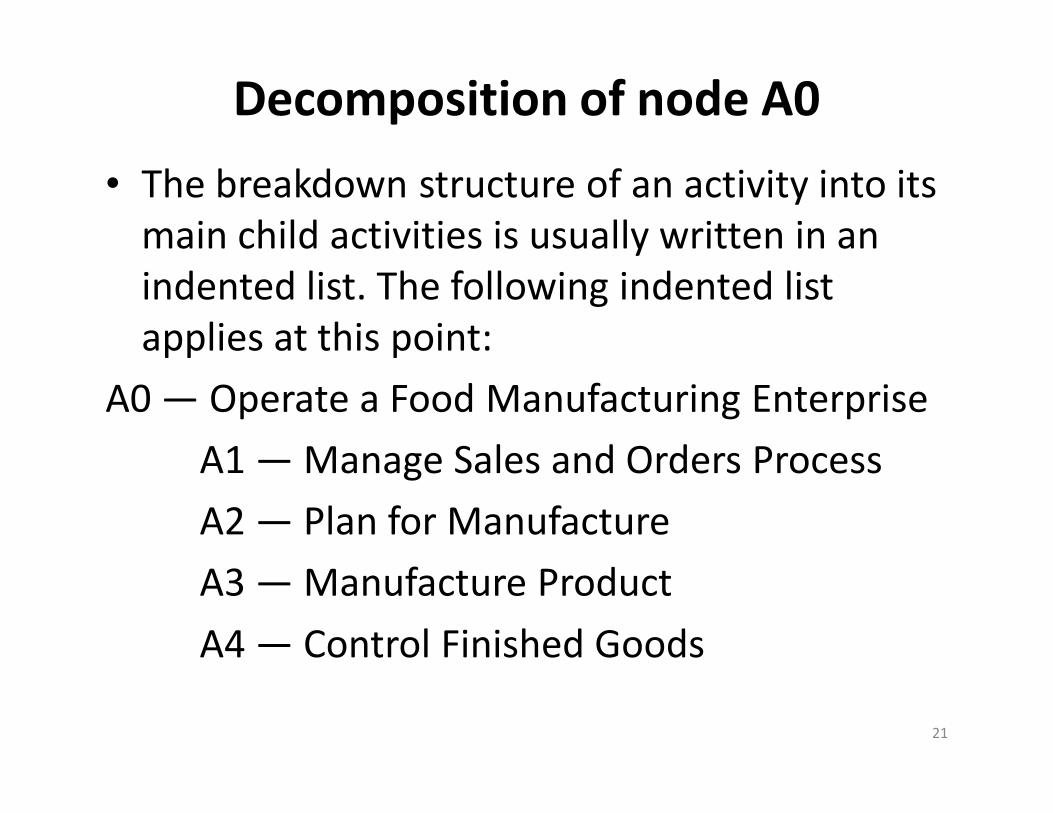
Decomposition of node A0
• The breakdown structure of an activity into its
main child activities is usually written in an
indented list. The following indented list
applies at this point:
A0 — Operate a Food Manufacturing Enterprise
A1 — Manage Sales and Orders Process
A2 — Plan for Manufacture
A3 — Manufacture Product
A4 — Control Finished Goods
21
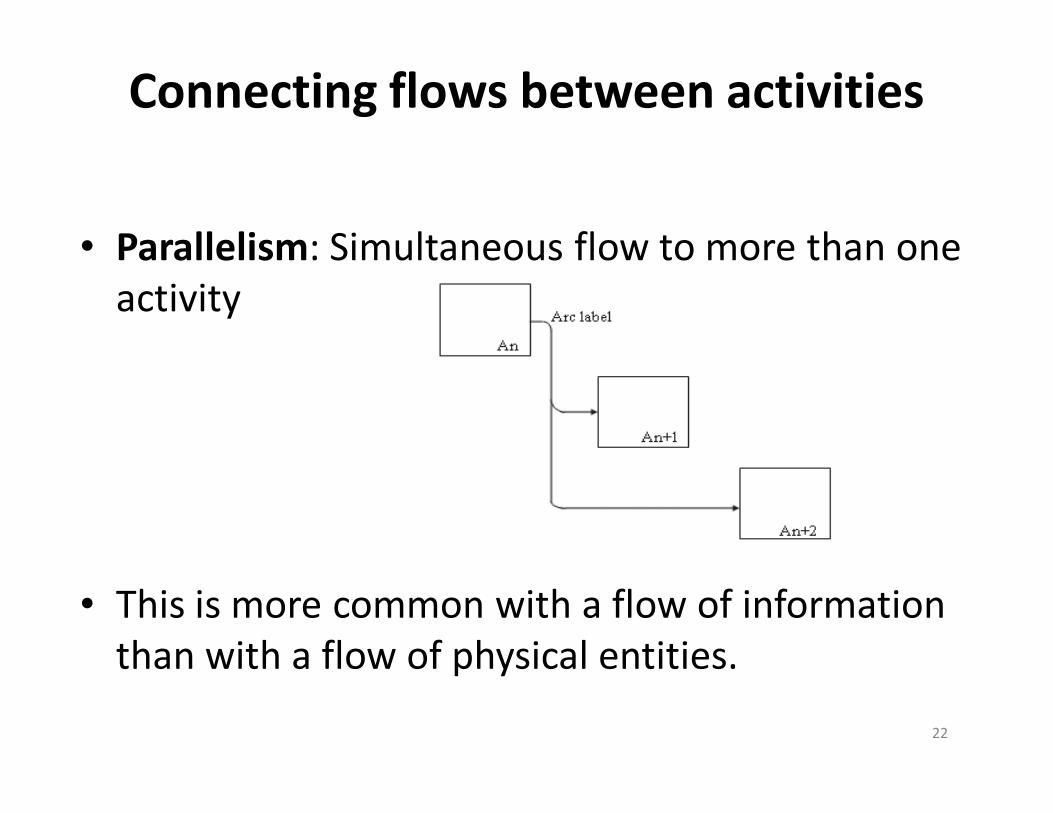
Connecting flows between activities
• Parallelism: Simultaneous flow to more than one
activity
• This is more common with a flow of information
than with a flow of physical entities.
22
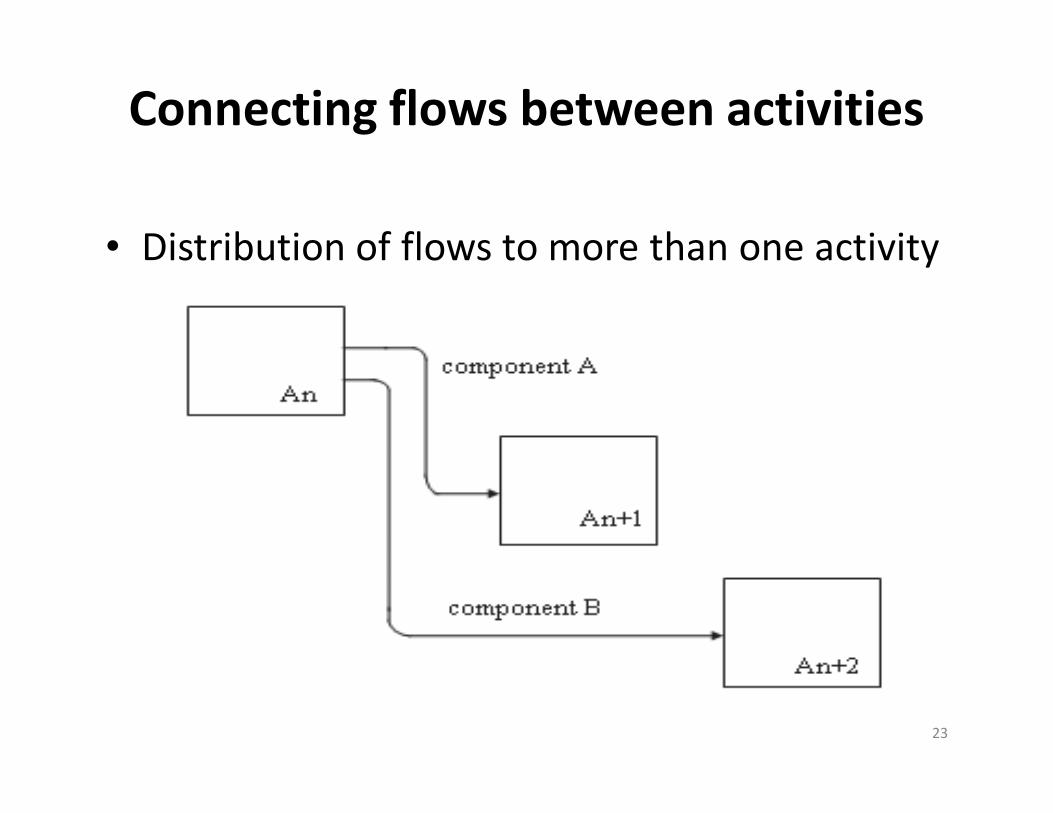
Connecting flows between activities
• Distribution of flows to more than one activity
23
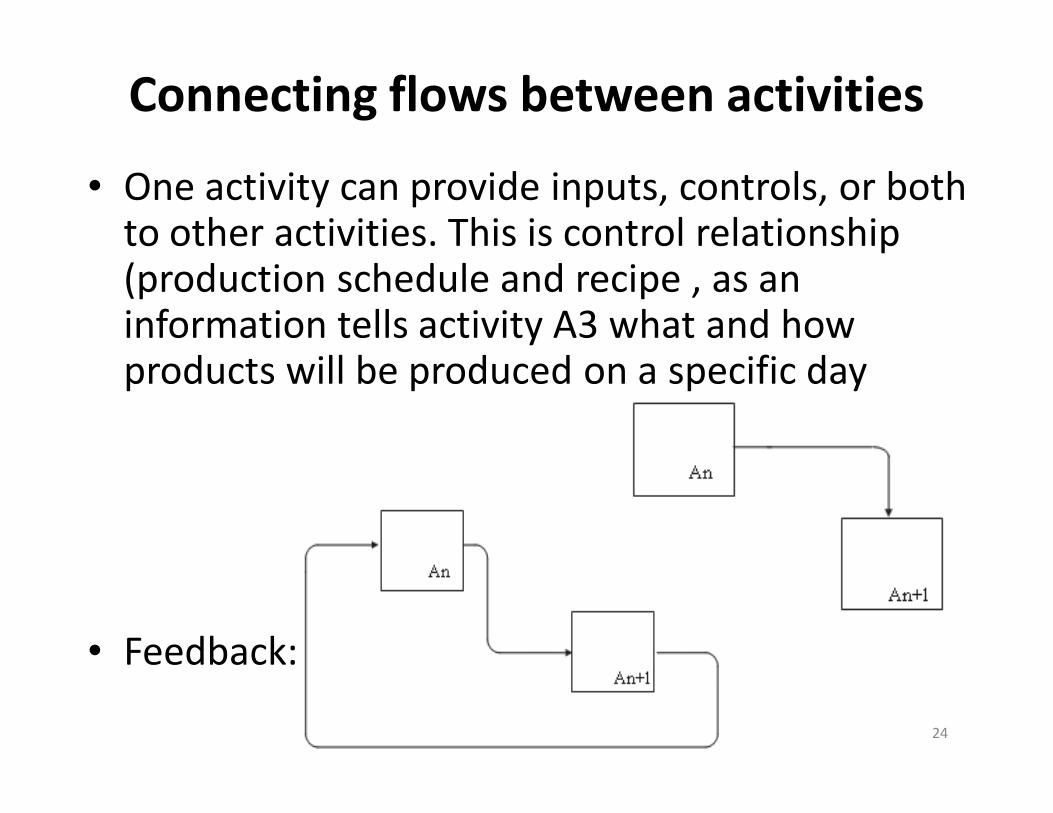
Connecting flows between activities
• One activity can provide inputs, controls, or both to other activities. This is control relationship (production schedule and recipe , as an information tells activity A3 what and how products will be produced on a specific day
• Feedback:
24
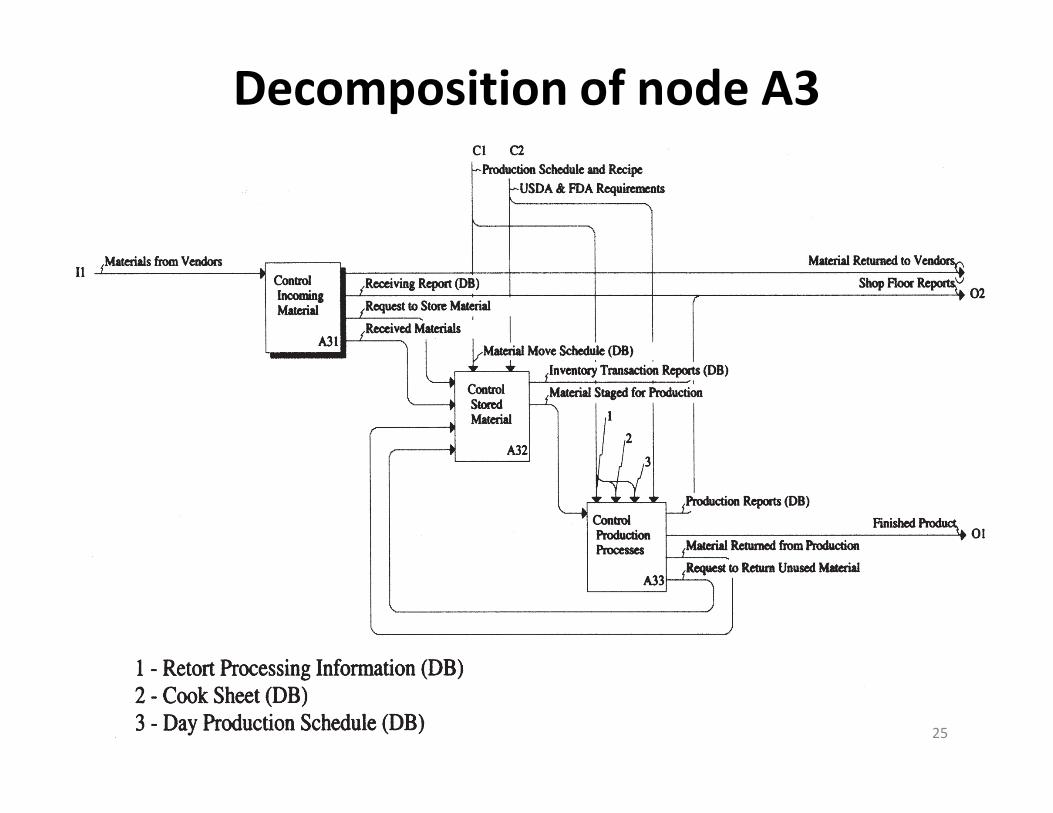
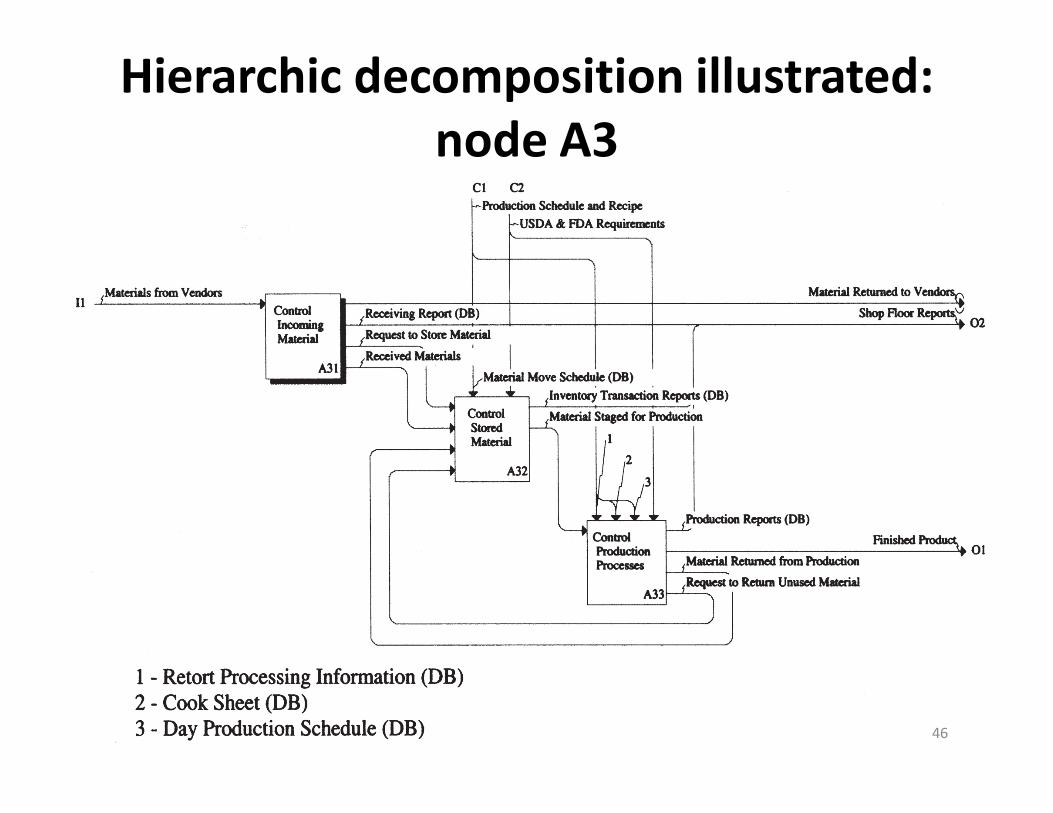
Decomposition of node A3
25
Decomposition of node A3
• The concept of tunneling is important . The output of activity A31, labeled “Material Returned to Vendors.” Note the tunnel on the arrowhead of the arc. A tunnel arrow is used as a convenience. It can represent:
(1) an external arrow that did not appear in the parent diagram (i.e., it has a hidden source) or
(2) an arrow that goes to another activity but does not appear explicitly on the destination activity (i.e., a hidden destination).
• Tunneling is used when it is not convenient to show all inputs, outputs, controls, or mechanisms at every level of the hierarchy.
26
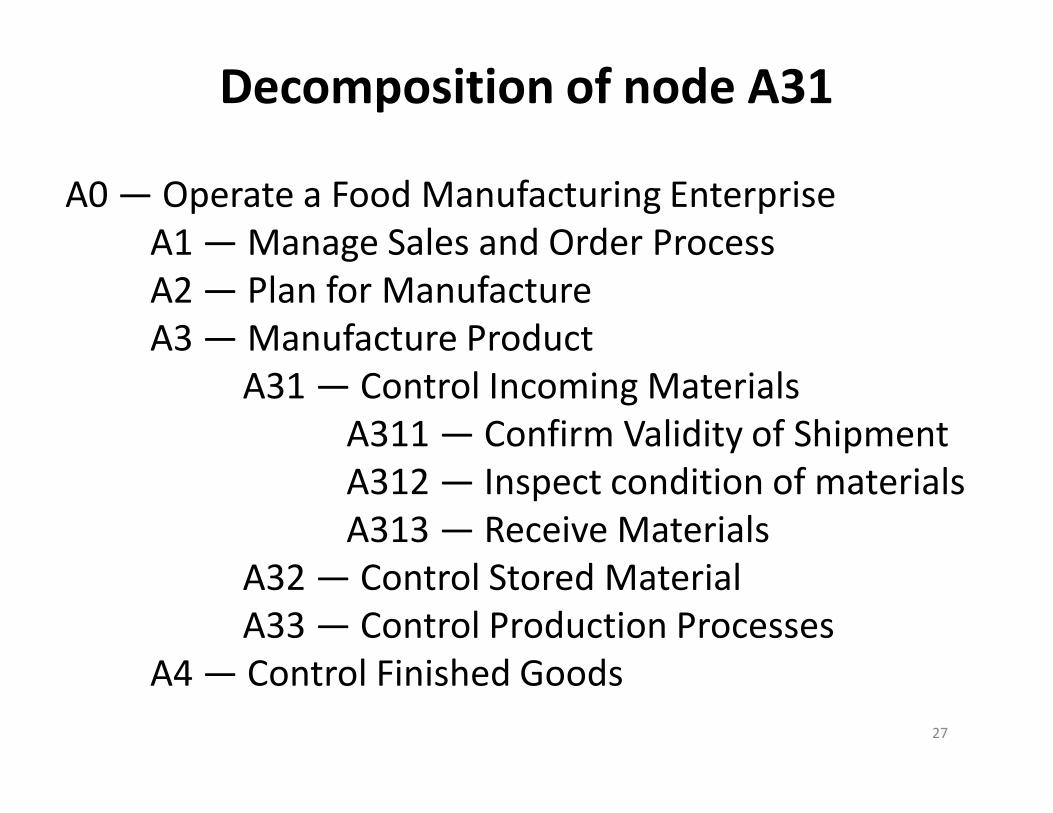
Decomposition of node A31
A0 — Operate a Food Manufacturing Enterprise
A1 — Manage Sales and Order Process
A2 — Plan for Manufacture
A3 — Manufacture Product
A31 — Control Incoming Materials
A311 — Confirm Validity of Shipment
A312 — Inspect condition of materials
A313 — Receive Materials
A32 — Control Stored Material
A33 — Control Production Processes
A4 — Control Finished Goods
27
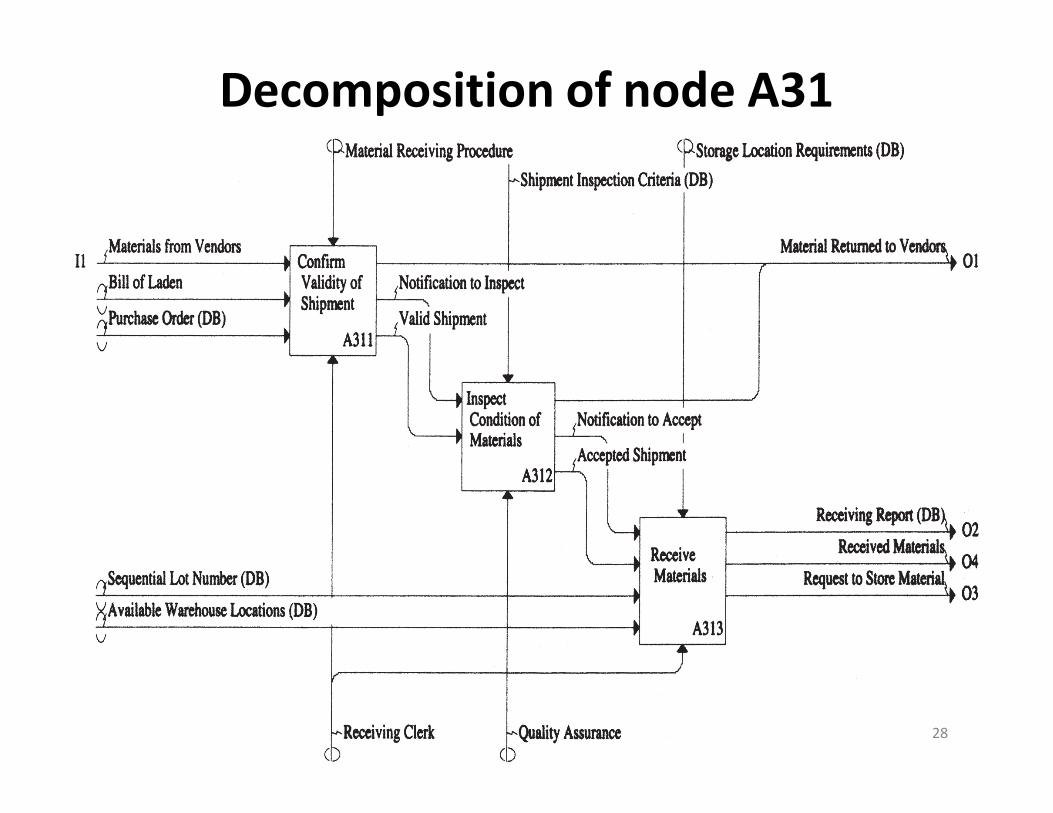
Decomposition of node A31
28
Functional/process modeling
Data Flow Diagram (DFD)
29
Process/functional Modeling
• Graphically represent the processes that
capture, manipulate, store, and distribute data
between a system and its environment and
among system components.
30
Data Flow Diagramming
• Useful for depicting purely logical information flows
• DFDs differ from system flowcharts which depict a procedure
31
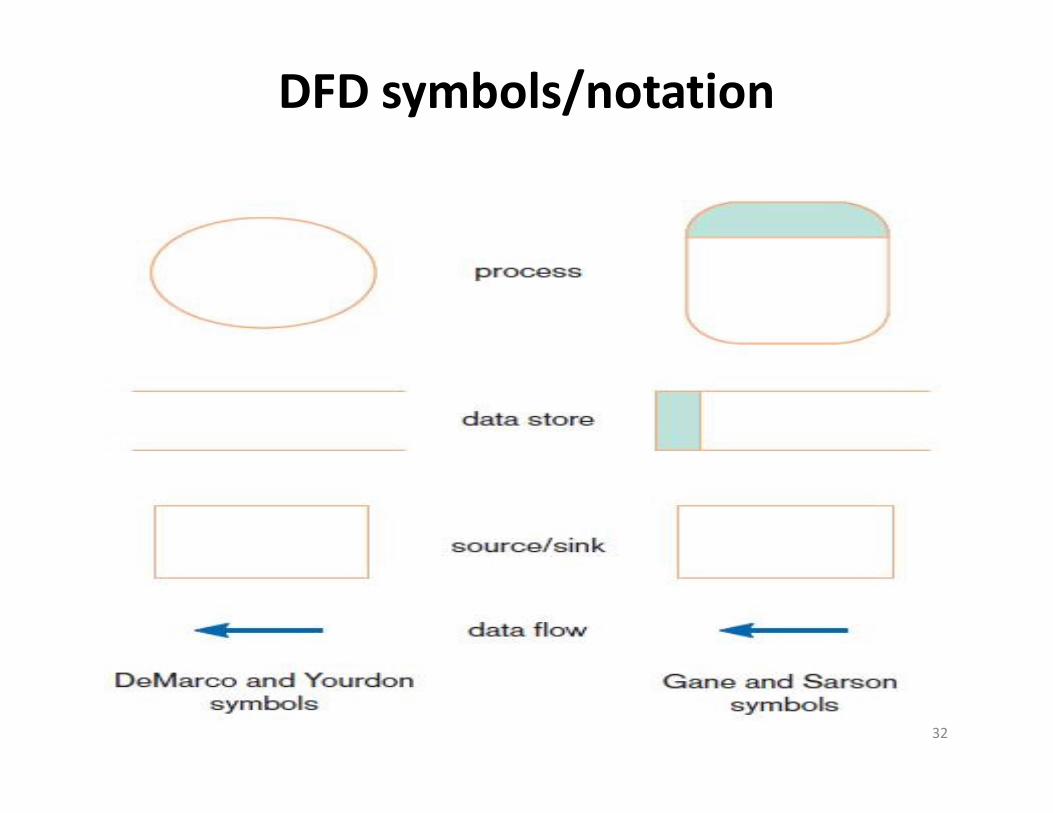
DFD symbols/notation
32
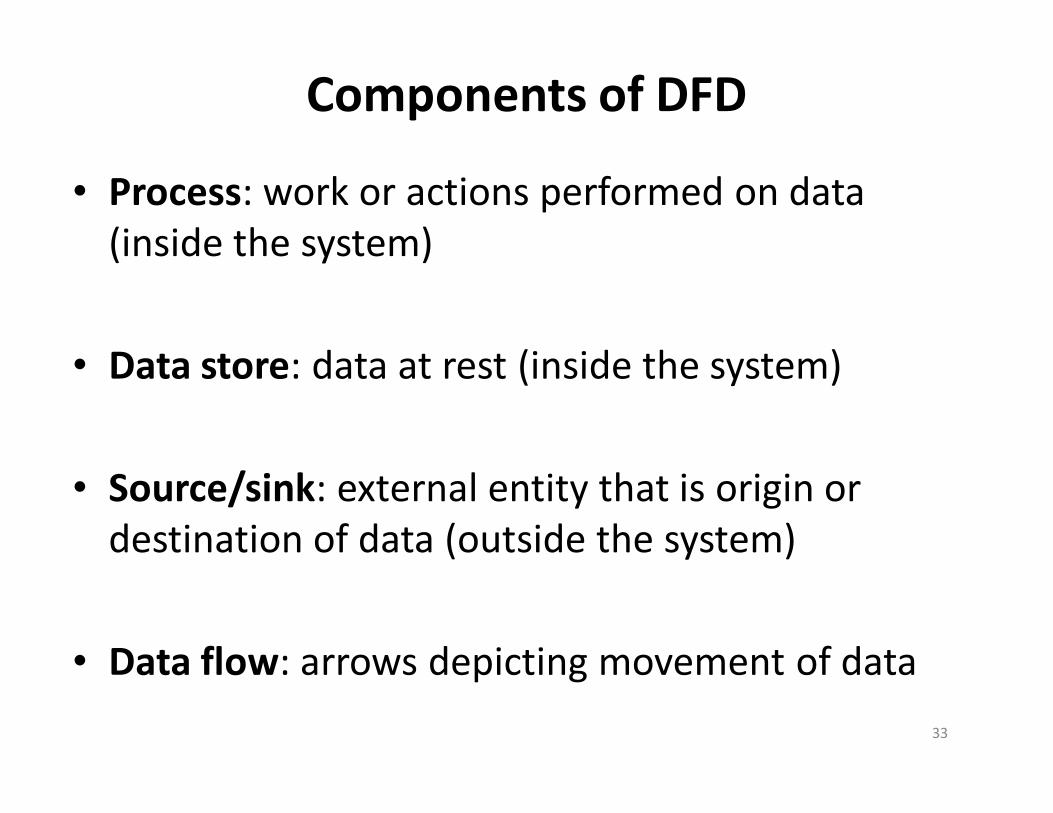
Components of DFD
• Process: work or actions performed on data
(inside the system)
• Data store: data at rest (inside the system)
• Source/sink: external entity that is origin or
destination of data (outside the system)
• Data flow: arrows depicting movement of data
33
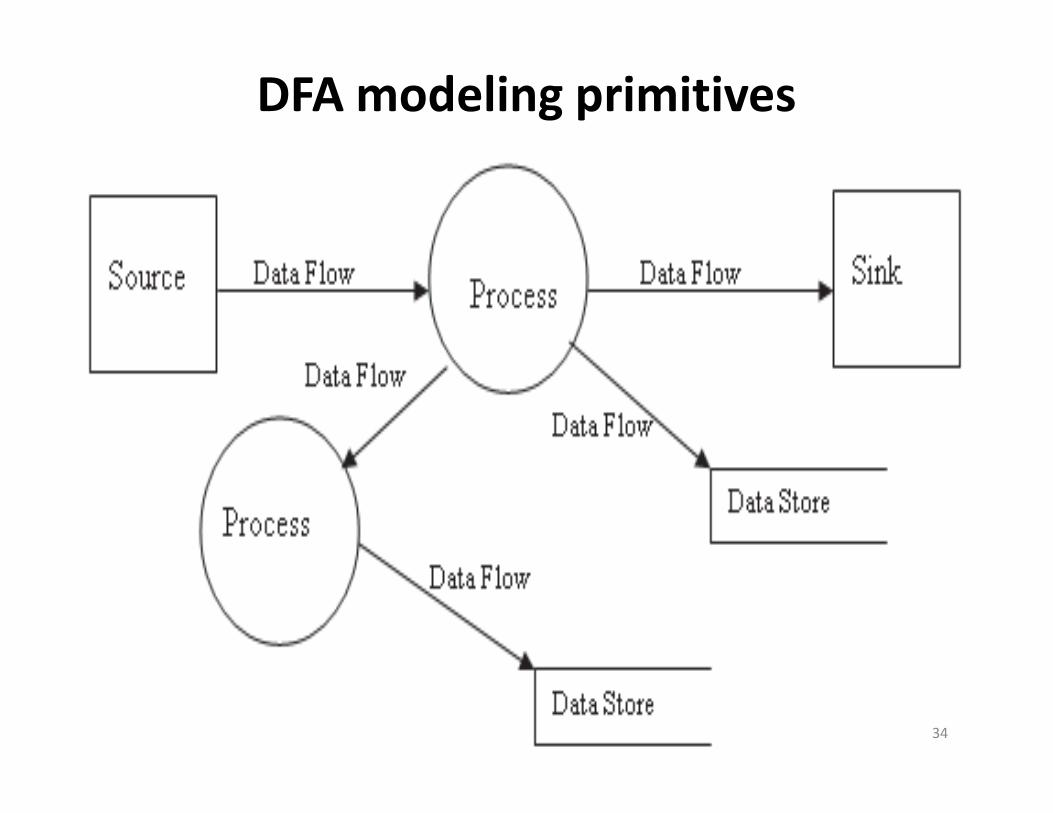
DFA modeling primitives
34
Developing DFDs
• Context diagram is an overview of an
organizational system that shows:
– the system boundaries.
– external entities that interact with the system.
– major information flows between the entities and
the system.
• Context diagram is only one process symbol,
and no data stores shown
35
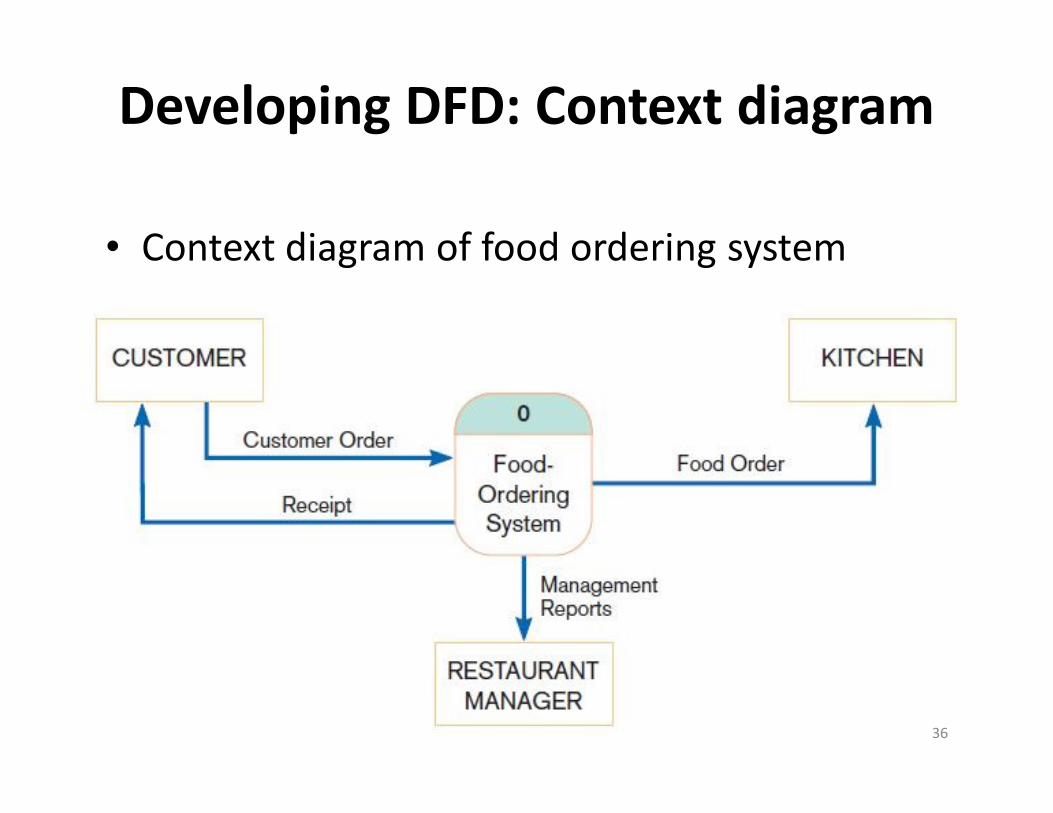
Developing DFD: Context diagram
• Context diagram of food ordering system
36
Developing DFD: Level 0
• Level-0 diagram is a data flow diagram that
represents a system’s major processes, data
flows, and data stores at a high level of detail.
– Processes are labeled 1.0, 2.0, etc. These will be
decomposed into more primitive (lower-level)
DFDs.
37
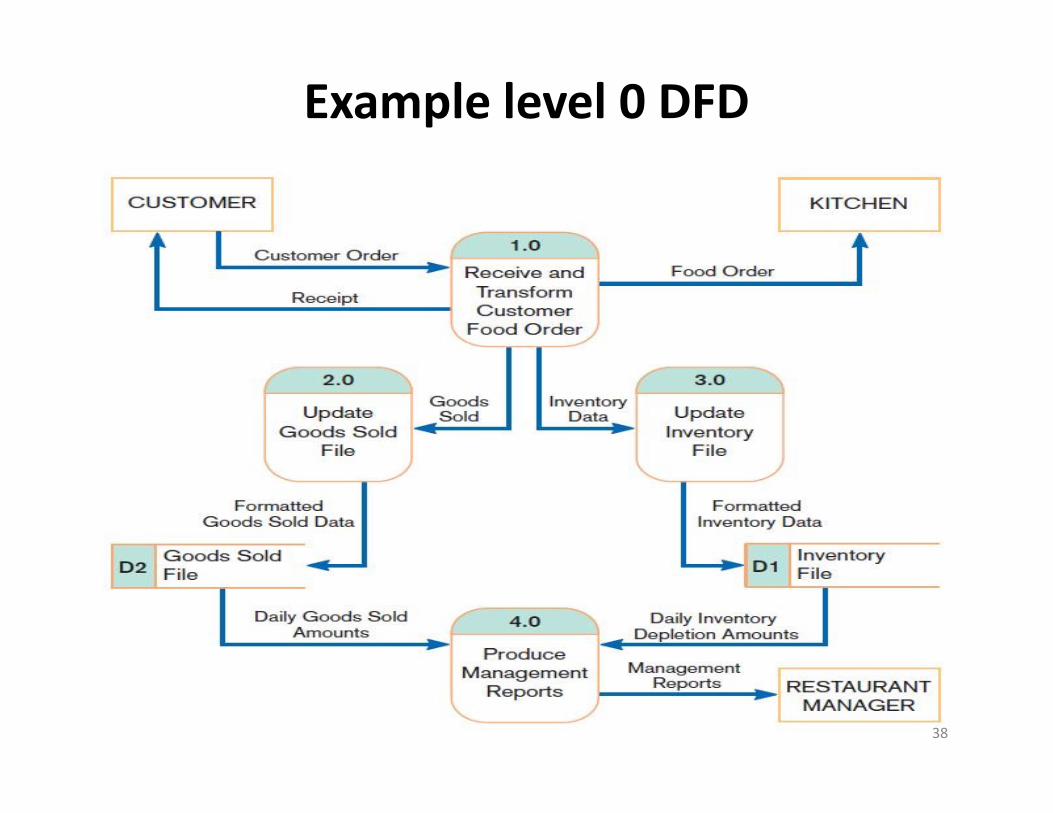
Example level 0 DFD
38
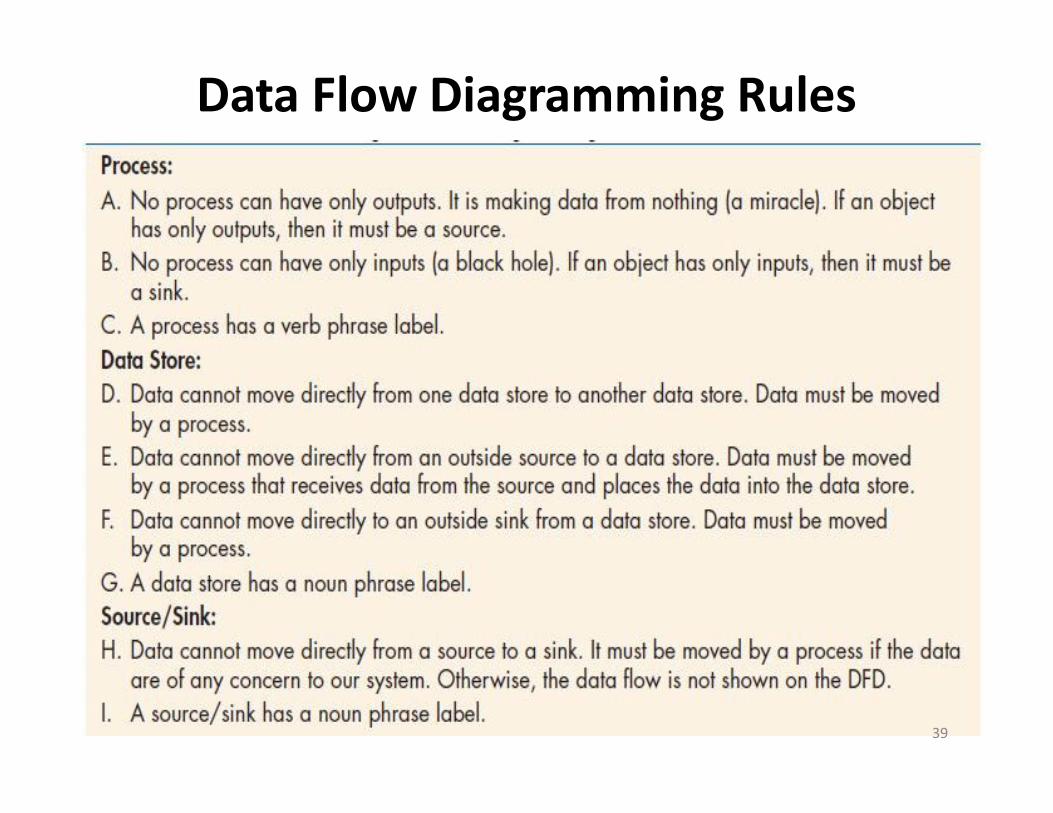
Data Flow Diagramming Rules
39
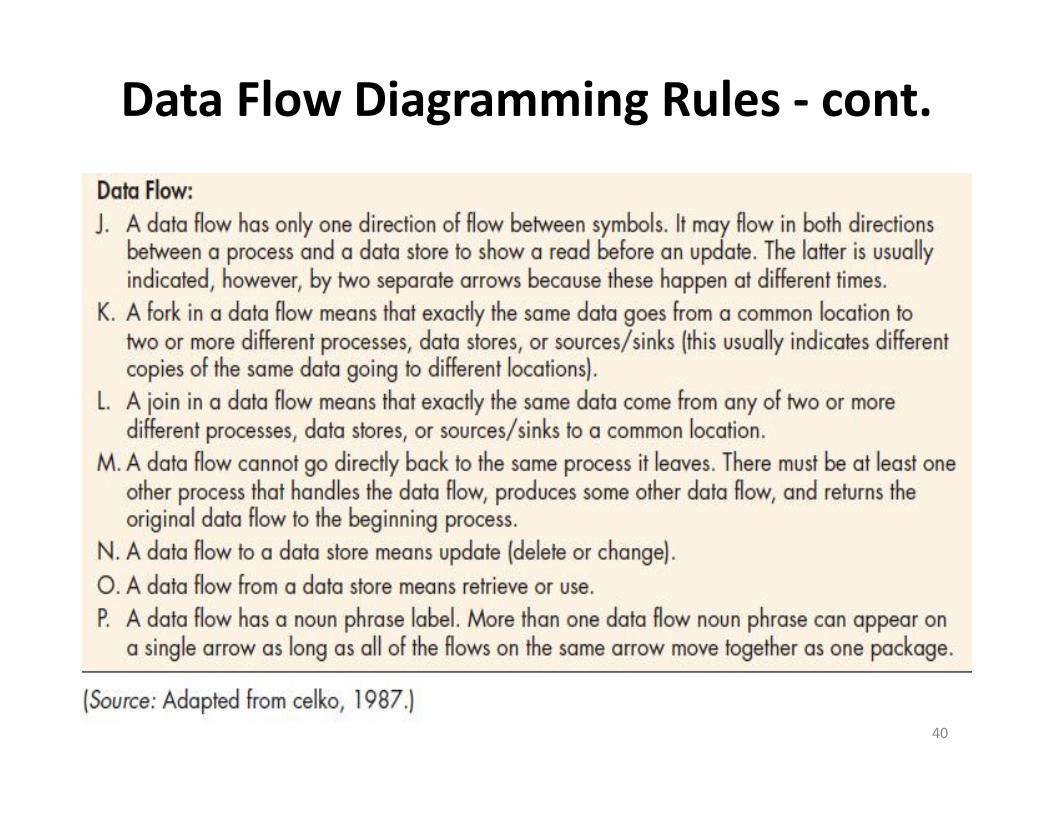
Data Flow Diagramming Rules - cont.
40
DFDs and IDEF0
• DFD is an alternative to IDEF0 that is widely
used in all industries, both in modeling
manufacturing and service processes and
operations.
41
Decomposition of DFDs
• Functional decomposition is an iterative
process of breaking a system description down
into finer and finer detail.
– Creates a set of charts in which one process on a
given chart is explained in greater detail on
another chart.
– Continues until no sub-process can logically be
broken down any further.
42
Hierarchic decomposition in DFA
• Data flow diagrams follow the same principles of hierarchicdecomposition as IDEF0. The highest level diagram is called the contextdiagram
• The context diagram includes the overall process and the sources andsinks that interact with the overall process
• The context diagram is decomposed into a first-level diagram thatshows more details of the process and data flow
• The boundary relationships of the context level are maintained at eachsuccessive level of decomposition
• Therefore, data flows from sources and to sinks that appear at thecontext level also appear at the first level of decomposition
• Decomposition explores greater levels of detail, data stores notrepresented at the context level may be introduced
43
Hierarchic decomposition in DFA
• In general, decomposition should be carried out
to the degree necessary for the analyst to
understand the details of the functions and data
flows
• DFA is widely used in industry. It differs from
IDEF0 in that it focuses exclusively on business
processes and the information that flows among
processes, ignoring material flows, mechanisms,
and controls.
44
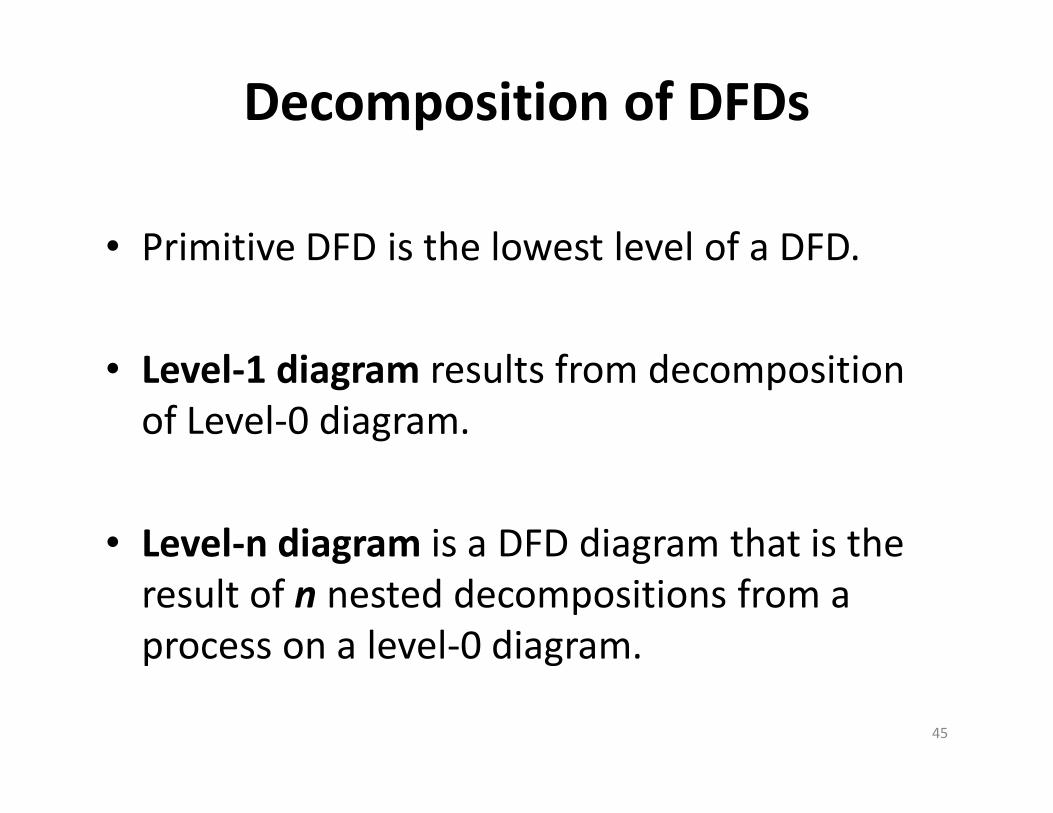
Decomposition of DFDs
• Primitive DFD is the lowest level of a DFD.
• Level-1 diagram results from decomposition
of Level-0 diagram.
• Level-n diagram is a DFD diagram that is the
result of n nested decompositions from a
process on a level-0 diagram.
45
Hierarchic decomposition illustrated:
node A3
46
DFD of node A32
47
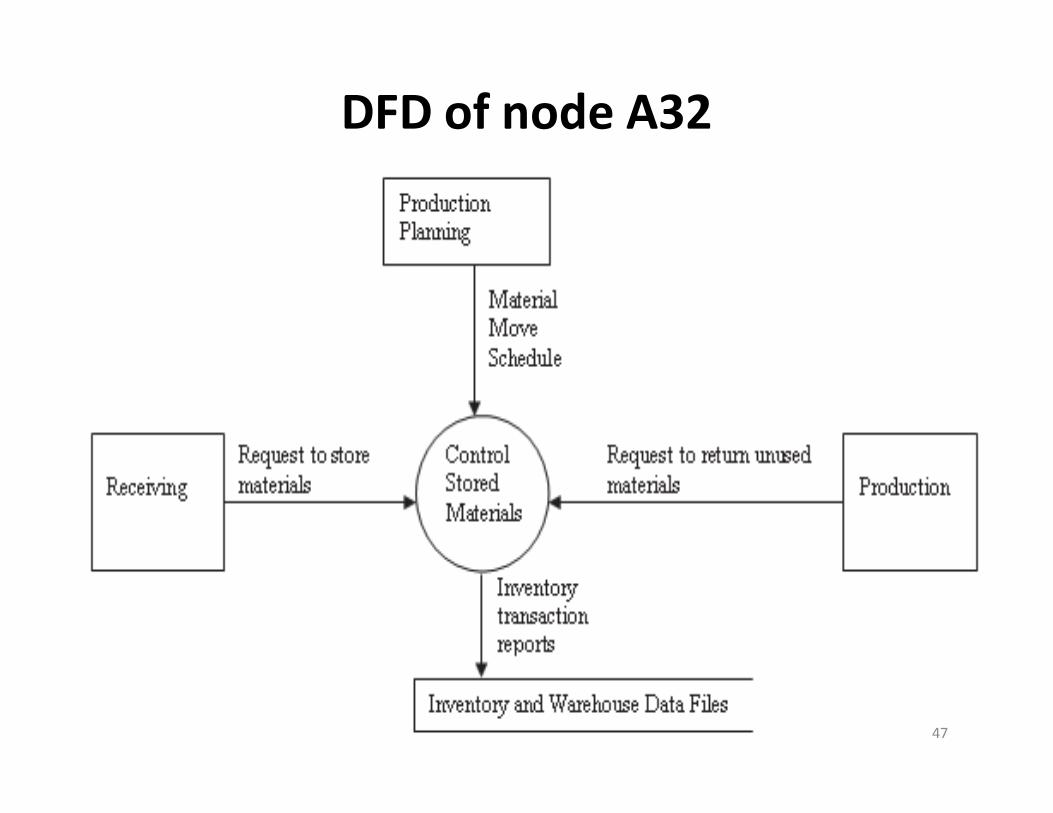
Hierarchic decomposition : node A32• There are three source entities at the boundary of the system. They are
receiving, production planning, and production.
• Receiving is the entity in charge of the process “Control Incoming Material”
• Receiving is a “trigger” محدث for the process “Control Stored Materials” (i.e., it
initiates an action in the process when it makes a “request to store materials”)
• The production planning department is the source of another trigger. The
trigger to move raw material from the warehouse to work in process is the
material move schedule.
• Similarly, a “request to return unused materials” from the production
supervisor is another trigger to the process. Raw material that has been moved
into production but not used must be returned to storage.
• Finally, the process sends an inventory transaction report to a data store. 48
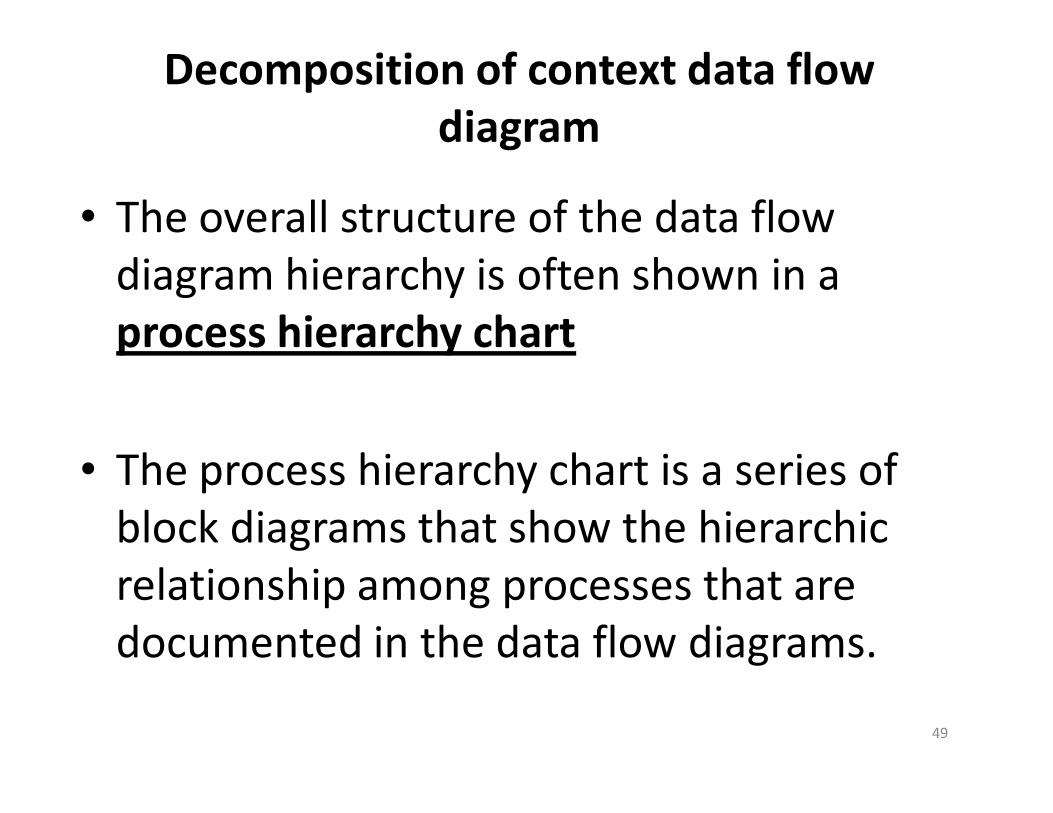
Decomposition of context data flow
diagram
• The overall structure of the data flow
diagram hierarchy is often shown in a
process hierarchy chart
• The process hierarchy chart is a series of
block diagrams that show the hierarchic
relationship among processes that are
documented in the data flow diagrams.
49
Decomposition of context data flow
diagram
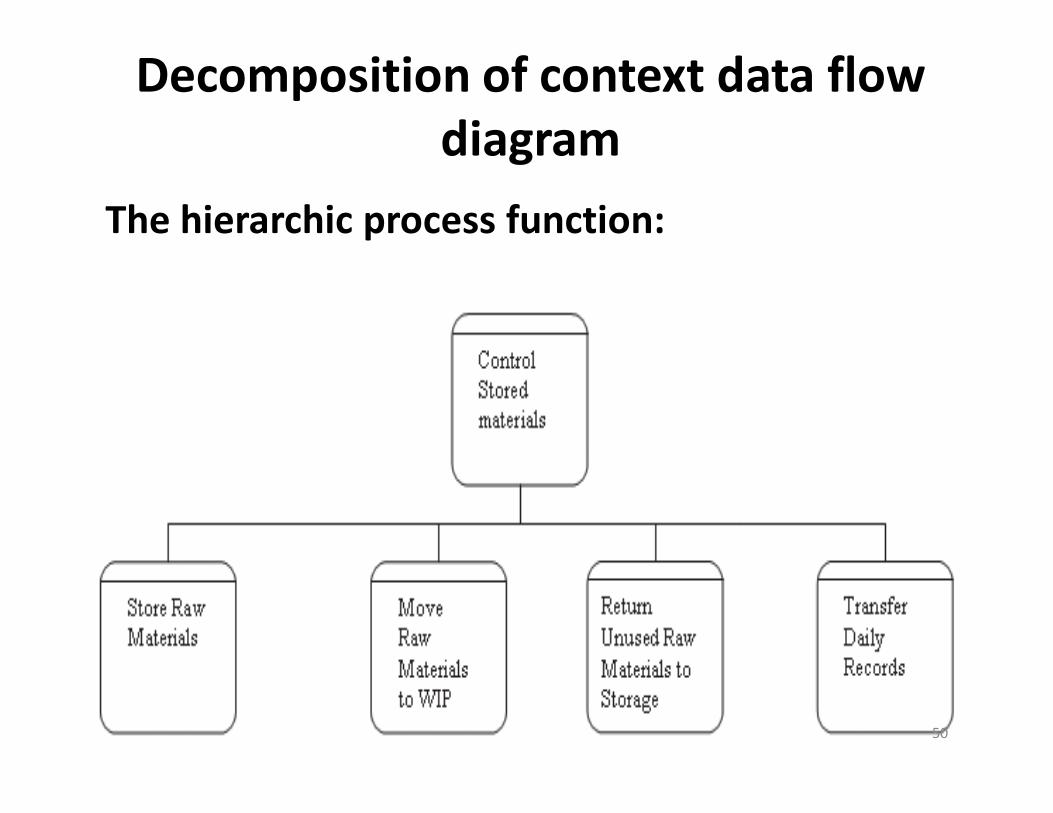
The hierarchic process function:
50
Decomposition of context data flow
diagram
• The context process (Control Stored Materials) is
composed of four level-1 processes:
– Store Raw Materials
– Move Raw Materials to WIP
– Return Unused Raw Materials to Storage
– Transfer Daily Records.
51
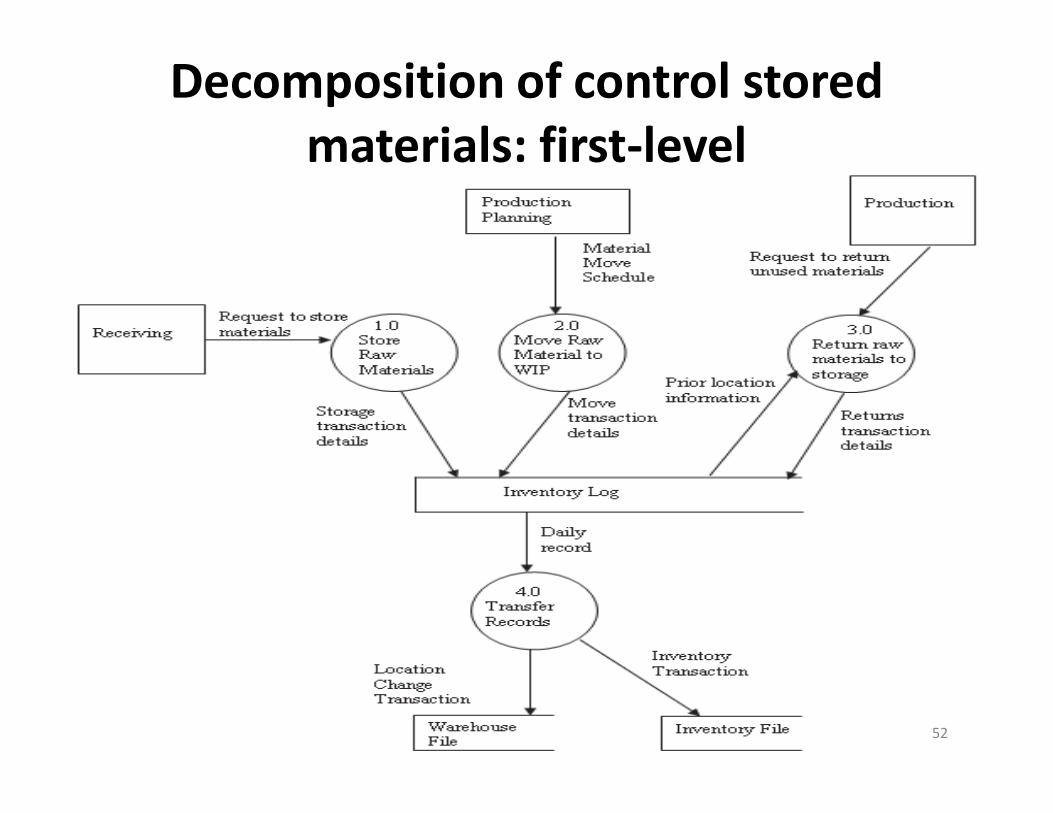
Decomposition of control stored
materials: first-level
52
1. Store raw materials: Receiving makes requests
to forklift truck drivers to move material from the
loading dock to inventory storage. The driver
takes the material to the location. The driver
places the material in the location and then
records the material, the location used, and the
date and time of the transaction in the log.
Description of decomposition of
control stored materials
53
Description of decomposition of
control stored materials
2. Move raw material to WIP: the forklift truck
driver is given the schedule of material moves
from storage to the factory floor. Each time the
driver makes a move, raw material inventory is
debited and the status of the warehouse
location is updated. This is done by indicating a
transaction to relieve inventory in the log,
recording the material, location, date, and time.
54
Description of decomposition of
control stored materials
3. Return unused raw material to storage: Some
materials that are brought to the factory floor
may be returned if they are not used in When
production. Upon request from the production
supervisor, the driver takes the material back to
storage and logs the credit entry into the log.
55
Description of decomposition of
control stored materials
4. Transfer records: The forklift truck driver’s
inventory log is used as the primary record for
updating the warehouse and inventory records.
This updating is done at the end of the shift
Materials management checks for any
discrepancies between the receiving report and
the actual location of material by comparing the
log with the receiving report.
56


![]project-open[ Development Methodology. ]project-open[ Development cycle Functional analysis Decision point Structured Analysis PrototypeUser TestProductMaintenance](https://img.dokumen.tips/doc/110x75/56649dbd5503460f94aaffd8/project-open-development-methodology-project-open-development-cycle-functional.jpg)


![Learning Message-Passing Inference Machines for Structured ... · Contextual Classification with Functional Max-Margin Markov Networks. CVPR 2009. [5] A. Kulesza & F. Pereira. Structured](https://img.dokumen.tips/doc/110x75/5f6f1273170dbf313e581dc1/learning-message-passing-inference-machines-for-structured-contextual-classification.jpg)