Embed Size (px)
Citation preview

Idea Generation, Creativity, and Incentives
Olivier Toubia
January 5th, 2004
Olivier Toubia is a Ph.D. candidate at the Marketing Group, Massachusetts Institute of Technol-ogy, E56-345, 38 Memorial Drive, Cambridge, MA 02142, (617) 253-7353, fax (617) 253-7597, [email protected]. I am indebted to John Hauser for his generous advice and encouragement. This work has also benefited from the suggestions of Duncan Simester, Shane Frederick, Dražen Prelec, Dan Ariely, Birger Wernerfelt, Brian Gibbs, Ray Weaver, and Kristina Shampagn’er. I would also like to thank John Hauser and Dan Ariely for funding the experiment reported in this paper, Rosa Blackwood for her generous help with the logistics of the experiment, as well as Robert Klein and his team at Applied Marketing Science, Inc. for their cooperation and suggestions.
Idea Generation, Creativity, and Incentives
Abstract
Idea generation (ideation) is critical to the design and marketing of new products, to mar-
keting strategy, and to the creation of effective advertising copy. However, there has been rela-
tively little formal research on the underlying incentives with which to encourage participants to
focus their energies on relevant and novel ideas. Several problems have been identified with tra-
ditional ideation methods. For example, participants often free ride on other participants’ efforts
because rewards are typically based on the group-level output of ideation sessions.
This paper examines whether carefully tailored ideation incentives can improve creative
output. I begin by studying the influence of incentives on idea generation using a formal model
of the ideation process. This model identifies conditions under which it is efficient to simply re-
ward participants based on their contributions, and other conditions under which it is not. I show
that in the latter case, the group’s output can be improved by rewarding participants for their im-
pact on the other participants’ contribution. I then develop a practical, web-based, asynchronous
“ideation game,” which allows the implementation and test of various incentive schemes. Using
this system, I run an experiment, which demonstrates that incentives do have the capability to
improve idea generation, confirms the predictions from the theoretical analysis, and provides ad-
ditional insight on the mechanisms of ideation.
Keywords: Idea Generation, New Product Research, Product Development, Marketing
Research, Agency Theory, Experimental Economics, Game Theory.
1
1. Introduction
Idea generation (ideation) is critical to the design and marketing of new products, to mar-
keting strategy, and to the creation of effective advertising copy. In new product development,
for example, idea generation is a key component of the front end of the process, often called the
“fuzzy front end” and recognized as one of the highest leverage points for a firm (Dahan and
Hauser 2001).
The best known idea generation methods have evolved from “brainstorming,” developed
by Osborn in the 1950’s (Osborn 1957). However, dozens of studies have demonstrated that
groups generating ideas using traditional brainstorming are less effective than individuals work-
ing alone (see Diehl and Stroebe 1987 or Lamm and Trommsdorff 1973 for a review). One cause
identified for this poor performance is free riding (Williams et al. 1981, Kerr and Bruun 1983,
Harkins and Petty 1982). In particular, participants free ride on each other’s creative effort be-
cause the output of idea generation sessions is typically considered at the group level, and par-
ticipants are not rewarded for their individual contributions. This suggests that idea generation
could be improved by providing appropriate incentives to the participants. Note that this free rid-
ing effect is likely to be magnified as firms seek input from customers (who typically do not to
have a strong interest in the firm’s success) at an increasingly early stage of the new product de-
velopment process (von Hippel and Katz 2002).
Surprisingly, agency theory appears to have paid little attention to the influence of incen-
tives on agents’ creative output. On the other hand, classic research in social psychology sug-
gests that incentives might actually have a negative effect on ideation. For example, the Hull-
Spence theory (Spence 1956) predicts an enhancing effect of rewards on performance in simple
tasks but a detrimental effect in complex tasks. The reason is that rewards increase indiscrimi-
2
nately all response tendencies. If complex tasks are defined as tasks in which there is a predispo-
sition to make more errors than correct responses, then this predisposition is amplified by re-
wards. Similarly, the social facilitation paradigm (Zajonc 1965) suggests that, insofar as incen-
tives are a source of arousal, they should enhance the emission of dominant, well-learned re-
sponses, but inhibit new responses, leading people to perform well only at tasks with which they
are familiar. McCullers (1978) points out that incentives enhance performance when it relies on
making “simple, routine, unchanging responses,” (p. 14) but that the role of incentives is far less
clear in situations that depend heavily on flexibility, conceptual and perceptual openness, or
creativity. McGraw (1978) identifies two conditions under which incentives will have a detri-
mental effect on performance: “first, when the task is interesting enough for subjects that the of-
fer of incentives is a superfluous source of motivation; second, when the solution to the task is
open-ended enough that the steps leading to a solution are not immediately obvious.” (p. 34)
In this paper I examine whether carefully tailored ideation incentives can improve crea-
tive output. In Section 2, I study the influence of incentives on idea generation using a formal
model of the ideation process. In Section 3, as a step towards implementing and testing the con-
clusions from Section 2, I present a practical, web-based, asynchronous “ideation game,” which
allows the implementation and test of various incentive schemes. Finally, in Section 4, I describe
an initial experiment conducted using this system. This experiment demonstrates that incentives
do have the capability to improve idea generation, is consistent with the predictions from the
theoretical analysis, and provides additional insight on the mechanisms of ideation. Section 5
concludes and suggests some possibilities for future research.
3

2. Theoretical Analysis
The goal of this section is to develop a theoretical framework allowing the study of idea
generation incentives. One characteristic of ideas is that they are usually not independent, but
rather build on each other to form streams of ideas. This is analogous to academic research, in
which papers build on each other, cite each other, and constitute streams of research. Let us de-
fine the contribution of a stream of ideas as the moderator’s valuation for these ideas (for sim-
plicity I shall not distinguish between the moderator and his or her client who uses and values the
ideas). The expected contribution of a stream of ideas can be viewed as a function of the number
of ideas in that stream. Let us assume that the expected contribution of a stream of n ideas is a
non-decreasing, concave function of n, such that each new idea has a non-negative expected
marginal contribution and such that there are diminishing returns to new ideas within a stream.
Note that the analysis would generalize to the case of increasing, or inverted U-shaped, returns.
(This might characterize situations in which the first few ideas in the stream build some founda-
tions, allowing subsequent ideas to carry the greatest part of the contribution.)
The model proposed here is based on Kuhn’s notion of an “essential tension” between
convergent thinking and divergent thinking (Kuhn 1977, Simonton 1988). Divergent thinking
involves changing perspectives and trying new approaches to problems, while convergent think-
ing relies on linear and logical steps and tends to be more incremental. Kuhn claims that “since
these two modes of thought are inevitably in conflict, it will follow that the ability to support a
tension that can occasionally become almost unbearable is one of the prime requisites for the
very best of scientific research.” (p. 226)
Although Kuhn’s focus is the history of science, his insights apply to idea generation. If
several streams of ideas have been established in an idea generation session, a participant has a
4

choice between contributing to one of the existing streams, and starting a new stream. If he or
she decides to contribute to an existing stream, he or she might have to choose between contrib-
uting to a longer, more mature stream, and a newer, emerging one. If we assume that each stream
of ideas reflects a different approach to the topic of the session, then the problem faced by the
participant can be viewed equivalently as that of deciding which approach to follow in his or her
search for new ideas.
I assume that some approaches can be more fruitful than others, and that the participant
does not know a priori the value of each approach but rather learns it through experience. He or
she then has to fulfill two potentially contradictory goals, reflecting Kuhn’s essential tension:
increasing short-term contribution by following an approach that has already proven fruitful, ver-
sus improving long-term contribution by investigating an approach on which little experience has
been accumulated so far.
For example, let us consider a group of participants generating ideas on “How to improve
the impact of the UN Security Council?” (which was the topic of the experimental sessions re-
ported in Section 4). Let us assume that at one point in the session, two streams of ideas have
emerged: a long stream, composed of ten ideas, all approaching the topic from a legal standpoint,
and a shorter stream, with only two ideas, both approaching the topic from a monetary stand-
point. Each participant then has to decide whether to search for new ideas following a legal, or a
monetary approach to the topic. The legal approach has already proven fruitful, whereas the
monetary approach is more risky but potentially more promising.
5
This problem is typical in decision making and is well captured by a representation
known as the multi-armed bandit model (Bellman 1961)1. For simplicity, let us first restrict our-
selves to a two-armed bandit, representing a choice between two approaches A and B. Let us as-
sume that by spending one unit of time thinking about the topic using approach A (respectively
B), a participant generates a relevant idea on the topic with unknown probability pA (respectively
pB). Participants hold some beliefs on these probabilities, which are updated after each trial. Note
that starting a new stream of ideas can be viewed as a special case in which a participant tries an
approach that has not been used successfully yet.
Let us complement this classical multi-armed bandit model by assuming that when NA
trials of approach A have been made, a proportion of which were successful, then the next
idea found using approach A has contribution (similarly for approach B). This assumption
captures the fact that new ideas in a stream have diminishing marginal contribution (0≤α≤1 by
assumption). In the context of our previous example, this assumption implies that the third idea
following the monetary approach is likely to have a greater marginal contribution than the elev-
enth idea following the legal approach, which increases the attractiveness of the riskier monetary
approach.
Ap̂
ANAp̂α
Some problems (like mathematical problems or puzzles) have objective solutions. Once a
solution has been proposed, there is usually little to build upon. Such topics would be repre-
sented by a low value of α. On the other hand, many problems considered in idea generation are
more “open-ended” (trying to improve a product or service) and are such that consecutive ideas
refine and improve each other. Such situations correspond to higher values of α. The parameter α
1 Bandit is a reference to gambling machines (slot machines) that are often called one-armed bandits. In a multi-armed bandit, the machine has multiple lever (arms) and the gambler can choose to pull any one of them at a time.
6
could also depend on the preferences of the user(s) of the ideas. For example, the organizer of
the session might value many unrelated, rough ideas (low α), or, alternatively, value ideas that
lead to a deeper understanding and exploration of certain concepts (high α).
To analyze the tension in ideation, I first identify and characterize three stages in the idea
generation process. Next I consider the simple incentive scheme consisting of rewarding partici-
pants based on their individual contributions, and show that although it leads to optimal search
when α is small enough, it does not when α is large. For large α, this suggests the need for incen-
tives that interest participants in the future of the group’s output. I next show that, although such
incentives allow aligning the objectives of the participants with that of the moderator of the ses-
sion, they might lead to free riding. Avoiding free riding requires further tuning of the rewards
and can be addressed by rewarding participants more precisely for the impact of their contribu-
tions.
Three stages in the idea generation process
Let us consider a two-period model, in which a single participant searches for ideas, and
study the conditions under which it is optimal to follow the approach that has the higher versus
the lower prior expected probability of success. For simplicity, I shall refer to the former as the
“better-looking approach” and to the latter as the “worse-looking approach.”
I assume that the prior beliefs on pA and pB at the beginning of period 1 are independent
and such that pA~Beta(nAS, nAF) and pB~Beta(nBS, nBF), with nAS, nAF, nBS, nBF ≥1.2 The corre-
2 These beliefs can be interpreted as corresponding to a situation in which the participant starts with some initial prior uniform beliefs on pA and pB (pA~Beta(1,1) and pB~Beta(1,1)) and observes, prior to period 1, nAS-1 successes for A, nAF-1 failures for A, nBS-1 successes for B, and nBF-1 failures for B. Because beta priors are conjugates for bi-nomial likelihoods (Gelman et al. 1995), the posterior beliefs after these observations (which are used as priors at the beginning of period 1) are pA~Beta(nAS, nAF) and pB~Beta(nBS, nBF).
7
sponding expected probabilities of success are =E(pA)=nAS/NA; =E(pB)=nBS/NB, where NA=
nAS + nAF and NB= nBS + nBF can be interpreted as the total number of trials observed for A and B
respectively prior to period 1.3 For these assumptions the variance of the beliefs is inversely pro-
portional to the number of trials.
Ap̂ Bp̂
Two effects influence this model. First, if the uncertainty on the worse-looking approach
is large enough compared to the uncertainty on the better-looking approach, it might be optimal
to choose the worse-looking approach in period 1 although it implies a short-term loss. In par-
ticular, if the expected probability of success of the uncertain, worse-looking approach is close
enough to that of the more certain, better-looking approach, a success with the worse-looking
approach in period 1 might lead to updated beliefs that will make this approach much more ap-
pealing than the currently better-looking one.
For example, let us assume that the better-looking approach at the beginning of period 1,
B, has a very stable expected probability of success which is around 0.61. By stable we mean that
it will be similar at the beginning of period 2 whether a success or failure is observed for this ap-
proach in period 1 (NB is very large). Let us assume that the worse-looking approach, A, has an
expected probability of success of 0.60 at the beginning of period 1. However a success with this
approach would increase the posterior probability to 0.67 while a failure would decrease this
posterior probability to 0.50.4 Then, playing B in period 1 would lead to a total expected contri-
bution of 0.61+0.61=1.22 (ignoring discounting for simplicity). Playing A in period 1 would lead
3 The uniform prior can be can be interpreted as resulting from the observation of one success and one failure for each approach. 4 These probabilities would result from NA=5, nAS=3, nAF=2, implying that =3/5 and that after a success is updated to 4/6.
Ap̂ Ap̂
8
to an expected total contribution of 0.60+0.60*0.67+0.40*0.61=1.25 (play A in period 2 iff it
was successful in period 1), which is higher.
Second, if the number of trials (and successes) on the better-looking approach gets large,
this approach becomes over-exploited (due to the decreasing marginal returns) and it might be-
come more attractive to choose the worse looking approach: although the probability of success
is lower, the contribution in case of success is higher.
Let us define (we define similar quantities for B):
• ST(A) the expected contribution from period 1 obtained by choosing approach A in period
1 (ST stands for short-term).
• LT(A) the expected contribution from period 2, calculated at the beginning of period 1, if
A is played in period 1.
By definition, it is optimal to play B in period 1 if and only if ST(B)+LT(B) ≥
ST(A)+LT(A). If B is such that > , then ST(B)>ST(A) unless B has been over-exploited and
ST(B)≤ST(A). The following propositions characterize three stages in the idea generation proc-
ess, labeled exploration, exploitation, and diversification. If B has been over-exploited, diversifi-
cation is optimal and A should be played in period 1. When B has not been over-exploited yet,
then if α is small enough, the exploitation of B is always optimal. In this case, exploring A would
be too costly: at the same time as the participant would learn more about pA, he or she would also
heavily decrease the attractiveness of this approach. On the other hand, when α is large enough,
then if A is uncertain enough compared to B, the exploration of A might be optimal in period 1.
Exploration is characterized by a short-term loss incurred in order to increase long-term contri-
bution.
Bp̂ Ap̂
9
Proposition 1a: For all , NA, α<1, for all close enough to such that < , if B
has been over-exploited (ST(B)≤ST(A)), then diversification is optimal in period 1.
Bp̂ Ap̂ Bp̂ Ap̂ Bp̂
Proposition 1b: For all ,NA, for all α close enough to 0, for all close enough
to such that < , if B has not been over-exploited (ST(B)>ST(A)), then the exploi-
tation of B is optimal in period 1.
Bp̂ Ap̂
Bp̂ Ap̂ Bp̂
Proposition 1c: For all , NA, for all α close enough to 1 such that α<1, for all close
enough to such that < , there exists 0<NB* <NB** (0<VB**<VB*) such that
Bp̂
Ap̂
Ap̂
Bp̂ Bp̂
• The exploitation of B is optimal if NB≤NB* (Var(pB)≥VB*).
• The exploration of A is optimal if NB*≤NB≤NB** (VB**≤Var(pB)≤VB*).
• Diversification is optimal if NB**≤NB (Var(pB)≤VB**).
The proofs to the propositions are in Appendix 1. Note that the above propositions focus
on the more interesting case where the expected probabilities of success of the two approaches
are close.
The identification and characterization of these three stages provides a useful background
for the study of idea generation incentives. In particular, short-term focus is optimal in the diver-
sification and exploitation stages, such that participants trying to maximize their own contribu-
tions behave as if they were maximizing the group’s output. In the exploration stage, however,
participants have to forego some short-term contribution in order to increase the group’s future
output. In this case problems arise if participants are not given incentives to internalize the influ-
ence of their present actions on the future of the group.
10
Rewarding participants for their individual contributions
Consider the incentive scheme that consists of rewarding participants based on their indi-
vidual contributions. In practice, this could be operationalized by having an external judge rate
each idea sequentially, and rewarding each participant based on the ratings of his or her ideas.
This scheme is probably among the first ones that come to mind, and addresses the free-riding
issue mentioned in the introduction. There are also many situations in which individual contribu-
tion is likely to be the most sophisticated metric available. It is then useful to identify some con-
ditions under which basing incentives on this metric leads participants to behave in a way that
maximizes the group’s total contribution, and conditions under which it does not.
Let us introduce a second participant into the model. Assume that, at each period, both
players simultaneously choose one of the two approaches. At the end of period 1, the outcomes
of both players’ searches are observed by both players, and players update their beliefs on pA and
pB.5. Each player’s payoff is proportional to his or her individual contribution, i.e., to the sum of
the contributions of his or her ideas from the two periods. The contribution of the group is equal
to the sum of the contributions of each player. Note that α applies equally for both players, such
that if a player finds an idea using a certain approach, the marginal return on this approach is
equally decreased for both participants. The assumption that players independently choose which
approach to follow and then share the output of their searches is probably more descriptive of
electronic ideation sessions (in which participants are seated at different terminals from which
they type in their new ideas and read the other participants’ ideas) than it is of traditional face-to-
5 Equivalently, we could assume that players report the outcome of their t=1 search only if it is successful, by sub-mitting a new idea. In this case if a player does not submit an idea at the end of period 1, the other player can infer that her search was unsuccessful. Finally, we could interpret this assumption as meaning that “success” and “failure” correspond to “good” and “fair” ideas, and that both types of ideas are worth submitting.
11
face sessions. As will be seen later, electronic sessions have been shown to be more effective
than face-to-face sessions (Gallupe et al. 1991, Nunamaker et al. 1987).
Let us consider the subgame-perfect equilibrium (SPE) of the game played by the partici-
pants, as well as the socially optimal strategy, i.e., the strategy that maximizes the total expected
contribution of the group.
Low-α case (rapidly decreasing returns)
When α is low, the marginal contribution of successive ideas following the same ap-
proach diminishes quickly. In this case, exploration is never optimal, which lowers the value of
group interactions. Consequently, actions that are optimal for self-interested participants trying
to maximize their own contributions are also optimal for the group. This is captured by the fol-
lowing proposition:
Proposition 2: For all NA, NB, there exists α* such that 0<α<α*⇒ for all , such
that < and is close enough to , if participants are rewarded based on their
own contributions, then a strategy (x,y) is played in period 1 in a SPE of the game iff it is
socially optimal.
Ap̂ Bp̂
Ap̂ Bp̂ Ap̂ Bp̂
High-α case (slowly decreasing returns)
When α is close to 1, there are situations in which exploration is optimal. However, ex-
ploration results in a short-term loss suffered only by the explorer, and a potential long-term
benefit enjoyed by the whole group (participants are assumed to share their ideas). There are then
some cases in which it is socially optimal that at least one player explores in period 1, but no
12
player will do so in any SPE of the game. This is illustrated by the following proposition when
α=1:
Proposition 3: If α=1, then for all , for all < close enough to , there exists
NAlow<NAhigh (Vlow<Vhigh) such that if NB is large enough (Var(pB) low enough), then
Bp̂ Ap̂ Bp̂ Bp̂
• NA<NAhigh (Var(pA)>Vlow) implies that it is not socially optimal for both players to
choose B in period 1 (at least one player should explore)
• NAlow<NA<NAhigh (Vlow<Var(pA)<Vhigh) implies that both players choose B in pe-
riod 1 in any SPE of the game (no player actually explores)
Interesting participants in the future of the group’s output
Proposition 3 demonstrates a potential misalignment problem when building on ideas
matters, that is, when the marginal returns to subsequent ideas are high. In order to overcome this
problem, participants should be forced to internalize the effect of their present actions on the fu-
ture of the other participants’ contribution. To study the dynamic nature of the incentives implied
by this observation, let us consider a more general framework, with an infinite horizon, N par-
ticipants, and a per-period discount factor δ. Assume that participant i’s output from period t, yit,
has a probability density function f( , where xjτ is participant j’s
action in period τ, and that participant i’s contribution from period t is Cit=C .
The two-armed bandit model considered earlier is a special case of this general model.
))(,,...,| 1...1,...11 −== tNjjtNtit yxxy ττ
))(( ...1,...1 tNjjy == ττ
Interesting participants in the group’s future output allows aligning the incentives, but it
might also lead to free-riding. To illustrate this, let us consider the incentive scheme that consists
of rewarding a participant for his or her action in period t according to a weighted average be-
13
tween his or her contribution in period t and the other participants’ contribution in period t+1.6
More precisely, player i receives a payoff for his or her action in period t proportional
to[ . Let us call S(γ) such a scheme. We have the following proposition: ].).1(. 1,∑≠
+−+ij
tjit CC δγγ
Proposition 4: In any infinite horizon game with discount factor δ<1, S(γ) aligns the ob-
jectives of the moderator and the participants for any form of the contribution and output func-
tions iff S(γ) is equivalent to a proportional sharing rule in which player i receives a payoff for
his or her actions in period t proportional to∑j
jtC .
Intuitively, in period t participant i gets, in addition to a share of Cit as a reward for his or
her actions in period t, a share of the other participants’ contribution from period t ( ) as a
reward for his or her actions in period t-1. However, the fact that this reward is attributed to his
or her action in period t-1 is irrelevant in period t, since this action has already been taken. Hence
the scheme is equivalent to giving the participant in period t a reward equal to a weighted aver-
age between his or her contribution in period t and the other participants’ contribution in the
same period.
∑≠ij
tjC ,
The equivalence to a proportional sharing rule in this example illustrates how group in-
centives align the objectives at the same time as they introduce free riding (Holmstrom 1982),
even in a dynamic setting. In particular, although the objective function of the participants is
6 Proposition 4 would also hold with a weighted average between the participant’s contribution in period t and a discounted sum of the other participants’ contribution in subsequent periods.
14
proportional to that of the moderator, it is possible for a participant to be paid without participat-
ing in the search. This imposes a cost on the moderator.
More precisely, let us assume that at each period, players have an option not to search for
ideas, or to search at a per-period cost c, and that the first-best level of effort is for all the players
to perform a search at each period. Then if the reward given to participant i at period t is equal
to , β has to be high enough for the incentive compatibility (IC) constraints of the par-
ticipants to be satisfied (i.e., such that each participant is willing to search in each period). In this
case free riding forces the moderator to redistribute a higher share of the created value to the par-
ticipants.7
∑j
jtC.β
Rewarding Participants for their Impact
In order to address free riding while still aligning the objectives, one option is to reward
each participant more precisely for that part of the group’s future contribution that depends di-
rectly on his or her actions, i.e., for his or her impact on the group. In particular, the following
proposition considers a modification of the above scheme that rewards participant i for his or her
action in period t based on a weighted average between his or her contribution in period t, and
the impact of this action on the group’s future contribution (let us denote such a scheme by
S’(γ)). Under this alternative scheme, the objectives of the participants remain aligned with that
of the moderator, because the only component removed from the participant’s objective function
is not under his or her control, and free riding is reduced, because a participant does not get re-
warded for the other participants’ contribution unless it is tied to his or her own actions. This re-
duces the share of the created value that needs to be redistributed to the participants. (The impact
7 Note that I assume that the moderator’s valuation for the ideas is high enough compared to c, such that it is possi-ble and optimal for him or her to induce the participants to search in each period.
15

of participant i’s action in period t is defined here as: where )],(~[),(1
tiCCt jt ij
jt
ττ
ττ τλδ∑ ∑
+∞
+= ≠
− −
),(~ tiC jτ is the expected value of Cjτ obtained when yit is null and all players maximize the
group’s expected output at each period, and λ(t,τ)= )()1.( τδδδ −−tδ is such that
for all t and τ). ∑−
=
1
1
,(τ
τλt
t = 1)
Proposition 5: S’(1/2) is such that the objectives of the participants are aligned with that
of the moderator, and the total expected payoffs distributed in the session are lower than under a
proportional sharing rule.
Summary of this section
• Three stages can be defined in the idea generation process: exploration, exploitation and
diversification.
• When the marginal contribution of new ideas following the same approach decreases
quickly, exploration is never optimal and rewarding participants based on their individual
contributions leads to optimal search.
• When the marginal contribution of new ideas following the same approach decreases
slowly, exploration can be optimal and rewarding participants based on their individual
contributions leads to suboptimal search.
• In the latter case, the group’s output can be improved by rewarding each participant
based on a weighted average between his or her individual contribution and his or her
impact on the group’s contribution.
16
This last result can be translated into a testable hypothesis. First, let us note that this re-
sult, like the others summarized above, assumes that all participants search for ideas at each pe-
riod. Hence the different incentive schemes should be compared holding participation constant.
The following hypothesis, which will be examined in the experiment in Section 4, is then suffi-
cient for the result to hold:
Hypothesis: For a given level of participation, if the marginal contribution of new ideas
following the same approach is slowly diminishing, the total contribution of the group is greater
if participants are rewarded for their impact than it is if they are rewarded for their individual
contributions.
The application and test of the insights from this theoretical analysis necessitate an idea
generation system that is compatible with the incentive schemes considered in this section, i.e.,
which allows the measurements necessary to their implementation. Moreover, for the theoretical
results to be managerially relevant, groups generating ideas using this system should perform
better when incentives are present than when they are not, and perform better than groups or in-
dividuals generating ideas with other established methods. In particular, this idea generation sys-
tem should not inhibit, and possibly enhance participants’ creative abilities. Section 3 proposes a
particular system.
3. An Ideation Game
I now describe an incentive-compatible “ideation game“ that allows testing and imple-
menting the insights derived in Section 2. In this game, participants score points for their ideas,
17
the scoring scheme being adjustable to reward individual contribution, impact, or a weighted av-
erage of the two. The design of the game is based on the idea generation, bibliometric, and con-
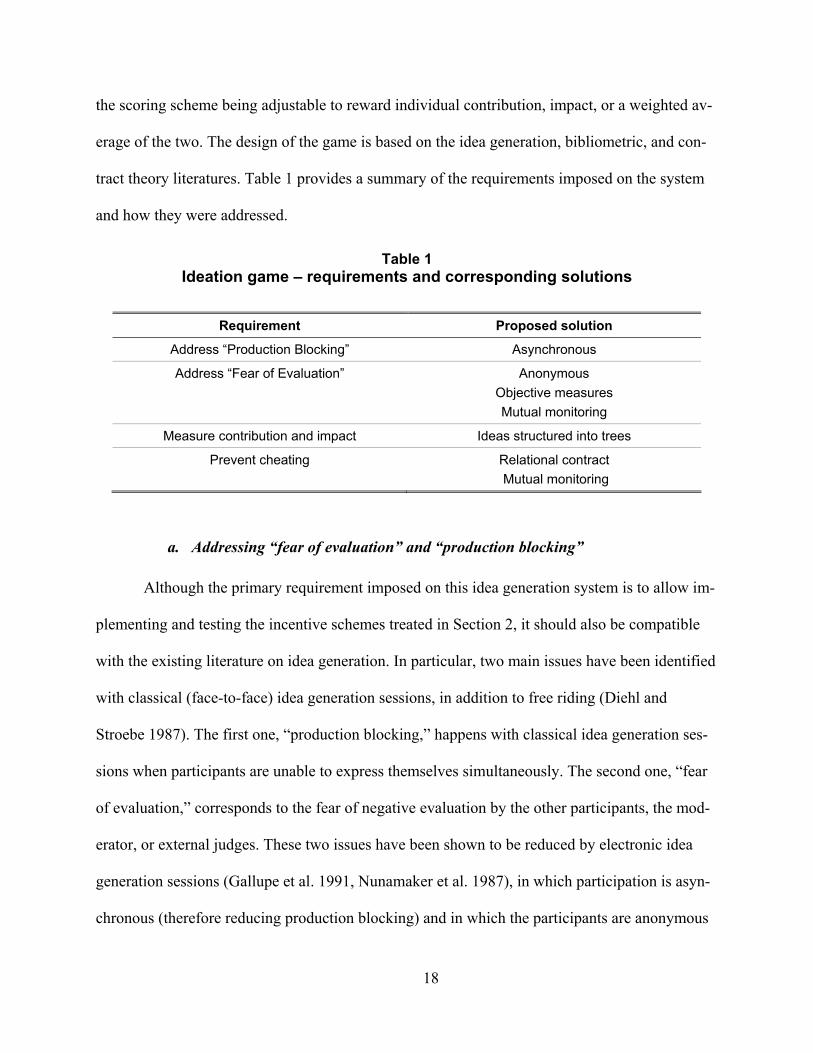
tract theory literatures. provides a summary of the requirements imposed on the system
and how they were addressed.
Table 1
Table 1 Ideation game – requirements and corresponding solutions
Requirement Proposed solution
Address “Production Blocking” Asynchronous
Address “Fear of Evaluation” Anonymous Objective measures Mutual monitoring
Measure contribution and impact Ideas structured into trees
Prevent cheating Relational contract Mutual monitoring
a. Addressing “fear of evaluation” and “production blocking”
Although the primary requirement imposed on this idea generation system is to allow im-
plementing and testing the incentive schemes treated in Section 2, it should also be compatible
with the existing literature on idea generation. In particular, two main issues have been identified
with classical (face-to-face) idea generation sessions, in addition to free riding (Diehl and
Stroebe 1987). The first one, “production blocking,” happens with classical idea generation ses-
sions when participants are unable to express themselves simultaneously. The second one, “fear
of evaluation,” corresponds to the fear of negative evaluation by the other participants, the mod-
erator, or external judges. These two issues have been shown to be reduced by electronic idea
generation sessions (Gallupe et al. 1991, Nunamaker et al. 1987), in which participation is asyn-
chronous (therefore reducing production blocking) and in which the participants are anonymous
18

(therefore reducing fear of evaluation). The online system proposed here is anonymous and
asynchronous as well. In particular, participants create (or are given) an anonymous login and
password, and log on to the idea generation session at their convenience (the session lasts typi-
cally for a few days).
Measuring the contribution and the impact of participants
One simple way to measure the contribution and impact of participants would be to have
them evaluated by external judges. However, this approach has limitations. First, it is likely to
trigger fear of evaluation. Second, the evaluation criteria of the moderator, the judges and the
participants might differ. Third, it increases the cost of the session. The proposed ideation game
instead adopts a structure that provides objective measures of these quantities. These objective
measures do not require additional evaluation, are computed based on well-stated rules, and offer
continuous feedback on the performance of the participants.
Bibliometric research suggests that the number of ideas submitted by a participant should
be a good measure of his or her contribution, and that his or her number of “citations” should be
a good measure of his or her impact (King 1987). The proposed structure adapts the concept of
citation count from the field of scientific publications (which are the focus of bibliometry), to
idea generation. An example is provided in . Ideas are organized into “trees,” such that
the “son” of an idea appears below it, in a different color and with a different indentation (one
level further to the right). The relation between a “father-idea” and a “son-idea” is that the son-
idea builds on its father-idea. More precisely, when a participant enters a new idea, he or she has
the option to place it at the top of a new tree (by selecting “enter an idea not building on any pre-
vious idea”) or to build on an existing idea (by entering the identification number of the father-
idea and clicking on “build on/react to idea #...”). Note that an idea can have more than one
Figure 1
19
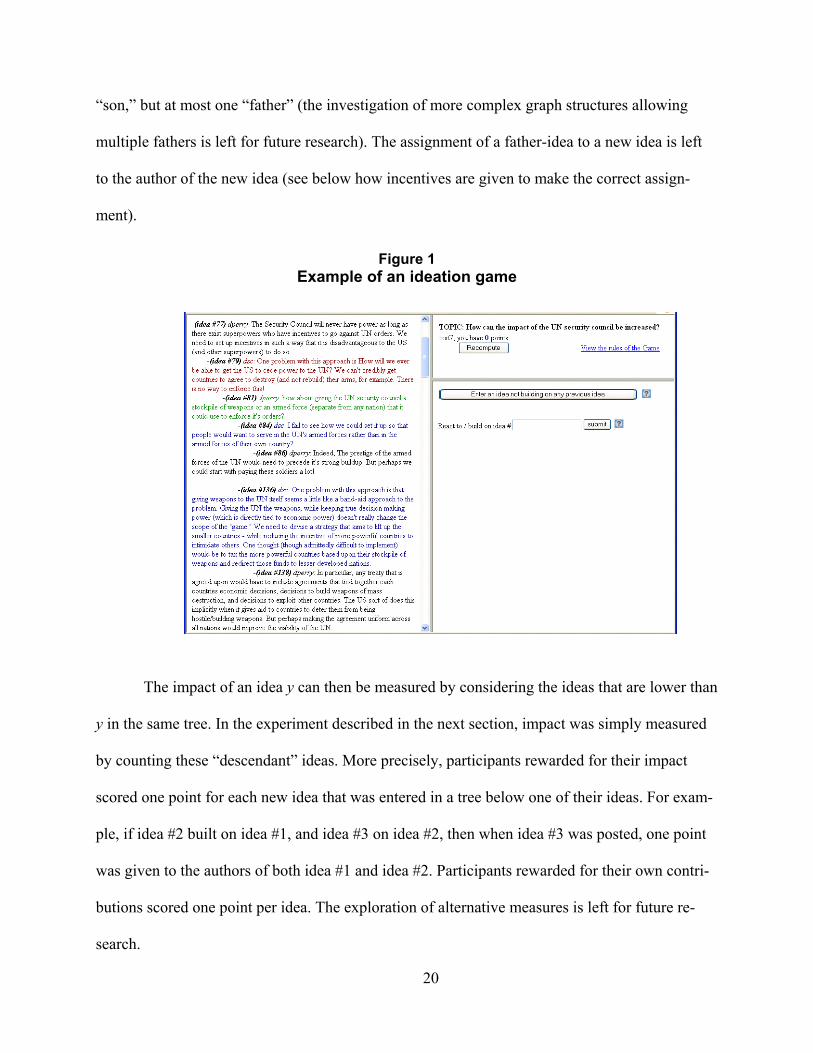
“son,” but at most one “father” (the investigation of more complex graph structures allowing
multiple fathers is left for future research). The assignment of a father-idea to a new idea is left
to the author of the new idea (see below how incentives are given to make the correct assign-
ment).
Figure 1 Example of an ideation game
The impact of an idea y can then be measured by considering the ideas that are lower than
y in the same tree. In the experiment described in the next section, impact was simply measured
by counting these “descendant” ideas. More precisely, participants rewarded for their impact
scored one point for each new idea that was entered in a tree below one of their ideas. For exam-
ple, if idea #2 built on idea #1, and idea #3 on idea #2, then when idea #3 was posted, one point
was given to the authors of both idea #1 and idea #2. Participants rewarded for their own contri-
butions scored one point per idea. The exploration of alternative measures is left for future re-
search.
20
If a participant decides to build on an idea, a menu of “conjunctive phrases” (e.g. “More
precisely”, “On the other hand”, “However”…) is offered to him or her (a blank option is also
available), in order to facilitate the articulation of the links between ideas. Pretests suggested that
these phrases were useful to the participants.
Preventing cheating
Although this structure provides potential measures of the contribution and impact of the
different participants, if the scoring system were entirely automatic and if no subjective judgment
were ever made, participants could “cheat” by simply posting irrelevant ideas in order to score
unbounded numbers of points. Consequently, some level of subjective judgment seems inevita-
ble. These judgments, however, should keep fear of evaluation to a minimum, and limit costly
interventions by external judges. This is addressed by carefully defining the powers of the mod-
erator of the session. First, the moderator does not have the right to decide which ideas deserve
points. However, he or she has the power to expel participants who are found to cheat repeatedly,
i.e., who submit ideas that clearly do not address the topic of the session or who wrongly assign
new ideas to father-ideas. This type of relation between the participants and the moderator is
called a “relational contract” in agency theory. In this relationship the source of motivation for
the agent is the fear of termination of his or her relation with the principal (Baker at al. 1998,
Levin 2003). In the present case, if the moderator checks the session often enough, it is optimal
for participants to only submit ideas which they believe are relevant.
In order to reduce the frequency with which the moderator needs to check the session,
this relational contract is complemented by a mutual monitoring mechanism (Knez and Simester
2001, Varian 1990). In particular, if participant i submits an idea which is found to be fraudulent
21
by participant j, then j can “challenge” this idea.8 This freezes the corresponding stream of ideas
(no participant can build on a challenged idea), until the moderator visits the session and deter-
mines who, between i and j, was right.9 The participant who was judged to be wrong then pays a
fee to the other participant. The amount of this fee was fine-tuned based on pretests and was set
to 5 points in the experiment. This mechanism is economical because it reduces the frequency
with which the moderator needs to visit the session, without increasing its cost, since challenges
result in a transfer of points between participants (no extra points need to be distributed). Beyond
the cost factor, another argument in favor of having participants monitor each other is the finding
by Collaros and Anderson (1969) that fear of evaluation is greater when the evaluation is done
by an expert judge rather than by fellow participants. Note that in equilibrium, there should be no
challenges, because participants should only submit relevant ideas and challenge irrelevant ideas.
Indeed, in the experiment, there was only one challenge.
Practical implementation
This ideation game was programmed in php, using a MySQL database. Its structure and
the instructions were fine-tuned based on two pretests. The pretests used participants from a pro-
fessional marketing research/strategy firm. One pretest addressed an internal problem (improving
the workspace) and a second pretest addressed an external problem (how to re-enter a market).
In the implementation, the moderator also has the ability to enter comments, either on
specific ideas or on the overall session. Participants also have the ability to enter comments on
specific ideas. This allows them, for example, to ask for clarification or to make observations
8 In the implementation used so far, participants cannot challenge an idea if it has already been built upon. 9 The idea is deleted if j was right.
22
that do not directly address the topic of the session. The difference between comments and ideas
is that comments are not required to contribute positively to the session, and are not rewarded.
Finally, note that the implementation choices (e.g., amount of the fee in case of a chal-
lenge), although determined by the pretests, are likely to be improved with further experimenta-
tion.
4. Experiment
The experiment presented in this paper has two primary goals. The first goal is to test
whether incentives have the power to improve the output of idea generation sessions. Recall that
some research in social psychology suggests that incentives will have a negative influence on
performance. The second goal is to verify the hypothesis, stated in Section 2, that under certain
conditions, the total contribution of the group can be improved by rewarding each participant for
the impact of his or her contribution, as opposed to his or her own contribution. This experiment
also allows studying further the influence of incentives on the dynamics of idea generation.
a. Experimental design
The experiment used the ideation game described in the previous section, and had three
conditions. The only difference between conditions was the incentive system, that is, the manner
in which points were scored in the game. Each participant was randomly assigned to one idea
generation session, and each idea generation session was assigned to one of the three conditions
(all participants in a given session were given the same incentive scheme). The points scored
during the session were later translated into cash rewards. Recall that the hypothesis derived in
Section 2 relies on two assumptions: an equal level of participation, and a slowly diminishing
marginal contribution. The latter is implied by the systematic measures of contribution and im-
pact used in this experiment, which value all ideas equally. The former was addressed by cali-
23

brating the value of points in the different conditions based on a pretest, such that participants in
all conditions could expect similar payoffs.10
A total of 78 participants took part in the experiment over a period of 10 days, signing up
for the sessions at their convenience. Three sets of parallel sessions were run (one session per
condition in each set), defining three “waves” of participants.11 Each session lasted up to five
days, and within each wave, the termination time of the three sessions was the same.12
The first condition (the “Flat” condition) was such that participants received a flat reward
of $10 for participation. In this condition, no points were scored (points were not even men-
tioned).
In the second condition (the “Own” condition), participants were rewarded based exclu-
sively on their own contributions, and scored one point per idea submitted (each point was worth
$3).
In the third condition (the “Impact” condition), each participant was rewarded based ex-
clusively on the impact of his or her ideas. Participants scored one point each time an idea was
submitted that built on one of their own ideas (see previous section for the details of the scoring
scheme). One interpretation of this scoring rule could be that participants scored one point for
each “citation” of one of their ideas. Each point was worth $2 for the first two waves of partici-
10In this pretest, a group of approximately 15 employees from a market research firm generated ideas on “How can we better utilize our office space?”. Points were scored using the same scheme as in the “Impact” condition. Al-though points were not translated to monetary rewards in this pretest, participants found the game stimulating and felt directly concerned with the topic, resulting in 40 ideas submitted. Calibration was done conservatively, such that based on the pretest, participants in the “Flat” condition should expect slightly higher payoffs than participants in the “Own” condition, who in turn should expect slightly higher payoffs than participants in the “Impact” condition. 11 The first wave consisted of the first 36 participants who signed up and had 12 participants per condition, the sec-ond wave consisted of the following 20 participants, with 7 participants in the “Flat” and in the “Own” conditions and 6 in the “Impact” condition, and the last wave consisted of the last 22 participants, with 8 in the “Flat” condi-tion, and 7 in the “Own” and “Impact” conditions. 12 This termination time was usually driven by budget considerations. Messages were posted on the “Impact” and “Own” sessions informing the participants that the session was over. The “Flat” sessions were not interrupted, but only the ideas submitted before the termination of the other sessions were taken into account.
24

pants; the value of points was decreased by half to $1 for the last wave. The results for the third
wave were similar to those for the first two waves; hence the same analysis was applied to the
data from the three waves.
In order to provide a strong test of the hypothesis that incentives can improve idea gen-
eration, an engaging topic, as well as some motivated participants, were selected. In particular,
the topic was: “How can the impact of the UN Security Council be increased?” (note that the ex-
periment was run in March 2003, at the time of the US-led war in Iraq), and the participants were
recruited at an anti-war walkout in a major metropolitan area on the east coast, as well as on the
campus of an east coast university.
Three graduate students in political science in the same university (naïve to the hypothe-
ses) were later hired as expert judges, and were asked to evaluate independently the output of the
sessions on several qualitative criteria (the judges were paid $50 each for their work).
Verification of the theoretical hypothesis
As noted earlier, participants in this experiment were rewarded as if all ideas were
equally valued by the moderator (there was no discounting of ideas depending on their position
in a tree). More precisely, participants were rewarded as if the value of the parameter α from
Section 2 was equal to 1, i.e., as if contribution was measured by the number of ideas.
With α=1, the theoretical hypothesis proposed at the end of Section 2 suggests that the to-
tal number of ideas should be higher when participants are rewarded for their impact (measured
by their number of “citations”), than when they are rewarded for their number of ideas. Note the
counter-intuitive nature of this prediction: in the “Own” condition, although participants are try-
ing to maximize their number of ideas and know that the other participants in the group have the
same objective, they produce fewer ideas than the participants in the “Impact” condition who are
25
rewarded for their impact on the group. The intuition behind this prediction is that participants
who are rewarded for their number of ideas are less likely to explore new approaches, which
leads to less inspiring ideas, which leads to fewer ideas in total.
The data are consistent with this prediction: compared to the “Own” condition, partici-
pants in the “Impact” condition submitted significantly more unique ideas (p-value<0.05), 13
where the number of unique ideas is defined as the number of ideas minus the number of redun-
dant ideas (an idea is classified as redundant if it was judged as redundant by any of the three
judges).
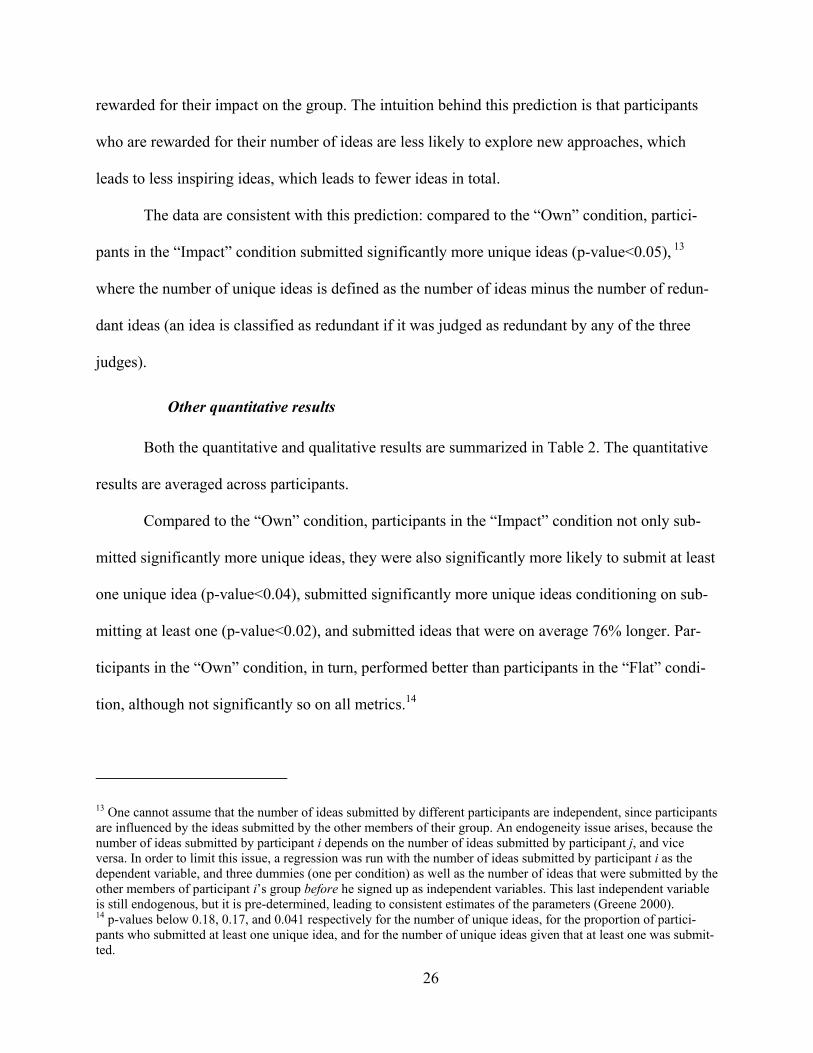
Other quantitative results
Both the quantitative and qualitative results are summarized in Table 2. The quantitative
results are averaged across participants.
Compared to the “Own” condition, participants in the “Impact” condition not only sub-
mitted significantly more unique ideas, they were also significantly more likely to submit at least
one unique idea (p-value<0.04), submitted significantly more unique ideas conditioning on sub-
mitting at least one (p-value<0.02), and submitted ideas that were on average 76% longer. Par-
ticipants in the “Own” condition, in turn, performed better than participants in the “Flat” condi-
tion, although not significantly so on all metrics.14
13 One cannot assume that the number of ideas submitted by different participants are independent, since participants are influenced by the ideas submitted by the other members of their group. An endogeneity issue arises, because the number of ideas submitted by participant i depends on the number of ideas submitted by participant j, and vice versa. In order to limit this issue, a regression was run with the number of ideas submitted by participant i as the dependent variable, and three dummies (one per condition) as well as the number of ideas that were submitted by the other members of participant i’s group before he signed up as independent variables. This last independent variable is still endogenous, but it is pre-determined, leading to consistent estimates of the parameters (Greene 2000). 14 p-values below 0.18, 0.17, and 0.041 respectively for the number of unique ideas, for the proportion of partici-pants who submitted at least one unique idea, and for the number of unique ideas given that at least one was submit-ted.
26
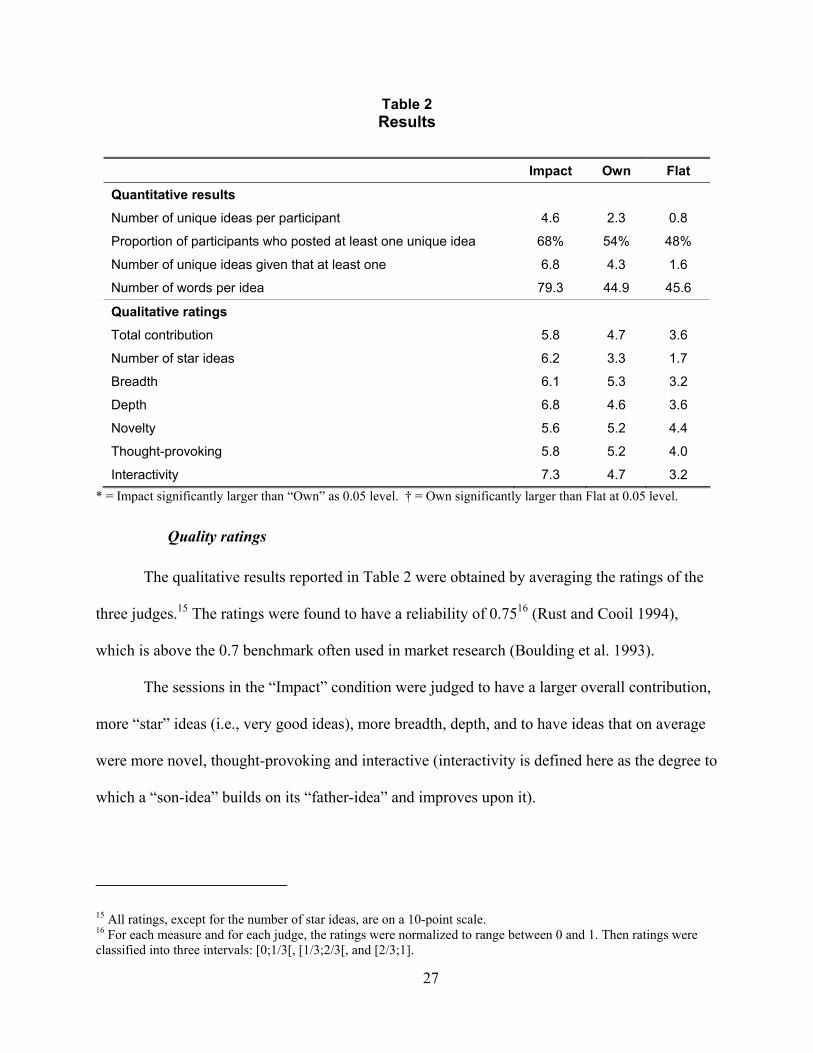
Table 2 Results
Impact Own Flat
Quantitative results
Number of unique ideas per participant 4.6 2.3 0.8
Proportion of participants who posted at least one unique idea 68% 54% 48%
Number of unique ideas given that at least one 6.8 4.3 1.6
Number of words per idea 79.3 44.9 45.6
Qualitative ratings
Total contribution 5.8 4.7 3.6
Number of star ideas 6.2 3.3 1.7
Breadth 6.1 5.3 3.2
Depth 6.8 4.6 3.6
Novelty 5.6 5.2 4.4
Thought-provoking 5.8 5.2 4.0
Interactivity 7.3 4.7 3.2 * = Impact significantly larger than “Own” as 0.05 level. † = Own significantly larger than Flat at 0.05 level.
Quality ratings
The qualitative results reported in Table 2 were obtained by averaging the ratings of the
three judges.15 The ratings were found to have a reliability of 0.7516 (Rust and Cooil 1994),
which is above the 0.7 benchmark often used in market research (Boulding et al. 1993).
The sessions in the “Impact” condition were judged to have a larger overall contribution,
more “star” ideas (i.e., very good ideas), more breadth, depth, and to have ideas that on average
were more novel, thought-provoking and interactive (interactivity is defined here as the degree to
which a “son-idea” builds on its “father-idea” and improves upon it).
15 All ratings, except for the number of star ideas, are on a 10-point scale. 16 For each measure and for each judge, the ratings were normalized to range between 0 and 1. Then ratings were classified into three intervals: [0;1/3[, [1/3;2/3[, and [2/3;1].
27

Hence the results suggest that incentives do have the capacity to improve idea generation,
and are consistent with the hypothesis formulated in Section 2.
Reconciling the results with the social psychology literature
As was mentioned in the introduction, the social psychology literature seems to predict
that incentives are more likely to hurt idea generation. This prediction relies in great part on the
observation that idea generation is not a task in which there exist easy algorithmic solutions,
achievable by the straightforward application of certain operations. McGraw (1978) contrasts
tasks such that the path to a solution is “well mapped and straightforward” with tasks such that
this path is more complicated and obscure. He argues that incentives are likely not to help with
this second type of tasks, but notes that “it is nonetheless possible for reward to facilitate per-
formance on such problems in the case where the algorithm (leading to a solution) is made obvi-
ous” (p. 54). Perhaps such facilitation might have happened in the present experiment. In particu-
lar, the structure of the ideation game might have made the mental steps leading to new ideas
more transparent, allowing the participants to approach the task in a more “algorithmic” manner.
Incentives and motivation
Table 2 indicates that fewer participants in the “Flat” condition submitted at least one
idea. Further analysis suggests that this might be due to a lower level of motivation of these par-
ticipants. More precisely, 100% of the participants who submitted at least one unique idea in the
“Flat” condition did so in the first 30 minutes after signing up, versus 65% for the “Impact” con-
dition and 64% for the “Own” condition. In particular, 18% (respectively 21%) of the partici-
pants who submitted at least one idea in the “Impact” condition (respectively the “Own” condi-
tion) did so more than three hours after signing up. This is consistent with the hypothesis that all
28
three conditions faced the same distribution of participants, but that when incentives were pre-
sent, participants tried harder to generate ideas and did not give up as easily.
Dynamics of the sessions
The study of the dynamics of the ideation sessions, although not directly testing the theo-
retical predictions from Section 2, provides additional insight on the influence of incentives on
the idea generation process. These exploratory analyses also provide direction for future re-
search.
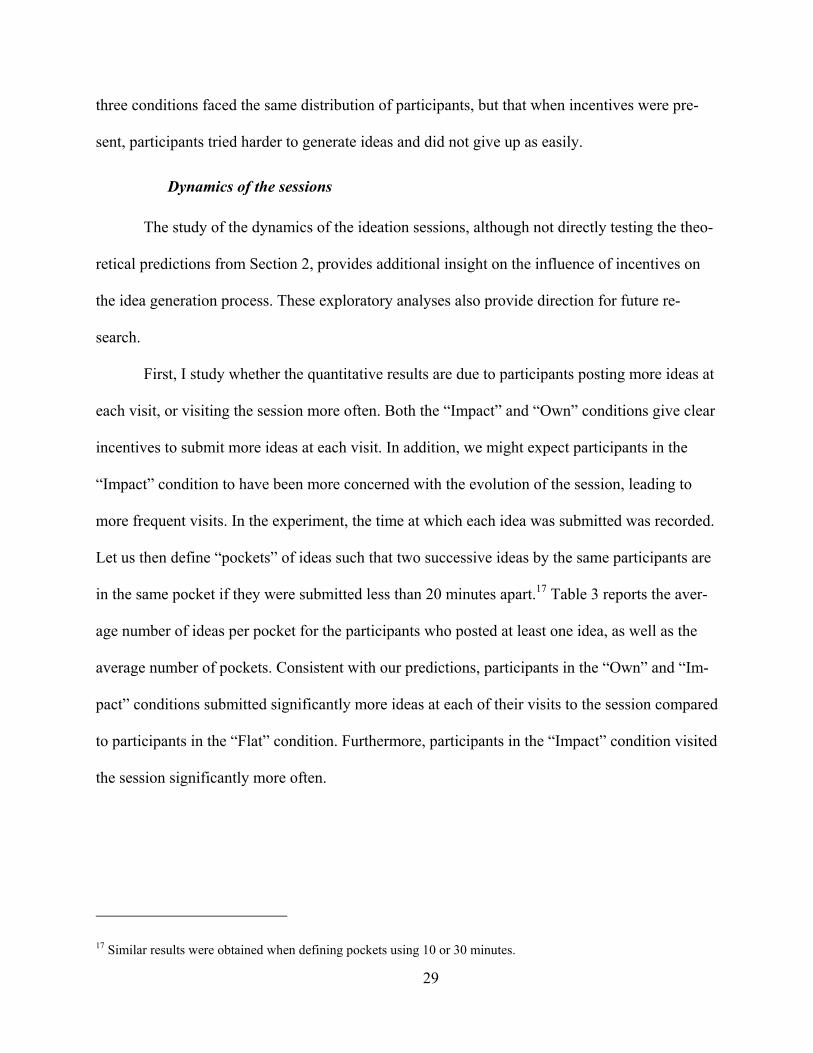
First, I study whether the quantitative results are due to participants posting more ideas at
each visit, or visiting the session more often. Both the “Impact” and “Own” conditions give clear
incentives to submit more ideas at each visit. In addition, we might expect participants in the
“Impact” condition to have been more concerned with the evolution of the session, leading to
more frequent visits. In the experiment, the time at which each idea was submitted was recorded.
Let us then define “pockets” of ideas such that two successive ideas by the same participants are
in the same pocket if they were submitted less than 20 minutes apart.17 reports the aver-
age number of ideas per pocket for the participants who posted at least one idea, as well as the
average number of pockets. Consistent with our predictions, participants in the “Own” and “Im-
pact” conditions submitted significantly more ideas at each of their visits to the session compared
to participants in the “Flat” condition. Furthermore, participants in the “Impact” condition visited
the session significantly more often.
Table 3
17 Similar results were obtained when defining pockets using 10 or 30 minutes.
29
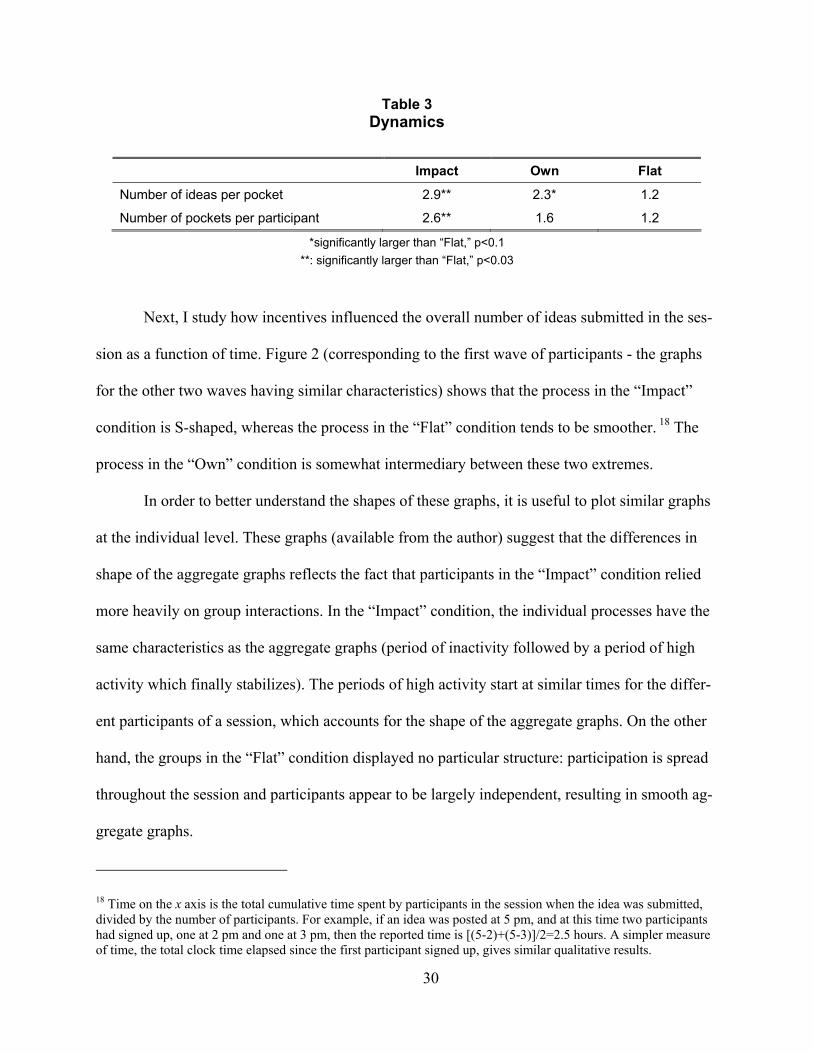
Table 3 Dynamics
Impact Own Flat
Number of ideas per pocket 2.9** 2.3* 1.2
Number of pockets per participant 2.6** 1.6 1.2
*significantly larger than “Flat,” p<0.1 **: significantly larger than “Flat,” p<0.03
Next, I study how incentives influenced the overall number of ideas submitted in the ses-
sion as a function of time. Figure 2 (corresponding to the first wave of participants - the graphs
for the other two waves having similar characteristics) shows that the process in the “Impact”
condition is S-shaped, whereas the process in the “Flat” condition tends to be smoother. 18 The
process in the “Own” condition is somewhat intermediary between these two extremes.
In order to better understand the shapes of these graphs, it is useful to plot similar graphs
at the individual level. These graphs (available from the author) suggest that the differences in
shape of the aggregate graphs reflects the fact that participants in the “Impact” condition relied
more heavily on group interactions. In the “Impact” condition, the individual processes have the
same characteristics as the aggregate graphs (period of inactivity followed by a period of high
activity which finally stabilizes). The periods of high activity start at similar times for the differ-
ent participants of a session, which accounts for the shape of the aggregate graphs. On the other
hand, the groups in the “Flat” condition displayed no particular structure: participation is spread
throughout the session and participants appear to be largely independent, resulting in smooth ag-
gregate graphs.
18 Time on the x axis is the total cumulative time spent by participants in the session when the idea was submitted, divided by the number of participants. For example, if an idea was posted at 5 pm, and at this time two participants had signed up, one at 2 pm and one at 3 pm, then the reported time is [(5-2)+(5-3)]/2=2.5 hours. A simpler measure of time, the total clock time elapsed since the first participant signed up, gives similar qualitative results.
30
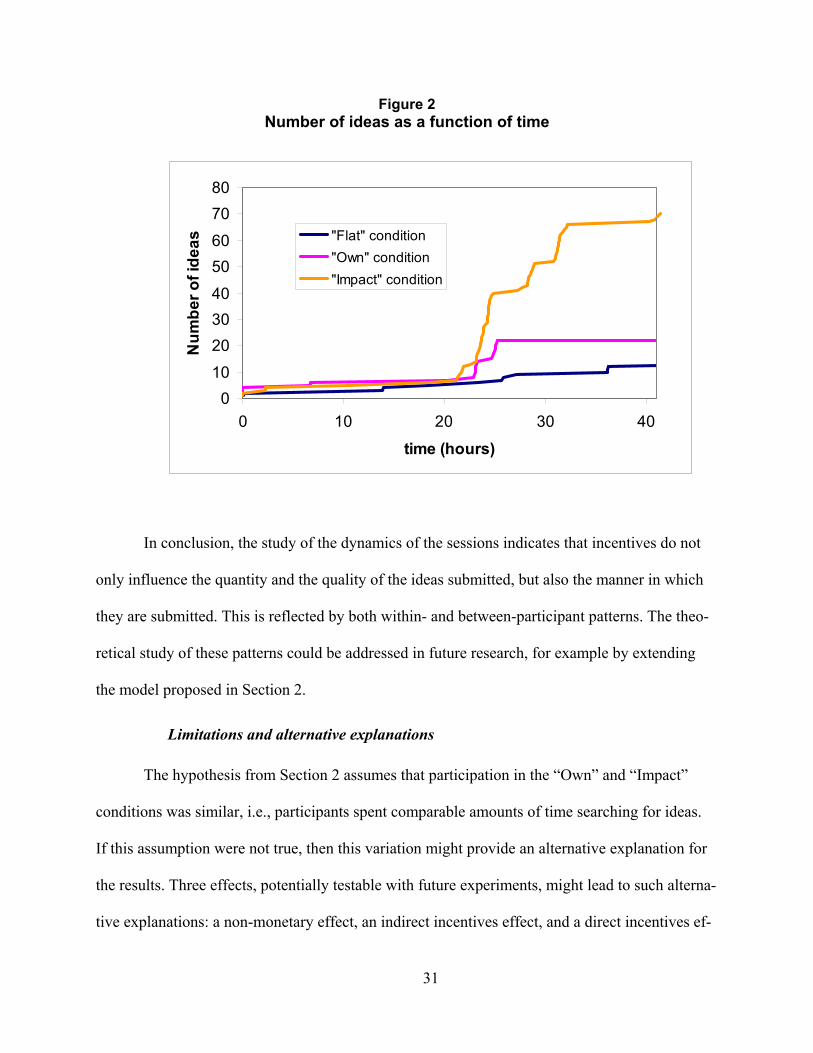
Figure 2 Number of ideas as a function of time
010
203040
5060
7080
0 10 20 30 40
time (hours)
Num
ber o
f ide
as "Flat" condition"Own" condition"Impact" condition
In conclusion, the study of the dynamics of the sessions indicates that incentives do not
only influence the quantity and the quality of the ideas submitted, but also the manner in which
they are submitted. This is reflected by both within- and between-participant patterns. The theo-
retical study of these patterns could be addressed in future research, for example by extending
the model proposed in Section 2.
Limitations and alternative explanations
The hypothesis from Section 2 assumes that participation in the “Own” and “Impact”
conditions was similar, i.e., participants spent comparable amounts of time searching for ideas.
If this assumption were not true, then this variation might provide an alternative explanation for
the results. Three effects, potentially testable with future experiments, might lead to such alterna-
tive explanations: a non-monetary effect, an indirect incentives effect, and a direct incentives ef-
31
fect. A non-monetary effect might attribute higher participation in the “Impact” condition to a
greater level of stimulation, resulting from richer interactions between participants. The indirect
incentives effect is based on the hypothesis that, if ideas in the “Impact” condition were more
inspiring, participants would be able to generate more ideas in the same amount of time, making
participation more attractive. The direct incentives effect hypothesizes that the expected payoff
per idea was perceived as higher in the “Impact” condition. In particular, although the monetary
value of points was calibrated to equate the expected payoff per idea in the two conditions, the
calibration was based on a pretest using a different topic, and did not take into account partici-
pants’ subjective beliefs.
The non-monetary and indirect incentive effects would also advocate the use of impact as
an incentive, but for different theoretical reasons. Further experiments could identify their mag-
nitudes, providing direction for future theoretical research. For example, one might control the
amount of time spent by the participants on the task by running the sessions in a laboratory. The
third effect would make the comparison of the “Impact” and “Own” conditions problematic and
cast some doubt on the validity of rewarding participants for their impact. In order to address this
concern, another experiment could be run, in which the number of points earned by an idea in the
“Impact” condition is bounded. For example, if ideas in this condition score points only for the
first five subsequent ideas in the tree, and if the monetary value of a point is five times higher in
the “Own” condition, then the expected payoff per idea is objectively lower in the “Impact” con-
dition than it is in the “Own” condition.
5. Summary and Future Research
In this paper, I propose a quantitative framework for the study of a mostly qualitative
topic, idea generation, with a focus on the effect of incentives. I first derive an analytical model
32
of the idea generation process. Based on this model, I identify conditions under which rewarding
participants for their individual contributions induces desirable actions, and other conditions un-
der which it does not. In the latter case, performance can be improved by rewarding each partici-
pant for the impact of his or her contribution. I then develop an incentive compatible “ideation
game,” which allows implementing the insights from the theoretical analysis and testing some of
the predictions. Finally, I show experimentally that incentives have the capability to improve
idea generation, in a manner consistent with the theory.
Several opportunities for future research can be identified in addition to the ones men-
tioned throughout the paper. First, it might be interesting to extend the theoretical model and take
into account other dimensions of idea generation than the choice of which approach to follow.
Second, it might be useful to generalize the experimental findings using different topics, and
other (potentially subjective) measures of the contribution and impact of the participants. Third,
although the experimental findings in this paper are consistent with the theoretical prediction,
they do not test the causal relationship between the speed of diminishing returns and the validity
of rewarding impact, which could be addressed by additional experiments.
Finally, it would be interesting to identify conditions under which incentives are more
likely to enhance or inhibit idea generation, as well as conditions under which the ideation game
presented here is more or less likely to enhance participants’ creativity. More generally, future
research might examine how the experimental findings reported in this paper relate to classic re-
sults in social psychology. In a different paper (author 2003), I attempt to address these ques-
tions using major recent work in idea generation (Goldenberg et al. 1999a, Goldenberg et al.
1999b, Goldenberg and Mazursky 2002). In particular, there exist at least two opposing views
regarding which cognitive skills should be encouraged in ideation sessions. The first view is that
33
participants should be induced to think in a random fashion. This widely held belief, based on the
assumption that anarchy of thought increases the probability of creative ideas, has led to the de-
velopment of ideation tools such as brainstorming (Osborn 1957), Synectics (Prince 1970), and
lateral thinking (De Bono 1970). In contrast, recent papers suggest that structure, and not ran-
domness, is the key to creativity (Goldenberg et al. 1999a). This structured view, according to
which creativity can be achieved through the identification and application of some regularities
in previous creative output, has led to systematic approaches to idea generation. Two important
examples are inventive templates (Goldenberg et al. 1999b, Goldenberg and Mazursky 2002),
and TRIZ (Altshuller 2000). In author 2003, I try to shed some light on the apparent contradic-
tion between these two views, and to identify conditions under which each one of them is more
likely to be valid. I then show how this analysis applies to the questions mentioned above.
34
References
Altshuller, Genrich (2000), The Innovation Algorithm, Technical Innovation Center, Inc., Worcester, MA.
Author (2003), “Bounded rationality models of idea generation”, working paper.
Baker, G., R. Gibbons and K. Murphy (1998), “Relational Contracts and the Theory of the Firm”, mimeo, MIT.
Bellman, R. (1961), Adaptive Control Process: A guided Tour, Princeton University Press.
Boulding, William, Richard Staelin, Valarie Zeithaml, and Ajay Kalra (1993), “A Dynamic Process Model of Service Quality: From Expectations to Behavioral Intentions”, Journal of Marketing Research, 30 (February), 7-27.
Collaros, Panayiota A., and Lynn R. Anderson (1969), “Effect of Perceived Expertness Upon Creativity Of Members of Brainstorming Groups”, Journal of Applied Psychology, Vol. 53, No. 2, 159-163
Dahan, Ely, and John R. Hauser (2001), “Product Development – Managing a Dispersed Proc-ess”, in the Handbook of Marketing, Barton Weitz and Robin Wensley, Editors.
De Bono, Edward (1970), Lateral thinking: a textbook of creativity, Ward Lock Educational, London.
Diehl, Michael, and Wolfgang Stroebe (1987), “Productivity Loss in Brainstorming Groups: Toward the Solution of a Riddle”, Journal of Personality and Applied Psychology, Vol. 53, No.3, 497-509
Gallupe, Brent R., Lana M. Bastianutti, and William H. Cooper (1991), “Unblocking Brain-storms”, Journal of Applied Psychology, vol. 76, No. 1, 137-142
Gelman, Andrew B., John S. Carlin, Hal S. Stern, and Donald B. Rubin (1995), Bayesian Data Analysis, Chapman & Hall/CRC
Goldenberg, J., D. Mazursky, and S.Solomon (1999a), “Creative Sparks”, Science, 285 1495-1496.
_______, _______, _______ (1999b), “Toward identifying the inventive templates of new prod-ucts: A channeled ideation approach, Journal of Marketing Research, 36 (May) 200-210.
_______, _______ (2002), Creativity in product innovation, Cambridge University Press.
Greene, William H. (2000), Econometric Analysis, Prenctice Hall International, Inc.
35
Harkins, Stephen G., and Richard E. Petty (1982), “Effects of Task Difficulty and Task Unique-ness on Social Loafing”, Journal of Personality and Applied Psychology, Vol. 43, No.6, 1214-1229
Holmstrom, Bengt (1982), “Moral hazard in teams”, Bell Journal of Economics, 13(2): 324-340
Kerr, Norbert L., and Steven E. Bruun (1983), “Dispensability of Member Effort and Group Mo-tivation Losses: Free-Rider Effecs”, Journal of Personality and Applied Psychology, Vol. 44, No.1, 78-94
King, Jean (1987), “A Review of Bibliometric and Other Science Indicators and Their Role in Research Evaluation”, Journal of Information Science, 13, 261-276
Kuhn, Thomas S. (1977), “The Essential Tension: Tradition and Innovation in Scientific Re-search”, In T. S. Kuhn (Ed.), The essential tension: Selected readings in scientific tradi-tion and change, Chicago, IL.: University of Chicago Press.
Knez, Marc, and Duncan Simester (2001), “Firm-Wide Incentives and Mutual Monitoring at Continental Airlines”, Journal of Labor Economics, vol. 19, no. 4, 743-772
Lamm, Helmut and Gisela Trommsdorff (1973), “Group versus individual performance on tasks requiring ideational proficiency (brainstorming): A review”, European Journal of Social Psychology, 3 (4), 361-388
Levin, J. (2003), “Relational Incentive Contracts”, American Economic Review, forthcoming,
McCullers, J.C. (1978), “Issues in learning and motivation”, in M.R. Lepper & D. Greene (Eds.), The hidden costs of reward (pp. 5-18), Hillsdale, NJ: Erlbaum
McGraw, K.O. (1978), “The detrimental effects of reward on performance: A literature review and a prediction model”, in M.R. Lepper & D. Greene (Eds.), The hidden costs of reward (pp. 33-60), Hillsdale, NJ: Erlbaum
Nunamaker, Jay F., Jr., Lynda M. Applegate, and Benn R. Konsynski (1987), “Facilitating group creativity: Experience with a group decision support system”, Journal of Management In-formation Systems, Vol. 3 No. 4 (Spring).
Osborn, A.F. (1957), Applied Imagination, (Rev. Ed.), New York: Scribner
Prince, George M. (1970), The Practice of Creativity; a manual for dynamic group problem solving, New York, Harper & Row.
Rust, Roland, and Bruce Cooil (1994), “Reliability Measures for Qualitative Data: Theory and Implications”, Journal of Marketing Research, vol. XXXI (February 1994), 1-14.
Simonton, Dean K. (1988), Scientific Genius: A Psychology of Science, Cambridge University Press
36
Spence, K.W. (1956), Behavior theory and conditioning, New Haven: Yale University Press.
Varian, Hal R. (1990), “Monitoring Agents with Other Agents”, Journal of Institutional and Theoretical Economics (JITE), Vol. 146, 153-174
Von Hippel, Eric, and Ralph Katz (2002), “Shifting Innovation to Users via Toolkits”, Manage-ment Science, vol. 48, No.7, pp 821-833.
Williams, Kipling, Stephen Harkins, and Bibb Latané (1981), “Identifiability as a Deterrent to Social Loafing: Two Cheering Experiments”, Journal of Personality and Applied Psy-chology, Vol. 40, No.2, 303-311
Zajonc, Robert B. (1965), “Social Facilitation”, Science, Vol. 149, No. 16 (July), 269-274
37

Appendix 1: proofs of the propositions
Let us define (we define similar quantities for B): ST(A)= the expected payoff from pe-riod 1 obtained by choosing approach A in period 1; the ex-pected payoff from period 2 obtained by playing A in period 2 given that A was played in period 1 and was successful; the expected payoff from period 2 obtained by playing A in period 2 given that A was played in period 1 and was unsuccessful; LT(A)= +
ANp pAA ˆ.ˆα
.(1ˆ +Np AAα )1/()1ˆ ++= AAAA NNpS
)1/(ˆ.ˆ += AAANp
A NNpF AAα
ST(B)},.max{Sp AAˆST(B)},).max{Fp(1 AAˆ− the expected payoff from period 2, calculated at the beginning of period
1, if A is played in period 1. Proof of Proposition 1a: First, note that NA and NB are restricted to integer values, and that ∈Ap̂ [1/NA,(NA-1)/NA] and ∈Bp̂[1/NB,(NB-1)/NB]. Let us first show that for all , NA, for all α<1, for all close enough to such that
Bp̂ Ap̂
Bp̂
Ap̂ < , ST(B)≤ST(A)⇒ NB≥NA. ST(B) is decreasing in NB. When = , ST(B)>ST(A) if NB=NA-1. By continuity, this is also true for close enough to such that < , hence ST(B)≤ST(A)
Bp̂ Ap̂ Bp̂
Ap̂ Bp̂ Ap̂ Bp̂⇒
NB≥NA. Then we have ST(B)≤ST(A) SB≤SA. To see this, note that SB≤SA
⇒⇔ )1)1ˆ(.ˆ ++ BBB
Np NpBBα (N ≤ )1()1ˆ(.ˆ ++ AAA
Np NNpAAα ⇔ )1()ˆ1(.ˆ. ˆˆ +−+ BBNp
BNp Npp BBBB αα ≤ + A
Np pAA ˆ.ˆα)1()ˆ1(.ˆ +− AA
Np NpAAα ⇐ )1()ˆ1(. +− BB NpBˆ NpBα ≤ )1( +AN)ˆ1.(ˆ − ANp pAAα and ST(B)≤ST(A)
⇐ ST(B)≤ST(A), ≤ , 1 <1BB Np̂α AANp̂α Bp̂− Ap̂− , NB≥NA ⇐ ST(B)≤ST(A), > . Bp̂ Ap̂Then, when ST(B)≤ST(A), there are 2 cases:
• SA≤ST(B). This implies SB≤SA≤ST(B)≤ST(A). Then LT(A)≥ST(B) and LT(B)=ST(A) and so ST(B)+LT(B)=ST(B)+ST(A)≤ST(A)+LT(A).
• SA>ST(B). Then LT(A)≥ .SA+(1- ).ST(B) and LT(B)= .max{SB,ST(A)}+(1-).ST(A)
Ap̂ Ap̂ Bp̂
Bp̂(because FB<ST(B)≤ST(A)). Then ST(A)+LT(A)≥ST(B)+LT(B) if ST(A)+ .SA+(1-
).ST(B)≥ST(B)+ Ap̂
Ap̂
Bp̂ .max{SB,ST(A)}+(1- ).ST(A) .( SA-ST(B)) ≥ .(max{SB,ST(A)}- ST(A)Bp̂ ⇔ Ap̂ Bp̂ ) ⇔ Ap̂ (SA-ST(B))≥ .(SB-ST(A)) (because SA>ST(B))Bp̂ ⇔ Ap̂ .[ Bp̂.Np
AAAp NNp BBA )1()1ˆ ˆˆ αα −++NA (.1+ ]≥
Np̂ ˆBp̂ .[ )1()1ˆ(.1ˆ +++
BBBNp NNpBBα ]- ApAA ˆ.α ⇔ ]ˆ)1()1ˆ(..[ˆ. BAAAA
Np pNNppAA +++αα ≥ p̂ ]ˆ)1()1ˆ(..[ˆ. ABBBB
N pNNppBB +++αα ⇐ BAAA pNNp ˆ)1()1ˆ(. +++α ≥ )1()1ˆ(. ++ BBB NNpα +(because ST(B)≤ST(A)) ≥Ap̂ ⇔ Ap̂Bp̂ − ])1()1ˆ()1()1ˆ(.[ ++−++ AAABBB NNpNNpα
⇐ )1()1ˆ( ++ BBB NNp ≤ )1()1ˆ( ++ AAA NNp or{ )1()1ˆ()1()1ˆ( ++>++ AAABBB NNpNNp and )1()1ˆ ++ AAA NNp( - ≥Ap̂ )1()1ˆ( ++ BBB NNp - }, which is satisfied because Bp̂
38
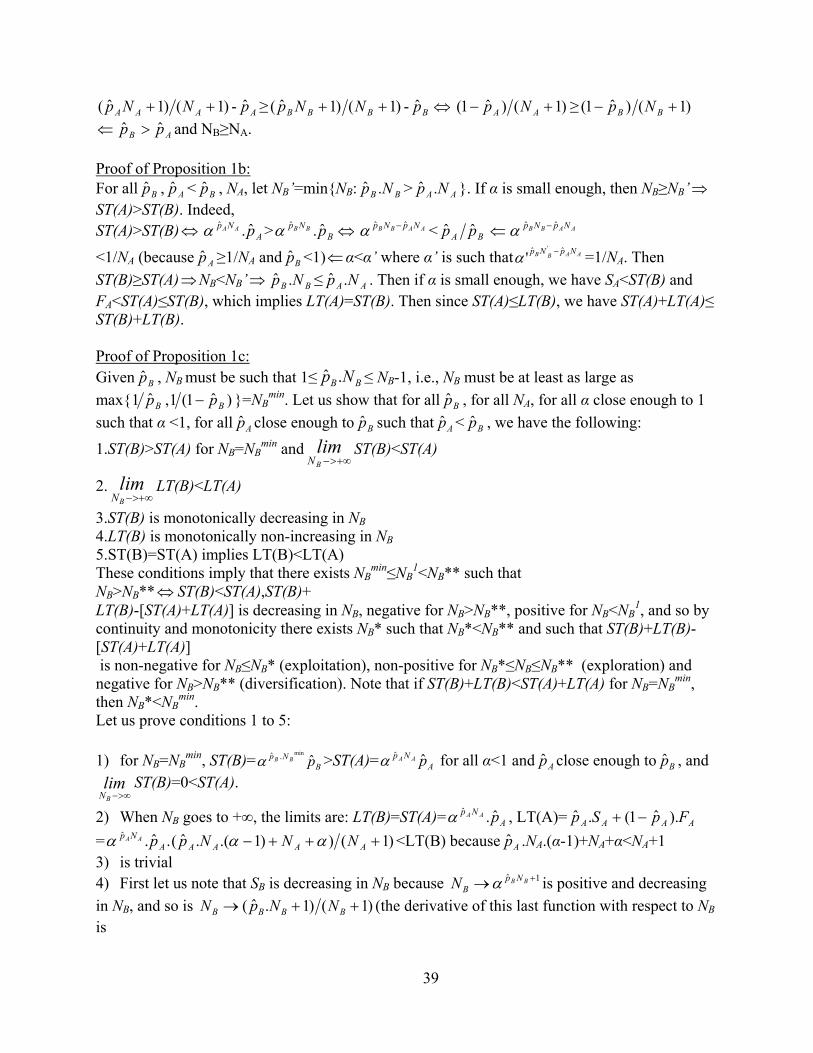
)1()1ˆ( ++ AAA NNp - ≥Ap̂ )1()1ˆ( ++ BBB NNp - Bp̂ ⇔ )1()ˆ1( +− AA Np ≥ )1()ˆ1( +− BB Np ⇐ AB pp ˆˆ > and NB≥NA. Proof of Proposition 1b: For all , < , NA, let NB’=min{NB: > }. If α is small enough, then NB≥NB’ Bp̂ Ap̂ Bp̂ BB Np .ˆ AA Np .ˆ ⇒ST(A)>ST(B). Indeed, ST(A)>ST(B) >⇔ A
Np pAA ˆ.ˆα BNp pBB ˆ.ˆα ⇔ AABB NpNp ˆˆ −α < BA pp ˆˆ ⇐ AABB NpNp ˆˆ −α
<1/NA (because ≥1/NA and <1)Ap̂ Bp̂ ⇐α<α’ where α’ is such that =1/NA. Then ST(B)≥ST(A) NB<NB’ ⇒ ≤ . Then if α is small enough, we have SA<ST(B) and FA<ST(A)≤ST(B), which implies LT(A)=ST(B). Then since ST(A)≤LT(B), we have ST(A)+LT(A)≤
AABB NpNp ˆˆ '
' −α⇒ Bp̂B N. ANAp .ˆ
ST(B)+LT(B). Proof of Proposition 1c: Given , NB must be such that 1≤ ≤ NB-1, i.e., NB must be at least as large as max{
Bp̂ BB Np .ˆ)ˆ1(1, Bp−ˆ Bp1 }=NB
min. Let us show that for all , for all NA, for all α close enough to 1 such that α <1, for all close enough to such that < , we have the following:
Bp̂
Ap̂Ap̂ Bp̂ Bp̂
1.ST(B)>ST(A) for NB=NBmin and ST(B)<ST(A) lim
BN +∞>−
2. LT(B)<LT(A) limBN +∞>−
3.ST(B) is monotonically decreasing in NB 4.LT(B) is monotonically non-increasing in NB 5.ST(B)=ST(A) implies LT(B)<LT(A) These conditions imply that there exists NB
min≤NB1<NB** such that
NB>NB** ST(B)<ST(A),ST(B)+ ⇔LT(B)-[ST(A)+LT(A)] is decreasing in NB, negative for NB>NB**, positive for NB<NB
1, and so by continuity and monotonicity there exists NB* such that NB*<NB** and such that ST(B)+LT(B)-[ST(A)+LT(A)] is non-negative for NB≤NB* (exploitation), non-positive for NB*≤NB≤NB** (exploration) and negative for NB>NB** (diversification). Note that if ST(B)+LT(B)<ST(A)+LT(A) for NB=NB
min, then NB*<NB
min. Let us prove conditions 1 to 5:
1) for NB=NBmin, ST(B)= >ST(A)= for all α<1 and close enough to , and B
Np pBB ˆmin.ˆα A
Np pAA ˆˆα Ap̂ Bp̂limBN ∞>−
ST(B)=0<ST(A).
2) When NB goes to +∞, the limits are: LT(B)=ST(A)= , LT(A)= ANp pAA ˆ.ˆα AAAA FpSp ).ˆ1(.ˆ −+
= )1())1.(.ˆ(.ˆ.ˆ +++− AAAAANp NNNppAA ααα <LT(B) because .NA.(α-1)+NA+α<NA+1 Ap̂
3) is trivial 4) First let us note that SB is decreasing in NB because is positive and decreasing in NB, and so is
1ˆ +→ BB NpBN α
)1()1.ˆ( ++→ BBBB NNpN (the derivative of this last function with respect to NB is
39

2)1()1ˆ( +− BB Np ). Next we have: )ˆ).1(( BLBBBB pNNFS αα −=>⇔< . If
α> )1.ˆ(.ˆ +ABAB NpNp
then NA< , in which case NB>LBN ⇒L
BN )1(ˆ.ˆ += BBBNp
B NNpF BBα < <ST(A)= BNp p
LBB ˆ.ˆα A
Np pAA ˆ.ˆαif close enough to . Ap̂ Bp̂Then we have 4 cases: • ST(A)>FB>SB: LT(B) is constant in NB • ST(A)>SB>FB: LT(B) is constant in NB • SB>ST(A)>FB: LT(B)= ).ST(A)p(1.Sp BBB ˆˆ −+ is decreasing in NB because SB is • SB>FB>ST(A): LT(B)= BBBB FpSp ).ˆ1(.ˆ −+ = )1())ˆ1ˆ..((.ˆ.ˆ ++−+ BBBBB
Np NppNpBB ααα and
BNBLT ∂∂ )( =
)ˆ1ˆ..(ˆ.1
))ˆ1ˆ..(.(ˆ.)1(
)1.().ln(.ˆ ˆ
2
ˆˆ
BBBB
Np
BBBBB
NpB
NpB ppp
NppNp
NNp BBBBBB
−++
++−++
−+αααα
ααα
which is of the same sign as: )1())ˆ1ˆ..(().1)1).(ln(.ˆ +( +−+−+ BBBBBB NppNNp ααα + )ˆ1ˆ.( BB pp −+α which is equal to 0 when α=1, and which is of the same sign, when α close to 1
(using a Taylor’s series expansion), as BBBBBB pNNpNp ˆ.2)1()ˆ1(.ˆ −+++− ≤-1 − +Bp̂.2 )1+BN(BN
Bp̂<0. So LT(B) is non-increasing in NB if α close enough to 1 and close
enough to . Ap̂
5) The proof is similar to that of proposition 1: ST(B)=ST(A)⇒ NB>NA and SB<SA. Then if α close
enough to 1, SA>ST(A)=ST(B) for all ∈Ap̂
Ap̂−
[1/NA,(NA-1)/NA], and
ST(A)+LT(A)>ST(B)+LT(B) > ⇔ Bp̂
])1()1ˆ()1()1ˆ(.[ ++−++ AAABBB NNpNNpα which is satisfied for α<1 and . AB pp ˆˆ >
Proof of proposition 2: Let us assume that if both players find an idea using the same approach in a given period, then we determine randomly which player submits his or her idea first. This is equivalent to having player’s expected payoff equal to (αn+ αn+1 )/(2p2)+ αn.p.(1-p) if n ideas have been submitted us-ing the approach at the beginning of the period and if the probability of success is p. Recall that and are respectively in [1/NA,(NA-1)/NA] and [1/NB,(NB-1)/NB]. Since the lower (resp. upper) bounds of the intervals above are strictly positive (resp. strictly smaller than 1), there ex-ists α small enough such that in period 2 both players will play the approach with the smallest number of successes so far (no matter what the expected probabilities are, they cannot counter-balance the effect of the discount rate). In the special case in which the two approaches have the same number of successes, then players will choose different approaches if is close enough to (because choosing the same approach leads to much lower payoffs if α is small enough).
Ap̂
B
Bp̂
Ap̂p̂
Let us first consider the case NA>NB. Then if is close enough to , nSA>nSB. Let us show that if α is small enough, then the only SPE is for both players to play B in period 1, and this is also socially optimal:
Ap̂ Bp̂
40

• BR(B)=B: ),())1.((.)(.2)( 21 BBLTppEpE BBn
Bnn SBSBSB +−++ + ααα > ),(ˆ. BALTpA
nSA +αfor α small enough if (if α is small enough then any term discounted by more than is negli-gible): ST(B,B)+E((1-pB)2).ST(B,B|nFB+2)> (
sBnα)1|,().ˆ1 +− FBB nBBSTp where
ST(B,B)= ( + 2/)().1 2BpEα+
))1.(( BB ppE − is the expected instantaneous payoff divided by if players play (B,B) and ST(B,B|nSF+1) is the similar quantity if both players play (B,B) after a failure in B. This inequal-ity holds because ST(B,B)+E[(1-pB)2].ST(B,B|nFB+2)>ST(B,B)>ST(B,B|nFB+1)> (
sBnα
| )1,().ˆ1 +− FBnBB BSTp • BR(A)=B: as above, this is true for α small enough if )1|,().ˆ1(ˆ +−+ FBBB nBBSTpp
>0+ ST(B,B) which holds because BFBBB pnBBSTpp ˆ)1|,().ˆ1(ˆ >+−+ >ST(B,B)
• (B,B) is socially optimal if α small enough because it is more likely that at least one idea will be found using B if both players play B in period 1. The same argument applies to the case NA≤NB, in which case nSA<nSB if is close enough to . Ap̂ Bp̂ Proof of proposition 3: Let us consider the subgame perfect equilibrium of the game that consists in choosing which ap-proach to play at t=1 and t=2. In period 2, players each play the approach with the highest expected probability of success. In period 1: If player 2 plays A at t=1, then player 1 gets: By playing A:
BABA
ASAAB
A
ASAA ppEp
Nn
ppEpNn
pEp ˆ).)1((}ˆ,21
max{)).1.((2}ˆ,22
max{).(ˆ 22 −+++
−+++
+
By playing B: }1
,11
max{)ˆ1.(ˆ}11
,11
max{ˆ.ˆˆ++
+−+
++
++
+B
BS
A
ASBA
B
BS
A
ASBAB N
nNn
ppNn
Nn
ppp
}1
,1
max{).ˆ1).(ˆ1(11
.ˆ).ˆ1(++
−−+++
−+B
BS
A
ASBA
B
BSBA N
nN
npp
Nn
pp
If player 2 plays B at t=1, then player 1 gets:
By playing A: }1
,11
max{).ˆ1.(ˆ}11
,11
max{.ˆ.ˆˆ++
+−+
++
++
+B
BS
A
ASBA
B
BS
A
ASBAA N
nNn
ppNn
Nn
ppp
}1
,1
max{).ˆ1).(ˆ1(11
.ˆ).ˆ1(++
−−+++
−+B
BS
A
ASBA
B
BSBA N
nN
npp
Nn
pp
By playing B:
2,ˆmax{).1((}
21,ˆmax{)).1.((2
22).(ˆ 2
+−+
++
−+++
+B
BSA
2B
B
BSABB
B
BSBB N
np)pENnpppE
NnpEp }
Let us consider the following condition: <(nAS+1)/(NA+1) (a). Bp̂For all < and NA such that (a) is satisfied, if NB is large enough (the beliefs on bandit B are stable enough), then we have that the following conditions are sufficient for both players to choose B at t=1 in any SPE of the game and for it not to be socially optimal:
Ap̂ Bp̂
41
• BR(B)=B: <−++++ BAAASAA ppNnpp ˆ).ˆ1()1()1(.ˆˆ BB pp ˆˆ + AB pp ˆˆ −⇔ >]ˆ)1()1(.[ˆ BAASA pNnp −++ (b)
• BR(A)=B: +Bp̂ )1()1.ˆ( ++ AASA Nnp + >− BA p).p ˆˆ(1 +Ap̂ )2()2().( 2 ++ AASA NnpE +
Bp̂ApE ).)1(( 2−+AASBAA NnpppE })2()1(,ˆ)).1.((.2 ++− max{ (1)
If >(nAS+1)/(NA+2) (c) then (1) becomes: - >Bp̂ Bp̂ Ap̂ )2()2.ˆ()( 2 ++ AAAA NNppE BA ppE ˆ).( 2− BAAAAA ppNNpp ˆ.ˆ)1()1ˆ(.ˆ +++− (f)
If <(nAS+1)/(NA+2) (c’) then (1) becomes: +Bp̂ Bp̂ BAAASA ppNnp ˆ).ˆ1()1()1(.ˆ −+++ > + Ap̂
BAAASAAAASA ppENnppENnpE ˆ).)1(()2()1()).1((2)2()2().( 22 −+++−+++ AB pp ˆˆ −⇔ >
)21
++
22).(()
11
21.(ˆ)ˆ
21).(( 22 −
++
+++
−++
+−++
−A
AS
A
ASA
A
AS
A
ASAB
A
ASAA N
nNnpE
Nn
Nnpp
NnppE
The right-hand side is smaller than ]ˆ)2()1.[(ˆ BAASA pNnp −++ because )11
21.(ˆ
++
−++
A
AS
A
ASA N
nNnp
+ )21
22).(( 2
++
−++
A
AS
A
ASA N
nNnpE =
2)(
)2).(1(1.ˆ
2
++
+++
−A
A
AA
ASA N
pENN
np = )1
1.ˆ.ˆ)(.(
21 2
++
−+ A
AAAA
A NNpppE
N
=0 because )1()ˆ1.(ˆˆ)( 22 +−+= AAAAA NppppE = )1()1.ˆ(.ˆ ++ AAAA NNpp (Var(pA)= )1()ˆ1.(ˆ +− AAA Npp ). So the condition holds if ]ˆ)2()1(.[ˆ BAASA pNnp −++ < (e) AB pp ˆˆ −
• A-B socially better than B-B: + +Ap̂ Bp̂ )1()1(.ˆ.2 ++ AASA Nnp + > BA pp ˆ).ˆ1.(2 − Bp̂.4]ˆ)1()1(.[ˆ.2ˆˆ BAASAAB pNnppp −++<−⇔ (d)
• We’ll also be using the following, when (c) is satisfied (A-A is socially better than B-B): BAAAAAA ppENNppEp ˆ)).(1.(2)2()2ˆ().(.2ˆ.2 22 −++++ Bp4.ˆ> ⇐ AB pp ˆˆ − <
]ˆ)2()2ˆ(.[ˆ 2BAAAA pNNpp −++ (d’)
Let us consider the following conditions: )ˆˆ()ˆ1()1()1ˆ(ˆ ABBAAAAB pppNNNpp −−<⇔++< (a)
ABAB
BABAABB
A
AAA pppp
pppNpppN
Nppˆˆ1ˆˆ
ˆˆˆ2ˆˆ)ˆ1
1.ˆ.(ˆ
−+−−−
>⇔−<−+
+ (b)
)ˆˆ()ˆ.21()2()1.ˆ(ˆ ABBAAAAB pppNNNpp −−>⇔++> (c) )pp()p2.1(N ABBA ˆˆˆ −−< (c’)
)ˆˆ.(21ˆˆˆ.2ˆˆ3ˆˆ]ˆ)1()1.ˆ.[(ˆ2
ABAB
BABAABBAAAA pppp
pppNpppNNpp−+−
−−<⇔−>−++ (d)
)p).(1pp()pp2.(p).p2.(1N]p2)(N2)Np(.[ppp 2
AAB
AB2AB
ABAAA2AAB ˆˆˆ
ˆˆˆˆˆˆˆˆˆ
+−−−−
<⇔−++<− (d’)
)ˆˆ(1ˆˆˆ.2ˆˆ23ˆˆ]ˆ)2()1.ˆ.[(ˆ
ABAB
BABAABBAAAA pppp
pppNpppNNpp−+−
−−>⇔−<−++ (e)
BAA
AAAB
2A
A
AA2AAB p.p
1N1Np
.pp).E(p2N
2.Np)E(ppp ˆˆ
ˆˆˆ
ˆˆˆ +
++
−−+
+>− (f)
42

(a),(b),(c),(d’), (f) as well as (a),(b),(c’),(d),(e) are sets of sufficient conditions. Let us consider such thatAp̂ )ˆ1()ˆˆ( BAB ppp −=− γ with γ small enough such that the numerators in (d) and (d’)
are positive. Let us look at the first set of conditions (a),(b),(c),(d’), (f): (f) imposes a lower bound on NA. (f) ⇔ + )ˆˆ).(ˆ.ˆˆ).(ˆˆ.( 2222
AAABABAABA pppEppppEppN +−−+−]ˆ2)(.2ˆˆ).()ˆ.ˆˆ).(ˆˆ.(3.[ 2222
AAAAABABAABA ppEpppEppppEppN +−+−−+−0))(ˆ.ˆˆ).(ˆ.(2 22 >−−+ ABABAB pEppppEp
+
Let NAmax=
)ˆ1.(.2ˆ.2
2
2
A
A
pp
+−
γγ
ˆ1).( BB p +−
be the value of NA defined by (d’). Then (f) and (d’) can be satisfied si-
multaneously when γ small enough if ( when γ→ 0): +
22 ˆ)( BA pp →E)ˆ1/()ˆˆ1.(ˆ.2 222
BBB pppp +−0ˆ10)ˆ.21).(ˆ1.(ˆ 2 >−⇔>−− BBBB pppp which is satisfied for <1. Bp̂ γ1 is the value of NA defined
by (a). Then (f) and (a) can be satisfied simultaneously when γ small enough if: + )ˆˆ1).(ˆ1( 2
BBB ppp +−−)ˆ.21).(ˆ1.(ˆ BBB ppp −− >0 >0 which is satisfied for <1. (b) and (a) can be satisfied si-
multaneously if:
⇔ 2ˆ1 Bp− Bp̂
AA pp ˆˆ−
B
BA
pp
ˆˆ−+
−
Bp̂2 B pp
1ˆˆ
−=
)1)1
−ˆˆ(ˆˆˆˆ(ˆ1
+−−−−
ABAB
ABB
ppppppp < )ˆˆ()ˆ1( ABB ppp −− which is satis-
fied. (c) and (a) can be satisfied simultaneously be-cause )Ap̂ˆ()ˆ.21( BB pp −− < )ˆˆ() ABB ppˆ1( p −− . (b) and (d’) can be satisfied simultaneously
if)
.2A
γˆ1.(2ˆ2
)ˆ11.(ˆ1 2
A
A
A
pp
pp
+−
<+
−γγ
γ which is satisfied for γ small enough if
⇔+
<+ 2
2
ˆ1ˆ2
ˆ111
B
B
B pp
p0ˆ >p 1ˆ. −Bp22 +B 21ˆ +−>⇐ Bp . (c) and (d’) can be satisfied simultane-
ously if: )ˆ1.(
ˆ.21B
B
pp
−−
γ<
)ˆ.22Apγ
1
2A
+−
.(ˆ2 p
γwhich is satisfied for γ small enough if
)ˆ1()ˆ.21( BB pp −− < )ˆ 2Bp+1(2
Bˆ2 p ⇔ 01ˆ.2ˆ 2 >−+ BB pp 21ˆ +−>⇐ Bp . So (a),(b),(c),(d’), (f) can be simultaneously satisfied if
21+−>ˆ Bp . Now let us look at the other set of sufficient conditions (a),(b),(c’),(d),(e): first, (c’) implies (a)
so we can ignore (a). Then (e) and (c’) can be satisfied simultaneously if:)ˆˆ(1ˆˆ
ˆ.2ˆˆ23
ABAB
BAB
ppppppp
−+−−− =
AB
B
ABAB
ABB
ppp
ppppppp
ˆˆˆ.21
)1ˆˆ()ˆˆ()1ˆˆ(2ˆ.21
−−
<−+−−−− , which holds. (e) and (d) can be satisfied simultaneously
if:)ˆˆ(21ˆˆ
ˆ.2ˆˆ3)ˆˆ(1ˆˆ
ˆ.2ˆˆ23
ABAB
BAB
ABAB
BAB
ppppppp
ppppppp
−+−−−
<−+−
−− )ˆ11.().ˆ1(
1)ˆ22)(ˆ1(
AB
AB
pppp
+−−−−
⇔γ
γ <
)ˆ12.().ˆ1()ˆ2)(ˆ1(AB
AB
pppp
+−−−
γγ which is satisfied for γ low enough if
BBB
B
pppp
ˆ121
)ˆ11).(ˆ1(ˆ21
+<
+−−
Bp̂⇔ >
43
)ˆ Bp(2.1− which is true. (b) and (d) can be satisfied simultaneously if
)ˆ12.(ˆ2
)ˆ11.(ˆ1
A
A
A
A
pp
pp
+−
<+
−γ
γγ
γ which is satisfied for γ low enough ifBB pp ˆ.211
1ˆ11
1+
<+
, which
holds. (b) and (c’) can be satisfied simultaneously if: )ˆ11.().ˆ1()ˆ1).(ˆ1(
AB
AB
pppp
+−−−
γγ <
)ˆ1.(ˆ21
B
B
pp
−−
γ
which is satisfied for γ low enough
if:)ˆ1(
ˆ.21ˆ11
1
B
B
B pp
p −−
<+
01ˆ.2ˆ 2 >+−−⇔ BB pp ⇔ 21ˆ +−<Bp .
So we have that (a),(b),(c’),(d),(e) can be satisfied if 21ˆ +−<Bp . So we have that for all , for all close enough to , there exists NAlow<NAhigh such that if NB is large enough, then NAlow <NA<NAhigh implies that both players choose B at t=1 in any SPE of the game but that this is not socially optimal. Finally, note that if NA<NAhigh then it is not socially optimal for both players to choose B.
Bp̂ Ap̂ Bp̂
Proof of proposition 4: At period t, player i receives from period (t-1), and ∑
≠
−ij
jtC).1( γ itC.γ directly from period t.
Then his or her expected discount payoff in period t is:
+∑ = [E ∑≠
−ij
jtC).1( γ ]]Cγ[δi
1jτtτ
tτ+
+∞
=
− δ.γ).(1.Cj
it ∑≠
−+
]∑ ∑∑+∞
= ≠
−+∞
=
− −+tτ ij
jτtτ
tτiτ
tτ ))C(δ(γ).(1).CδE[γ[γ ]=E [∑ ] ∑≠
+∞
=
− −+ij
jτtτ
iτtτ ]Cγ).(1.[γ[γδ
which is proportional to the moderator’s objective function only if γ=1/2, in which case the par-ticipant’s revenue from period t is proportional to the group’s contribution in period t.
Proof of proposition 5:
Under S’(1/2), Participant i’s payoff in period τ is proportional to π(i,τ)=Ciτ+
)],(~.[),(1
1tiCCt jj
ij tττ
τ
τλ −∑∑≠
−
=
= Ciτ+ = Ciτ+∑ τ
τ
τλ jij t
Ct ).),((1
1∑ ∑
≠
−
=
),(~.),(1
1tiCt j
ij tτ
τ
τλ∑∑≠
−
=
−≠ij
jC τ
),(~.),(1
1tiCt j
ij tτ
τ
τλ∑∑≠
−
=
− because∑ . The last term being a constant, the objectives are
aligned. Also if a proportional sharing rule
−
=
=1
11),(
τ
τλt
t
∑j
jtC.β is such that participants search in each pe-
riod, then the participants also search in each period under S’(1/2) with the same β (what matters
44

45
is the difference between the payoff obtained from searching and the payoff obtained from not
searching, which is unaffected), and the total payoff distributed is lower.