Embed Size (px)
Citation preview

IBM Tivoli Monitoring for Databases: Oracle
Reference GuideVersion 5.1.0
SC23-4724-00
���


IBM Tivoli Monitoring for Databases: Oracle
Reference GuideVersion 5.1.0
SC23-4724-00
���

NoteBefore using this information and the product it supports, read the information in Appendix F, “Notices” on page 525.
First Edition (September 2002)
This edition applies to version 5.1.0 of IBM Tivoli Monitoring for Databases: Oracle and to all subsequent releasesand modifications until otherwise indicated in new editions.
© Copyright International Business Machines Corporation 2002. All rights reserved. US Government UsersRestricted Rights – Use, duplication or disclosure restricted by GSA ADP Schedule Contract with IBM Corp.
Contents
About this guide . . . . . . . . . . viiWho should read this guide . . . . . . . . . viiWhat this guide contains . . . . . . . . . . viiPublications . . . . . . . . . . . . . . viii
IBM Tivoli Monitoring for Databases: Oraclelibrary . . . . . . . . . . . . . . . viiiRelated publications . . . . . . . . . . viiiAccessing softcopy publications . . . . . . . ixUsing the guide online . . . . . . . . . . ixViewing online help . . . . . . . . . . . xOrdering publications . . . . . . . . . . xProviding feedback about publications. . . . . x
Accessibility . . . . . . . . . . . . . . xContacting Customer Support . . . . . . . . xConventions used in this guide . . . . . . . . xi
Typeface conventions . . . . . . . . . . xiOperating System-dependent variables and paths xi
Chapter 1. Introduction . . . . . . . . 1Running Tivoli commands . . . . . . . . . . 1
Running Tivoli commands on Windows NT or2000 operating systems . . . . . . . . . . 2Running Tivoli commands on UNIX operatingsystems . . . . . . . . . . . . . . . 2Where to find additional information about shells 2Establishing the Tivoli environment within a shell 3
Setting the Tivoli environment on UNIXoperating systems . . . . . . . . . . 3Setting the Tivoli environment on Windows NToperating systems . . . . . . . . . . 3
Establishing the Tivoli environment on anendpoint. . . . . . . . . . . . . . . 3
Common attributes for IBM Tivoli Monitoring forDatabases: Oracle . . . . . . . . . . . . . 4
Chapter 2. Resource models . . . . . . 5Return codes . . . . . . . . . . . . . . 7Advanced Queue . . . . . . . . . . . . 15Archive Destinations . . . . . . . . . . . 35Checkpoints . . . . . . . . . . . . . . 50Data Warehouse Collector . . . . . . . . . 55Dump Space . . . . . . . . . . . . . . 61Extents . . . . . . . . . . . . . . . . 65Extents by Tablespace . . . . . . . . . . . 69Extents by User . . . . . . . . . . . . . 74Free Space Deficit . . . . . . . . . . . . 79Free Space Deficit By Tablespace . . . . . . . 84Free Space Deficit by User . . . . . . . . . 89Free Space Fragmentation . . . . . . . . . 94Free Space Fragmentation by Tablespace. . . . . 98Free Tablespace. . . . . . . . . . . . . 102Free Tablespace by Tablespace . . . . . . . . 106Full Table Scan . . . . . . . . . . . . . 110I/O. . . . . . . . . . . . . . . . . 115Job Queue . . . . . . . . . . . . . . 120
Listener State . . . . . . . . . . . . . 126Lock . . . . . . . . . . . . . . . . 133Log Event . . . . . . . . . . . . . . 147Maximum Extents . . . . . . . . . . . . 156Maximum Extents by Tablespace . . . . . . . 160Maximum Extents by User . . . . . . . . . 165Multi-Threaded Server . . . . . . . . . . 170Other Performance Monitors . . . . . . . . 179Other Storage . . . . . . . . . . . . . 196PGA . . . . . . . . . . . . . . . . 209Process State . . . . . . . . . . . . . 218RDBMS State . . . . . . . . . . . . . 223Recursive Calls . . . . . . . . . . . . . 234Redo Log. . . . . . . . . . . . . . . 242Rollback Segment . . . . . . . . . . . . 253SGA . . . . . . . . . . . . . . . . 259SQL Number . . . . . . . . . . . . . 284SQL String . . . . . . . . . . . . . . 294Temporary Extents . . . . . . . . . . . 300Temporary Extents by Tablespace. . . . . . . 304Temporary Extents by User. . . . . . . . . 309Transaction . . . . . . . . . . . . . . 313Undo Space . . . . . . . . . . . . . . 326
Chapter 3. Tasks . . . . . . . . . . 331List of Tasks by GUI and CLI Names . . . . . 333Common task dialog boxes . . . . . . . . . 333
Using the Create a Report File dialog box . . . 333Using the TEC dialog box . . . . . . . . 335
AdvancedNetworkOption . . . . . . . . . 336ConfigureTECOracle . . . . . . . . . . . 339CurrentRunningSQL . . . . . . . . . . . 344DisableResourceModels . . . . . . . . . . 346EnableResourceModels . . . . . . . . . . 349Listener . . . . . . . . . . . . . . . 351OracleTBSMDiscovery . . . . . . . . . . 353
Chapter 4. Commands . . . . . . . 355Tivoli command syntax . . . . . . . . . . 355List of commands . . . . . . . . . . . . 356wochregdb . . . . . . . . . . . . . . 358wocpresource . . . . . . . . . . . . . 359wocprole . . . . . . . . . . . . . . . 360wocpuser. . . . . . . . . . . . . . . 361wocrtresource . . . . . . . . . . . . . 362wocrtrole . . . . . . . . . . . . . . . 364wocrtuser . . . . . . . . . . . . . . 366wodelresource . . . . . . . . . . . . . 369wodelrole . . . . . . . . . . . . . . 370wodeluser . . . . . . . . . . . . . . 371wogetresource . . . . . . . . . . . . . 372wogetrole . . . . . . . . . . . . . . 374wogetuser . . . . . . . . . . . . . . 376wolsresources . . . . . . . . . . . . . 378wolsroles . . . . . . . . . . . . . . . 379
iii
wolsusers . . . . . . . . . . . . . . 380womvresource . . . . . . . . . . . . . 381womvrole . . . . . . . . . . . . . . 382womvuser . . . . . . . . . . . . . . 383wopopresources . . . . . . . . . . . . 384wopoproles . . . . . . . . . . . . . . 385wopopusers . . . . . . . . . . . . . . 386woregdb . . . . . . . . . . . . . . . 387wosetresource . . . . . . . . . . . . . 389wosetresources . . . . . . . . . . . . . 391wosetrole . . . . . . . . . . . . . . . 393wosetroles . . . . . . . . . . . . . . 395wosetuser . . . . . . . . . . . . . . 397wosetusers . . . . . . . . . . . . . . 399woshutdown . . . . . . . . . . . . . 402wostartup . . . . . . . . . . . . . . 403
Appendix A. Monitor to resourcemodel migration table. . . . . . . . 405
Appendix B. Resource model CIMclass quick reference . . . . . . . . 411
Appendix C. Creating customresource models using CIM classes . 415Creating custom resource models using the IBMTivoli Monitoring Workbench . . . . . . . . 415Classes and properties to use in resource models 418
OracleArchiveDest. . . . . . . . . . . 420OracleClassPing . . . . . . . . . . . 422OracleCluster . . . . . . . . . . . . 423OracleDatabase . . . . . . . . . . . . 424OracleDatafile . . . . . . . . . . . . 426OracleDBCacheAdvice . . . . . . . . . 428OracleDispatcher . . . . . . . . . . . 429OracleDispatcherProtocol . . . . . . . . 431OracleDumpSpace . . . . . . . . . . . 432OracleEquity . . . . . . . . . . . . 433OracleHSAgent . . . . . . . . . . . . 434OracleIndex . . . . . . . . . . . . . 435OracleInstance . . . . . . . . . . . . 437OracleJob. . . . . . . . . . . . . . 443OracleListener . . . . . . . . . . . . 445OracleLock . . . . . . . . . . . . . 446OracleLogEvent . . . . . . . . . . . 447OracleNetwork . . . . . . . . . . . . 449OracleObject. . . . . . . . . . . . . 451OracleParameter . . . . . . . . . . . 452OraclePGAStat . . . . . . . . . . . . 453OraclePQSlave . . . . . . . . . . . . 454OraclePQSysStat . . . . . . . . . . . 455OracleProcess . . . . . . . . . . . . 456OraclePXProcess . . . . . . . . . . . 457OraclePXProcessSysStat . . . . . . . . . 458OraclePXSession . . . . . . . . . . . 460OracleQueue . . . . . . . . . . . . 461OracleQueueSchedule . . . . . . . . . 462OracleRedoLog . . . . . . . . . . . . 464OracleRedoLogGroup . . . . . . . . . 465OracleRollbackSegment . . . . . . . . . 466
OracleSegment . . . . . . . . . . . . 468OracleSequence. . . . . . . . . . . . 469OracleSession . . . . . . . . . . . . 470OracleSessStat . . . . . . . . . . . . 472OracleSharedServer . . . . . . . . . . 473OracleSQLPlan . . . . . . . . . . . . 474OracleState . . . . . . . . . . . . . 475OracleSysStat . . . . . . . . . . . . 476OracleSystemEvent . . . . . . . . . . 477OracleTable . . . . . . . . . . . . . 478OracleTablespace . . . . . . . . . . . 479OracleTransaction . . . . . . . . . . . 481OracleUndoStat . . . . . . . . . . . 482OracleUnixProcess. . . . . . . . . . . 483OracleUser . . . . . . . . . . . . . 484
Appendix D. Tivoli Enterprise Consoleclasses . . . . . . . . . . . . . . 485Tasks . . . . . . . . . . . . . . . . 485
ESMTask.baroc:. . . . . . . . . . . . 485OracleTask.baroc: . . . . . . . . . . . 485
Resource models . . . . . . . . . . . . 486ITMApplications.baroc: . . . . . . . . . 486ITMOracle.baroc: . . . . . . . . . . . 486ITMOracleResourceModels.baroc:. . . . . . 486
OracleAdvancedQueue resource model . . . 486OracleArchiveDest resource model . . . . 489OracleCheckpoints resource model . . . . 491OracleDumpSpace resource model . . . . 491OracleExtents resource model . . . . . . 491OracleExtentsByTablespace . . . . . . . 492OracleExtentsByUser resource model . . . 492OracleFreeFormSQLNumber resource model 492OracleFreeFormSQLString resource model 494OracleFreeSpaceDeficit resource model . . . 495OracleFreeSpaceDeficitByTablespace resourcemodel . . . . . . . . . . . . . . 495OracleFreeSpaceDeficitByUser resourcemodel . . . . . . . . . . . . . . 496OracleFreespaceFragmentation resourcemodel . . . . . . . . . . . . . . 496OracleFreespaceFragmentationByTablespaceresource model . . . . . . . . . . . 496OracleFreeTablespace resource model . . . 496OracleFreeTablespaceByTablespace resourcemodel . . . . . . . . . . . . . . 497OracleFullTableScan resource model . . . . 497OracleIO resource model . . . . . . . 497OracleJobQueue resource model . . . . . 498OracleListenerState resource model . . . . 498OracleLock resource model . . . . . . . 499OracleLogEvent resource model . . . . . 500OracleMaximumExtents resource model . . 501OracleMaximumExtentsByTablespaceresource model . . . . . . . . . . . 502OracleMaximumExtentsByUser resourcemodel . . . . . . . . . . . . . . 502OracleMTS resource model . . . . . . . 502OracleOtherPerformance resource model . . 503OracleOtherStorage resource model . . . . 505OraclePGA resource model . . . . . . . 507
iv IBM Tivoli Monitoring for Databases: Oracle: Reference Guide
OracleProcessState resource model . . . . 508OracleRDBMSState resource model . . . . 508OracleRecursiveCalls resource model . . . 510OracleRedoLog resource model . . . . . 510OracleRollbackSegment resource model . . 512OracleSGA resource model . . . . . . . 512OracleTemporaryExtents resource model . . 515OracleTemporaryExtentsByTablespaceresource model . . . . . . . . . . . 516OracleTemporaryExtentsByUser resourcemodel . . . . . . . . . . . . . . 516OracleTransaction resource model . . . . 516OracleUndoSpace resource model . . . . 518
Appendix E. Using tokens tocustomize resource model parameters 519Understanding tokens . . . . . . . . . . 519
Determining which resource models use tokens 519Creating your own tokens . . . . . . . . . 520Viewing tokens for PeopleSoft and SAP tables . . 521
All PeopleSoft tables . . . . . . . . . . 521PeopleSoft payroll tables . . . . . . . . 522PeopleSoft Human Resources tables . . . . . 522PeopleSoft Base Benefits tables . . . . . . 522Largest SAP tables. . . . . . . . . . . 522SAP Sales and Distribution tables . . . . . 522Default SAP Tablespaces. . . . . . . . . 523
Appendix F. Notices . . . . . . . . 525Trademarks . . . . . . . . . . . . . . 527
Index . . . . . . . . . . . . . . . 529
Contents v

vi IBM Tivoli Monitoring for Databases: Oracle: Reference Guide

About this guide
The IBM Tivoli Monitoring for Databases: Oracle Reference Guide provides detailedinformation about the tasks, resource models, and commands for IBM TivoliMonitoring for Databases: Oracle (TM). Use this guide in conjunction with the IBMTivoli Monitoring for Databases: Oracle User’s Guide, and the IBM Tivoli Monitoring forDatabases: Oracle User Management Guide.
Who should read this guideThis guide is intended for system architects (for planning) and systemadministrators and database administrators (for implementation and operation).
Readers should be familiar with the following:v Windows NT or 2000® or UNIX® operating systemsv Tivoli softwarev Oracle software
What this guide containsThis guide contains the following sections:v Chapter 1, “Introduction” on page 1, describes how the guide is organized. This
chapter also describes commands, resource model output, and IBM TivoliMonitoring logging.
v Chapter 2, “Resource models” on page 5, describes how to use the resourcemodels to manage databases.
v Chapter 3, “Tasks” on page 331, describes how to run the IBM Tivoli Monitoringfor Databases: Oracle tasks in the ITMOracleTasks library.
v Chapter 4, “Commands” on page 355, describes the IBM Tivoli Monitoring forDatabases: Oracle commands (called wo commands to distinguish them fromTivoli w commands) and provides a brief description and the authorizationrequired to run the command.
v Appendix A, “Monitor to resource model migration table” on page 405, displaysthe previous monitors and how they are grouped into the current resourcemodels.
v Appendix B, “Resource model CIM class quick reference” on page 411, displaysthe resource models and their corresponding CIM classes.
v Appendix C, “Creating custom resource models using CIM classes” on page 415,displays the CIM classes and properties used in resource models.
v Appendix D, “Tivoli Enterprise Console classes” on page 485, displays a listingof the Tivoli Enterprise Console classes for use in writing your own businessrules.
v Appendix E, “Using tokens to customize resource model parameters” on page519, describes how to use tokens as keywords for the ″By Tablespace″ and ″ByUser″ resource models in order to monitor a certain set of tables or users.
vii

PublicationsThis section lists publications in the IBM Tivoli Monitoring for Databases: Oraclelibrary and any other related documents. It also describes how to access Tivolipublications online, how to order Tivoli publications, and how to submit commentson Tivoli publications.
IBM Tivoli Monitoring for Databases: Oracle libraryThe following documents are available in the IBM Tivoli Monitoring for Databases:Oracle library:v IBM Tivoli Monitoring for Databases: Oracle User’s Guide, SC23-4723
Describes how to install and use IBM Tivoli Monitoring for Databases: Oracle.v IBM Tivoli Monitoring for Databases: Oracle User Management Guide, GI11-1234
Describes how to use the IBM Tivoli Monitoring for Databases: Oracle UserManagement application to manage Oracle users, roles, and resource profiles forOracle databases.
v IBM Tivoli Monitoring for Databases: Oracle Release Notes
Describes product features and provides information about the latest changes tothe installation requirements and procedures. The release notes also describeknown limitations related to installation and explain how to work around eachlimitation.
v IBM Tivoli Monitoring for Databases: Oracle Limitations and Workarounds
Provides the latest information about known product limitations andworkarounds. To ensure that the information is the latest available, thisdocument is provided only on the Web, where it is updated on a regular basis.You can access the Limitations and Workarounds document through the IBMTivoli Monitoring for Databases: Oracle link on the Tivoli Information CenterWeb site:
http://www.tivoli.com/support/public/Prodman/public_manuals/td/TD_PROD_LIST.html
Related publicationsTo use the information in this book effectively, you must have some prerequisiteknowledge, which you can find in the following books:v Tivoli Management Framework User’s Guide
Provides information about profiles and profile management.v Tivoli Management Framework Planning and Installation Guide
Provides information about server and hardware requirements.v Tivoli Management Framework Reference Guide
Provides information about command line commands, such as the winstallcommand.
v IBM Tivoli Monitoring User’s Guide
Provides information about distributed monitoring.v IBM Tivoli Enterprise Console User’s Guide
Provides information about using the Tivoli Enterprise Console®.v Tivoli Software Installation Service (SIS) User’s Guide, Version 4.0
Provides information about using SIS to install the IBM Tivoli Monitoring forDatabases: Oracle software.
viii IBM Tivoli Monitoring for Databases: Oracle: Reference Guide

The following documents also provide useful information:v Server Administrator’s Guide
Provides information about administering the Oracle server in the relevantversion of Oracle.
v Server Concepts Manual
Provides information about the Oracle server and how it works in the relevantversion of Oracle.
v Server SQL Reference
Provides descriptions of Structured Query Language (SQL) used to manageinformation in Oracle databases, refer to the for the relevant version of Oracle.
The Tivoli Glossary includes definitions for many of the technical terms related toTivoli software. The Tivoli Glossary is available, in English only, at the followingWeb site:
http://www.tivoli.com/support/documents/glossary/termsm03.htm
Accessing softcopy publicationsThe publications for this product are available in PDF and HTML formats throughthe following media:v IBM Tivoli Monitoring for Databases: Oracle, Version 5.1.0: Documentation CD,
LK3T-8517-00The Documentation CD contains all of the English language publications for thisproduct, except for the Web-only Limitations and Workarounds supplements. Toaccess the publications, use a Web browser to open the start.html file, which islocated in the root directory of the CD.
v IBM Tivoli Monitoring for Databases: Oracle, Version 5.1.0: NLS Documentation CD,LK3T-8605-00The NLS (national language support) Documentation CD contains both Englishand non-English language publications for this product, except for the Web-onlyLimitations and Workarounds supplements. To access the publications, use aWeb browser to open the start.html file, which is located in the root directory ofthe CD.
v Tivoli Information CenterIBM posts publications for this and all other Tivoli products, as they becomeavailable and whenever they are updated, to the Tivoli Information Center Website.http://www.tivoli.com/support/public/Prodman/public_manuals/td/TD_PROD_LIST.html
Click the Tivoli Monitoring for Oracle link to access the product library.
Using the guide onlineThis document is available on the IBM Tivoli Monitoring for Databases, Version 5.1.0:Documentation CD, LK3T-8516–00 in PDF and HTML formats. Refer to thereadme.txt file on the CD for instructions on downloading the Acrobat Reader,Version 3.0 or later, to view, save, and print the manual.
Use your HTML browser to open the start.html file on the CD to access the .htmldocumentation files. Every navigation page also includes a link at the bottom todownload the Acrobat reader for viewing, saving, and printing the files.
About this guide ix

Viewing online helpOnline help is available in several forms:v Desktop — Access online help by clicking the Help buttons in dialog boxes.v Commands — You can desplay command syntax and parameter information for
command line interface (CLI) commands by typing the name of the command ata command prompt and pressing the Enter key.
Ordering publicationsYou can order many Tivoli publications online at the following Web site:
http://www.elink.ibmlink.ibm.com/public/applications/publications/cgibin/pbi.cgi
You can also order by telephone by calling one of these numbers:v In the United States: 800-879-2755v In Canada: 800-426-4968
See the following Web site for a list of telephone numbers in other countries:
http://www.tivoli.com/inside/store/lit_order.html
Providing feedback about publicationsIf you have comments or suggestions about Tivoli products and documentation,complete the customer feedback survey at the following Web site:
http://www.tivoli.com/support/survey/
AccessibilityAccessibility features help a user who has a physical disability, such as restrictedmobility or limited vision, to use software products successfully. With this product,you can use assistive technologies to hear and navigate the interface. You can alsouse the keyboard instead of the mouse to operate all features of the graphical userinterface.
Contacting Customer SupportIf you have a problem with any Tivoli product, you can contact IBM CustomerSupport for Tivoli products. See the Tivoli Customer Support Handbook at thefollowing Web site:
http://www.tivoli.com/support/handbook/
The handbook provides information about how to contact Customer Support,depending on the severity of your problem, and the following information:v Registration and eligibilityv Telephone numbers and e-mail addresses, depending on the country in which
you are locatedv What information you should gather before contacting Customer Support
x IBM Tivoli Monitoring for Databases: Oracle: Reference Guide

Conventions used in this guideThis book uses several conventions for special terms and actions, operatingsystem-dependent commands and paths, and margin graphics.
Typeface conventionsThe following typeface conventions are used in this book:
Bold Names of files and directories, file and path names, lowercase andmixed-case commands, command options, and flags that appearwithin text appear like this, in bold type.
Graphical user interface elements (except for titles of windows anddialogs) and names of keys also appear like this, in bold type.
Italic Variables, values you must provide, new terms, and words andphrases that are emphasized appear like this, in italic type.
Monospace Commands, command options, and flags that appear on a separateline, code examples, output, and message text appear like this, inmonospace type.
Text strings you must type, when they appear within text, namesof Java methods and classes, and HTML and XML tags also appearlike this, in monospace type.
Operating System-dependent variables and pathsThis book uses the UNIX convention for specifying environment variables and fordirectory notation.
When using the Windows command line, replace $variable with %variable% forenvironment variables and replace each forward slash (/) with a backslash (\) indirectory paths.
Note: If you are using the bash shell on a Windows system, you can use the UNIXconventions.
About this guide xi

xii IBM Tivoli Monitoring for Databases: Oracle: Reference Guide

Chapter 1. Introduction
This book is a reference manual designed for use with the procedures described inthe IBM Tivoli Monitoring for Databases: Oracle User’s Guide. It provides alphabeticallistings and detailed descriptions of the following:v Resource modelsv Tasksv Commandsv Tivoli Enterprise Console classes
Running Tivoli commandsYou can perform system operations from a UNIX or Windows NT or 2000command line interface (CLI) in addition to using the Tivoli desktop. Operationsthat you run from the command line are referred to as CLI commands.
Consider using the command line interface rather than the graphical user interfaceto invoke a Tivoli management application operation in the followingcircumstances:v You do not have access to a graphical user interface, such as when you dial in
over a modem.v You want to group a number of operations together inside a shell script.v You want to use accessibility tools that require text-based input of commands.
All Tivoli CLI commands begin with the letter w to identify them as Tivolicommands. Command names use a w+verb+object syntax. Example: Use thewdmrm command to add or remove a resource model.
Most Tivoli commands run within a bash shell on a managed node or on a Tivolimanagement region server. A shell is a command interpreter that enables theoperating system to process commands. You can run commands from a shellcommand line or include them in shell scripts on UNIX or Windows NT operatingsystems. A Tivoli management region server is a Tivoli server and the set of clientsthat it serves. A Tivoli management regionaddresses the physical connectivity ofresources, whereas a policy region addresses the logical organization of resources.
Before running Tivoli commands, you must set the Tivoli environment variables forthe shell. The managed node or Tivoli management region server installationprocess supplies the scripts to set the Tivoli environment variables. The followingsections of this guide contain descriptions of the procedures to run these scripts:“Setting the Tivoli environment on UNIX operating systems” on page 3 and“Setting the Tivoli environment on Windows NT operating systems” on page 3.
You must also have the appropriate Tivoli authorization role for running eachcommand. Refer to the reference information for each command to see the requiredauthorization role.
Note: A few Tivoli commands can run on an endpoint. To set the Tivolienvironment variables on an endpoint, see “Establishing the Tivolienvironment on an endpoint” on page 3.
1
Running Tivoli commands on Windows NT or 2000 operatingsystems
When you install a Windows NT managed node or Windows NT Tivolimanagement region server, the installation process copies the bash shell executablefile to the machine. The bash shell supports many UNIX commands and UNIXcommand syntax. An example is the forward slash (/) for the directory separator.The bash shell supports the features of the Bourne shell plus it has someextensions applicable only to the bash shell.
NoteYou can use the Windows NT MS-DOS shell instead of the bash shell to runmost Tivoli commands (after you set the Tivoli environment variables withthe %SystemRoot%\system32\drivers\etc\Tivoli\setup_env command).However, some commands and Tivoli tasks may require a bash shell to runsuccessfully. All examples of Tivoli commands in Tivoli publications use bashshell syntax.
Running Tivoli commands on UNIX operating systemsThe UNIX operating systems contain shells. Tivoli commands can run in theBourne, Korn, C, and bash shells. The Bourne shell is the standard UNIX shell.Every UNIX system includes the Bourne shell. The Korn shell supports the featuresof the Bourne shell and has extensions applicable only to the Korn shell. The Cshell name comes from the C programming language syntax. The bash shellsupports many features of the UNIX shells. Both UNIX and Windows NT systemsuse the bash shell.
Where to find additional information about shellsThe following lists include resources where you can find additional informationabout the various shells. These resources were available at the time the lists werecreated. The lists do not show all of the material that is available, and Tivoli doesnot provide opinions or recommendations about any of these resources.
UNIX shells:
v UNIX in a Nutshell: A Desktop Quick Reference for System V Release 4 and Solaris 7(O’Reilly Nutshell handbook) by Arnold Robbins. ISBN: 1-56592-427-4.
v Portable Shell Programming: An Extensive Collection of Bourne Shell Examples byBruce Blinn. ISBN: 0-13-451494-7.
v Learning the Korn Shell (O’Reilly Nutshell handbook) by Bill Rosenblatt and MikeLoukides. ISBN: 1-56592-054-6.
v UNIX C Shell Desk Reference by Martin Arick. ISBN: 0-47-155680-7.
Bash shell:
v Learning the bash Shell (O’Reilly Nutshell handbook) by Cameron Newham andBill Rosenblatt. ISBN: 1-56592-347-2.
v A Brief Introduction to the bash Shell by Jane Anna Langley.http://www.cs.ups.edu/acl/unix_talk/bash.html
v Bash FAQ (GNU documentation). http://www.delorie.com/gnu/docs/bash/FAQv Bash Reference Manual (GNU documentation).
http://www.gnu.org/manual/bash/index.html
2 IBM Tivoli Monitoring for Databases: Oracle: Reference Guide

v bash command reference information (GNU documentation).http://www.delorie.com/gnu/docs/bash/bash.1.html
Establishing the Tivoli environment within a shellWhen you install a managed node or Tivoli management region server, theinstallation process supplies shell setup scripts. You use these scripts to set theenvironment variables required for running Tivoli commands.
Setting the Tivoli environment on UNIX operating systemsThe following steps describe how to set the Tivoli environment within a UNIXshell:1. Log in to a UNIX managed node or Tivoli management region server.2. Run the appropriate setup script for the shell.
v For the Bourne, Korn, or bash shell, run the following command:. /etc/Tivoli/setup_env.sh
—OR—v For the C shell, run the following command:
source /etc/Tivoli/setup_env.csh
Setting the Tivoli environment on Windows NT operatingsystemsThe following steps describe how to set the Tivoli environment and start a bashshell on Windows NT.1. Log in to a Windows NT managed node or Tivoli management region server.2. Open a command window.3. Run the following command in the command window to set Tivoli
environment variables:%SystemRoot%\system32\drivers\etc\Tivoli\setup_env.cmd
4. Run one of the following commands in the command window to start the bashshell:v Type sh and press Enter.
—OR—v Type bash and press Enter.
Establishing the Tivoli environment on an endpointWhen you install an endpoint, the installation process supplies setup scripts. Usethese scripts to set the environment variables required for running Tivolicommands on an endpoint.
The following steps describe how to set the Tivoli environment on an endpoint:1. Log in to an endpoint.2. Open a command window.3. Run the appropriate setup script in the command window. Table 1 on page 4
contains setup scripts for the different endpoint operating systems.
Chapter 1. Introduction 3

Table 1. Setup scripts for endpoint operating systems
Operatingsystem Setup script location Setup script name
AIX, Solaris /etc/Tivoli/lcf/endpoint_label lcf_env.sh (for Bourne, Korn, andbash shells)
—OR—
lcf_env.csh (for C shell)
Windows NT %SystemRoot%\Tivoli\lcf\endpoint_label
lcf_env.cmd (for MS-DOS) orlcf_env.sh (for bash shell)
Common attributes for IBM Tivoli Monitoring for Databases: OracleThis section describes the common attributes used in IBM Tivoli Monitoring forDatabases: Oracle.
Status The returned response level on which the resource model triggered.Response levels are defined when adding a resource model. Depending onthe resource model, response levels may be a default value or auser-defined value.
Normal is returned only when no severity levels are exceeded and theresource model is set to always return a value.
Warning, Severe, or Critical is returned when a severity threshold isbroken.
application_labelThe registered object’s Tivoli Management Environment (TME) label, forexample, v901@merfox.
application_oidThe registered object’s Tivoli Management Environment (TME) objectidentifier.
application_classThe registered object’s Tivoli Management Environment (TME) class, forexample: OracleDatabaseManager or OracleInstanceManager.
application_versionThe managed resource’s version, for example, 8.1.7 , or 9.0.1.
ORACLE_SIDThe Oracle Server ID.
ORACLE_HOMEThe location of the Oracle binaries and libraries.
HOST The Tivoli management agent endpoint on which the Oracle databaseresource resides.
ENDPOINT_OIDThe OracleDatabaseManager or OracleInstanceManager profile endpointobject ID. It is used internally by Tivoli and can be used for tracingactivities with this object.
INTERPThe type of operating system on which the monitor executes, such asSolaris or Windows NT.
4 IBM Tivoli Monitoring for Databases: Oracle: Reference Guide

Chapter 2. Resource models
This chapter contains detailed information about the IBM Tivoli Monitoring forDatabases: Oracle resource models for IBM Tivoli Monitoring for Databases:Oracle. Resource models capture and return information, such as database statusand server availability, about a resource or software application in the Tivolimanagement environment. You can change many of the settings for a resourcemodel to customize it for your monitoring needs.
In this reference guide, a section for each resource model describes theconfiguration of the resource model by covering the following information,including the settings that you can change:
DescriptionPurpose of the resource model and a table that contains an overview of theresource model. The overview table contains the following informationabout the resource model:v Internal name
Name of the resource model as you use it in the command line.v Category
Type of operating system on which the resource model runs.v Indications
List of indications for the resource model. A resource model generates anindication if certain conditions implied by the resource model settingsare not satisfied in a given cycle. The resource model uses an algorithmto determine the combination of settings that generates an indication.
v Tasks and built-in actionsList of tasks and built-in actions for the resource model, if any. For anyevent, recovery actions, such as Tivoli Management Framework tasks orbuilt-in actions, can be run automatically. The actions can take positivesteps to remedy the situation, and can ensure that information about theevent is distributed to the appropriate authorities or entities.
v Default cycle timeSpecifies the default cycle time for the resource model. Cycle time is theduration of the interval within which a resource model gathers data.Each of the resource models supplied with the software has a defaultcycle time, which you can modify according to your needs.
Target managed resourceName of the managed resource (OracleDatabaseManager orOracleInstanceManager) to which this resource model is relevant.
Indications and eventsInformation about all of the indications for the resource model in tableformat and a section of more specific information about each indication.
The table contains the following information for each indication:v Event
An event verifies the persistence of a given indication by eliminatingunrepresentative highs and lows for the indication.
v Default severity
5
Indicates how serious an event is if it is triggered, for example: fatal,critical, warning, harmless, or minor.
v Clearing eventsSpecifies whether the resource model has clearing events: Yes or No. Aclearing event is a resource model function that, if enabled, allows IBMTivoli Monitoring to close an error event when the circumstances thatcaused the event are no longer present. Clearing events can be processedby the Tivoli Enterprise Console server and by Tivoli Business SystemsManager.
v PagePage number where the indication is described in this guide.
Each section about a specific indication contains the following information:v When the resource model sends the indication and whyv List of the attributes for the indication and notation regarding which
attributes are keysv Table that describes the following default settings for the indication:
– Send indications to Tivoli Enterprise ConsoleSpecifies whether the resource model sends indications to TivoliEnterprise Console: YES or NO. If YES and Tivoli Enterprise Consoleis installed, IBM Tivoli Monitoring sends indications to TivoliEnterprise Console. If Tivoli Business Systems Manager is installed,Tivoli Enterprise Console sends the indications to Tivoli BusinessSystems Manager.
– Send indications to Tivoli Business Systems ManagerSpecifies whether IBM Tivoli Monitoring sends indications to TivoliBusiness Systems Manager. The default is NO. Do not change theconfiguration of the indication to send events to Tivoli BusinessSystems Manager.
– OccurrencesThe number of occurrences refers to how many consecutive times theproblem reported by the indication occurs before sending anindication.
– HolesThe number of holes refers to the number of cycles during which anindication does not occur for a given resource model. In other words,holes are the number of cycles during which none of the conditionsspecified for the generation of any indication are met.
– Associated tasks and built-in actionsList of tasks and built-in actions associated with the indication.
ThresholdsList of the thresholds, if any, for the resource model in a table format witha short description and default value for each threshold associated with theresource model. A threshold is a named property of the resource with adefault value that you can modify. Typically, the value of a thresholdrepresents a significant reference level of a performance-related entity,which, if exceeded or not reached, a system administrator might want toknow about.
ParametersList of parameters, if any, for the resource model in a table format with ashort description and default value for each threshold associated with the
6 IBM Tivoli Monitoring for Databases: Oracle: Reference Guide

resource model. A parameter can take the form of a list of strings, a list ofnumeric values, a list of predetermined Boolean values from which youcan make any combination of selections, or a choice list of mutuallyexclusive alternatives. Some resource models provide parameters with theselective logging feature. Use these parameters to choose specific metrics tolog.
Tasks and built-in actionsList of tasks and built-in actions including a description of each one.
LoggingA table shows the name of the managed resource, context, and propertiesthat the resource model logs with key properties noted. The resourcemodel does not log data by default. You can enable logging to collect datafor any endpoint and write it in a local database. You can store raw oraggregated data and view it through the Web Health Console. Someresource models provide parameters with the selective logging feature. Usethese parameters to choose specific metrics to log.
Return codesInformation that the resource model returns such as status or availability.
CLI exampleExample of the syntax for a resource model that illustrates the variableoptions of the wdmeditprf command that are specific to the resourcemodel such as the name of the resource model, thresholds, parameters,parameter values, and events.
See the Working with resource models chapter of the IBM Tivoli Monitoring forDatabases: Oracle User’s Guide for more information on resource models andresource model customization.
Return codesTable 2 contains a listing of resource model return codes, their description, andwhat action you can take to resolve each code. The return code number isdisplayed in the IBM Tivoli Monitoring Web Health Console status field, or byusing the wdmlseng command.
Table 2. Resource model return codes
ReturnCode
Description Action
1 The resource model was distributed toan incorrect target managed resource.Possibly, the resource model wasdistributed to an endpoint or DB2object instead of theOracleDatabaseManager orOracleInstanceManager.
Distribute the resource model to eitherthe OracleDatabaseManager or theOracleInstance Manager. See the″Target managed resource″ section forthe correct managed resource for eachresource model.
2 The resource model was distributed tothe wrong object version. This may beseen in resource models that arespecific to a particular version ofOracle, such as UndoSpace and PGA,which only run on Oracle 9i.
Distribute the resource model to theproxy object for the supported Oracleversion.
Chapter 2. Resource models 7

Table 2. Resource model return codes (continued)
ReturnCode
Description Action
3 The resource model has an invalidparameter configuration. Possibly, theparameter value was out of thesupported range, or an invalid type.
Provide valid parameters. The″Parameters″ section for each resourcemodel in this guide lists validparameters for each resource model.
4 The resource model has an invalidthreshold value. Possibly, thethreshold value is one of thefollowing: not within the specifiedrange, not an integer value, or lessthan 0.
Provide valid thresholds. The″Thresholds″ section for each resourcemodel in this guide lists validthresholds for each resource model.
5 The resource is unavailable. Possibly,the Oracle Listener or database is notrunning.
Consider restarting the unavailableresource if this is desirable. It ispossible that the resource may beunavailable by intention.You can startthe Oracle Listener by running theListener task described on 351. Forinstructions on starting a database, seethe IBM Tivoli Monitoring forDatabases: Oracle User’s Guide.
6 The data that was collected from aresource is determined to be invalid.Possibly, this code could appear if adatabase column is of a different typethan the one that is expected (forexample, a string instead of anumber).
Check the trace_dmxengine.log to seewhat metric is affected.
7 An error occurred while collectingdata. This code appears when anexception is thrown from the Javainstrumentation.
Check the trace_dmxengine.log andthe$LCF_DATDIR/LCFNEW/AMG/logsdirectory for details. In some cases, theerror may be recoverable and the Javacode that threw the exception mayhave printed detailed information inthese files. Additionally, you cancontact Customer Support.
8 An unknown error has occurred. Contact Customer Support, or checkthe trace_dmxengine.log and the$LCF_DATDIR/LCFNEW/AMG/logsdirectory for details.
Table 3 contains the internal name and a brief description of each IBM TivoliMonitoring for Databases: Oracle resource model. The sections of informationabout each resource model follow the table in alphabetical order.
Table 3. IBM Tivoli Monitoring for Databases: Oracle resource models
Resource model Internal Name Description
“Advanced Queue” onpage 15
OracleAdvancedQueue Monitors for any messages waiting foran unreasonable amount of time and ifthere are potential performancebottlenecks.
8 IBM Tivoli Monitoring for Databases: Oracle: Reference Guide

Table 3. IBM Tivoli Monitoring for Databases: Oracle resource models (continued)
Resource model Internal Name Description
“Archive Destinations”on page 35
OracleArchiveDest Monitors the Oracle archive logs andthe amount of free space (in kilobytes),and the percentage of free space in theOracle archive log destination.
“Checkpoints” onpage 50
OracleCheckpoints Monitors the number of times adatabase writer (DBWR) checkpoint iscompleted, and the number ofdatabase writer checkpoints requestedby the server.
“Data WarehouseCollector” on page 55
OracleDataWarehouse Collects attribute data required by theTivoli Enterprise Data Warehouse. Thisresource model must be running toallow complete integration of IBMTivoli Monitoring for Databases:Oracle into the Tivoli Enterprise DataWarehouse.
“Dump Space” onpage 61
OracleDumpSpace Monitors the used space percentagefor the dump destination directories.
“Extents” on page 65 OracleExtents Alerts on those database objects whosenumber of currently allocated extentsexceeds the specified threshold.
“Extents byTablespace” on page69
OracleExtentsByTablespace
Alerts on those database objects forthe specified tablespaces whosenumber of currently allocated extentsexceeds the specified threshold.
“Extents by User” onpage 74
OracleExtentsByUser Alerts on those database objects forthe specified user whose number ofcurrently allocated extents exceeds thespecified threshold.
“Free Space Deficit”on page 79
OracleFreeSpaceDeficit Checks whether any segments areunable to allocate their next extentbecause of insufficient free space inthe tablespace, and not because thesegments reached MAXEXTENTS.
“Free Space Deficit ByTablespace” on page84
OracleFreeSpaceDeficitByTablespace
Checks whether any segments, withinspecified tablespaces, are unable toallocate their next extent because ofinsufficient free space in thetablespace, and not because thesegments reached MAXEXTENTS.
“Free Space Deficit byUser” on page 89
OracleFreeSpaceDeficitByUser
Checks whether any segments, for aspecified user, are unable to allocatetheir next extent because ofinsufficient free space in thetablespace, and not because thesegments reached MAXEXTENTS.
“Free SpaceFragmentation” onpage 94
OracleFreeSpaceFragmentation
Monitors the free space fragmentationindex over all tablespaces within anOracle instance.
“Free SpaceFragmentation byTablespace” on page98
OracleFreeSpaceFragmentationByTablespace
Monitors the free space fragmentationindex for specified tablespaces withinan Oracle instance.
Chapter 2. Resource models 9

Table 3. IBM Tivoli Monitoring for Databases: Oracle resource models (continued)
Resource model Internal Name Description
“Free Tablespace” onpage 102
OracleFreeTablespace Monitors the percentage of free spacefor each tablespace in a database.
“Free Tablespace byTablespace” on page106
OracleFreeTablespaceByTablespace
Monitors the percentage of free spacefor the specified tablespaces.
“Full Table Scan” onpage 110
OracleFullTableScan Monitors the percentage of full tablescans from long tables, and reports thepercentage of total rows retrievedfrom full table scans.
“I/O” on page 115 OracleIO Monitors the number of physical readsand physical writes for the datafiles inthe database.
“Job Queue” on page120
OracleJobQueue Monitors the number of broken, failed,and past due jobs in the job queue.
“Listener State” onpage 126
OracleListenerState Monitors the state of the Oraclelisteners.
“Lock” on page 133 OracleLock Monitors the following information:
v The total number of deadlocksdetected since the instance wasstarted
v The current number of DataManipulation Language locks as apercentage of the maximum numberof locks defined for the instance
v The number of active locks of auser-specified type
v The number of times an enqueuelock was requested and was notgranted immediately
“Log Event” on page147
OracleLogEvent Monitors events in the Oraclebackground log for Oracle errors.
“Maximum Extents”on page 156
OracleMaximumExtents Alerts on those segments whose freeextents (maximum allowed extentsminus the segment’s currentlyallocated extents) are less than thespecified threshold.
“Maximum Extents byTablespace” on page160
OracleMaximumExtentsByTablespace
Alerts on segments, in specifiedtablespaces, whose free extents(maximum allowed extents minus thesegment’s currently allocated extents)are less than the specified threshold.
“Maximum Extents byUser” on page 165
OracleMaximumExtentsbyUser
Alerts on segments, for a specifieduser, whose free extents (maximumallowed extents minus the segment’scurrently allocated extents) are lessthan the specified threshold.
10 IBM Tivoli Monitoring for Databases: Oracle: Reference Guide
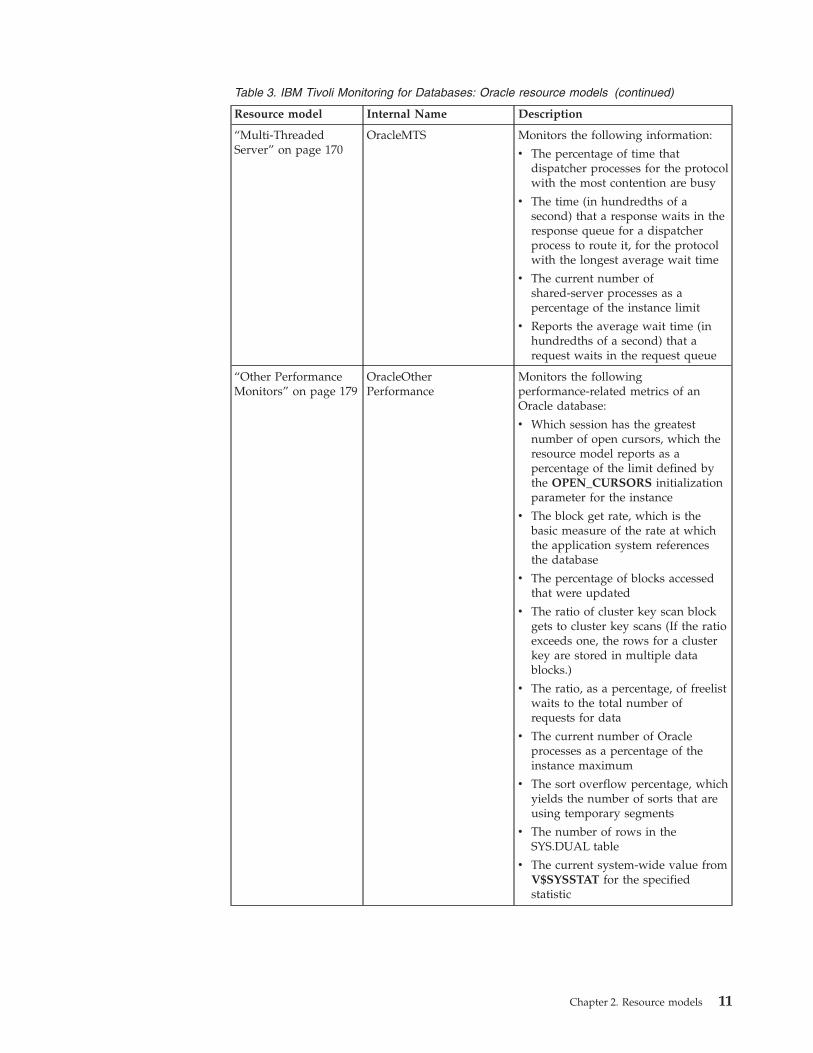
Table 3. IBM Tivoli Monitoring for Databases: Oracle resource models (continued)
Resource model Internal Name Description
“Multi-ThreadedServer” on page 170
OracleMTS Monitors the following information:
v The percentage of time thatdispatcher processes for the protocolwith the most contention are busy
v The time (in hundredths of asecond) that a response waits in theresponse queue for a dispatcherprocess to route it, for the protocolwith the longest average wait time
v The current number ofshared-server processes as apercentage of the instance limit
v Reports the average wait time (inhundredths of a second) that arequest waits in the request queue
“Other PerformanceMonitors” on page 179
OracleOtherPerformance
Monitors the followingperformance-related metrics of anOracle database:
v Which session has the greatestnumber of open cursors, which theresource model reports as apercentage of the limit defined bythe OPEN_CURSORS initializationparameter for the instance
v The block get rate, which is thebasic measure of the rate at whichthe application system referencesthe database
v The percentage of blocks accessedthat were updated
v The ratio of cluster key scan blockgets to cluster key scans (If the ratioexceeds one, the rows for a clusterkey are stored in multiple datablocks.)
v The ratio, as a percentage, of freelistwaits to the total number ofrequests for data
v The current number of Oracleprocesses as a percentage of theinstance maximum
v The sort overflow percentage, whichyields the number of sorts that areusing temporary segments
v The number of rows in theSYS.DUAL table
v The current system-wide value fromV$SYSSTAT for the specifiedstatistic
Chapter 2. Resource models 11

Table 3. IBM Tivoli Monitoring for Databases: Oracle resource models (continued)
Resource model Internal Name Description
“Other Storage” onpage 196
OracleOtherStorage Monitors the following information:
v The percentage of rows retrievedthat extend over more than oneblock, which is called chained rows
v The number of chained rowscalculated for a specified cluster inthe endpoint database
v The number of chained rows,calculated for a specified table inthe endpoint database
v The percentage of deleted rowsfrom the user-specified index thathave not been repopulated
v The number of datafiles that can beadded before the database reachesthe maximum number of datafilesallowed
“PGA” on page 209 OraclePGA Monitors the following in the programglobal area:
v Multipass Executions
v Optimal Percentage
v Work Area Percentage
v Component Area
“Process State” onpage 218
OracleProcessState Monitors the state of Oracle specificprocesses.
“RDBMS State” onpage 223
OracleRDBMSState Monitors the state of an Oracledatabase instance.
“Recursive Calls” onpage 234
OracleRecursiveCalls Monitors the following information:
v Recursive Call Percentage
v User Calls
v Recursive Calls
v Recursive Call Percentage
v Recursive Call Rate
12 IBM Tivoli Monitoring for Databases: Oracle: Reference Guide
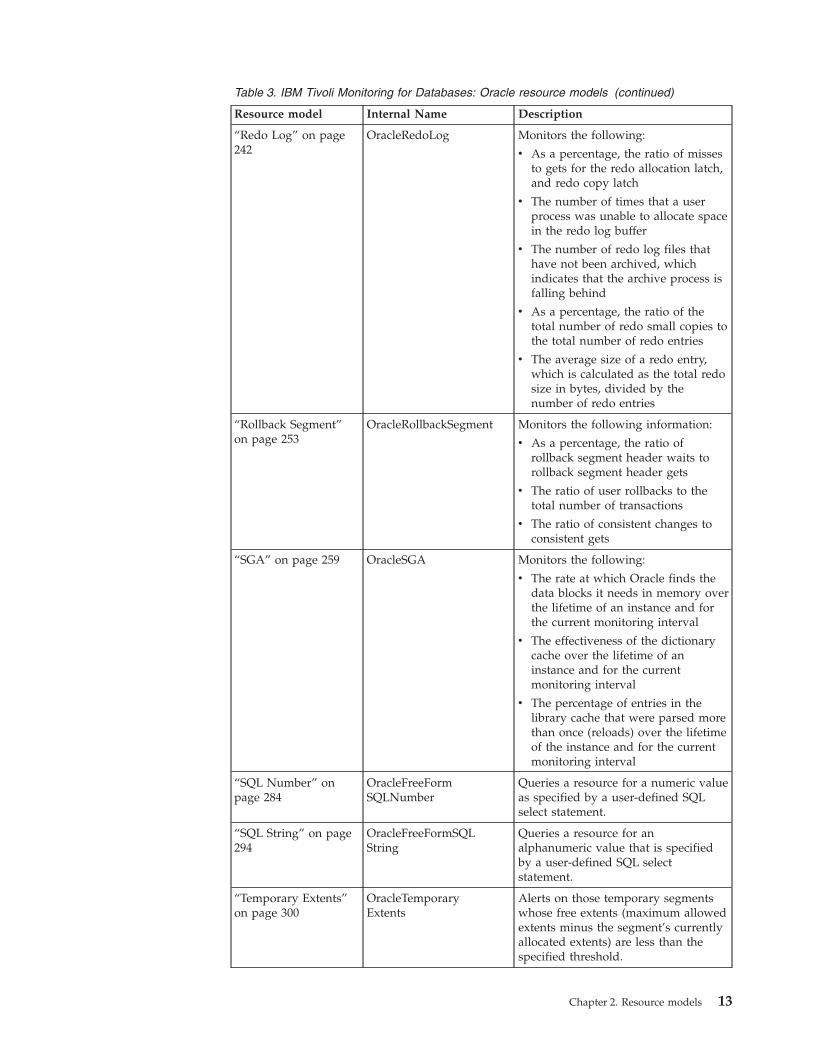
Table 3. IBM Tivoli Monitoring for Databases: Oracle resource models (continued)
Resource model Internal Name Description
“Redo Log” on page242
OracleRedoLog Monitors the following:
v As a percentage, the ratio of missesto gets for the redo allocation latch,and redo copy latch
v The number of times that a userprocess was unable to allocate spacein the redo log buffer
v The number of redo log files thathave not been archived, whichindicates that the archive process isfalling behind
v As a percentage, the ratio of thetotal number of redo small copies tothe total number of redo entries
v The average size of a redo entry,which is calculated as the total redosize in bytes, divided by thenumber of redo entries
“Rollback Segment”on page 253
OracleRollbackSegment Monitors the following information:
v As a percentage, the ratio ofrollback segment header waits torollback segment header gets
v The ratio of user rollbacks to thetotal number of transactions
v The ratio of consistent changes toconsistent gets
“SGA” on page 259 OracleSGA Monitors the following:
v The rate at which Oracle finds thedata blocks it needs in memory overthe lifetime of an instance and forthe current monitoring interval
v The effectiveness of the dictionarycache over the lifetime of aninstance and for the currentmonitoring interval
v The percentage of entries in thelibrary cache that were parsed morethan once (reloads) over the lifetimeof the instance and for the currentmonitoring interval
“SQL Number” onpage 284
OracleFreeFormSQLNumber
Queries a resource for a numeric valueas specified by a user-defined SQLselect statement.
“SQL String” on page294
OracleFreeFormSQLString
Queries a resource for analphanumeric value that is specifiedby a user-defined SQL selectstatement.
“Temporary Extents”on page 300
OracleTemporaryExtents
Alerts on those temporary segmentswhose free extents (maximum allowedextents minus the segment’s currentlyallocated extents) are less than thespecified threshold.
Chapter 2. Resource models 13

Table 3. IBM Tivoli Monitoring for Databases: Oracle resource models (continued)
Resource model Internal Name Description
“Temporary Extents byTablespace” on page304
OracleTemporaryExtentsByTablespace
Alerts on those temporary segmentswithin specified tablespaces whosefree extents (maximum allowedextents minus the segment’s currentlyallocated extents) are less than thespecified threshold.
“Temporary Extents byUser” on page 309
OracleTemporaryExtentsByUser
Alerts on those temporary segmentsfor a specified user whose free extents(maximum allowed extents minus thesegment’s currently allocated extents)are less than the specified threshold.
“Transaction” on page313
OracleTransaction Monitors the following:
v Possible issues and bottlenecks inthe SQL or database design
v Whether any transactions are lockedby another user, and returns thelongest time, in seconds, that atransaction has been blocked
v The total number of activetransactions as a percentage of theTRANSACTIONS initializationparameter for the instance
v The number of client requests madeper transaction
v The amount of DML (DataManipulation Language) work thateach transaction performs
v An overview of the work rate beingrun against the instance
v The identity of long-runningtransactions and how long thosetransactions have been running
“Undo Space” on page326
OracleUndoSpace Monitors the No Space Error andSnapshot Too Old Error undo errors.
14 IBM Tivoli Monitoring for Databases: Oracle: Reference Guide

Advanced Queue
DescriptionMonitors the following:v The number of messages in a user-specified queue that are in one of the
following states: WAITING, READY or EXPIREDv The progress of the propagation of a queuev Any anomalies caused by the network or the destination to which the queue is
attempting to propagatev Messages that could not be propagated and have been recorded as errorsv The number of messages in the READY state in each queue and the total waiting
time of each message in days, hours, minutes, or secondsv The number of bytes-per-second that have been propagated over all enabled
schedules or over a particular queue in a user-specified schedulev The number of messages in the READY state in each queue, and the average
waiting time of each message in days, hours, minutes, or seconds
Use this resource model to find out if messages have been waiting for anunreasonable amount of time and if there are potential performance bottlenecks. Alarge number of messages in the READY state shows an anomaly with the messageprocessing. A queue with multiple messages in the READY state can indicateproblems with the dequeue process or problems with the queue destination. Aknown outage might also cause multiple messages in the READY state, but if not,you should alert the DBA that a problem exists.
Use the High Error Count metric to monitor queue propagation failure. Possiblereasons for propagation failure include the following:v Database link failurev Remote database unavailablev Remote queue does not existv Security violation during message enqueue to remote queue
When an error occurs in a propagation schedule, Oracle attempts to propagate themessages periodically for a limited number of times, then disables the schedule. Ifthe problem causing the error is fixed before the schedule is disabled, the errormessages continue to show error information. The error information stopsdisplaying only after successful propagation of the messages in that schedule. Ifyou do not resolve the errors, hours or days can elapse between propagationattempts. If this occurs, consider unscheduling the propagation and reset theschedule.
You can use the output from the Low Average Message Propagation Rate metric totune the various parameters in the schedule and ensure that the schedule isoptimized. For example, if a queue propagates data at a certain rate, run theresource model on a regular basis and alert the DBA if the propagation falls belowthe normal rate. A drop in the propagation rate can indicate network problemswith operations between instances.
Resource model overview
Internal name OracleAdvancedQueue
Category Oracle
Chapter 2. Resource models 15

Resource model overview
Indications High Average Ready Message Waiting Time In Days occurswhen the ready message waiting time in days exceeds thespecified threshold.
High Average Ready Message Waiting Time In Hoursoccurs when the ready message waiting time in hoursexceeds the specified threshold.
High Average Ready Message Waiting Time In Minutesoccurs when the ready message waiting time in minutesexceeds the specified threshold.
High Average Ready Message Waiting Time In Secondsindication occurs when the average ready message waitingtime in seconds exceeds the specified threshold.
High Error Count occurs when the error count exceeds thespecified threshold.
High Number of Messages occurs when the number ofmessages exceeds the specified threshold.
High Total Ready Message Waiting Time In Days occurswhen the total ready message waiting time in days exceedsthe specified threshold.
High Total Ready Message Waiting Time In Hours occurswhen the total ready message waiting time in hours exceedsthe specified threshold.
High Total Ready Message Waiting Time In Minutesoccurs when the total ready message waiting time inminutes exceeds the specified threshold
High Total Ready Message Waiting Time In Seconds occurswhen the total ready message waiting time in secondsexceeds the specified threshold.
Low Average Message Propagation Rate occurs when theaverage message propagation rate is lower than the specifiedthreshold.
Tasks and built-in actions None
Default cycle time 300 seconds
Target managed resourceOracleDatabaseManager, OracleInstanceManager
Indications and eventsThe following table summarizes the indications for this resource model, the eventsassociated with the indications, the default severity of the events, and where tofind a detailed description of the indication.
16 IBM Tivoli Monitoring for Databases: Oracle: Reference Guide
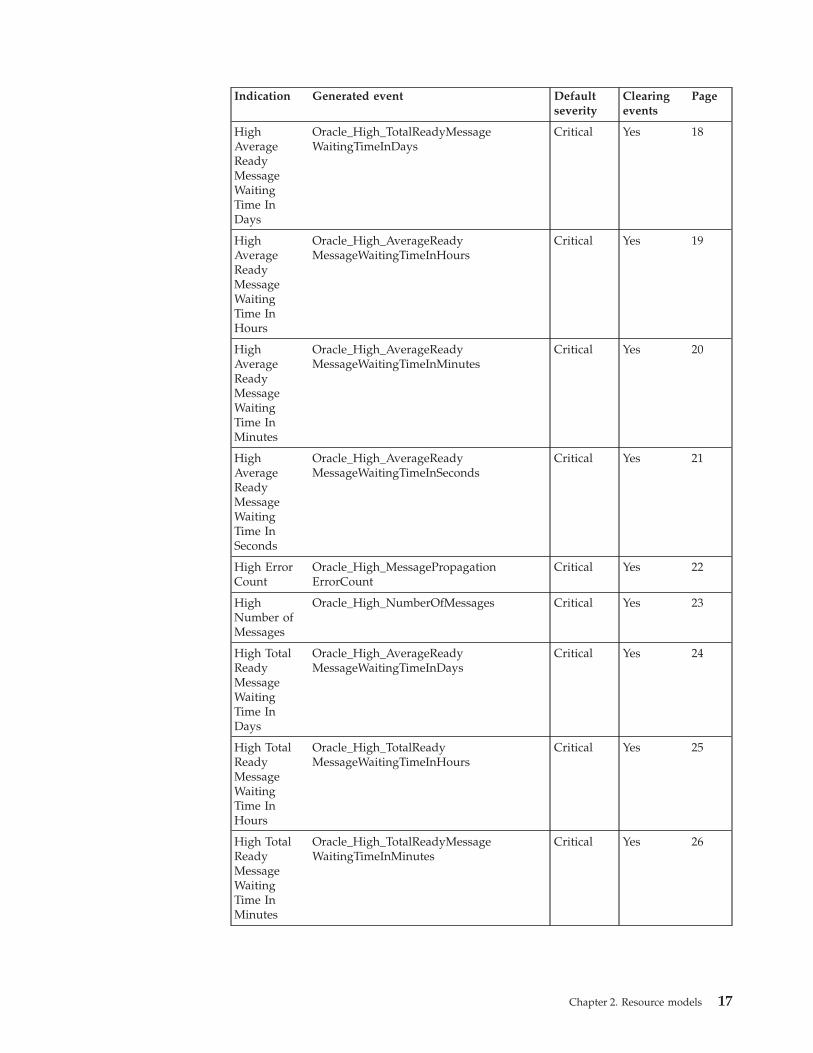
Indication Generated event Defaultseverity
Clearingevents
Page
HighAverageReadyMessageWaitingTime InDays
Oracle_High_TotalReadyMessageWaitingTimeInDays
Critical Yes 18
HighAverageReadyMessageWaitingTime InHours
Oracle_High_AverageReadyMessageWaitingTimeInHours
Critical Yes 19
HighAverageReadyMessageWaitingTime InMinutes
Oracle_High_AverageReadyMessageWaitingTimeInMinutes
Critical Yes 20
HighAverageReadyMessageWaitingTime InSeconds
Oracle_High_AverageReadyMessageWaitingTimeInSeconds
Critical Yes 21
High ErrorCount
Oracle_High_MessagePropagationErrorCount
Critical Yes 22
HighNumber ofMessages
Oracle_High_NumberOfMessages Critical Yes 23
High TotalReadyMessageWaitingTime InDays
Oracle_High_AverageReadyMessageWaitingTimeInDays
Critical Yes 24
High TotalReadyMessageWaitingTime InHours
Oracle_High_TotalReadyMessageWaitingTimeInHours
Critical Yes 25
High TotalReadyMessageWaitingTime InMinutes
Oracle_High_TotalReadyMessageWaitingTimeInMinutes
Critical Yes 26
Chapter 2. Resource models 17

Indication Generated event Defaultseverity
Clearingevents
Page
High TotalReadyMessageWaitingTime InSeconds
Oracle_High_TotalReadyMessageWaitingTimeInSeconds
Critical Yes 27
LowAverageMessagePropagationRate
Oracle_Low_AverageMessagePropagationRate
Critical Yes 28
High Average Ready Message Waiting Time In Days indicationOccurs when the average ready message waiting time in days exceeds the specifiedthreshold. When the indication occurs often enough to trigger an event, the eventdelivers a message to the Tivoli Enterprise Console in the following format:<application_label>: The average waiting time for messages in the READYstate for the Oracle Queue <QueueOwner>.<QueueName>on database <DatabaseName> has crossed above the predefined threshold<Threshold> and is currently at <AverageReadyWait> days.
If you have Tivoli Business Systems Manager configured for your system, TivoliEnterprise Console forwards the message to Tivoli Business Systems Manager.
You can check the health of this resource model in the IBM Tivoli Monitoring WebHealth Console. For more information, see the IBM Tivoli Monitoring Web HealthConsole documentation.
The indication has the following attributes:
AverageReadyWaitThe average wait time of all READY messages in the queue.
DatabaseNameThe name of an Oracle database. The database name contains up to 8characters and corresponds to the name specified in the CREATEDATABASE statement and identified in the DB_NAME parameter in thedatabase initialization parameter file.
QueueNameThe name of the specified queue.
QueueOwnerThe username of the queue owner.
This indication has the following thresholds:v Maximum Average Ready Waiting Time
For more information about these thresholds, see “Thresholds” on page 29.
The following table describes the default settings for this indication.
Setting Default value
Send indications to Tivoli Enterprise Console Yes
18 IBM Tivoli Monitoring for Databases: Oracle: Reference Guide
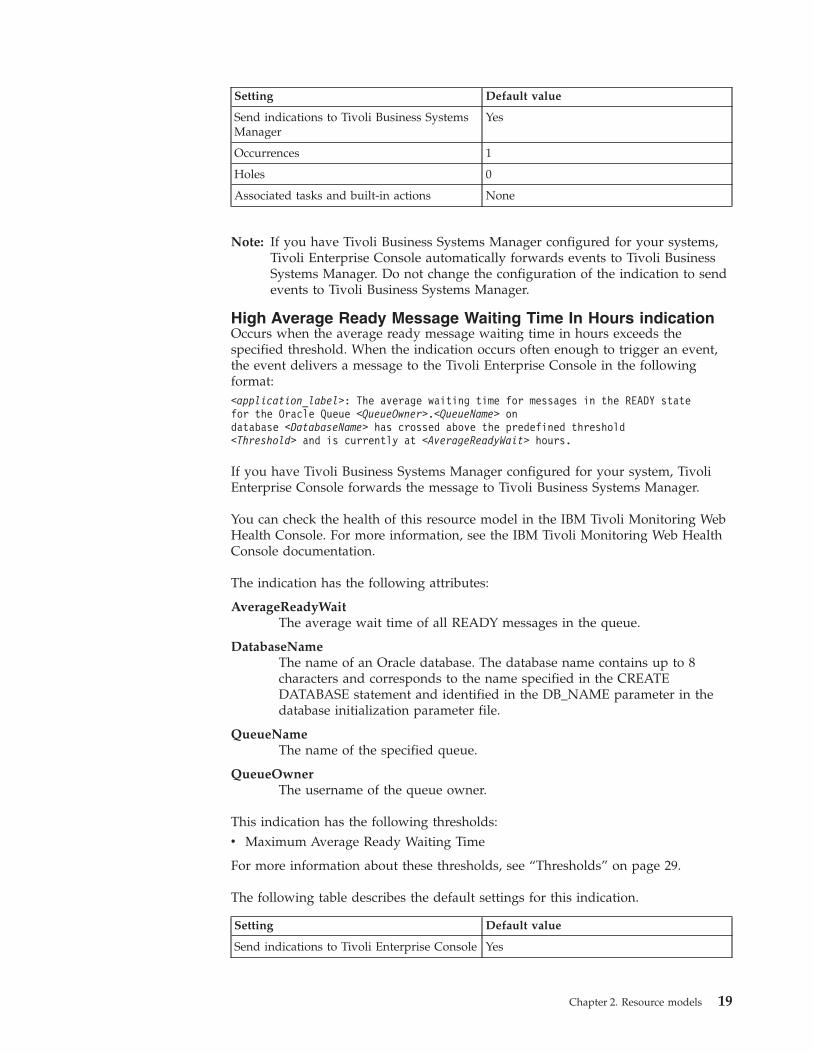
Setting Default value
Send indications to Tivoli Business SystemsManager
Yes
Occurrences 1
Holes 0
Associated tasks and built-in actions None
Note: If you have Tivoli Business Systems Manager configured for your systems,Tivoli Enterprise Console automatically forwards events to Tivoli BusinessSystems Manager. Do not change the configuration of the indication to sendevents to Tivoli Business Systems Manager.
High Average Ready Message Waiting Time In Hours indicationOccurs when the average ready message waiting time in hours exceeds thespecified threshold. When the indication occurs often enough to trigger an event,the event delivers a message to the Tivoli Enterprise Console in the followingformat:<application_label>: The average waiting time for messages in the READY statefor the Oracle Queue <QueueOwner>.<QueueName> ondatabase <DatabaseName> has crossed above the predefined threshold<Threshold> and is currently at <AverageReadyWait> hours.
If you have Tivoli Business Systems Manager configured for your system, TivoliEnterprise Console forwards the message to Tivoli Business Systems Manager.
You can check the health of this resource model in the IBM Tivoli Monitoring WebHealth Console. For more information, see the IBM Tivoli Monitoring Web HealthConsole documentation.
The indication has the following attributes:
AverageReadyWaitThe average wait time of all READY messages in the queue.
DatabaseNameThe name of an Oracle database. The database name contains up to 8characters and corresponds to the name specified in the CREATEDATABASE statement and identified in the DB_NAME parameter in thedatabase initialization parameter file.
QueueNameThe name of the specified queue.
QueueOwnerThe username of the queue owner.
This indication has the following thresholds:v Maximum Average Ready Waiting Time
For more information about these thresholds, see “Thresholds” on page 29.
The following table describes the default settings for this indication.
Setting Default value
Send indications to Tivoli Enterprise Console Yes
Chapter 2. Resource models 19

Setting Default value
Send indications to Tivoli Business SystemsManager
Yes
Occurrences 1
Holes 0
Associated tasks and built-in actions None
Note: If you have Tivoli Business Systems Manager configured for your systems,Tivoli Enterprise Console automatically forwards events to Tivoli BusinessSystems Manager. Do not change the configuration of the indication to sendevents to Tivoli Business Systems Manager.
High Average Ready Message Waiting Time In Minutes indicationOccurs when the average ready message waiting time in minutes exceeds thespecified threshold. When the indication occurs often enough to trigger an event,the event delivers a message to the Tivoli Enterprise Console in the followingformat:<application_label>: The average waiting time for messages in the READY statefor the Oracle Queue <QueueOwner>.<QueueName> on database<DatabaseName> has crossed above the predefined threshold <Threshold>and is currently at <AverageReadyWait> minutes.
If you have Tivoli Business Systems Manager configured for your system, TivoliEnterprise Console forwards the message to Tivoli Business Systems Manager.
You can check the health of this resource model in the IBM Tivoli Monitoring WebHealth Console. For more information, see the IBM Tivoli Monitoring Web HealthConsole documentation.
The indication has the following attributes:
AverageReadyWaitThe average wait time of all READY messages in the queue.
DatabaseNameThe name of an Oracle database. The database name contains up to 8characters and corresponds to the name specified in the CREATEDATABASE statement and identified in the DB_NAME parameter in thedatabase initialization parameter file.
QueueNameThe name of the specified queue.
QueueOwnerThe username of the queue owner.
This indication has the following thresholds:v Maximum Average Ready Waiting Time
For more information about these thresholds, see “Thresholds” on page 29.
The following table describes the default settings for this indication.
Setting Default value
Send indications to Tivoli Enterprise Console Yes
20 IBM Tivoli Monitoring for Databases: Oracle: Reference Guide
Setting Default value
Send indications to Tivoli Business SystemsManager
Yes
Occurrences 1
Holes 0
Associated tasks and built-in actions None
Note: If you have Tivoli Business Systems Manager configured for your systems,Tivoli Enterprise Console automatically forwards events to Tivoli BusinessSystems Manager. Do not change the configuration of the indication to sendevents to Tivoli Business Systems Manager.
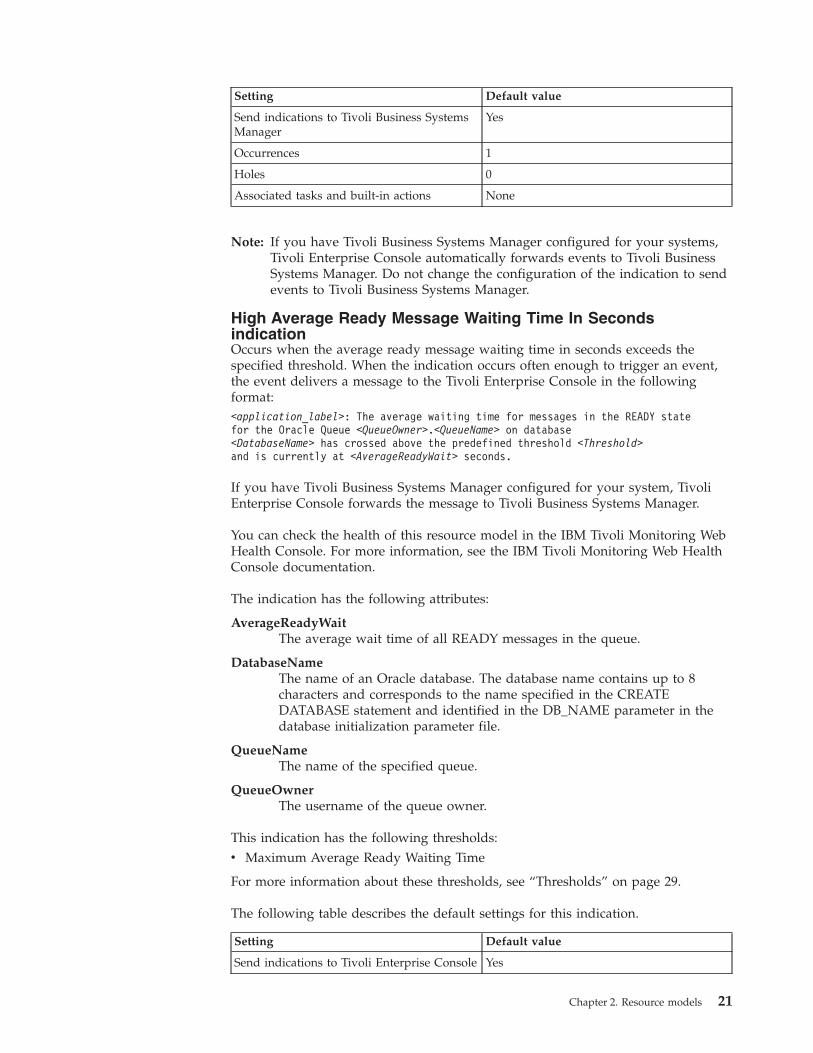
High Average Ready Message Waiting Time In SecondsindicationOccurs when the average ready message waiting time in seconds exceeds thespecified threshold. When the indication occurs often enough to trigger an event,the event delivers a message to the Tivoli Enterprise Console in the followingformat:<application_label>: The average waiting time for messages in the READY statefor the Oracle Queue <QueueOwner>.<QueueName> on database<DatabaseName> has crossed above the predefined threshold <Threshold>and is currently at <AverageReadyWait> seconds.
If you have Tivoli Business Systems Manager configured for your system, TivoliEnterprise Console forwards the message to Tivoli Business Systems Manager.
You can check the health of this resource model in the IBM Tivoli Monitoring WebHealth Console. For more information, see the IBM Tivoli Monitoring Web HealthConsole documentation.
The indication has the following attributes:
AverageReadyWaitThe average wait time of all READY messages in the queue.
DatabaseNameThe name of an Oracle database. The database name contains up to 8characters and corresponds to the name specified in the CREATEDATABASE statement and identified in the DB_NAME parameter in thedatabase initialization parameter file.
QueueNameThe name of the specified queue.
QueueOwnerThe username of the queue owner.
This indication has the following thresholds:v Maximum Average Ready Waiting Time
For more information about these thresholds, see “Thresholds” on page 29.
The following table describes the default settings for this indication.
Setting Default value
Send indications to Tivoli Enterprise Console Yes
Chapter 2. Resource models 21

Setting Default value
Send indications to Tivoli Business SystemsManager
Yes
Occurrences 1
Holes 0
Associated tasks and built-in actions None
Note: If you have Tivoli Business Systems Manager configured for your systems,Tivoli Enterprise Console automatically forwards events to Tivoli BusinessSystems Manager. Do not change the configuration of the indication to sendevents to Tivoli Business Systems Manager.
High Error Count indicationOccurs when the error count exceeds the specified threshold. When the indicationoccurs often enough to trigger an event, the event delivers a message to the TivoliEnterprise Console in the following format:<application_label>: The number of messages that could not be propagated and havebeen recorded as errors for the Oracle Queue <QueueOwner>.<QueueName>on database <DatabaseName> has crossed above the predefined threshold<Threshold> and is currently at <Failures>.
If you have Tivoli Business Systems Manager configured for your system, TivoliEnterprise Console forwards the message to Tivoli Business Systems Manager.
You can check the health of this resource model in the IBM Tivoli Monitoring WebHealth Console. For more information, see the IBM Tivoli Monitoring Web HealthConsole documentation.
The indication has the following attributes:
DatabaseNameThe name of an Oracle database. The database name contains up to 8characters and corresponds to the name specified in the CREATEDATABASE statement and identified in the DB_NAME parameter in thedatabase initialization parameter file.
DestinationThe destination name for the queue. This name is currently limited to be aDBLINK name.
FailuresThe number of times the execution failed. If this number is 16, theschedule will be disabled.
LastErrorDateThe date of the most recent unsuccessful execution.
LastErrorMsgThe error number and error message text for the most recent unsuccessfulexecution.
LastErrorTimeThe time of the most recent unsuccessful execution.
QueueNameThe name of the specified queue.
22 IBM Tivoli Monitoring for Databases: Oracle: Reference Guide

QueueOwnerThe username of the queue owner.
This indication has the following thresholds:v Maximum Message Propagation Error Count
For more information about these thresholds, see “Thresholds” on page 29.
The following table describes the default settings for this indication.
Setting Default value
Send indications to Tivoli Enterprise Console Yes
Send indications to Tivoli Business SystemsManager
Yes
Occurrences 1
Holes 0
Associated tasks and built-in actions None
Note: If you have Tivoli Business Systems Manager configured for your systems,Tivoli Enterprise Console automatically forwards events to Tivoli BusinessSystems Manager. Do not change the configuration of the indication to sendevents to Tivoli Business Systems Manager.
High Number of Messages indicationOccurs when the number of messages exceeds the specified threshold. When theindication occurs often enough to trigger an event, the event delivers a message tothe Tivoli Enterprise Console in the following format:<application_label>: The number of messages in state <MessageStatus>for the Oracle Queue <QueueOwner>.<QueueName> on database<DatabaseName> has crossed above the predefined threshold <Threshold>and is currently at <NumberOfMessages>.
If you have Tivoli Business Systems Manager configured for your system, TivoliEnterprise Console forwards the message to Tivoli Business Systems Manager.
You can check the health of this resource model in the IBM Tivoli Monitoring WebHealth Console. For more information, see the IBM Tivoli Monitoring Web HealthConsole documentation.
The indication has the following attributes:
DatabaseNameThe name of an Oracle database. The database name contains up to 8characters and corresponds to the name specified in the CREATEDATABASE statement and identified in the DB_NAME parameter in thedatabase initialization parameter file.
MessageStatusDisplays the current status of the dispatcher. Status includes:v WAIT – dispatcher is idlev SEND – dispatcher is sending a messagev RECEIVE – dispatcher is receiving a messagev CONNECT – dispatcher is establishing a connectionv DISCONNECT – dispatcher is handling a disconnect request
Chapter 2. Resource models 23

v BREAK – dispatcher is handling a breakv TERMINATE – dispatcher is in the process of terminatingv ACCEPT – dispatcher is accepting connectionsv REFUSE – dispatcher is rejecting connections
NumberOfMessagesThe number of key messages in the <MessageStatus> state.
QueueNameThe name of the specified queue.
QueueOwnerThe username of the queue owner.
This indication has the following thresholds:v Maximum Number of Messages
For more information about these thresholds, see “Thresholds” on page 29.
The following table describes the default settings for this indication.
Setting Default value
Send indications to Tivoli Enterprise Console Yes
Send indications to Tivoli Business SystemsManager
Yes
Occurrences 1
Holes 0
Associated tasks and built-in actions None
Note: If you have Tivoli Business Systems Manager configured for your systems,Tivoli Enterprise Console automatically forwards events to Tivoli BusinessSystems Manager. Do not change the configuration of the indication to sendevents to Tivoli Business Systems Manager.
High Total Ready Message Waiting Time In Days indicationOccurs when the total ready message waiting time in days exceeds the specifiedthreshold. When the indication occurs often enough to trigger an event, the eventdelivers a message to the Tivoli Enterprise Console in the following format:<application_label>: The number of messages in the READY state that have beenwaiting an inordinate amount of time for the Oracle Queue<QueueOwner>.<QueueName> on database <DatabaseName>has crossed above the predefined threshold <Threshold> days and is currentlyat <TotalReadyWait>.
If you have Tivoli Business Systems Manager configured for your system, TivoliEnterprise Console forwards the message to Tivoli Business Systems Manager.
You can check the health of this resource model in the IBM Tivoli Monitoring WebHealth Console. For more information, see the IBM Tivoli Monitoring Web HealthConsole documentation.
The indication has the following attributes:
DatabaseNameThe name of an Oracle database. The database name contains up to 8
24 IBM Tivoli Monitoring for Databases: Oracle: Reference Guide

characters and corresponds to the name specified in the CREATEDATABASE statement and identified in the DB_NAME parameter in thedatabase initialization parameter file.
QueueNameThe name of the specified queue.
QueueOwnerThe username of the queue owner.
TotalReadyWaitThe total wait time for all READY messages in the queue.
This indication has the following thresholds:v Maximum Total Ready Waiting Time
For more information about these thresholds, see “Thresholds” on page 29.
The following table describes the default settings for this indication.
Setting Default value
Send indications to Tivoli Enterprise Console Yes
Send indications to Tivoli Business SystemsManager
Yes
Occurrences 1
Holes 0
Associated tasks and built-in actions None
Note: If you have Tivoli Business Systems Manager configured for your systems,Tivoli Enterprise Console automatically forwards events to Tivoli BusinessSystems Manager. Do not change the configuration of the indication to sendevents to Tivoli Business Systems Manager.
High Total Ready Message Waiting Time In Hours indicationOccurs when the total ready message waiting time in hours exceeds the specifiedthreshold. When the indication occurs often enough to trigger an event, the eventdelivers a message to the Tivoli Enterprise Console in the following format:<application_label>: The number of messages in the READY state that have beenwaiting an inordinate amount of time for the Oracle Queue<QueueOwner>.<QueueName> on database <DatabaseName> hascrossed above the predefined threshold <Threshold> hours and is currentlyat <TotalReadyWait>.
If you have Tivoli Business Systems Manager configured for your system, TivoliEnterprise Console forwards the message to Tivoli Business Systems Manager.
You can check the health of this resource model in the IBM Tivoli Monitoring WebHealth Console. For more information, see the IBM Tivoli Monitoring Web HealthConsole documentation.
The indication has the following attributes:
DatabaseNameThe name of an Oracle database. The database name contains up to 8characters and corresponds to the name specified in the CREATEDATABASE statement and identified in the DB_NAME parameter in thedatabase initialization parameter file.
Chapter 2. Resource models 25

QueueNameThe name of the specified queue.
QueueOwnerThe username of the queue owner.
TotalReadyWaitThe total wait time for all READY messages in the queue.
This indication has the following thresholds:v Maximum Total Ready Waiting Time
For more information about these thresholds, see “Thresholds” on page 29.
The following table describes the default settings for this indication.
Setting Default value
Send indications to Tivoli Enterprise Console Yes
Send indications to Tivoli Business SystemsManager
Yes
Occurrences 1
Holes 0
Associated tasks and built-in actions None
Note: If you have Tivoli Business Systems Manager configured for your systems,Tivoli Enterprise Console automatically forwards events to Tivoli BusinessSystems Manager. Do not change the configuration of the indication to sendevents to Tivoli Business Systems Manager.
High Total Ready Message Waiting Time In Minutes indicationOccurs when the total ready message waiting time in minutes exceeds the specifiedthreshold. When the indication occurs often enough to trigger an event, the eventdelivers a message to the Tivoli Enterprise Console in the following format:<application_label>: The number of messages in the READY state that have beenwaiting an inordinate amount of time for the Oracle Queue<QueueOwner>.<QueueName> on database <DatabaseName>has crossed above the predefined threshold <Threshold> minutes and is currentlyat <TotalReadyWait>.
If you have Tivoli Business Systems Manager configured for your system, TivoliEnterprise Console forwards the message to Tivoli Business Systems Manager.
You can check the health of this resource model in the IBM Tivoli Monitoring WebHealth Console. For more information, see the IBM Tivoli Monitoring Web HealthConsole documentation.
The indication has the following attributes:
DatabaseNameThe name of an Oracle database. The database name contains up to 8characters and corresponds to the name specified in the CREATEDATABASE statement and identified in the DB_NAME parameter in thedatabase initialization parameter file.
QueueNameThe name of the specified queue.
26 IBM Tivoli Monitoring for Databases: Oracle: Reference Guide

QueueOwnerThe username of the queue owner.
TotalReadyWaitThe total wait time for all READY messages in the queue.
This indication has the following thresholds:v Maximum Total Ready Waiting Time
For more information about these thresholds, see “Thresholds” on page 29.
The following table describes the default settings for this indication.
Setting Default value
Send indications to Tivoli Enterprise Console Yes
Send indications to Tivoli Business SystemsManager
Yes
Occurrences 1
Holes 0
Associated tasks and built-in actions None
Note: If you have Tivoli Business Systems Manager configured for your systems,Tivoli Enterprise Console automatically forwards events to Tivoli BusinessSystems Manager. Do not change the configuration of the indication to sendevents to Tivoli Business Systems Manager.
High Total Ready Message Waiting Time In Seconds indicationOccurs when the total ready message waiting time in seconds exceeds the specifiedthreshold. When the indication occurs often enough to trigger an event, the eventdelivers a message to the Tivoli Enterprise Console in the following format:<application_label>: The number of messages in the READY state that have beenwaiting an inordinate amount of time for the Oracle Queue<QueueOwner>.<QueueName> on database<DatabaseName> has crossed above the predefined threshold<Threshold> seconds and is currently at <TotalReadyWait>.
If you have Tivoli Business Systems Manager configured for your system, TivoliEnterprise Console forwards the message to Tivoli Business Systems Manager.
You can check the health of this resource model in the IBM Tivoli Monitoring WebHealth Console. For more information, see the IBM Tivoli Monitoring Web HealthConsole documentation.
The indication has the following attributes:
DatabaseNameThe name of an Oracle database. The database name contains up to 8characters and corresponds to the name specified in the CREATEDATABASE statement and identified in the DB_NAME parameter in thedatabase initialization parameter file.
QueueNameThe name of the specified queue.
QueueOwnerThe username of the queue owner.
Chapter 2. Resource models 27

TotalReadyWaitThe total wait time for all READY messages in the queue.
This indication has the following thresholds:v Maximum Total Ready Waiting Time
For more information about these thresholds, see “Thresholds” on page 29.
The following table describes the default settings for this indication.
Setting Default value
Send indications to Tivoli Enterprise Console Yes
Send indications to Tivoli Business SystemsManager
Yes
Occurrences 1
Holes 0
Associated tasks and built-in actions None
Note: If you have Tivoli Business Systems Manager configured for your systems,Tivoli Enterprise Console automatically forwards events to Tivoli BusinessSystems Manager. Do not change the configuration of the indication to sendevents to Tivoli Business Systems Manager.
Low Average Message Propagation Rate indicationOccurs when the average message propagation rate is lower than the specifiedthreshold. When the indication occurs often enough to trigger an event, the eventdelivers a message to the Tivoli Enterprise Console in the following format:<application_label>: The number of bytes-per-second that have been propagatedover the Oracle Queue <QueueOwner>.<QueueName> ondatabase <DatabaseName> has crossed below the predefined threshold<Threshold> and is currently at<AverageMessagePropagationRate> bytes-per-second.
If you have Tivoli Business Systems Manager configured for your system, TivoliEnterprise Console forwards the message to Tivoli Business Systems Manager.
You can check the health of this resource model in the IBM Tivoli Monitoring WebHealth Console. For more information, see the IBM Tivoli Monitoring Web HealthConsole documentation.
The indication has the following attributes:
AverageMessagePropagationRateThe average propagation rate for the queue. The propagation rate is thetotal number of bytes propagated in this schedule divided by the totaltime, in seconds, spent by the system in executing this schedule.
DatabaseNameThe name of an Oracle database. The database name contains up to 8characters and corresponds to the name specified in the CREATEDATABASE statement and identified in the DB_NAME parameter in thedatabase initialization parameter file.
QueueNameThe name of the specified queue.
28 IBM Tivoli Monitoring for Databases: Oracle: Reference Guide

QueueOwnerThe username of the queue owner.
This indication has the following thresholds:v Minimum Average Message Propagation Rate Threshold
For more information about these thresholds, see “Thresholds” on page 29.
The following table describes the default settings for this indication.
Setting Default value
Send indications to Tivoli Enterprise Console Yes
Send indications to Tivoli Business SystemsManager
Yes
Occurrences 1
Holes 0
Associated tasks and built-in actions None
Note: If you have Tivoli Business Systems Manager configured for your systems,Tivoli Enterprise Console automatically forwards events to Tivoli BusinessSystems Manager. Do not change the configuration of the indication to sendevents to Tivoli Business Systems Manager.
ThresholdsThe following table lists the thresholds that can be set for the Advanced Queueresource model. For each threshold it shows the name, a short description, and thedefault value:
Threshold Description Defaultvalue
Maximum MessagePropagation Error Count
An indication occurs when the number ofmessages that could not be propagated and wererecorded as errors exceeds this value.
1
Maximum AverageReady Waiting Time
An indication occurs when the number of days,hours, minutes, or seconds that the average timeREADY messages have been waiting in a queueexceeds this value.
1
Maximum Number ofMessages
An indication occurs when the number ofmessages with the specified Message Statusexceeds this value.
100
Maximum Total ReadyWaiting Time
An indication occurs when the number of days,hours, minutes, or seconds that the total timeREADY messages have been waiting in a queueexceeds this value.
1
Minimum AverageMessage PropagationRate Threshold
An indication occurs when the number ofbytes-per-second that have been propagated overa queue is lower than this value.
7000
Chapter 2. Resource models 29

Parameters
Note: A plus symbol (+) denotes parameters that feature selective logging.Selective logging enables you to choose metrics/properties that you want tolog. The selective logging metrics are listed in the value field of theParameters window.
The following table lists the parameters that can be set for the Advanced Queueresource model. The table shows the name, a short description, and the defaultvalue for each parameter:
Parameter Description Default value
Message Status Specifies the appropriate message statusthat the resource model monitors.
EXPIRED
Queue Name Specifies the schema and queue to bemonitored, separated by a period(scott.MESSAGE_QUEUE_1). You canalso enter a queue name only(MESSAGE_QUEUE_1) or leave thefield blank to execute the resourcemodel on all the queues in thedatabase.
None
Time Interval This interval can be set for days, hours,minutes, or seconds.
Days
Queue Metrics+
Select the metrics you want to log. Seethe following logging table for adescription of each metric.
Average Ready Message WaitingTime In Days
Average Ready Message WaitingTime In Hours
Average Ready Message WaitingTime In Minutes
Average Ready Message WaitingTime In Seconds
Expired
Ready
Total Ready Message WaitingTime In Days
Total Ready Message WaitingTime In Hours
Total Ready Message WaitingTime In Minutes
Total Ready Message WaitingTime In Seconds
Waiting
30 IBM Tivoli Monitoring for Databases: Oracle: Reference Guide

Parameter Description Default value
QueueScheduleMetrics +
Select the metrics you want to log. Seethe following logging table for adescription of each metric.
Failures
Last Error Date
Last Error Message
Last Error Time
Message Propagation Rate
Tasks and built-in actionsNone
LoggingYou can log data for the properties of the managed resource listed in the followingtable. The table shows the context of the managed resource and the properties thatthe resource model logs for the IBM Tivoli Monitoring Web Health Console.
Chapter 2. Resource models 31

Managedresource
Context Properties
OracleQueue MessageQueue AverageReadyMessageWaitingTimeInDays
The average wait time in days of all READYmessages in the queue.
AverageReadyMessageWaitingTimeInHoursThe average wait time in hours of all READYmessages in the queue.
AverageReadyMessageWaitingTimeInMinutesThe average wait time in minutes of all READYmessages in the queue.
AverageReadyMessageWaitingTimeInSecondsThe average wait time in seconds of all READYmessages in the queue.
ExpiredThe number of queue messages in the EXPIREDstate.
OracleDatabase.DatabaseName*The name of an Oracle database.
QueueName*The name of the specified queue.
QueueOwner*The username of the queue owner.
Ready The number of queue messages in the READYstate.
TotalReadyMessageWaitingTimeInDaysThe total wait time in days for all READYmessages in the queue.
TotalReadyMessageWaitingTimeInHoursThe total wait time in hours for all READYmessages in the queue.
TotalReadyMessageWaitingTimeInMinutesThe total wait time in minutes for all READYmessages in the queue.
TotalReadyMessageWaitingTimeInSecondsThe total wait time in seconds for all READYmessages in the queue.
WaitingThe number of queue messages in the stateWAITING state.
32 IBM Tivoli Monitoring for Databases: Oracle: Reference Guide

Managedresource
Context Properties
OracleQueueSchedule
MessageQueue Destination*
The destination name for the queue. This name iscurrently limited to be a DBLINK name.
FailuresThe number of times the execution failed. If thisnumber is 16, the schedule will be disabled.
MessagePropagationRateThe message propagation rate for the queue. Thepropagation rate is the total number of bytespropagated in this schedule divided by the totaltime, in seconds, spent by the system inexecuting this schedule.
LastErrorDateThe date of the most recent unsuccessfulexecution.
LastErrorMsgThe error number and error message text for themost recent unsuccessful execution.
LastErrorTimeThe time of the most recent unsuccessfulexecution.
OracleDatabase.DatabaseName*The name of an Oracle database.
OracleQueue.QueueName*The name of the specified queue.
OracleQueue.QueueOwner*The username of the queue owner.
Note: An asterisk (*) denotes a key property.
Return codesTable 2 on page 7 contains a listing of resource model return codes, theirdescription, and what action you can take to resolve each code. The return codenumber is displayed in the IBM Tivoli Monitoring Web Health Console status field,or by using the wdmlseng command.
CLI examplewdmeditprf -P OracleProfile#tme-region -add OracleAdvancedQueue -c 300 \-Log -LogDisable -p 12:00 -Agg no -ap 00:15 -NoMin -NoMax -Avg \-t Oracle_Maximum_AverageReadyWaitingTime 1.000000 \-t Oracle_Maximum_MessagePropagationErrorCount 1.000000 \-t Oracle_Maximum_NumberOfMessages 100.000000 \-t Oracle_Maximum_TotalReadyWaitingTime 1.000000 \-t Oracle_Minimum_AverageMessagePropagationRate 7000.000000 \-AddPar QueueScheduleMetrics "numMessagePropagationRate" \-AddPar QueueScheduleMetrics "numFailures" \-AddPar QueueScheduleMetrics "strLastErrorDate" \-AddPar QueueScheduleMetrics "strLastErrorTime" \-AddPar QueueScheduleMetrics "strLastErrorMsg" \-AddPar QueueMetrics "numTotalReadyMessageWaitingTime" \-AddPar QueueMetrics "numReady" \-AddPar QueueMetrics "numWaiting" \
Chapter 2. Resource models 33

-AddPar QueueMetrics "numExpired" \-AddPar QueueMetrics "numAverageReadyMessageWaitingTimeInSeconds" \-AddPar QueueMetrics "numAverageReadyMessageWaitingTimeInMinutes" \-AddPar QueueMetrics "numAverageReadyMessageWaitingTimeInHours" \-AddPar QueueMetrics "numAverageReadyMessageWaitingTimeInDays" \-AddPar Name "schema_name.MESSAGE_QUEUE_1" \-AddPar TimeInterval "Days" \-AddPar MessageStatus "READY" \-e Oracle_High_AverageReadyMessageWaitingTimeInMinutes \-o 1 -h 0 -severity CRITICAL -SendTBSM -SendTec \-e Oracle_High_AverageReadyMessageWaitingTimeInDays \-o 1 -h 0 -severity CRITICAL -SendTBSM -SendTec \-e Oracle_High_TotalReadyMessageWaitingTimeInSeconds \-o 1 -h 0 -severity CRITICAL -SendTBSM -SendTec \-e Oracle_High_TotalReadyMessageWaitingTimeInHours \-o 1 -h 0 -severity CRITICAL -SendTBSM -SendTec \-e Oracle_High_MessagePropagationErrorCount \-o 1 -h 0 -severity CRITICAL -SendTBSM -SendTec \-e Oracle_High_TotalReadyMessageWaitingTimeInMinutes \-o 1 -h 0 -severity CRITICAL -SendTBSM -SendTec \-e Oracle_High_TotalReadyMessageWaitingTimeInDays \-o 1 -h 0 -severity CRITICAL -SendTBSM -SendTec \-e Oracle_Low_AverageMessagePropagationRate \-o 1 -h 0 -severity CRITICAL -SendTBSM -SendTec \-e Oracle_High_AverageReadyMessageWaitingTimeInSeconds \-o 1 -h 0 -severity CRITICAL -SendTBSM -SendTec \-e Oracle_High_AverageReadyMessageWaitingTimeInHours \-o 1 -h 0 -severity CRITICAL -SendTBSM -SendTec \-e Oracle_High_NumberOfMessages \-o 1 -h 0 -severity CRITICAL -SendTBSM -SendTec
34 IBM Tivoli Monitoring for Databases: Oracle: Reference Guide
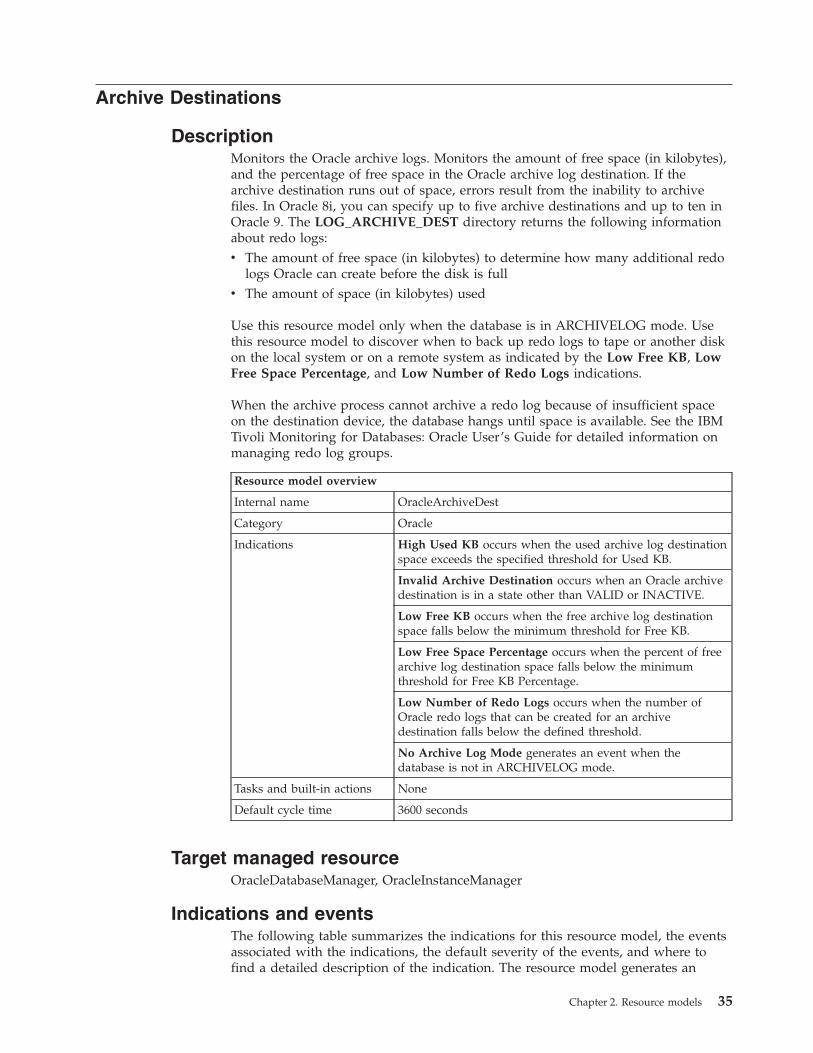
Archive Destinations
DescriptionMonitors the Oracle archive logs. Monitors the amount of free space (in kilobytes),and the percentage of free space in the Oracle archive log destination. If thearchive destination runs out of space, errors result from the inability to archivefiles. In Oracle 8i, you can specify up to five archive destinations and up to ten inOracle 9. The LOG_ARCHIVE_DEST directory returns the following informationabout redo logs:v The amount of free space (in kilobytes) to determine how many additional redo
logs Oracle can create before the disk is fullv The amount of space (in kilobytes) used
Use this resource model only when the database is in ARCHIVELOG mode. Usethis resource model to discover when to back up redo logs to tape or another diskon the local system or on a remote system as indicated by the Low Free KB, LowFree Space Percentage, and Low Number of Redo Logs indications.
When the archive process cannot archive a redo log because of insufficient spaceon the destination device, the database hangs until space is available. See the IBMTivoli Monitoring for Databases: Oracle User’s Guide for detailed information onmanaging redo log groups.
Resource model overview
Internal name OracleArchiveDest
Category Oracle
Indications High Used KB occurs when the used archive log destinationspace exceeds the specified threshold for Used KB.
Invalid Archive Destination occurs when an Oracle archivedestination is in a state other than VALID or INACTIVE.
Low Free KB occurs when the free archive log destinationspace falls below the minimum threshold for Free KB.
Low Free Space Percentage occurs when the percent of freearchive log destination space falls below the minimumthreshold for Free KB Percentage.
Low Number of Redo Logs occurs when the number ofOracle redo logs that can be created for an archivedestination falls below the defined threshold.
No Archive Log Mode generates an event when thedatabase is not in ARCHIVELOG mode.
Tasks and built-in actions None
Default cycle time 3600 seconds
Target managed resourceOracleDatabaseManager, OracleInstanceManager
Indications and eventsThe following table summarizes the indications for this resource model, the eventsassociated with the indications, the default severity of the events, and where tofind a detailed description of the indication. The resource model generates an
Chapter 2. Resource models 35

event when the threshold you specify for the indication is triggered.
Indication Generated event Defaultseverity
Clearingevents
Page
High Used KB Oracle_High_UsedKB Critical Yes 36
Invalid ArchiveDestination
Oracle_Invalid_ArchiveDestination Critical Yes 38
Low Free KB Oracle_Low_FreeKB Critical Yes 39
Low Numberof Redo Logs
Oracle_Low_NumberRedoLogs Critical Yes 43
Low FreeSpacePercentage
Oracle_Low_FreeSpacePercentage Critical Yes 41
No ArchiveLog Mode
Oracle_NotArchiving_LogMode Critical Yes 45
High Used KB indicationOccurs when the used archive log destination space in KB exceeds the thresholdfor Used KB. When the indication occurs often enough to trigger an event, theevent delivers a message to the Tivoli Enterprise Console in the following format:<application_label>: The used space (KB) for the archive destination<DestID> on Oracle instance <InstanceName> has crossed above thepredefined threshold of <Threshold> KB and is currently at <UsedKBytes> KB.
If you have Tivoli Business Systems Manager configured for your system, TivoliEnterprise Console forwards the message to Tivoli Business Systems Manager.
You can check the health of this resource model in the IBM Tivoli Monitoring WebHealth Console. For more information, see the IBM Tivoli Monitoring Web HealthConsole documentation.
If the percentage of free space on an archive destination is greater than theMaximum Used Space in KB threshold, consider doing one of the following:v Change the archive destination by modifying either the LOG_ARCHIVE_DEST
or LOG_ARCHIVE_DEST_n initialization parameterv Move archive logs from that destination to another devicev Add disk space to the alerting destination
The indication has the following attributes:
BindingReturns one of the following requirements for success: MANDATORY(must succeed), or OPTIONAL (need not succeed, depending onLOG_ARCHIVE_MIS_SUCCEED_DEST).
DestIDThe archive destination identifier.
DestinationThe actual file or directory where the archive is stored.
Error The text of any last error.
FailBlockAny block number at last error.
36 IBM Tivoli Monitoring for Databases: Oracle: Reference Guide

FailDateThe date and time of any last error.
FailSequenceAny log sequence number at last error.
FreeKBytesAny unallocated space on the archive destination device.
FreeSpacePercentagePercentage of unallocated space to the total capacity for the archivedestination device.
InstanceNameThe name of an Oracle database instance. The instance name is identifiedby the INSTANCE_NAME parameter in the database initializationparameter file and corresponds to the Oracle System Identifier (SID) of theinstance.
MountPointThe file system directory that contains the data contents of a particulardrive. For example, /data.
NameSpaceOne of the following: SYSTEM is a system definition. SESSION is a sessiondefinition.
ArchivingStatusThe current status of the archive destination as one of the following:v VALID — initialized and availablev INACTIVE — no destination informationv DEFERRED — disabled manually by the userv ERROR — error during open or copyv DISABLED — disabled after errorv BAD PARAM — parameter has errors
Target Identifies the target. PRIMARY will copy to primary. STANDBY will copyto standby.
TotalKBytesThe total capacity (in kilobytes) for the archive destination device.
UsedKBytesSpace (in kilobytes) of the archive destination device that is currently inuse.
This indication has the following threshold:v Maximum Used Space in KB
For more information about this threshold, see “Thresholds” on page 46.
The following table describes the default settings for this indication.
Setting Default value
Send indications to Tivoli Enterprise Console Yes
Send indications to Tivoli Business SystemsManager
Yes
Occurrences 1
Chapter 2. Resource models 37

Setting Default value
Holes 0
Associated tasks and built-in actions None
Note: If you have Tivoli Business Systems Manager configured for your systems,Tivoli Enterprise Console automatically forwards events to Tivoli BusinessSystems Manager. Do not change the configuration of the indication to sendevents to Tivoli Business Systems Manager.
Invalid Archive Destination indicationOccurs when an Oracle Archive Destination is in a state other than VALID orINACTIVE. When the indication occurs often enough to trigger an event, the eventdelivers a message to the Tivoli Enterprise Console in the following format:<application_label>: The Archive Destination <DestID> for Oracle Instance<InstanceName> has status of <ArchivingStatus>. Error = <Error>.
If you have Tivoli Business Systems Manager configured for your system, TivoliEnterprise Console forwards the message to Tivoli Business Systems Manager.
You can check the health of this resource model in the IBM Tivoli Monitoring WebHealth Console. For more information, see the IBM Tivoli Monitoring Web HealthConsole documentation.
You can change the state of the current Oracle archive destination or the archivedestination by modifying either the LOG_ARCHIVE_DEST orLOG_ARCHIVE_DEST_n initialization parameter.
The indication has the following attributes:
BindingReturns one of the following requirements for success: MANDATORY(must succeed), or OPTIONAL (need not succeed, depending onLOG_ARCHIVE_MIS_SUCCEED_DEST).
DestIDThe archive destination identifier.
DestinationThe actual file or directory where the archive is stored.
Error The text of any last error.
FailBlockAny block number at last error.
FailDateThe date and time of any last error.
FailSequenceAny log sequence number at last error.
FreeKBytesAny unallocated space on the archive destination device.
FreeSpacePercentagePercentage of unallocated space to the total capacity for the archivedestination device.
38 IBM Tivoli Monitoring for Databases: Oracle: Reference Guide

InstanceNameThe name of an Oracle database instance. The instance name is identifiedby the INSTANCE_NAME parameter in the database initializationparameter file and corresponds to the Oracle System Identifier (SID) of theinstance.
MountPointThe file system directory that contains the data contents of a particulardrive. For example, /data.
NameSpaceOne of the following: SYSTEM is a system definition. SESSION is a sessiondefinition.
ArchivingStatusThe current status of the archive destination as one of the following:v VALID — initialized and availablev INACTIVE — no destination informationv DEFERRED — disabled manually by the userv ERROR — error during open or copyv DISABLED — disabled after errorv BAD PARAM — parameter has errors
Target Identifies the target. PRIMARY will copy to primary. STANDBY will copyto standby.
TotalKBytesThe total capacity (in kilobytes) for the archive destination device.
This indication has no thresholds.
The following table describes the default settings for this indication.
Setting Default value
Send indications to Tivoli Enterprise Console Yes
Send indications to Tivoli Business SystemsManager
Yes
Occurrences 1
Holes 0
Associated tasks and built-in actions None
Note: If you have Tivoli Business Systems Manager configured for your systems,Tivoli Enterprise Console automatically forwards events to Tivoli BusinessSystems Manager. Do not change the configuration of the indication to sendevents to Tivoli Business Systems Manager.
Low Free KB indicationOccurs when the free archive log destination space in KB falls below the minimumthreshold for Free KB. When the indication occurs often enough to trigger anevent, the event delivers a message to the Tivoli Enterprise Console in thefollowing format:<application_label>: The free space (KB) for the archive destination<DestID> on Oracle instance <InstanceName> has crossed below thepredefined threshold of <Threshold> KB and is currentlyat <FreeKBytes> KB.
Chapter 2. Resource models 39

If you have Tivoli Business Systems Manager configured for your system, TivoliEnterprise Console forwards the message to Tivoli Business Systems Manager.
You can check the health of this resource model in the IBM Tivoli Monitoring WebHealth Console. For more information, see the IBM Tivoli Monitoring Web HealthConsole documentation.
If the percentage of free space on an archive destination is less than the MinimumFree Space Percentage threshold, consider doing one of the following:v Change the archive destination by modifying the LOG_ARCHIVE_DEST_n
initialization parameterv Move archive logs from that destination to another devicev Add disk space to the alerting destination
The indication has the following attributes:
BindingReturns one of the following requirements for success: MANDATORY(must succeed), or OPTIONAL (need not succeed, depending onLOG_ARCHIVE_MIS_SUCCEED_DEST).
DestIDThe archive destination identifier.
DestinationThe actual file or directory where the archive is stored.
Error The text of any last error.
FailBlockAny block number at last error.
FailDateThe date and time of any last error.
FailSequenceAny log sequence number at last error.
FreeKBytesAny unallocated space on the archive destination device.
FreeSpacePercentagePercentage of unallocated space to the total capacity for the archivedestination device.
InstanceNameThe name of an Oracle database instance. The instance name is identifiedby the INSTANCE_NAME parameter in the database initializationparameter file and corresponds to the Oracle System Identifier (SID) of theinstance.
MountPointThe file system directory that contains the data contents of a particulardrive. For example, /data.
NameSpaceOne of the following: SYSTEM is a system definition. SESSION is a sessiondefinition.
ArchivingStatusThe current status of the archive destination as one of the following:
40 IBM Tivoli Monitoring for Databases: Oracle: Reference Guide

v VALID — initialized and availablev INACTIVE — no destination informationv DEFERRED — disabled manually by the userv ERROR — error during open or copyv DISABLED — disabled after errorv BAD PARAM — parameter has errors
Target Identifies the target. PRIMARY will copy to primary. STANDBY will copyto standby.
ThresholdThe specified minimum value for free space.
TotalKBytesThe total capacity (in kilobytes) for the archive destination device.
UsedKBytesSpace (in kilobytes) of the archive destination device that is currently inuse.
This indication has the following threshold:v Minimum Free Space in KB
For more information about this threshold, see “Thresholds” on page 46.
The following table describes the default settings for this indication.
Setting Default value
Send indications to Tivoli Enterprise Console Yes
Send indications to Tivoli Business SystemsManager
Yes
Occurrences 1
Holes 0
Associated tasks and built-in actions None
Note: If you have Tivoli Business Systems Manager configured for your systems,Tivoli Enterprise Console automatically forwards events to Tivoli BusinessSystems Manager. Do not change the configuration of the indication to sendevents to Tivoli Business Systems Manager.
Low Free Space Percentage indicationOccurs when the percent of free archive log destination space falls below theminimum threshold for Free KB Percentage. When the indication occurs oftenenough to trigger an event, the event delivers a message to the Tivoli EnterpriseConsole in the following format:<application_label>: The free space percentage for the Oracle archive destination<DestID> on Oracle Instance <InstanceName> has crossedbelow the threshold of <Threshold> percent and is currently at<FreeSpacePercentage> percent.
If you have Tivoli Business Systems Manager configured for your system, TivoliEnterprise Console forwards the message to Tivoli Business Systems Manager.
Chapter 2. Resource models 41
You can check the health of this resource model in the IBM Tivoli Monitoring WebHealth Console. For more information, see the IBM Tivoli Monitoring Web HealthConsole documentation.
If the percentage of free space on an archive destination is less than the MinimumFree Space Percentage threshold, consider doing one of the following:v Change the archive destination by modifying the LOG_ARCHIVE_DEST_n
initialization parameterv Move archive logs from that destination to another devicev Add disk space to the alerting destination
The indication has the following attributes:
BindingReturns one of the following requirements for success: MANDATORY(must succeed), or OPTIONAL (need not succeed, depending onLOG_ARCHIVE_MIS_SUCCEED_DEST).
DestIDThe archive destination identifier.
DestinationThe actual file or directory where the archive is stored.
Error The text of any last error.
FailBlockAny block number at last error.
FailDateThe date and time of any last error.
FailSequenceAny log sequence number at last error.
FreeSpacePercentagePercentage of unallocated space to the total capacity for the archivedestination device.
FreeKBytesAny unallocated space on the archive destination device.
InstanceNameThe name of an Oracle database instance. The instance name is identifiedby the INSTANCE_NAME parameter in the database initializationparameter file and corresponds to the Oracle System Identifier (SID) of theinstance.
MountPointThe file system directory that contains the data contents of a particulardrive. For example, /data.
NameSpaceOne of the following: SYSTEM is a system definition. SESSION is a sessiondefinition.
ArchivingStatusThe current status of the archive destination as one of the following:v VALID — initialized and availablev INACTIVE — no destination informationv DEFERRED — disabled manually by the user
42 IBM Tivoli Monitoring for Databases: Oracle: Reference Guide
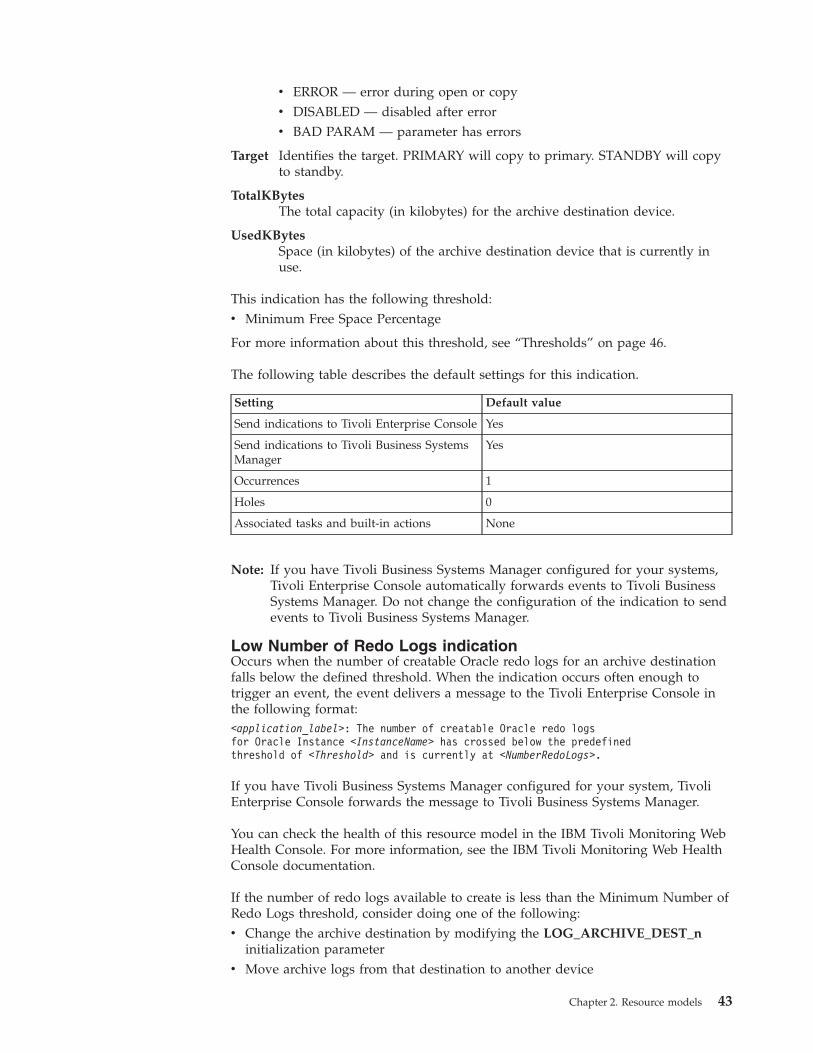
v ERROR — error during open or copyv DISABLED — disabled after errorv BAD PARAM — parameter has errors
Target Identifies the target. PRIMARY will copy to primary. STANDBY will copyto standby.
TotalKBytesThe total capacity (in kilobytes) for the archive destination device.
UsedKBytesSpace (in kilobytes) of the archive destination device that is currently inuse.
This indication has the following threshold:v Minimum Free Space Percentage
For more information about this threshold, see “Thresholds” on page 46.
The following table describes the default settings for this indication.
Setting Default value
Send indications to Tivoli Enterprise Console Yes
Send indications to Tivoli Business SystemsManager
Yes
Occurrences 1
Holes 0
Associated tasks and built-in actions None
Note: If you have Tivoli Business Systems Manager configured for your systems,Tivoli Enterprise Console automatically forwards events to Tivoli BusinessSystems Manager. Do not change the configuration of the indication to sendevents to Tivoli Business Systems Manager.
Low Number of Redo Logs indicationOccurs when the number of creatable Oracle redo logs for an archive destinationfalls below the defined threshold. When the indication occurs often enough totrigger an event, the event delivers a message to the Tivoli Enterprise Console inthe following format:<application_label>: The number of creatable Oracle redo logsfor Oracle Instance <InstanceName> has crossed below the predefinedthreshold of <Threshold> and is currently at <NumberRedoLogs>.
If you have Tivoli Business Systems Manager configured for your system, TivoliEnterprise Console forwards the message to Tivoli Business Systems Manager.
You can check the health of this resource model in the IBM Tivoli Monitoring WebHealth Console. For more information, see the IBM Tivoli Monitoring Web HealthConsole documentation.
If the number of redo logs available to create is less than the Minimum Number ofRedo Logs threshold, consider doing one of the following:v Change the archive destination by modifying the LOG_ARCHIVE_DEST_n
initialization parameterv Move archive logs from that destination to another device
Chapter 2. Resource models 43

v Add disk space to the alerting destination
The indication has the following attributes:
BindingReturns one of the following requirements for success: MANDATORY(must succeed), or OPTIONAL (need not succeed, depending onLOG_ARCHIVE_MIS_SUCCEED_DEST).
DestIDThe archive destination identifier.
DestinationThe actual file or directory where the archive is stored.
Error The text of any last error.
FailBlockAny block number at last error.
FailDateThe date and time of any last error.
FailSequenceAny log sequence number at last error.
FreeKBytesAny unallocated space on the archive destination device.
FreeSpacePercentagePercentage of unallocated space to the total capacity for the archivedestination device.
InstanceNameThe name of an Oracle database instance. The instance name is identifiedby the INSTANCE_NAME parameter in the database initializationparameter file and corresponds to the Oracle System Identifier (SID) of theinstance.
MountPointThe file system directory that contains the data contents of a particulardrive. For example, /data.
NameSpaceOne of the following: SYSTEM is a system definition. SESSION is a sessiondefinition.
NumberRedoLogsNumber of redo logs which can be archived in the available archivedestination space.
ArchivingStatusThe current status of the archive destination as one of the following:v VALID — initialized and availablev INACTIVE — no destination informationv DEFERRED — disabled manually by the userv ERROR — error during open or copyv DISABLED — disabled after errorv BAD PARAM — parameter has errors
Target Identifies the target. PRIMARY will copy to primary. STANDBY will copyto standby.
44 IBM Tivoli Monitoring for Databases: Oracle: Reference Guide

TotalKBytesThe total capacity (in kilobytes) for the archive destination device.
UsedKBytesSpace (in kilobytes) of the archive destination device that is currently inuse.
This indication has the following threshold:v Minimum Number of Redo Logs
For more information about this threshold, see “Thresholds” on page 46.
The following table describes the default settings for this indication.
Setting Default value
Send indications to Tivoli Enterprise Console Yes
Send indications to Tivoli Business SystemsManager
Yes
Occurrences 1
Holes 0
Associated tasks and built-in actions None
Note: If you have Tivoli Business Systems Manager configured for your systems,Tivoli Enterprise Console automatically forwards events to Tivoli BusinessSystems Manager. Do not change the configuration of the indication to sendevents to Tivoli Business Systems Manager.
No Archive Log Mode indicationOccurs when the Oracle archive destination is not archiving. When the indicationoccurs often enough to trigger an event, the event delivers a message to the TivoliEnterprise Console in the following format:<application_label>: The Oracle Archive Destination is not archiving.
If you have Tivoli Business Systems Manager configured for your system, TivoliEnterprise Console forwards the message to Tivoli Business Systems Manager.
You can check the health of this resource model in the IBM Tivoli Monitoring WebHealth Console. For more information, see the IBM Tivoli Monitoring Web HealthConsole documentation.
The indication has the following attributes:
DatabaseNameThe name of an Oracle database. The database name contains up to 8characters and corresponds to the name specified in the CREATEDATABASE statement and identified in the DB_NAME parameter in thedatabase initialization parameter file.
LogModeSpecifies which archive log mode the database is running, eitherARCHIVELOG, or NOARCHIVELOG.
This indication has no thresholds.
Chapter 2. Resource models 45

The following table describes the default settings for this indication.
Setting Default value
Send indications to Tivoli Enterprise Console Yes
Send indications to Tivoli Business SystemsManager
Yes
Occurrences 1
Holes 0
Associated tasks and built-in actions None
Note: If you have Tivoli Business Systems Manager configured for your systems,Tivoli Enterprise Console automatically forwards events to Tivoli BusinessSystems Manager. Do not change the configuration of the indication to sendevents to Tivoli Business Systems Manager.
ThresholdsThe following table lists the thresholds that can be set for the Archive Destinationsresource model. For each threshold it shows the name, a short description, and thedefault value:
Threshold Description Defaultvalue
Maximum Used Space inKB
An indication occurs if the acceptable limit ofused space in KB for the Oracle Archive Logdestination mount point exceeds this value.
1024000000*
Minimum Free Space inKB
An indication occurs if the acceptable limit of freespace in KB for the Oracle Archive Logdestination mount point is lower than this value.
5120
Minimum Number ofRedo Logs
An indication occurs if the number of redo logsthat can still be created on the Oracle ArchiveLog destination mount point is lower than thisvalue.
5
Minimum Free SpacePercentage
An indication occurs if the acceptable limit of freespace percentage for the Oracle Archive Logdestination mount point is lower than this value.
15
* Note: The default value for the Maximum Used Space in KB threshold is set artificiallyhigh. Reset this value for a lower value to use this monitoring metric.
Parameters
Note: A plus symbol (+) denotes parameters that feature selective logging.Selective logging enables you to choose metrics/properties that you want tolog. The selective logging metrics are listed in the value field of theParameters window.
The following table lists the parameter that can be set for the Archive Destinationresource model. The table shows the name, a short description, and the defaultvalue for each parameter:
46 IBM Tivoli Monitoring for Databases: Oracle: Reference Guide

Parameter Description Default value
LoggingOptions +
Select the metrics you want to log. Seethe following logging table for adescription of each metric.
Binding
Free KBytes
Free Space Percentage
Log Mode
Number of Redo Logs
Status
Total KBytes
Used KBytes
Tasks and built-in actionsNone
LoggingYou can log data for the properties of the managed resource listed in the followingtable. The table shows the context of the managed resource and the properties thatthe resource model logs for the IBM Tivoli Monitoring Web Health Console.
Chapter 2. Resource models 47

Managed resource Context Properties
OracleArchiveDest StorageBinding
Returns one of the following requirements forsuccess: MANDATORY (must succeed), orOPTIONAL (need not succeed, depending onLOG_ARCHIVE_MIS_SUCCEED_DEST).
DestID*The archive destination identifier.
FreeKBytesAny unallocated space on the archivedestination device.
FreeSpacePercentagePercentage of unallocated space to the totalcapacity for the archive destination device.
LogModeSpecifies which archive log mode thedatabase is running, either ARCHIVELOG, orNOARCHIVELOG.
NumberRedoLogsNumber of redo logs which can be archivedin the available archive destination space.
OracleDatabase.DatabaseName*The name of an Oracle database. Thedatabase name contains up to 8 charactersand corresponds to the name specified in theCREATE DATABASE statement andidentified in the DB_NAME parameter in thedatabase initialization parameter file.
OracleInstance.InstanceName*The name of an Oracle database instance. Theinstance name is identified by theINSTANCE_NAME parameter in thedatabase initialization parameter file andcorresponds to the Oracle System Identifier(SID) of the instance.
Note: An asterisk (*) denotes a key property.
48 IBM Tivoli Monitoring for Databases: Oracle: Reference Guide
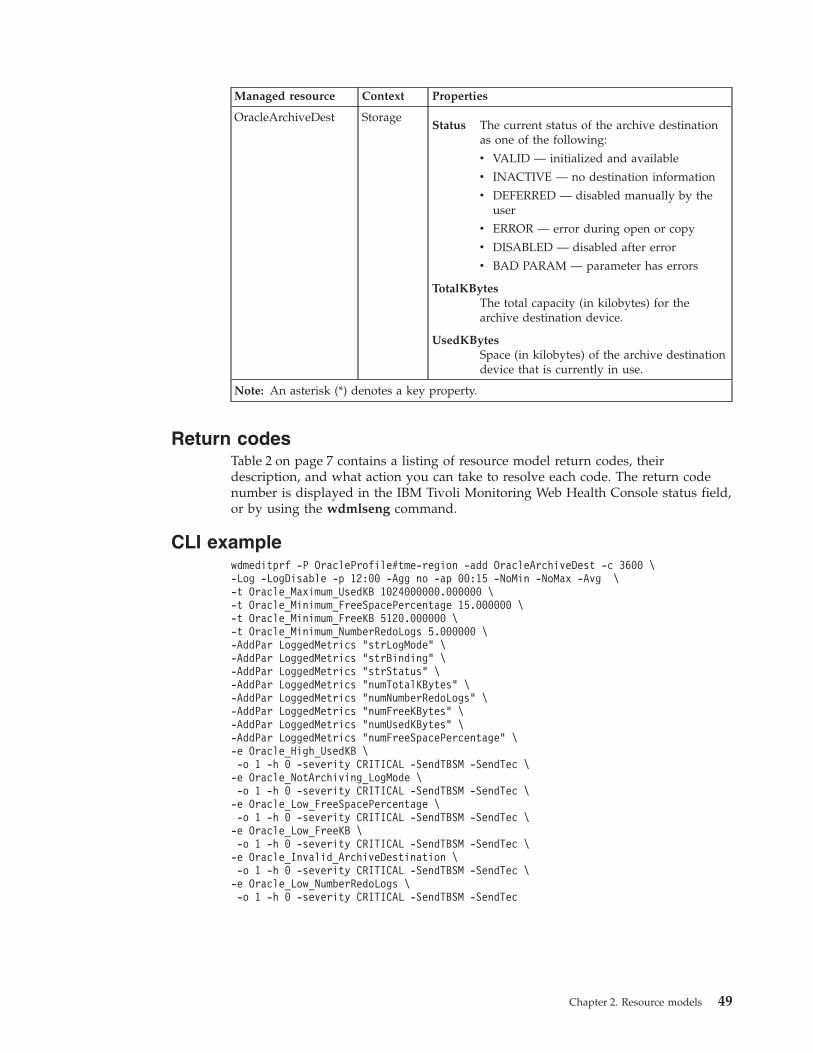
Managed resource Context Properties
OracleArchiveDest StorageStatus The current status of the archive destination
as one of the following:
v VALID — initialized and available
v INACTIVE — no destination information
v DEFERRED — disabled manually by theuser
v ERROR — error during open or copy
v DISABLED — disabled after error
v BAD PARAM — parameter has errors
TotalKBytesThe total capacity (in kilobytes) for thearchive destination device.
UsedKBytesSpace (in kilobytes) of the archive destinationdevice that is currently in use.
Note: An asterisk (*) denotes a key property.
Return codesTable 2 on page 7 contains a listing of resource model return codes, theirdescription, and what action you can take to resolve each code. The return codenumber is displayed in the IBM Tivoli Monitoring Web Health Console status field,or by using the wdmlseng command.
CLI examplewdmeditprf -P OracleProfile#tme-region -add OracleArchiveDest -c 3600 \-Log -LogDisable -p 12:00 -Agg no -ap 00:15 -NoMin -NoMax -Avg \-t Oracle_Maximum_UsedKB 1024000000.000000 \-t Oracle_Minimum_FreeSpacePercentage 15.000000 \-t Oracle_Minimum_FreeKB 5120.000000 \-t Oracle_Minimum_NumberRedoLogs 5.000000 \-AddPar LoggedMetrics "strLogMode" \-AddPar LoggedMetrics "strBinding" \-AddPar LoggedMetrics "strStatus" \-AddPar LoggedMetrics "numTotalKBytes" \-AddPar LoggedMetrics "numNumberRedoLogs" \-AddPar LoggedMetrics "numFreeKBytes" \-AddPar LoggedMetrics "numUsedKBytes" \-AddPar LoggedMetrics "numFreeSpacePercentage" \-e Oracle_High_UsedKB \-o 1 -h 0 -severity CRITICAL -SendTBSM -SendTec \-e Oracle_NotArchiving_LogMode \-o 1 -h 0 -severity CRITICAL -SendTBSM -SendTec \-e Oracle_Low_FreeSpacePercentage \-o 1 -h 0 -severity CRITICAL -SendTBSM -SendTec \-e Oracle_Low_FreeKB \-o 1 -h 0 -severity CRITICAL -SendTBSM -SendTec \-e Oracle_Invalid_ArchiveDestination \-o 1 -h 0 -severity CRITICAL -SendTBSM -SendTec \-e Oracle_Low_NumberRedoLogs \-o 1 -h 0 -severity CRITICAL -SendTBSM -SendTec
Chapter 2. Resource models 49

Checkpoints
DescriptionMonitors the number of times a database writer (DBWR) checkpoint is completed,and the number of database writer checkpoints requested by the server.
During database activity, data is written to memory buffers. A checkpoint is thecompletion of writing a modified (dirty) block buffer to storage. The databasewriter (DBWR) process writes dirty buffers in the database buffer cache to the datafiles for the purpose of making the data files consistent with the changes that havebeen made. If the instance fails, data in memory must be recovered. A DBWRcheckpoint occurs when the DBWR is requested to scan the cache and write allblocks marked for a checkpoint or the end of recovery. Frequent checkpointsreduce recovery time in the event of a system failure and establish dataconsistency.
Use this resource model to monitor the checkpoint activity for an Oracle databaseinstance. You can increase the Oracle database performance by setting checkpointsat reasonable intervals. High checkpoint activity regularly occurs because Oracleservices only one checkpoint at a time. Use the High DBWR Checkpoints metric tomonitor how many checkpoints Oracle requests.
Checkpoints occur at every log switch by default. Use the Low CompletedBackground Checkpoints metric to monitor how many checkpoints are actuallycompleted. If this number is lower than the specified threshold, checkpoints mightnot be completing.
Possible ways to resolve incomplete checkpoints include the following:v Increase the size of online redo logs to reduce the frequency of checkpoints and
to give the checkpoint process more time to cycle through the logs.v Increase the LOG_CHECKPOINT_INTERVAL initialization parameter.v Disable the checkpointing based on a time interval by setting the
LOG_CHECKPOINT_TIMEOUT initialization parameter for the instance to 0.
Resource model overview
Internal name OracleCheckpoints
Category Oracle
Indications High DBWR Checkpoints occurs when the number ofdatabase writer (DBWR) Checkpoints is higher than thespecified threshold.
Low Completed Background Checkpoints occurs when thenumber of completed background checkpoints is lower thanthe specified threshold.
Tasks and built-in actions None
Default cycle time 3600 seconds (1 hour)
Target managed resourceOracleDatabaseManager, OracleInstanceManager
50 IBM Tivoli Monitoring for Databases: Oracle: Reference Guide

Indications and eventsThe following table summarizes the indications for this resource model, the eventsassociated with the indications, the default severity of the events, and where tofind a detailed description of the indication. The resource model generates anevent when the threshold you specify for the indication is triggered.
Indication Generated event Defaultseverity
Clearingevents
Page
High DBWRCheckpoints
Oracle_High_DBWRCheckpoints Critical Yes 51
LowCompletedBackgroundCheckpoints
Oracle_Low_CompletedBackgroundCheckpoints
Critical Yes 52
High DBWR Checkpoints indicationOccurs when the number of database writer (DBWR) Checkpoints is higher thanthe specified threshold. When the indication occurs often enough to trigger anevent, the event delivers a message to the Tivoli Enterprise Console in thefollowing format:<application_label>: The DBWR checkpoints for Oracle instance <InstanceName>has crossed below the predefined threshold of <Threshold> checkpoints andis currently at <DBWRCheckpoints> checkpoints.
If you have Tivoli Business Systems Manager configured for your system, TivoliEnterprise Console forwards the message to Tivoli Business Systems Manager.
You can check the health of this resource model in the IBM Tivoli Monitoring WebHealth Console. For more information, see the IBM Tivoli Monitoring Web HealthConsole documentation.
The indication has the following attributes:
DatabaseNameThe name of an Oracle database. The database name contains up to 8characters and corresponds to the name specified in the CREATEDATABASE statement and identified in the DB_NAME parameter in thedatabase initialization parameter file.
DBWRCheckpointsThe number of database writer (DBWR) checkpoints requested by theserver.
InstanceNameThe name of an Oracle database instance. The instance name is identifiedby the INSTANCE_NAME parameter in the database initializationparameter file and corresponds to the Oracle System Identifier (SID) of theinstance.
This indication has the following threshold:v Maximum DBWR Checkpoints
For more information about this threshold, see “Thresholds” on page 53.
Chapter 2. Resource models 51

The following table describes the default settings for this indication.
Setting Default value
Send indications to Tivoli Enterprise Console Yes
Send indications to Tivoli Business SystemsManager
Yes
Occurrences 1
Holes 0
Associated tasks and built-in actions None
Note: If you have Tivoli Business Systems Manager configured for your systems,Tivoli Enterprise Console automatically forwards events to Tivoli BusinessSystems Manager. Do not change the configuration of the indication to sendevents to Tivoli Business Systems Manager.
Low Completed Background Checkpoints indicationOccurs when the number of completed background checkpoints is lower than thespecified threshold. When the indication occurs often enough to trigger an event,the event delivers a message to the Tivoli Enterprise Console in the followingformat:<application_label>: The completed background checkpoints for Oracleinstance <InstanceName> has crossed below the predefined threshold of<Threshold> checkpoints and is currentlyat <CompletedBackgroundCheckpoints> checkpoints.
If you have Tivoli Business Systems Manager configured for your system, TivoliEnterprise Console forwards the message to Tivoli Business Systems Manager.
You can check the health of this resource model in the IBM Tivoli Monitoring WebHealth Console. For more information, see the IBM Tivoli Monitoring Web HealthConsole documentation.
The indication has the following attributes:
CompletedBackgroundCheckpointsThe number of times a database writer (DBWR) checkpoint is completed.
DatabaseNameThe name of an Oracle database. The database name contains up to 8characters and corresponds to the name specified in the CREATEDATABASE statement and identified in the DB_NAME parameter in thedatabase initialization parameter file.
InstanceNameThe name of an Oracle database instance. The instance name is identifiedby the INSTANCE_NAME parameter in the database initializationparameter file and corresponds to the Oracle System Identifier (SID) of theinstance.
This indication has the following threshold:v Minimum Completed Background Checkpoints
For more information about this threshold, see “Thresholds” on page 53.
52 IBM Tivoli Monitoring for Databases: Oracle: Reference Guide

The following table describes the default settings for this indication.
Setting Default value
Send indications to Tivoli Enterprise Console Yes
Send indications to Tivoli Business SystemsManager
Yes
Occurrences 1
Holes 0
Associated tasks and built-in actions None
Note: If you have Tivoli Business Systems Manager configured for your systems,Tivoli Enterprise Console automatically forwards events to Tivoli BusinessSystems Manager. Do not change the configuration of the indication to sendevents to Tivoli Business Systems Manager.
ThresholdsThe following table lists the thresholds that can be set for the Checkpoints resourcemodel. For each threshold it shows the name, a short description, and the defaultvalue:
Threshold Description Defaultvalue
Maximum DBWRCheckpoints
An indication occurs if the number of DBWRcheckpoints exceeds this value.
50
Minimum CompletedBackground Checkpoints
An indication occurs if the number of CompletedBackground checkpoints is lower than this value.
5
Parameters
Note: A plus symbol (+) denotes parameters that feature selective logging.Selective logging enables you to choose metrics/properties that you want tolog. The selective logging metrics are listed in the value field of theParameters window.
The following table lists the parameter that can be set for the Checkpoints resourcemodel. The table shows the name, a short description, and the default value foreach parameter:
Parameter Description Default value
InstanceMetrics +
Select the metrics you want to log.See the following logging table fora description of each metric.
Completed Background Checkpoints
DBWR Checkpoints
Tasks and built-in actionsNone
LoggingYou can log data for the properties of the managed resource listed in the followingtable. The table shows the context of the managed resource and the properties thatthe resource model logs for the IBM Tivoli Monitoring Web Health Console.
Chapter 2. Resource models 53

Managedresource
Context Properties
OracleInstance I/OCompletedBackgroundCheckpoints
The number of times a database writer (DBWR)checkpoint is completed.
DBWRCheckpointsThe number of database writer (DBWR)checkpoints requested by the server.
InstanceName*The name of an Oracle database instance.
OracleDatabase.DatabaseName*The name of an Oracle database.
Note: An asterisk (*) denotes a key property.
Return codesTable 2 on page 7 contains a listing of resource model return codes, theirdescription, and what action you can take to resolve each code. The return codenumber is displayed in the IBM Tivoli Monitoring Web Health Console status field,or by using the wdmlseng command.
CLI examplewdmeditprf -P OracleProfile#tme-region -add OracleCheckpoints -c 3600 \-Log -LogDisable -p 12:00 -Agg no -ap 00:15 -NoMin -NoMax -Avg \-t Oracle_Maximum_DBWRCheckpoints 50.000000 \-t Oracle_Minimum_CompletedBackgroundCheckpoints 5.000000 \-AddPar InstanceMetrics "numCompletedBackgroundCheckpoints" \-AddPar InstanceMetrics "numDBWRCheckpoints" \-e Oracle_High_DBWRCheckpoints \-o 1 -h 0 -severity CRITICAL -SendTBSM -SendTec \-e Oracle_Low_CompletedBackgroundCheckpoints \-o 1 -h 0 -severity CRITICAL -SendTBSM -SendTec
54 IBM Tivoli Monitoring for Databases: Oracle: Reference Guide

Data Warehouse Collector
DescriptionCollects attribute data required by the Tivoli Enterprise Data Warehouse. Thisresource model must be running to allow complete integration of IBM TivoliMonitoring for Databases: Oracle into the Tivoli Enterprise Data Warehouse.
Note: The default cycle time runs this resource model once per day. Do not runthis resource model too frequently in an environment.
This resource model fully defines the parent-child relationship in Tivoli EnterpriseData Warehouse. Running this resource model enables you to filter the metricsadded to the Tivoli Enterprise Data Warehouse.
Resource model overview
Internal name OracleDataWarehouse
Category Oracle
Indications None
Tasks and built-in actions None
Default cycle time 86400 seconds (once a day)
Target managed resourceOracleDatabaseManager, OracleInstanceManager
Indications and eventsNone
ThresholdsNone
Parameters
Note: A plus symbol (+) denotes parameters that feature selective logging.Selective logging enables you to choose metrics/properties that you want tolog. The selective logging metrics are listed in the value field of theParameters window.
Selecting one of the following logging options results in the collection of all of theattributes within that CIM class.
The following table lists the parameter that can be set for the Data WarehouseCollector resource model. The table shows the name, a short description, and thedefault value for each parameter:
Parameter Description Default value
LoggingOptions +
Select the metrics you want to log.See the following logging table fora description of each metric.
OracleProcess
OracleTablespace
Chapter 2. Resource models 55

Tasks and built-in actionsNone
LoggingYou can log data for the properties of the managed resource listed in the followingtable. The table shows the context of the managed resource and the properties thatthe resource model logs for the IBM Tivoli Monitoring Web Health Console.
Managed resource Context Properties
OracleDatabase ResourceConfiguration Created
The date of the database creation.
DatabaseName*The name of an Oracle database.
LogModeSpecifies which archive log mode thedatabase is running, eitherARCHIVELOG, or NOARCHIVELOG.
OpenModeThe current mode of the open database.Possible modes include: Mounted, ReadWrite, and Read Only.
56 IBM Tivoli Monitoring for Databases: Oracle: Reference Guide

Managed resource Context Properties
OracleInstance ResourceConfiguration DatabaseStatus
Specifies the current database status.
InstanceName*The name of an Oracle database instance.
InstanceRoleSpecifies one of two possible instanceroles, primary or secondary. A primaryinstance role is the first instance to mountthe database. A secondary instance role isthe second instance to mount thedatabase. The secondary instance roleassumes the primary instance role if theprimary instance fails or is shut down.After a failed instance returns to activestatus, it assumes a secondary instancerole. The V$INSTANCE dynamicperformance view displays all instanceroles.
OracleDatabase.CreatedThe date of the database creation.
OracleDatabase.DatabaseName*The name of an Oracle database.
OracleDatabase.LogModeSpecifies which archive log mode thedatabase is running, eitherARCHIVELOG, or NOARCHIVELOG.
OracleDatabase.OpenModeThe current mode of the open database.Possible modes include: Mounted, ReadWrite, and Read Only.
ParallelSpecifies whether the Oracle ApplicationCluster is running in Parallel mode.Displays YES for Parallel mode, and NOif it is not Parallel.
Status The current status of the instance aseither STARTED, MOUNTED, or OPEN.
v STARTED after startup, but no mount
v MOUNTED after startup, mount oralter database close
v OPEN after startup or after databaseopen
VersionThe version number for RDBMS.
Chapter 2. Resource models 57

Managed resource Context Properties
OracleProcess ResourceConfiguration OracleDatabase.Created
The date of the database creation.
OracleDatabase.DatabaseName*The name of an Oracle database.
OracleInstance.InstanceName*The name of an Oracle database instance.
OracleDatabase.LogModeSpecifies which archive log mode thedatabase is running, eitherARCHIVELOG, or NOARCHIVELOG.
OracleDatabase.OpenModeThe current mode of the open database.Possible modes include: Mounted, ReadWrite, and Read Only.
OracleInstance.DatabaseStatusThe current status of the instance aseither STARTED, MOUNTED, or OPEN.
v STARTED after startup, but no mount
v MOUNTED after startup, mount oralter database close
v OPEN after startup or after databaseopen
OracleInstance.InstanceRoleSpecifies one of two possible instanceroles, primary or secondary. A primaryinstance role is the first instance to mountthe database. A secondary instance role isthe second instance to mount thedatabase. The secondary instance roleassumes the primary instance role if theprimary instance fails or is shut down.After a failed instance returns to activestatus, it assumes a secondary instancerole. The V$INSTANCE dynamicperformance view displays all instanceroles.
OracleInstance.ParallelSpecifies whether the Oracle ApplicationCluster is running in Parallel mode.Displays YES for Parallel mode, and NOif it is not Parallel.
Note: An asterisk (*) denotes a key property.
58 IBM Tivoli Monitoring for Databases: Oracle: Reference Guide

Managed resource Context Properties
OracleProcess ResourceConfiguration OracleInstance.Status
The current status of the instance aseither STARTED, MOUNTED, or OPEN.
v STARTED after startup, but no mount
v MOUNTED after startup, mount oralter database close
v OPEN after startup or after databaseopen
OracleInstance.VersionThe version number for RDBMS.
ProcessNameThe name of a process used to uniquelyidentify that process.
OracleTablespace ResourceConfiguration AllocationType
The type of extent allocation used for thetablespace.
ContentsThe tablespace contents as PERMANENTor TEMPORARY.
ExtentManagementOne of two ways to enable tablespaces toallocate space in extents, either by thedata dictionary for dictionary-managedtablespaces, or by the tablespace forlocally managed tablespaces. The methodof extent management is selected whenthe tablespace is created. This methodcannot be altered.
LoggingThe default logging attribute.
OracleDatabase.CreatedThe date of the database creation.
OracleDatabase.DatabaseName*The name of an Oracle database.
OracleDatabase.LogModeSpecifies which archive log mode thedatabase is running, eitherARCHIVELOG, or NOARCHIVELOG.
OracleDatabase.OpenModeThe current mode of the open database.Possible modes include: Mounted, ReadWrite, and Read Only.
Status Specifies the current tablespace status aseither ONLINE, OFFLINE, or READONLY.
TablespaceName*The name of the tablespace. Thetablespace name can contain up to 8characters.
Note: An asterisk (*) denotes a key property.
Chapter 2. Resource models 59

Return codesTable 2 on page 7 contains a listing of resource model return codes, theirdescription, and what action you can take to resolve each code. The return codenumber is displayed in the IBM Tivoli Monitoring Web Health Console status field,or by using the wdmlseng command.
CLI examplewdmeditprf -P OracleProfile#tme-region -add OracleDataWarehouse -c 86400 \-Log -LogDisable -p 12:00 -Agg no -ap 00:15 -NoMin -NoMax -Avg \-AddPar Oracle_DataWarehouse_Logging_Options "OracleTablespace" \-AddPar Oracle_DataWarehouse_Logging_Options "OracleProcess"
60 IBM Tivoli Monitoring for Databases: Oracle: Reference Guide

Dump Space
DescriptionMonitors the used space percentage for the dump destination directories. Thisresource model monitors used space on the following dump destinations:v Background Dump Destinationv Core Dump Destinationv User Dump Destination
The background dump destination device is controlled by theBACKGROUND_DUMP_DEST initialization parameter for the instance. TheBACKGROUND_DUMP_DEST parameter includes the path name wheredebugging trace files are written during Oracle operations. Oracle writes to thealert log and creates trace files for the background processes in theBACKGROUND_DUMP_DEST directory. If this directory is full, Oracle cannotcreate these files, which might result in instance failure and makes debuggingmore difficult.
The core dump destination is controlled by the CORE_DUMP_DEST initializationparameter for the instance. CORE_DUMP_DEST specifies the directory whereOracle dumps core files. Oracle writes core files for background processes in theCORE_DUMP_DEST directory. If this parameter is not set, the core files are storedin $ORACLE_HOME/dbs on a UNIX system. If this directory is full, Oracle cannotcreate these files, which makes debugging more difficult.
Note: CORE_DUMP_DEST is primarily a UNIX parameter and therefore not allsystems support it.
The user dump destination is controlled by the USER_DUMP_DEST initializationparameter for the instance. USER_DUMP_DEST parameter specifies the path nameof a directory where the server can write debugging trace files for a user process.Oracle creates trace files for the user processes in the USER_DUMP_DESTdirectory. If this parameter is not set, the trace files are stored in$ORACLE_HOME/rdbms/log on a UNIX system and%ORACLE_HOME%\rdbms\trace on a Windows system. If this directory is full,Oracle cannot create these files, which might result in process failure and makesdebugging more difficult.
Resource model overview
Internal name OracleDumpSpace
Category Oracle
Indications High Used Dump Space Percentage occurs when thepercentage of used space on the particular dump spacedestination exceeds its maximum threshold.
Tasks and built-in actions None
Default cycle time 3600 seconds (1 hour)
Target managed resourceOracleDatabaseManager, OracleInstanceManager
Chapter 2. Resource models 61

Indications and eventsThe following table summarizes the indications for this resource model, the eventsassociated with the indications, the default severity of the events, and where tofind a detailed description of the indication. The resource model generates anevent when the threshold you specify for the indication is triggered.
Indication Generated event Defaultseverity
Clearingevents
Page
High UsedDump SpacePercentage
Oracle_High_UsedDumpSpacePercentage
Critical Yes 62
High Used Dump Space Percentage indicationOccurs when the percentage of used space on the particular dump spacedestination exceeds its maximum threshold. When the indication occurs oftenenough to trigger an event, the event delivers a message to the Tivoli EnterpriseConsole in the following format:<application_label>: The percent of used space for (<Type> dump space)<Destination> for Oracle Instance <InstanceName> has crossed above itspredefined threshold of <Threshold> percent and is currently at<UsedPercentage> percent.
If you have Tivoli Business Systems Manager configured for your system, TivoliEnterprise Console forwards the message to Tivoli Business Systems Manager.
You can check the health of this resource model in the IBM Tivoli Monitoring WebHealth Console. For more information, see the IBM Tivoli Monitoring Web HealthConsole documentation.
The indication has the following attributes:
DestinationThe location of dump space.
FreeKBytesUnallocated space on the dump space destination.
InstanceNameThe name of an Oracle database instance. The instance name is identifiedby the INSTANCE_NAME parameter in the database initializationparameter file and corresponds to the Oracle System Identifier (SID) of theinstance.
TotalKBytesThe total capacity (in kilobytes) for the dump space destination.
Type The type of dump space destination, as either USER, BACKGROUND, orCORE.
UsedPercentageThe percentage of used space for the dump space destination.
This indication has the following thresholds:v Maximum Used Space Percentage on Background Dump Destinationv Maximum Used Space Percentage on Core Dump Destinationv Maximum Used Space Percentage on User Dump Destination
For more information about these thresholds, see “Thresholds” on page 63.
62 IBM Tivoli Monitoring for Databases: Oracle: Reference Guide

The following table describes the default settings for this indication.
Setting Default value
Send indications to Tivoli Enterprise Console Yes
Send indications to Tivoli Business SystemsManager
Yes
Occurrences 1
Holes 0
Associated tasks and built-in actions None
Note: If you have Tivoli Business Systems Manager configured for your systems,Tivoli Enterprise Console automatically forwards events to Tivoli BusinessSystems Manager. Do not change the configuration of the indication to sendevents to Tivoli Business Systems Manager.
ThresholdsThe following table lists the thresholds that can be set for the Dump Spaceresource model. For each threshold it shows the name, a short description, and thedefault value:
Threshold Description Defaultvalue
Maximum Used SpacePercentage onBackground DumpDestination
An indication occurs if the percentage of usedspace for the background dump space destinationexceeds this value. If the amount of space used inthe background dump space destination deviceexceeds the threshold, move the alert log to auser-specified alternate location.
85
Maximum Used SpacePercentage on CoreDump Destination
An indication occurs if the percentage of usedspace for the core dump space destinationexceeds this value.
85
Maximum Used SpacePercentage on UserDump Destination
An indication occurs if the percentage of usedspace for the user dump space destinationexceeds this value.
85
ParametersNone
Tasks and built-in actionsNone
LoggingYou can log data for the properties of the managed resource listed in the followingtable. The table shows the context of the managed resource and the properties thatthe resource model logs for the IBM Tivoli Monitoring Web Health Console.
Chapter 2. Resource models 63

Managed resource Context Properties
OracleDumpSpace StorageDestination*
The location of dump space.
FreeKBytesUnallocated space on the dump spacedestination.
OracleDatabase.DatabaseName*The name of an Oracle database.
OracleInstance.InstanceName*The name of an Oracle databaseinstance.
TotalKBytesThe total capacity (in kilobytes) for thedump space destination.
Type* The type of dump space destination, aseither USER, BACKGROUND, orCORE.
UsedPercentageThe percentage of used space for thedump space destination.
Note: An asterisk (*) denotes a key property.
Return codesTable 2 on page 7 contains a listing of resource model return codes, theirdescription, and what action you can take to resolve each code. The return codenumber is displayed in the IBM Tivoli Monitoring Web Health Console status field,or by using the wdmlseng command.
CLI examplewdmeditprf -P OracleProfile#tme-region -add OracleDumpSpace -c 3600 \-Log -LogDisable -p 12:00 -Agg no -ap 00:15 -NoMin -NoMax -Avg \-t Oracle_Maximum_BACKGROUND_UsedDumpSpacePercentage 85.000000 \-t Oracle_Maximum_CORE_UsedDumpSpacePercentage 85.000000 \-t Oracle_Maximum_USER_UsedDumpSpacePercentage 85.000000 \-e Oracle_High_UsedDumpSpacePercentage \-o 1 -h 0 -severity CRITICAL -SendTBSM -SendTec
64 IBM Tivoli Monitoring for Databases: Oracle: Reference Guide
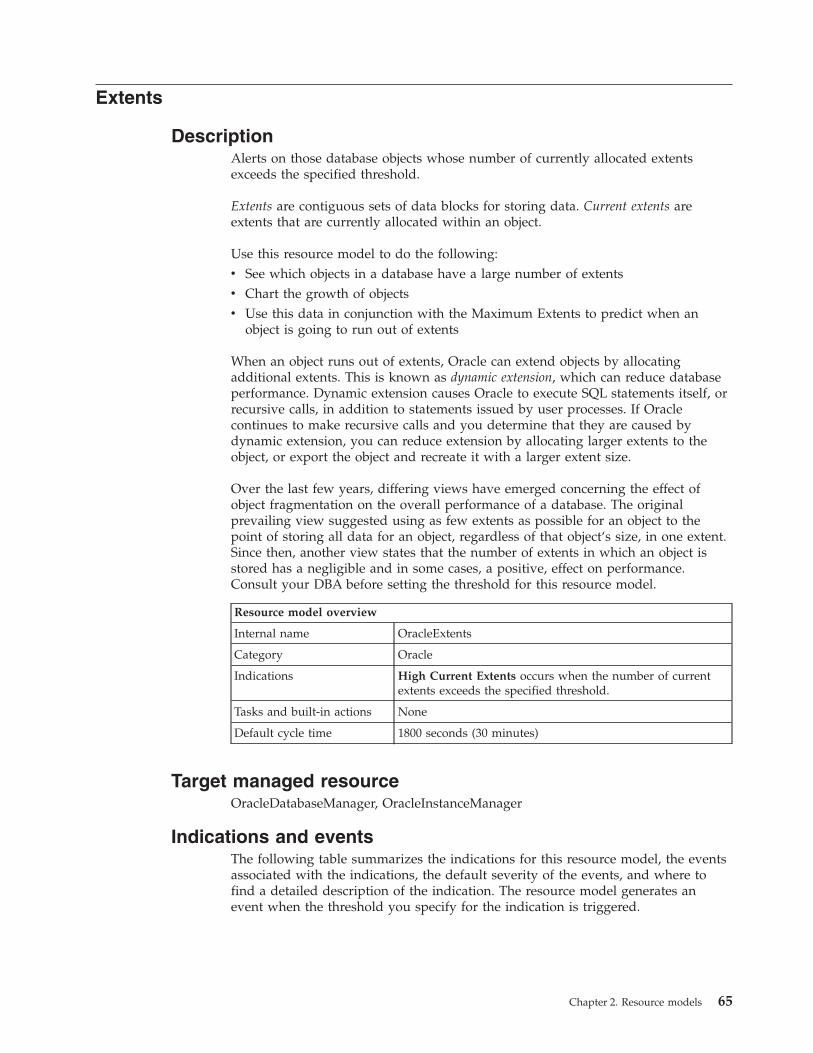
Extents
DescriptionAlerts on those database objects whose number of currently allocated extentsexceeds the specified threshold.
Extents are contiguous sets of data blocks for storing data. Current extents areextents that are currently allocated within an object.
Use this resource model to do the following:v See which objects in a database have a large number of extentsv Chart the growth of objectsv Use this data in conjunction with the Maximum Extents to predict when an
object is going to run out of extents
When an object runs out of extents, Oracle can extend objects by allocatingadditional extents. This is known as dynamic extension, which can reduce databaseperformance. Dynamic extension causes Oracle to execute SQL statements itself, orrecursive calls, in addition to statements issued by user processes. If Oraclecontinues to make recursive calls and you determine that they are caused bydynamic extension, you can reduce extension by allocating larger extents to theobject, or export the object and recreate it with a larger extent size.
Over the last few years, differing views have emerged concerning the effect ofobject fragmentation on the overall performance of a database. The originalprevailing view suggested using as few extents as possible for an object to thepoint of storing all data for an object, regardless of that object‘s size, in one extent.Since then, another view states that the number of extents in which an object isstored has a negligible and in some cases, a positive, effect on performance.Consult your DBA before setting the threshold for this resource model.
Resource model overview
Internal name OracleExtents
Category Oracle
Indications High Current Extents occurs when the number of currentextents exceeds the specified threshold.
Tasks and built-in actions None
Default cycle time 1800 seconds (30 minutes)
Target managed resourceOracleDatabaseManager, OracleInstanceManager
Indications and eventsThe following table summarizes the indications for this resource model, the eventsassociated with the indications, the default severity of the events, and where tofind a detailed description of the indication. The resource model generates anevent when the threshold you specify for the indication is triggered.
Chapter 2. Resource models 65

Indication Generated event Defaultseverity
Clearingevents
Page
High CurrentExtents
Oracle_High_CurrentExtents Critical Yes 66
High Current Extents indicationOccurs when the number of current extents exceeds the specified threshold. Whenthe indication occurs often enough to trigger an event, the event delivers amessage to the Tivoli Enterprise Console in the following format:<application_label>: The number of extents for the Oracle segment<SegmentOwner>.<SegmentName> in tablespace <TablespaceName>on database <DatabaseName> has crossed above the predefined threshold<Threshold> and is currently at <CurrentExtents>.
If you have Tivoli Business Systems Manager configured for your system, TivoliEnterprise Console forwards the message to Tivoli Business Systems Manager.
You can check the health of this resource model in the IBM Tivoli Monitoring WebHealth Console. For more information, see the IBM Tivoli Monitoring Web HealthConsole documentation.
If you find that one or more objects are fragmented to the point of action, thatobject can be defragmented by recreating the object typically through theexport/import utility while compressing extents or by dropping and recreating theobject with more applicable storage parameters.
The indication has the following attributes:
CurrentExtentsThe number of extents currently allocated to the specified segment.
DatabaseNameThe name of an Oracle database. The database name contains up to 8characters and corresponds to the name specified in the CREATEDATABASE statement and identified in the DB_NAME parameter in thedatabase initialization parameter file.
SegmentNameThe name of the segment.
SegmentOwnerThe username of the segment owner.
SegmentTypeThe type of the segment. Segment types include: index partition, tablepartition, table, cluster, index, rollback, deferred rollback, temporary, cache,lobsegment, and lobindex.
TablespaceNameThe name of the tablespace that contains this segment.
This indication has the following threshold:v Maximum Current Extents
For more information about this threshold, see “Thresholds” on page 67.
66 IBM Tivoli Monitoring for Databases: Oracle: Reference Guide

The following table describes the default settings for this indication.
Setting Default value
Send indications to Tivoli Enterprise Console Yes
Send indications to Tivoli Business SystemsManager
Yes
Occurrences 1
Holes 0
Associated tasks and built-in actions None
Note: If you have Tivoli Business Systems Manager configured for your systems,Tivoli Enterprise Console automatically forwards events to Tivoli BusinessSystems Manager. Do not change the configuration of the indication to sendevents to Tivoli Business Systems Manager.
ThresholdsThe following table lists the thresholds that can be set for the Extents resourcemodel. For each threshold it shows the name, a short description, and the defaultvalue:
Threshold Description Defaultvalue
Maximum CurrentExtents
An indication occurs when the number of currentextents exceeds this value.
5
Parameters
Note: A plus symbol (+) denotes parameters that feature selective logging.Selective logging enables you to choose metrics/properties that you want tolog. The selective logging metrics are listed in the value field of theParameters window.
The following table lists the parameters that can be set for the Extents resourcemodel. The table shows the name, a short description, and the default value foreach parameter:
Parameter Description Default value
Number of Rows Specifies the number of objects with theworst-case extents to return.
50
Segment Metrics+
Select the metrics you want to log. See thefollowing logging table for a descriptionof each metric.
Allocated
Current Extents
Free Extents
Percent Extents
Tasks and built-in actionsNone
Chapter 2. Resource models 67

LoggingYou can log data for the properties of the managed resource listed in the followingtable. The table shows the context of the managed resource and the properties thatthe resource model logs for the IBM Tivoli Monitoring Web Health Console.
Managedresource
Context Properties
OracleSegment StorageCurrentExtents
The number of extents currently allocated to thespecified segment.
FreeExtentsMaximum number of extents allowed for thespecified segment less the number of extentscurrently allocated to the specified segment.
OracleDatabase.DatabaseName*The name of an Oracle database.
OracleTablespace.TablespaceName*The name of the tablespace that contains thissegment.
PctExtentsAllocatedPercentage of current extents to the maximumnumber allowed for the specified segment.
SegmentName*The name of the segment.
SegmentOwner*The username of the segment owner.
SegmentType*The type of the segment. Segment types include:index partition, table partition, table, cluster, index,rollback, deferred rollback, temporary, cache,lobsegment, and lobindex.
Note: An asterisk (*) denotes a key property.
Return codesTable 2 on page 7 contains a listing of resource model return codes, theirdescription, and what action you can take to resolve each code. The return codenumber is displayed in the IBM Tivoli Monitoring Web Health Console status field,or by using the wdmlseng command.
CLI examplewdmeditprf -P OracleProfile#tme-region -add OracleExtents -c 1800 \-Log -LogDisable -p 12:00 -Agg no -ap 00:15 -NoMin -NoMax -Avg \-t Oracle_Maximum_CurrentExtents 5.000000 \-AddPar SegmentMetrics "numPctExtentsAllocated" \-AddPar SegmentMetrics "numFreeExtents" \-AddPar SegmentMetrics "numCurrentExtents" \-DelPar NumberOfRows "50" \-AddPar NumberOfRows "25" \-e Oracle_High_CurrentExtents \-o 1 -h 0 -severity CRITICAL -SendTBSM -SendTec
68 IBM Tivoli Monitoring for Databases: Oracle: Reference Guide

Extents by Tablespace
DescriptionAlerts on those database objects for the specified tablespaces whose number ofcurrently allocated extents exceeds the specified threshold.
Extents are contiguous sets of data blocks for storing data. Current extents areextents that are currently allocated within an object.
You can use this resource model to do the following:v See which objects in a database have a large number of extentsv Chart the growth of objectsv Use this data in conjunction with the Maximum Extents to predict when an
object is going to run out of extents
This resource model can use tokens to monitor a set of tables specified by thetoken. See Appendix E, “Using tokens to customize resource model parameters” onpage 519 for more information.
When an object runs out of extents, Oracle can extend objects by allocatingadditional extents. This is known as dynamic extension, but it can reduce databaseperformance. Dynamic extension causes Oracle to execute SQL statements itself, orrecursive calls, in addition to statements issued by user processes. If Oraclecontinues to make recursive calls and you determine that they are caused bydynamic extension, you can reduce extension by allocating larger extents to theobject, or export the object and recreate it with a larger extent size.
Over the last few years, differing views have emerged concerning the effect ofobject fragmentation on the overall performance of a database. The originalprevailing view suggested using as few extents as possible for an object even tothe point of storing all data for an object, regardless of that object’s size, in oneextent. Since then, another view states that the number of extents in which anobject is stored has a negligible and in some cases, a positive, effect onperformance. Consult your DBA before setting the threshold for this resourcemodel.
Resource model overview
Internal name OracleExtentsByTablespace
Category Oracle
Indications High Current Extents occurs when the number of currentextents exceeds the specified value.
Tasks and built-in actions None
Default cycle time 1800 seconds (30 minutes)
Target managed resourceOracleDatabaseManager, OracleInstanceManager
Indications and eventsThe following table summarizes the indications for this resource model, the eventsassociated with the indications, the default severity of the events, and where tofind a detailed description of the indication. The resource model generates an
Chapter 2. Resource models 69

event when the threshold you specify for the indication is triggered.
Indication Generated event Defaultseverity
Clearingevents
Page
HighCurrentExtents
Oracle_High_CurrentExtentsByTablespace Critical Yes 70
High Current Extents indicationOccurs when the number of current extents exceeds the specified value. When theindication occurs often enough to trigger an event, the event delivers a message tothe Tivoli Enterprise Console in the following format:<application_label>: The number of extents for the Oracle segment<SegmentOwner>.<SegmentName> in tablespace <TablespaceName>on database <DatabaseName> has crossed above the predefined threshold <Threshold>and is currently at <CurrentExtents>.
If you have Tivoli Business Systems Manager configured for your system, TivoliEnterprise Console forwards the message to Tivoli Business Systems Manager.
You can check the health of this resource model in the IBM Tivoli Monitoring WebHealth Console. For more information, see the IBM Tivoli Monitoring Web HealthConsole documentation.
If you find that one or more objects are fragmented to the point of action, thatobject can be defragmented by recreating the object typically through theexport/import utility while compressing extents or by dropping and recreating theobject with more applicable storage parameters.
The indication has the following attributes:
CurrentExtentsThe number of extents currently allocated to the specified segment.
DatabaseNameThe name of an Oracle database. The database name contains up to 8characters and corresponds to the name specified in the CREATEDATABASE statement and identified in the DB_NAME parameter in thedatabase initialization parameter file.
FreeExtentsMaximum number of extents allowed for the specified segment less thenumber of extents currently allocated to the specified segment.
MaxExtentsThe maximum number of extents allowed for the specified segment.
PctExtentsAllocatedPercentage of current extents to the maximum number allowed for thespecified segment.
SegmentNameThe name of the segment.
SegmentOwnerThe username of the segment owner.
70 IBM Tivoli Monitoring for Databases: Oracle: Reference Guide

SegmentTypeThe type of the segment. Segment types include: index partition, tablepartition, table, cluster, index, rollback, deferred rollback, temporary, cache,lobsegment, and lobindex.
TablespaceNameThe name of the tablespace that contains this segment.
This indication has the following threshold:v Maximum Current Extents
For more information about this threshold, see “Thresholds” on page 71.
The following table describes the default settings for this indication.
Setting Default value
Send indications to Tivoli Enterprise Console Yes
Send indications to Tivoli Business SystemsManager
Yes
Occurrences 1
Holes 0
Associated tasks and built-in actions None
Note: If you have Tivoli Business Systems Manager configured for your systems,Tivoli Enterprise Console automatically forwards events to Tivoli BusinessSystems Manager. Do not change the configuration of the indication to sendevents to Tivoli Business Systems Manager.
ThresholdsThe following table lists the thresholds that can be set for the Extents byTablespace resource model. For each threshold it shows the name, a shortdescription, and the default value:
Threshold Description Defaultvalue
Maximum CurrentExtents
An indication occurs when the number of currentextents exceeds this value.
5
Parameters
Note: A plus symbol (+) denotes parameters that feature selective logging.Selective logging enables you to choose metrics/properties that you want tolog. The selective logging metrics are listed in the value field of theParameters window.
The following table lists the parameters that can be set for the Extents byTablespace resource model. The table shows the name, a short description, and thedefault value for each parameter:
Parameter Description Default value
Include/Exclude Includes or excludes the contents of thetablespaces names field.
Include
Chapter 2. Resource models 71

Parameter Description Default value
Number of Rows Specifies the number of objects with theworst-case extents to return.
50
Segment Metrics+
Select the metrics you want to log. Seethe following logging table for adescription of each metric.
Allocated
Current Extents
Free Extents
Percent Extents
Tablespace Names Designates the tablespaces names youwant to include or exclude. Use spaces toseparate names.
None
Tasks and built-in actionsNone
LoggingYou can log data for the properties of the managed resource listed in the followingtable. The table shows the context of the managed resource and the properties thatthe resource model logs for the IBM Tivoli Monitoring Web Health Console.
Managedresource
Context Properties
OracleSegment StorageCurrentExtents
The number of extents currently allocated to thespecified segment.
FreeExtentsMaximum number of extents allowed for thespecified segment less the number of extentscurrently allocated to the specified segment.
OracleDatabase.DatabaseName*The name of an Oracle database.
OracleTablespace.TablespaceName*The name of the tablespace that contains thissegment.
PctExtentsAllocatedPercentage of current extents to the maximumnumber allowed for the specified segment.
SegmentName*The name of the segment.
SegmentOwner*The username of the segment owner.
SegmentType*The type of the segment. Segment types include:index partition, table partition, table, cluster,index, rollback, deferred rollback, temporary,cache, lobsegment, and lobindex.
Note: An asterisk (*) denotes a key property.
72 IBM Tivoli Monitoring for Databases: Oracle: Reference Guide

Return codesTable 2 on page 7 contains a listing of resource model return codes, theirdescription, and what action you can take to resolve each code. The return codenumber is displayed in the IBM Tivoli Monitoring Web Health Console status field,or by using the wdmlseng command.
CLI examplewdmeditprf -P OracleProfile#tme-region -add OracleExtentsByTablespace -c 1800 \-Log -LogDisable -p 12:00 -Agg no -ap 00:15 -NoMin -NoMax -Avg \-t Oracle_Maximum_CurrentExtents 5.000000 \-AddPar SegmentMetrics "numPctExtentsAllocated" \-AddPar SegmentMetrics "numFreeExtents" \-AddPar SegmentMetrics "numCurrentExtents" \-AddPar IncludeExcludeTablespaces "Include" \-DelPar NumberOfRows "50" \-AddPar NumberOfRows "25" \-AddPar List "SYSTEM" \-e Oracle_High_CurrentExtentsByTablespace \-o 1 -h 0 -severity CRITICAL -SendTBSM -SendTec
Chapter 2. Resource models 73

Extents by User
DescriptionAlerts on those database objects for the specified user whose number of currentlyallocated extents exceeds the specified threshold.
Extents are contiguous sets of data blocks for storing data. Current extents areextents that are currently allocated within an object.
You can use this resource model to do the following:v See which objects in a database have a large number of extentsv Chart the growth of objectsv Use this data in conjunction with the Maximum Extents to predict when an
object is going to run out of extents
This resource model can use tokens to monitor a set of users specified by thetoken. See Appendix E, “Using tokens to customize resource model parameters” onpage 519 for more information.
When an object runs out of extents, Oracle can extend objects by allocatingadditional extents. This is known as dynamic extension, but it can reduce databaseperformance. Dynamic extension causes Oracle to execute SQL statements itself, orrecursive calls, in addition to statements issued by user processes. If Oraclecontinues to make recursive calls and you determine that they are caused bydynamic extension, you can reduce extension by allocating larger extents to theobject, or export the object and recreate it with a larger extent size.
Over the last few years, differing views have emerged concerning the effect ofobject fragmentation on the overall performance of a database. The originalprevailing view suggested using as few extents as possible for an object even tothe point of storing all data for an object, regardless of that object’s size, in oneextent. Since then, another view states that the number of extents in which anobject is stored has a negligible and in some cases, a positive, effect onperformance. Consult your DBA before setting the threshold for this resourcemodel.
Resource model overview
Internal name OracleExtentsByUser
Category Oracle
Indications High Current Extents occurs when the number of currentextents exceeds the specified threshold.
Tasks and built-in actions None
Default cycle time 1800 seconds (30 minutes)
Target managed resourceOracleDatabaseManager, OracleInstanceManager
Indications and eventsThe following table summarizes the indications for this resource model, the eventsassociated with the indications, the default severity of the events, and where tofind a detailed description of the indication. The resource model generates an
74 IBM Tivoli Monitoring for Databases: Oracle: Reference Guide

event when the threshold you specify for the indication is triggered.
Indication Generated event Defaultseverity
Clearingevents
Page
High CurrentExtents
Oracle_High_CurrentExtentsByUser
Critical Yes 75
High Current Extents indicationOccurs when the number of current extents exceeds the specified threshold. Whenthe indication occurs often enough to trigger an event, the event delivers amessage to the Tivoli Enterprise Console in the following format:<application_label>: The number of extents for the Oracle segment<SegmentOwner>.<SegmentName> in tablespace <TablespaceName>on database <DatabaseName> has crossed above the predefined threshold <Threshold>and is currently at <CurrentExtents>.
If you have Tivoli Business Systems Manager configured for your system, TivoliEnterprise Console forwards the message to Tivoli Business Systems Manager.
You can check the health of this resource model in the IBM Tivoli Monitoring WebHealth Console. For more information, see the IBM Tivoli Monitoring Web HealthConsole documentation.
If one or more objects are fragmented to the point of action, the object can bedefragmented by recreating the object. Recreate the object using the export/importutility while compressing extents or by dropping and recreating the object withmore applicable storage parameters.
The indication has the following attributes:
CurrentExtentsThe number of extents currently allocated to the specified segment.
DatabaseNameThe name of the tablespace that contains this segment.
FreeExtentsMaximum number of extents allowed for the specified segment less thenumber of extents currently allocated to the specified segment.
MaxExtentsThe maximum number of extents allowed for the specified segment.
PctExtentsAllocatedPercentage of current extents to the maximum number allowed for thespecified segment.
SegmentNameIdentifies the name of the segment.
SegmentOwnerThe username of the segment owner.
SegmentTypeThe type of the segment. Segment types include: index partition, tablepartition, table, cluster, index, rollback, deferred rollback, temporary, cache,lobsegment, and lobindex.
Chapter 2. Resource models 75

TablespaceNameThe name of a tablespace in a database that uniquely identifies thetablespace. The tablespace name can contain up to 8 characters.
This indication has the following threshold:v Maximum Current Extents
For more information about this threshold, see “Thresholds” on page 76.
The following table describes the default settings for this indication.
Setting Default value
Send indications to Tivoli Enterprise Console Yes
Send indications to Tivoli Business SystemsManager
Yes
Occurrences 1
Holes 0
Associated tasks and built-in actions None
Note: If you have Tivoli Business Systems Manager configured for your systems,Tivoli Enterprise Console automatically forwards events to Tivoli BusinessSystems Manager. Do not change the configuration of the indication to sendevents to Tivoli Business Systems Manager.
ThresholdsThe following table lists the thresholds that can be set for the Extents by Userresource model. For each threshold it shows the name, a short description, and thedefault value:
Threshold Description Defaultvalue
Maximum CurrentExtents
An indication occurs when the number of currentextents exceeds this value.
5
Parameters
Note: A plus symbol (+) denotes parameters that feature selective logging.Selective logging enables you to choose metrics/properties that you want tolog. The selective logging metrics are listed in the value field of theParameters window.
The following table lists the parameters that can be set for the Extents by Userresource model. The table shows the name, a short description, and the defaultvalue for each parameter:
Parameter Description Default value
Number of Rows Specifies the number of objects with theworst-case extents to return.
50
76 IBM Tivoli Monitoring for Databases: Oracle: Reference Guide

Parameter Description Default value
Segment Metrics + Select the metrics you want to log. See thefollowing logging table for a description ofeach metric.
Allocated
Current Extents
Free Extents
Percent Extents
User Name Specifies the Oracle user name. None
Tasks and built-in actionsNone
LoggingYou can log data for the properties of the managed resource listed in the followingtable. The table shows the context of the managed resource and the properties thatthe resource model logs for the IBM Tivoli Monitoring Web Health Console.
Managedresource
Context Properties
OracleSegment StorageCurrentExtents
The number of extents currently allocated to thespecified segment.
FreeExtentsMaximum number of extents allowed for thespecified segment less the number of extentscurrently allocated to the specified segment.
OracleDatabase.DatabaseName*The name of an Oracle database.
OracleTablespace.TablespaceName*The name of the tablespace that contains thissegment.
PctExtentsAllocatedPercentage of current extents to the maximumnumber allowed for the specified segment.
SegmentName*The name of the segment.
SegmentOwner*The username of the segment owner.
SegmentType*The type of the segment. Segment types include:index partition, table partition, table, cluster,index, rollback, deferred rollback, temporary,cache, lobsegment, and lobindex.
Note: An asterisk (*) denotes a key property.
Chapter 2. Resource models 77

Return codesTable 2 on page 7 contains a listing of resource model return codes, theirdescription, and what action you can take to resolve each code. The return codenumber is displayed in the IBM Tivoli Monitoring Web Health Console status field,or by using the wdmlseng command.
CLI examplewdmeditprf -P OracleProfile#tme-region -add OracleExtentsByUser -c 1800 \-Log -LogDisable -p 12:00 -Agg no -ap 00:15 -NoMin -NoMax -Avg \-t Oracle_Maximum_CurrentExtents 5.000000 \-AddPar IncludeUser "SYS" \-AddPar SegmentMetrics "numPctExtentsAllocated" \-AddPar SegmentMetrics "numFreeExtents" \-AddPar SegmentMetrics "numCurrentExtents" \-DelPar NumberOfRows "50" \-AddPar NumberOfRows "25" \-e Oracle_High_CurrentExtentsByUser \-o 1 -h 0 -severity CRITICAL -SendTBSM -SendTec
78 IBM Tivoli Monitoring for Databases: Oracle: Reference Guide
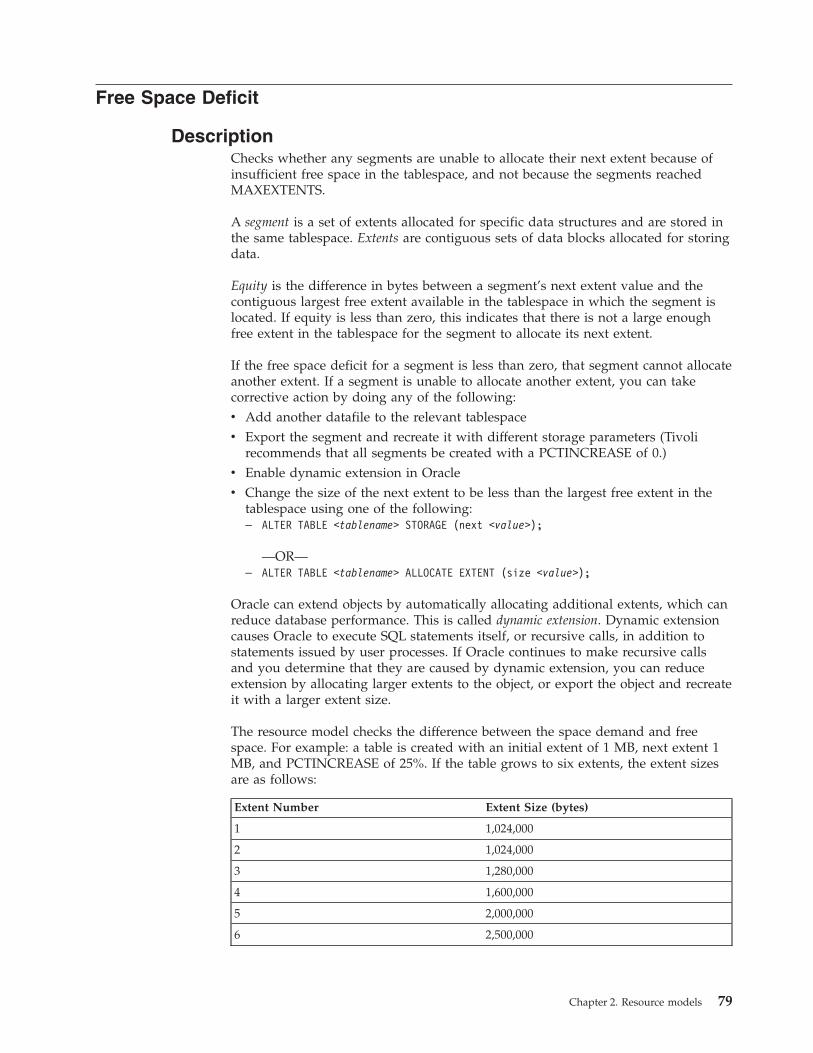
Free Space Deficit
DescriptionChecks whether any segments are unable to allocate their next extent because ofinsufficient free space in the tablespace, and not because the segments reachedMAXEXTENTS.
A segment is a set of extents allocated for specific data structures and are stored inthe same tablespace. Extents are contiguous sets of data blocks allocated for storingdata.
Equity is the difference in bytes between a segment’s next extent value and thecontiguous largest free extent available in the tablespace in which the segment islocated. If equity is less than zero, this indicates that there is not a large enoughfree extent in the tablespace for the segment to allocate its next extent.
If the free space deficit for a segment is less than zero, that segment cannot allocateanother extent. If a segment is unable to allocate another extent, you can takecorrective action by doing any of the following:v Add another datafile to the relevant tablespacev Export the segment and recreate it with different storage parameters (Tivoli
recommends that all segments be created with a PCTINCREASE of 0.)v Enable dynamic extension in Oraclev Change the size of the next extent to be less than the largest free extent in the
tablespace using one of the following:– ALTER TABLE <tablename> STORAGE (next <value>);
—OR—– ALTER TABLE <tablename> ALLOCATE EXTENT (size <value>);
Oracle can extend objects by automatically allocating additional extents, which canreduce database performance. This is called dynamic extension. Dynamic extensioncauses Oracle to execute SQL statements itself, or recursive calls, in addition tostatements issued by user processes. If Oracle continues to make recursive callsand you determine that they are caused by dynamic extension, you can reduceextension by allocating larger extents to the object, or export the object and recreateit with a larger extent size.
The resource model checks the difference between the space demand and freespace. For example: a table is created with an initial extent of 1 MB, next extent 1MB, and PCTINCREASE of 25%. If the table grows to six extents, the extent sizesare as follows:
Extent Number Extent Size (bytes)
1 1,024,000
2 1,024,000
3 1,280,000
4 1,600,000
5 2,000,000
6 2,500,000
Chapter 2. Resource models 79

The size of the seventh extent is 3,125,000 bytes. If the free space in the tablespaceis 3 MB (3,072,000 bytes), the table will not be able to allocate its seventh extent.The equity is -53,000 bytes (3,072,000 - 3,125,000). The resource model outputdisplays this figure. A negative equity figure means that the allocation of nextextent for that segment will fail.
This resource model does not check objects of segment_type CACHE. If theExclude Rollback Segments argument is set to Yes, the resource model does notcheck the free space in any rollback segments.
Resource model overview
Internal name OracleFreeSpaceDeficit
Category Oracle
Indications Low Equity occurs when the equity value is lower than thespecified threshold.
Tasks and built-in actions None
Default cycle time 3600 seconds (1 hour)
Target managed resourceOracleDatabaseManager, OracleInstanceManager
Indications and eventsThe following table summarizes the indications for this resource model, the eventsassociated with the indications, the default severity of the events, and where tofind a detailed description of the indication. The resource model generates anevent when the threshold you specify for the indication is triggered.
Indication Generated event Defaultseverity
Clearingevents
Page
Low Equity Oracle_Low_Equity Critical Yes 80
Low Equity indicationOccurs when the equity value is lower than the specified threshold. When theindication occurs often enough to trigger an event, the event delivers a message tothe Tivoli Enterprise Console in the following format:<application_label>: The equity for the Oracle segment<SegmentOwner>.<SegmentName> in tablespace <TablespaceName>on database <DatabaseName> has crossed below the predefinedthreshold of <Threshold> and is currently at <Equity>.
If you have Tivoli Business Systems Manager configured for your system, TivoliEnterprise Console forwards the message to Tivoli Business Systems Manager.
You can check the health of this resource model in the IBM Tivoli Monitoring WebHealth Console. For more information, see the IBM Tivoli Monitoring Web HealthConsole documentation.
The indication has the following attributes:
DatabaseNameThe name of an Oracle database. The database name contains up to 8
80 IBM Tivoli Monitoring for Databases: Oracle: Reference Guide

characters and corresponds to the name specified in the CREATEDATABASE statement and identified in the DB_NAME parameter in thedatabase initialization parameter file.
EquityThe difference (in bytes) between a segment’s NEXT_EXTENT value andthe largest contiguous free extent available in the tablespace in which thesegment is located. If equity is less than zero, this indicates that there isnot a large enough contiguous free extent in the tablespace for the segmentto allocate its next extent.
NextExtentThe byte size assigned to the next extent allocated to a segment.
SegmentNameThe name of the segment.
SegmentOwnerThe username of the segment owner.
SegmentTypeThe type of the segment. Segment types include: index partition, tablepartition, table, cluster, index, rollback, deferred rollback, temporary, cache,lobsegment, and lobindex.
TablespaceNameThe name of the tablespace that contains this segment.
This indication has the following thresholds:v Minimum Equity
For more information about these thresholds, see “Thresholds” on page 81.
The following table describes the default settings for this indication.
Setting Default value
Send indications to Tivoli Enterprise Console Yes
Send indications to Tivoli Business SystemsManager
Yes
Occurrences 1
Holes 0
Associated tasks and built-in actions None
Note: If you have Tivoli Business Systems Manager configured for your systems,Tivoli Enterprise Console automatically forwards events to Tivoli BusinessSystems Manager. Do not change the configuration of the indication to sendevents to Tivoli Business Systems Manager.
ThresholdsThe following table lists the thresholds that can be set for the Free Space Deficitresource model. For each threshold it shows the name, a short description, and thedefault value:
Chapter 2. Resource models 81

Threshold Description Defaultvalue
Minimum Equity An indication occurs if the equity in the segmentis lower than this value.
0
ParametersThe following table lists the parameters that can be set for the Free Space Deficitresource model. The table shows the name, a short description, and the defaultvalue for each parameter:
Parameter Description Default value
Exclude RollbackSegments
If the Exclude Rollback Segments argument isset to Yes, the resource model does not checkthe free space in any rollback segments.
Yes
Number of Rows Specifies the number of objects with theworst-case extents to return.
50
Tasks and built-in actionsNone
LoggingYou can log data for the properties of the managed resource listed in the followingtable. The table shows the context of the managed resource and the properties thatthe resource model logs for the IBM Tivoli Monitoring Web Health Console.
Managed resource Context Properties
OracleSegment StorageEquity The difference (in bytes) between a segment’s
NEXT_EXTENT value and the largestcontiguous free extent available in thetablespace in which the segment is located.
NextExtentThe byte size assigned to the next extentallocated to a segment.
OracleDatabase.DatabaseName*The name of an Oracle database.
OracleTablespace.TablespaceName*The name of the tablespace that contains thissegment.
SegmentName*The name of the segment.
SegmentOwner*The username of the segment owner.
SegmentType*The type of the segment. Segment typesinclude: index partition, table partition, table,cluster, index, rollback, deferred rollback,temporary, cache, lobsegment, and lobindex.
Note: An asterisk (*) denotes a key property.
82 IBM Tivoli Monitoring for Databases: Oracle: Reference Guide

Return codesTable 2 on page 7 contains a listing of resource model return codes, theirdescription, and what action you can take to resolve each code. The return codenumber is displayed in the IBM Tivoli Monitoring Web Health Console status field,or by using the wdmlseng command.
CLI examplewdmeditprf -P OracleProfile#tme-region -add OracleFreeSpaceDeficit -c 3600 \-Log -LogDisable -p 12:00 -Agg no -ap 00:15 -NoMin -NoMax -Avg \-t Oracle_Minimum_Equity 0.000000 \-DelPar NumberOfRows "50" \-AddPar NumberOfRows "25" \-AddPar ExcludeRollbackSegments "Yes" \-e Oracle_Low_Equity \-o 1 -h 0 -severity CRITICAL -SendTBSM -SendTec
Chapter 2. Resource models 83

Free Space Deficit By Tablespace
DescriptionChecks whether any segments, within specified tablespaces, are unable to allocatetheir next extent because of insufficient free space in the tablespace, and notbecause the segments reached MAXEXTENTS.
A segment is a set of extents allocated for specific data structures and are stored inthe same tablespace. Extents are contiguous sets of data blocks allocated for storingdata.
If the free space deficit for a segment is less than zero, that segment cannot allocateanother extent. If a segment is unable to allocate another extent, you can takecorrective action by doing any of the following:v Add another datafile to the relevant tablespacev Change the size of the next extent to be less than the largest free extent in the
tablespace using ALTER TABLE ALLOCATE EXTENTv Export the segment and recreate it with different storage parameters (Tivoli
recommends that all segments be created with a PCTINCREASE of 0.)v Enable dynamic extension in Oracle
Oracle can extend objects by automatically allocating additional extents, but it canreduce database performance. This is called dynamic extension. Dynamic extensioncauses Oracle to execute SQL statements itself, or recursive calls, in addition tostatements issued by user processes. If Oracle continues to make recursive callsand you determine that they are caused by dynamic extension, you can reduceextension by allocating larger extents to the object, or export the object and recreateit with a larger extent size.
The resource model checks the difference between the space demand and freespace. For example: a table is created with an initial extent of 1 MB, next extent 1MB, and PCTINCREASE of 25%. If the table grows to six extents, the extent sizesare as follows:
Extent Number Extent Size (bytes)
1 1,024,000
2 1,024,000
3 1,280,000
4 1,600,000
5 2,000,000
6 2,500,000
The size of the seventh extent is 3,125,000 bytes. If the free space in the tablespaceis 3 MB (3,072,000 bytes), the table will not be able to allocate its seventh extent.The equity is -53,000 bytes(3,072,000 - 3,125,000). The resource model outputdisplays this figure. A negative equity figure means that the allocation of nextextent for that segment will fail.
This resource model does not check objects of segment_type CACHE. If theExclude Rollback Segments argument is set to Yes, the resource model does notcheck the free space in any rollback segments.
84 IBM Tivoli Monitoring for Databases: Oracle: Reference Guide

This resource model can use tokens to monitor a set of tables specified by thetoken. See Appendix E, “Using tokens to customize resource model parameters” onpage 519 for more information.
Resource model overview
Internal name OracleFreeSpaceDeficitByTablespace
Category Oracle
Indications Low Equity occurs when the equity value is lower than thespecified threshold.
Tasks and built-in actions None
Default cycle time 3600 seconds (1 hour)
Target managed resourceOracleDatabaseManager, OracleInstanceManager
Indications and eventsThe following table summarizes the indications for this resource model, the eventsassociated with the indications, the default severity of the events, and where tofind a detailed description of the indication. The resource model generates anevent when the threshold you specify for the indication is triggered.
Indication Generated event Defaultseverity
Clearingevents
Page
Low Equity Oracle_Low_EquityByTablespace Critical Yes 85
Low Equity indicationOccurs when the equity value is lower than the specified threshold. When theindication occurs often enough to trigger an event, the event delivers a message tothe Tivoli Enterprise Console in the following format:<application_label>: The equity for the Oracle segment<SegmentOwner>.<SegmentName> in tablespace <TablespaceName>on database <DatabaseName> has crossed below the predefinedthreshold of <Threshold> and is currently at <Equity>.
If you have Tivoli Business Systems Manager configured for your system, TivoliEnterprise Console forwards the message to Tivoli Business Systems Manager.
You can check the health of this resource model in the IBM Tivoli Monitoring WebHealth Console. For more information, see the IBM Tivoli Monitoring Web HealthConsole documentation.
The indication has the following attributes:
DatabaseNameThe name of an Oracle database. The database name contains up to 8characters and corresponds to the name specified in the CREATEDATABASE statement and identified in the DB_NAME parameter in thedatabase initialization parameter file.
EquityThe difference (in bytes) between a segment’s NEXT_EXTENT value andthe largest contiguous free extent available in the tablespace in which the
Chapter 2. Resource models 85

segment is located. If equity is less than zero, this indicates that there isnot a large enough contiguous free extent in the tablespace for the segmentto allocate its next extent.
NextExtentThe byte size assigned to the next extent allocated to a segment.
SegmentNameThe name of the segment.
SegmentOwnerThe username of the segment owner.
SegmentTypeThe type of the segment. Segment types include: index partition, tablepartition, table, cluster, index, rollback, deferred rollback, temporary, cache,lobsegment, and lobindex.
TablespaceNameThe name of the tablespace that contains this segment.
This indication has the following thresholds:v Minimum Equity
For more information about these thresholds, see “Thresholds” on page 86.
The following table describes the default settings for this indication.
Setting Default value
Send indications to Tivoli Enterprise Console Yes
Send indications to Tivoli Business SystemsManager
Yes
Occurrences 1
Holes 0
Associated tasks and built-in actions None
Note: If you have Tivoli Business Systems Manager configured for your systems,Tivoli Enterprise Console automatically forwards events to Tivoli BusinessSystems Manager. Do not change the configuration of the indication to sendevents to Tivoli Business Systems Manager.
ThresholdsThe following table lists the thresholds that can be set for the Free Space Deficit byTablespace resource model. For each threshold it shows the name, a shortdescription, and the default value:
Threshold Description Defaultvalue
Minimum Equity An indication occurs if the equity in the segmentis lower than this value.
0
ParametersThe following table lists the parameters that can be set for the Free Space Deficitby Tablespace resource model. The table shows the name, a short description, andthe default value for each parameter:
86 IBM Tivoli Monitoring for Databases: Oracle: Reference Guide

Parameter Description Default value
Include/Exclude Includes or excludes the contents of thetablespaces names field.
Include
Number of Rows Specifies the number of objects with theworst-case extents to return.
50
Tablespace Names Designates the tablespaces names you wantto include or exclude. Use spaces to separatenames.
None
Tasks and built-in actionsNone
LoggingYou can log data for the properties of the managed resource listed in the followingtable. The table shows the context of the managed resource and the properties thatthe resource model logs for the IBM Tivoli Monitoring Web Health Console.
Managedresource
Context Properties
OracleSegment StorageEquity The difference (in bytes) between a segment’s
NEXT_EXTENT value and the largestcontiguous free extent available in thetablespace in which the segment is located.
NextExtentThe byte size assigned to the next extentallocated to a segment.
SegmentName*The name of the segment.
SegmentOwner*The username of the segment owner.
SegmentType*The type of the segment. Segment types include:index partition, table partition, table, cluster,index, rollback, deferred rollback, temporary,cache, lobsegment, and lobindex.
OracleDatabase.DatabaseName*The name of an Oracle database.
OracleTablespace.TablespaceName*The name of the tablespace that contains thissegment.
Note: An asterisk (*) denotes a key property.
Return codesTable 2 on page 7 contains a listing of resource model return codes, theirdescription, and what action you can take to resolve each code. The return codenumber is displayed in the IBM Tivoli Monitoring Web Health Console status field,or by using the wdmlseng command.
Chapter 2. Resource models 87

CLI examplewdmeditprf -P OracleProfile#tme-region \-add OracleFreeSpaceDeficitByTablespace -c 3600 \-Log -LogDisable -p 12:00 -Agg no -ap 00:15 -NoMin -NoMax -Avg \-t Oracle_Minimum_Equity 0.000000 \-AddPar IncludeExcludeTablespaces "Include" \-DelPar NumberOfRows "50" \-AddPar NumberOfRows "25" \-AddPar List "SYSTEM" \-e Oracle_Low_EquityByTablespace \-o 1 -h 0 -severity CRITICAL -SendTBSM -SendTec
88 IBM Tivoli Monitoring for Databases: Oracle: Reference Guide

Free Space Deficit by User
DescriptionChecks whether any segments, for a specified user, are unable to allocate their nextextent because of insufficient free space in the tablespace, and not because thesegments reached MAXEXTENTS.
A segment is a set of extents allocated for specific data structures and are stored inthe same tablespace. Extents are contiguous sets of data blocks allocated for storingdata.
If the free space deficit for a segment is less than zero, that segment cannot allocateanother extent. If a segment is unable to allocate another extent, you can takecorrective action by doing any of the following:v Add another datafile to the relevant tablespacev Change the size of the next extent to be less than the largest free extent in the
tablespace using ALTER TABLE ALLOCATE EXTENTv Export the segment and recreate it with different storage parameters (Tivoli
recommends that all segments be created with a PCTINCREASE of 0.)v Enable dynamic extension in Oracle
Oracle can extend objects by automatically allocating additional extents, which canreduce database performance. This is called dynamic extension. Dynamic extensioncauses Oracle to execute SQL statements itself, or recursive calls, in addition tostatements issued by user processes. If Oracle continues to make recursive callsand you determine that they are caused by dynamic extension, you can reduceextension by allocating larger extents to the object, or export the object and recreateit with a larger extent size.
The resource model checks the difference between the space demand and freespace. For example: a table is created with an initial extent of 1 MB, next extent 1MB, and PCTINCREASE of 25%. If the table grows to six extents, the extent sizesare as follows:
Extent Number Extent Size (bytes)
1 1,024,000
2 1,024,000
3 1,280,000
4 1,600,000
5 2,000,000
6 2,500,000
The size of the seventh extent is 3,125,000 bytes. If the free space in the tablespaceis 3 MB (3,072,000 bytes), the table will not be able to allocate its seventh extent.The equity is -53,000 bytes(3,072,000 - 3,125,000). The resource model outputdisplays this figure. A negative equity figure means that the allocation of nextextent for that segment will fail.
This resource model does not check objects of segment_type CACHE. If theExclude Rollback Segments argument is set to Yes, the resource model does notcheck the free space in any rollback segments.
Chapter 2. Resource models 89

This resource model can use tokens to monitor a set of users specified by thetoken. See Appendix E, “Using tokens to customize resource model parameters” onpage 519 for more information.
Resource model overview
Internal name OracleFreeSpaceDeficitByUser
Category Oracle
Indications Low Equity occurs when the free space deficit by user is lessthan the specified threshold.
Tasks and built-in actions None
Default cycle time 3600 seconds
Target managed resourceOracleDatabaseManager, OracleInstanceManager
Indications and eventsThe following table summarizes the indications for this resource model, the eventsassociated with the indications, the default severity of the events, and where tofind a detailed description of the indication. The resource model generates anevent when the threshold you specify for the indication is triggered.
Indication Generated event Defaultseverity
Clearingevents
Page
Low Equity OracleFreeSpaceDeficitByUser_Low_Equity
Critical Yes 90
Low Equity indicationOccurs when the free space deficit by user is less than the specified threshold.When the indication occurs often enough to trigger an event, the event delivers amessage to the Tivoli Enterprise Console in the following format:<application_label>: The equity for the Oracle segment<SegmentOwner>.<SegmentName> in tablespace <TablespaceName>on database <DatabaseName> has crossed below the predefinedthreshold of <Threshold> and is currently at <Equity>.
If you have Tivoli Business Systems Manager configured for your system, TivoliEnterprise Console forwards the message to Tivoli Business Systems Manager.
You can check the health of this resource model in the IBM Tivoli Monitoring WebHealth Console. For more information, see the IBM Tivoli Monitoring Web HealthConsole documentation.
The indication has the following attributes:
DatabaseNameThe name of an Oracle database. The database name contains up to 8characters and corresponds to the name specified in the CREATEDATABASE statement and identified in the DB_NAME parameter in thedatabase initialization parameter file.
EquityThe difference (in bytes) between a segment’s NEXT_EXTENT value andthe largest contiguous free extent available in the tablespace in which the
90 IBM Tivoli Monitoring for Databases: Oracle: Reference Guide

segment is located. If equity is less than zero, this indicates that there isnot a large enough contiguous free extent in the tablespace for the segmentto allocate its next extent.
NextExtentThe byte size assigned to the next extent allocated to a segment.
SegmentNameThe name of the segment.
SegmentOwnerThe username of the segment owner.
SegmentTypeThe type of the segment. Segment types include: index partition, tablepartition, table, cluster, index, rollback, deferred rollback, temporary, cache,lobsegment, and lobindex.
TablespaceNameThe name of the tablespace that contains this segment.
This indication has the following thresholds:v Minimum Equity
For more information about these thresholds, see “Thresholds” on page 91.
The following table describes the default settings for this indication.
Setting Default value
Send indications to Tivoli Enterprise Console Yes
Send indications to Tivoli Business SystemsManager
Yes
Occurrences 1
Holes 0
Associated tasks and built-in actions None
Note: If you have Tivoli Business Systems Manager configured for your systems,Tivoli Enterprise Console automatically forwards events to Tivoli BusinessSystems Manager. Do not change the configuration of the indication to sendevents to Tivoli Business Systems Manager.
ThresholdsThe following table lists the thresholds that can be set for the Free Space Deficit byUser resource model. For each threshold it shows the name, a short description,and the default value:
Threshold Description Defaultvalue
Minimum Equity An indication occurs if the equity in the segmentis lower than this value.
0
ParametersThe following table lists the parameters that can be set for the Free Space Deficitby User resource model. The table shows the name, a short description, and thedefault value for each parameter:
Chapter 2. Resource models 91

Parameter Description Default value
Number of Rows Specifies the number of objects with theworst-case extents to return.
50
User Name Specifies the number of objects with theworst-case extents to return.
None
Tasks and built-in actionsNone
LoggingYou can log data for the properties of the managed resource listed in the followingtable. The table shows the context of the managed resource and the properties thatthe resource model logs for the IBM Tivoli Monitoring Web Health Console.
Managed resource Context Properties
OracleSegment StorageEquity The difference (in bytes) between a
segment’s NEXT_EXTENT value and thelargest contiguous free extent available inthe tablespace in which the segment islocated.
NextExtentThe byte size assigned to the next extentallocated to a segment.
OracleDatabase.DatabaseName*The name of an Oracle database.
OracleTablespace.TablespaceName*The name of the tablespace that containsthis segment.
SegmentName*The name of the segment.
SegmentOwner*The username of the segment owner.
SegmentType*The type of the segment. Segment typesinclude: index partition, table partition,table, cluster, index, rollback, deferredrollback, temporary, cache, lobsegment, andlobindex.
Note: An asterisk (*) denotes a key property.
Return codesTable 2 on page 7 contains a listing of resource model return codes, theirdescription, and what action you can take to resolve each code. The return codenumber is displayed in the IBM Tivoli Monitoring Web Health Console status field,or by using the wdmlseng command.
CLI examplewdmeditprf -P OracleProfile#tme-region -add OracleFreeSpaceDeficitByUser -c 3600 \-Log -LogDisable -p 12:00 -Agg no -ap 00:15 -NoMin -NoMax -Avg \-t Oracle_Minimum_Equity 0.000000 \
92 IBM Tivoli Monitoring for Databases: Oracle: Reference Guide

-AddPar User "SYS" \-DelPar NumberOfRows "50" \-AddPar NumberOfRows "25" \-e Oracle_Low_EquityByUser \-o 1 -h 0 -severity CRITICAL -SendTBSM -SendTec
Chapter 2. Resource models 93
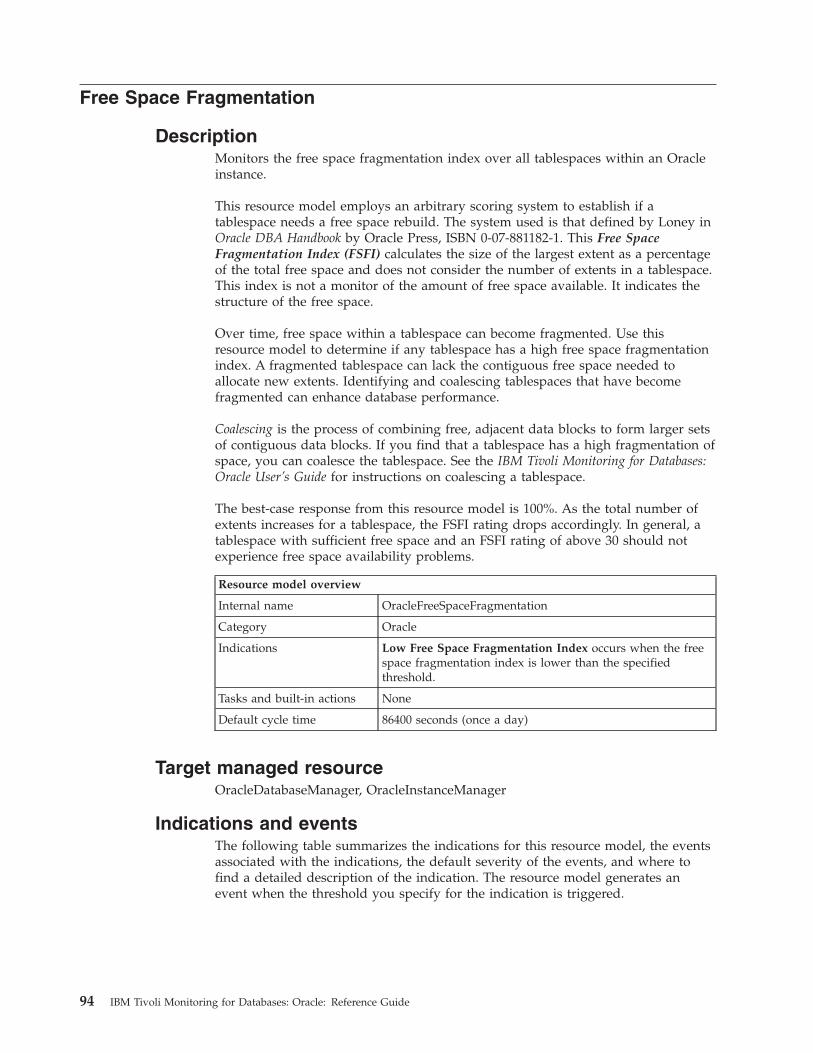
Free Space Fragmentation
DescriptionMonitors the free space fragmentation index over all tablespaces within an Oracleinstance.
This resource model employs an arbitrary scoring system to establish if atablespace needs a free space rebuild. The system used is that defined by Loney inOracle DBA Handbook by Oracle Press, ISBN 0-07-881182-1. This Free SpaceFragmentation Index (FSFI) calculates the size of the largest extent as a percentageof the total free space and does not consider the number of extents in a tablespace.This index is not a monitor of the amount of free space available. It indicates thestructure of the free space.
Over time, free space within a tablespace can become fragmented. Use thisresource model to determine if any tablespace has a high free space fragmentationindex. A fragmented tablespace can lack the contiguous free space needed toallocate new extents. Identifying and coalescing tablespaces that have becomefragmented can enhance database performance.
Coalescing is the process of combining free, adjacent data blocks to form larger setsof contiguous data blocks. If you find that a tablespace has a high fragmentation ofspace, you can coalesce the tablespace. See the IBM Tivoli Monitoring for Databases:Oracle User’s Guide for instructions on coalescing a tablespace.
The best-case response from this resource model is 100%. As the total number ofextents increases for a tablespace, the FSFI rating drops accordingly. In general, atablespace with sufficient free space and an FSFI rating of above 30 should notexperience free space availability problems.
Resource model overview
Internal name OracleFreeSpaceFragmentation
Category Oracle
Indications Low Free Space Fragmentation Index occurs when the freespace fragmentation index is lower than the specifiedthreshold.
Tasks and built-in actions None
Default cycle time 86400 seconds (once a day)
Target managed resourceOracleDatabaseManager, OracleInstanceManager
Indications and eventsThe following table summarizes the indications for this resource model, the eventsassociated with the indications, the default severity of the events, and where tofind a detailed description of the indication. The resource model generates anevent when the threshold you specify for the indication is triggered.
94 IBM Tivoli Monitoring for Databases: Oracle: Reference Guide

Indication Generated event Defaultseverity
Clearingevents
Page
Low Free SpaceFragmentationIndex
Oracle_Low_FreeSpaceFragmentationIndex
Critical Yes 95
Low Free Space Fragmentation Index indicationOccurs when the free space fragmentation index is lower than the specifiedthreshold. When the indication occurs often enough to trigger an event, the eventdelivers a message to the Tivoli Enterprise Console in the following format:<application_label>: The free space fragmentation index for Oracletablespace <TablespaceName> has crossed below the predefined thresholdof <Threshold> and is currently at<FreeSpaceFragmentationIndex> percent.
If you have Tivoli Business Systems Manager configured for your system, TivoliEnterprise Console forwards the message to Tivoli Business Systems Manager.
You can check the health of this resource model in the IBM Tivoli Monitoring WebHealth Console. For more information, see the IBM Tivoli Monitoring Web HealthConsole documentation.
The indication has the following attributes:
DatabaseNameThe name of an Oracle database. The database name contains up to 8characters and corresponds to the name specified in the CREATEDATABASE statement and identified in the DB_NAME parameter in thedatabase initialization parameter file.
FreeSpaceFragmentationIndexThe Free Space Fragmentation Index. This index calculates the size of thelargest extent as a percentage of the total free space without consideringthe number of extents in a tablespace.
TablespaceNameThe name of the tablespace. The tablespace name can contain up to 8characters.
This indication has the following threshold:v Minimum Free Space Fragmentation Index
For more information about this threshold, see “Thresholds” on page 96.
The following table describes the default settings for this indication.
Setting Default value
Send indications to Tivoli Enterprise Console Yes
Send indications to Tivoli Business SystemsManager
Yes
Occurrences 1
Holes 0
Associated tasks and built-in actions None
Chapter 2. Resource models 95
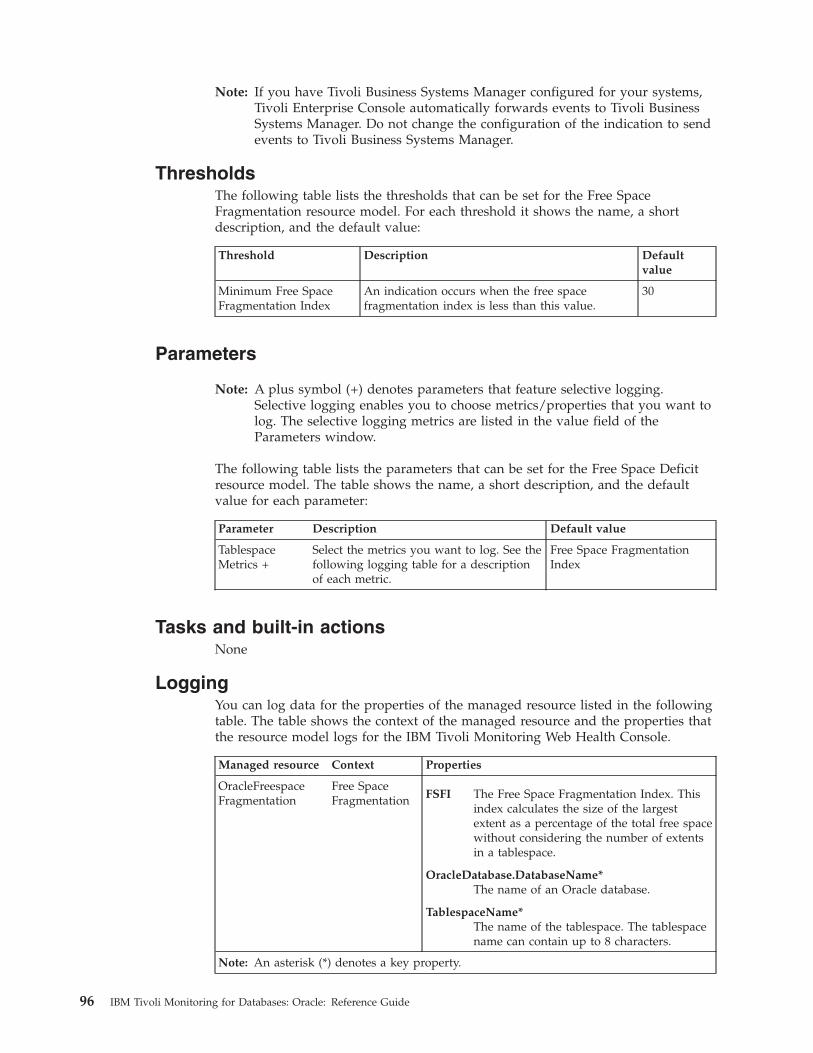
Note: If you have Tivoli Business Systems Manager configured for your systems,Tivoli Enterprise Console automatically forwards events to Tivoli BusinessSystems Manager. Do not change the configuration of the indication to sendevents to Tivoli Business Systems Manager.
ThresholdsThe following table lists the thresholds that can be set for the Free SpaceFragmentation resource model. For each threshold it shows the name, a shortdescription, and the default value:
Threshold Description Defaultvalue
Minimum Free SpaceFragmentation Index
An indication occurs when the free spacefragmentation index is less than this value.
30
Parameters
Note: A plus symbol (+) denotes parameters that feature selective logging.Selective logging enables you to choose metrics/properties that you want tolog. The selective logging metrics are listed in the value field of theParameters window.
The following table lists the parameters that can be set for the Free Space Deficitresource model. The table shows the name, a short description, and the defaultvalue for each parameter:
Parameter Description Default value
TablespaceMetrics +
Select the metrics you want to log. See thefollowing logging table for a descriptionof each metric.
Free Space FragmentationIndex
Tasks and built-in actionsNone
LoggingYou can log data for the properties of the managed resource listed in the followingtable. The table shows the context of the managed resource and the properties thatthe resource model logs for the IBM Tivoli Monitoring Web Health Console.
Managed resource Context Properties
OracleFreespaceFragmentation
Free SpaceFragmentation FSFI The Free Space Fragmentation Index. This
index calculates the size of the largestextent as a percentage of the total free spacewithout considering the number of extentsin a tablespace.
OracleDatabase.DatabaseName*The name of an Oracle database.
TablespaceName*The name of the tablespace. The tablespacename can contain up to 8 characters.
Note: An asterisk (*) denotes a key property.
96 IBM Tivoli Monitoring for Databases: Oracle: Reference Guide

Return codesTable 2 on page 7 contains a listing of resource model return codes, theirdescription, and what action you can take to resolve each code. The return codenumber is displayed in the IBM Tivoli Monitoring Web Health Console status field,or by using the wdmlseng command.
CLI examplewdmeditprf -P OracleProfile#tme-region -add OracleFreeSpaceFragmentation -c 32700 \-Log -LogDisable -p 12:00 -Agg no -ap 00:15 -NoMin -NoMax -Avg \-t Oracle_Minimum_FreeSpaceFragmentationIndex 30.000000 \-AddPar TablespaceMetrics "numFSFI" \-e Oracle_Low_FreeSpaceFragmentationIndex \-o 1 -h 0 -severity CRITICAL -SendTBSM -SendTec
Chapter 2. Resource models 97

Free Space Fragmentation by Tablespace
DescriptionMonitors the free space fragmentation index for specified tablespaces within anOracle instance.
This resource model employs an arbitrary scoring system to establish if atablespace needs a free space rebuild. The system used is that defined by Loney inOracle DBA Handbook by Oracle Press, ISBN 0-07-881182-1. This Free SpaceFragmentation Index (FSFI) calculates the size of the largest extent as a percentageof the total free space and does not consider the number of extents in a tablespace.This index is not a monitor of the amount of free space available. It indicates thestructure of the free space.
Over time, free space within a tablespace can become fragmented. Use thisresource model to determine if any tablespace has a high free space fragmentationindex. A fragmented tablespace can lack the contiguous free space needed toallocate new extents. Identifying and coalescing tablespaces that have becomefragmented can enhance database performance.
Coalescing is the process of combining free, adjacent data blocks to form larger setsof contiguous data blocks. If you find that a tablespace has a high fragmentation ofspace, you can coalesce the tablespace. See the IBM Tivoli Monitoring for Databases:Oracle User’s Guide for instructions on coalescing a tablespace.
The best-case response from this resource model is 100%. As the total number ofextents increases for a tablespace, the FSFI rating drops accordingly. In general, atablespace with sufficient free space and an FSFI rating of above 30 should notexperience free space availability problems.
This resource model can use tokens to monitor a set of tables specified by thetoken. See Appendix E, “Using tokens to customize resource model parameters” onpage 519 for more information.
Resource model overview
Internal name OracleFreeSpaceFragmentationByTablespace
Category Oracle
Indications Low Free Space Fragmentation Index occurs when the freespace fragmentation index is lower than the specifiedthreshold.
Tasks and built-in actions None
Default cycle time 86400 seconds (once a day)
Target managed resourceOracleDatabaseManager, OracleInstanceManager
Indications and eventsThe following table summarizes the indications for this resource model, the eventsassociated with the indications, the default severity of the events, and where tofind a detailed description of the indication. The resource model generates anevent when the threshold you specify for the indication is triggered.
98 IBM Tivoli Monitoring for Databases: Oracle: Reference Guide

Indication Generated event Defaultseverity
Clearingevents
Page
Low FreeSpaceFragmentationIndex
Oracle_Low_FreeSpaceFragmentationIndexByTablespace
Critical Yes 99
Low Free Space Fragmentation Index indicationOccurs when the free space fragmentation index is lower than the specifiedthreshold. When the indication occurs often enough to trigger an event, the eventdelivers a message to the Tivoli Enterprise Console in the following format:<application_label>: The free space fragmentation index for Oracle tablespace<TablespaceName> has crossed below the predefined threshold of<Threshold> and is currently at<FreeSpaceFragmentationIndex> percent.
If you have Tivoli Business Systems Manager configured for your system, TivoliEnterprise Console forwards the message to Tivoli Business Systems Manager.
You can check the health of this resource model in the IBM Tivoli Monitoring WebHealth Console. For more information, see the IBM Tivoli Monitoring Web HealthConsole documentation.
The indication has the following attributes:
DatabaseNameThe name of an Oracle database. The database name contains up to 8characters and corresponds to the name specified in the CREATEDATABASE statement and identified in the DB_NAME parameter in thedatabase initialization parameter file.
FreeSpaceFragmentationIndexThe Free Space Fragmentation Index. This index calculates the size of thelargest extent as a percentage of the total free space without consideringthe number of extents in a tablespace.
TablespaceNameThe name of the tablespace. The tablespace name can contain up to 8characters.
This indication has the following threshold:v Minimum Free Space Fragmentation Index
For more information about this threshold, see “Thresholds” on page 100.
The following table describes the default settings for this indication.
Setting Default value
Send indications to Tivoli Enterprise Console Yes
Send indications to Tivoli Business SystemsManager
Yes
Occurrences 1
Holes 0
Associated tasks and built-in actions None
Chapter 2. Resource models 99
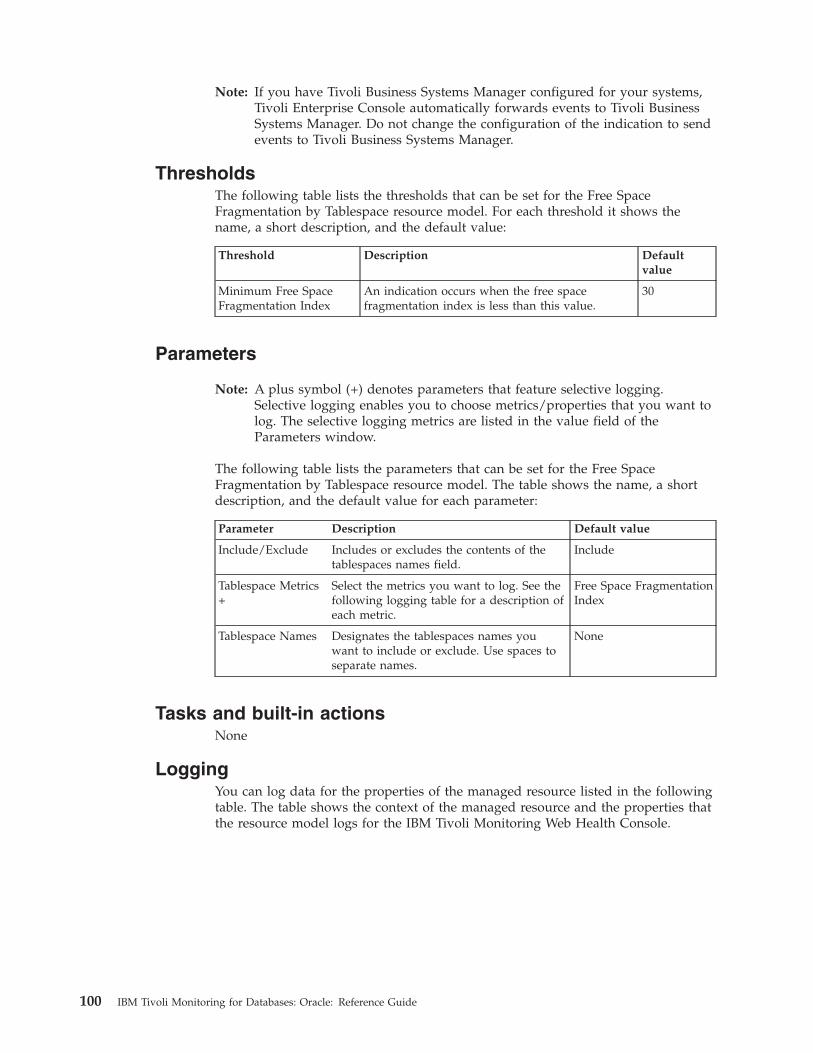
Note: If you have Tivoli Business Systems Manager configured for your systems,Tivoli Enterprise Console automatically forwards events to Tivoli BusinessSystems Manager. Do not change the configuration of the indication to sendevents to Tivoli Business Systems Manager.
ThresholdsThe following table lists the thresholds that can be set for the Free SpaceFragmentation by Tablespace resource model. For each threshold it shows thename, a short description, and the default value:
Threshold Description Defaultvalue
Minimum Free SpaceFragmentation Index
An indication occurs when the free spacefragmentation index is less than this value.
30
Parameters
Note: A plus symbol (+) denotes parameters that feature selective logging.Selective logging enables you to choose metrics/properties that you want tolog. The selective logging metrics are listed in the value field of theParameters window.
The following table lists the parameters that can be set for the Free SpaceFragmentation by Tablespace resource model. The table shows the name, a shortdescription, and the default value for each parameter:
Parameter Description Default value
Include/Exclude Includes or excludes the contents of thetablespaces names field.
Include
Tablespace Metrics+
Select the metrics you want to log. See thefollowing logging table for a description ofeach metric.
Free Space FragmentationIndex
Tablespace Names Designates the tablespaces names youwant to include or exclude. Use spaces toseparate names.
None
Tasks and built-in actionsNone
LoggingYou can log data for the properties of the managed resource listed in the followingtable. The table shows the context of the managed resource and the properties thatthe resource model logs for the IBM Tivoli Monitoring Web Health Console.
100 IBM Tivoli Monitoring for Databases: Oracle: Reference Guide

Managedresource
Context Properties
OracleTablespace Free SpaceFragmentation FSFI The Free Space Fragmentation Index. This
index calculates the size of the largest extentas a percentage of the total free spacewithout considering the number of extents ina tablespace.
OracleDatabase.DatabaseName*The name of an Oracle database.
TablespaceName*The name of the tablespace. The tablespacename can contain up to 8 characters.
Note: An asterisk (*) denotes a key property.
Return codesTable 2 on page 7 contains a listing of resource model return codes, theirdescription, and what action you can take to resolve each code. The return codenumber is displayed in the IBM Tivoli Monitoring Web Health Console status field,or by using the wdmlseng command.
CLI examplewdmeditprf -P OracleProfile#tme-region \-add OracleFreeSpaceFragmentationByTablespace -c 32700 \-Log -LogDisable -p 12:00 -Agg no -ap 00:15 -NoMin -NoMax -Avg \-t Oracle_Minimum_FreeSpaceFragmentationIndexByTablespace 30.000000 \-AddPar IncludeExcludeTablespaces "Include" \-AddPar List "SYSTEM" \-AddPar TablespaceMetrics "numFSFI" \-e Oracle_Low_FreeSpaceFragmentationIndexByTablespace \-o 1 -h 0 -severity CRITICAL -SendTBSM -SendTec
Chapter 2. Resource models 101

Free Tablespace
DescriptionMonitors the percentage of free space for each tablespace in a database.
If free space becomes low in a tablespace, either add a new datafile to theoffending tablespace or drop unwanted database objects. If you run out of spaceand a new object needs to be allocated, you receive an Oracle error that thedatabase is unable to allocate an extent.
With Oracle Version 7.2 and higher, datafiles can be created or modified toautomatically extend using one of the following SQL commands:ALTER TABLESPACE tsname ADD DATAFILE ‘file’ AUTOEXTEND ON;
—OR—ALTER DATABASE DATAFILE ’file’ AUTOEXTEND ON;
You can set the Exclude TS With Rollback Segments argument to Yes to excludetablespaces containing rollback segments when the resource model checkstablespace free space. A database always contains the SYSTEM rollback segment inthe SYSTEM tablespace, so if Exclude TS With Rollback Segments is set to Yes,the SYSTEM tablespace is not monitored.
Resource model overview
Internal name OracleFreeTablespace
Category Oracle
Indications Low Free Space Percentage occurs when the tablespace’spercentage of free space is lower than the specifiedthreshold.
Tasks and built-in actions None
Default cycle time 300 seconds (5 min)
Target managed resourceOracleDatabaseManager, OracleInstanceManager
Indications and eventsThe following table summarizes the indications for this resource model, the eventsassociated with the indications, the default severity of the events, and where tofind a detailed description of the indication. The resource model generates anevent when the threshold you specify for the indication is triggered.
Indication Generated event Defaultseverity
Clearingevents
Page
Low FreeSpacePercentage
Oracle_Low_PercentFreeTablespace
Critical Yes 102
Low Free Space Percentage indicationOccurs when the tablespace’s percentage of free space is lower than the specifiedthreshold. When the indication occurs often enough to trigger an event, the eventdelivers a message to the Tivoli Enterprise Console in the following format:
102 IBM Tivoli Monitoring for Databases: Oracle: Reference Guide

<application_label>: The percentage of free space in Oracletablespace <TablespaceName> on database <DatabaseName>has crossed below the predefined threshold of <Threshold> percent and iscurrently at <PercentFreeBytes> percent.
If you have Tivoli Business Systems Manager configured for your system, TivoliEnterprise Console forwards the message to Tivoli Business Systems Manager.
You can check the health of this resource model in the IBM Tivoli Monitoring WebHealth Console. For more information, see the IBM Tivoli Monitoring Web HealthConsole documentation.
The indication has the following attributes:
DatabaseNameThe name of an Oracle database. The database name contains up to 8characters and corresponds to the name specified in the CREATEDATABASE statement and identified in the DB_NAME parameter in thedatabase initialization parameter file.
MBAllocatedTotal space dedicated for use by the tablespace. This value is thesummation of sizes of the datafile(s) included in the tablespace.
MBFreeSpace (in megabytes) within the tablespace which is currently unallocated.
MBUsedSpace (in megabytes) within the tablespace which has already beenallocated for use by objects stored in the tablespace.
PercentFreeBytesThe percentage of unallocated bytes within a tablespace.
TablespaceNameThe name of the tablespace. The tablespace name can contain up to 8characters.
This indication has the following threshold:v Minimum Percent Free Space
For more information about this threshold, see “Thresholds” on page 104.
The following table describes the default settings for this indication.
Setting Default value
Send indications to Tivoli Enterprise Console Yes
Send indications to Tivoli Business SystemsManager
Yes
Occurrences 1
Holes 0
Associated tasks and built-in actions None
Note: If you have Tivoli Business Systems Manager configured for your systems,Tivoli Enterprise Console automatically forwards events to Tivoli BusinessSystems Manager. Do not change the configuration of the indication to sendevents to Tivoli Business Systems Manager.
Chapter 2. Resource models 103

ThresholdsThe following table lists the thresholds that can be set for the Free Tablespaceresource model. For each threshold it shows the name, a short description, and thedefault value:
Threshold Description Defaultvalue
Minimum Percent FreeSpace
An indication occurs when the percentage of freebytes is lower than this value.
15
Parameters
Note: A plus symbol (+) denotes parameters that feature selective logging.Selective logging enables you to choose metrics/properties that you want tolog. The selective logging metrics are listed in the value field of theParameters window.
The following table lists the parameter that can be set for the Free Tablespaceresource model. The table shows the name, a short description, and the defaultvalue for the parameter:
Parameter Description Default value
ExcludeTablespaces withRollback Segments
YES ignores tablespaces that containrollback segments. NO does not ignoretablespaces that contain rollbacksegments.
Yes
Tablespace Metrics+
Select the metrics you want to log. Seethe following logging table for adescription of each metric.
MB Allocated
MB Free
MB Used
Percent Free Bytes
Tasks and built-in actionsNone
LoggingYou can log data for the properties of the managed resource listed in the followingtable. The table shows the context of the managed resource and the properties thatthe resource model logs for the IBM Tivoli Monitoring Web Health Console.
104 IBM Tivoli Monitoring for Databases: Oracle: Reference Guide

Managed resource Context Properties
OracleTablespace StorageMBAllocated
Total space dedicated for use by thetablespace. This value is the summation ofsizes of the datafiles included in thetablespace.
MBFreeSpace (in megabytes) within the tablespacewhich is currently unallocated.
MBUsedSpace (in megabytes) within the tablespacewhich has already been allocated for use byobjects stored in the tablespace.
OracleDatabase.DatabaseName*The name of an Oracle database.
PercentFreeBytesThe percentage of unallocated bytes within atablespace.
TablespaceName*The name of the tablespace. The tablespacename can contain up to 8 characters.
Note: An asterisk (*) denotes a key property.
Return codesTable 2 on page 7 contains a listing of resource model return codes, theirdescription, and what action you can take to resolve each code. The return codenumber is displayed in the IBM Tivoli Monitoring Web Health Console status field,or by using the wdmlseng command.
CLI examplewdmeditprf -P OracleProfile#tme-region -add OracleFreeTablespace -c 300 \-Log -LogDisable -p 12:00 -Agg no -ap 00:15 -NoMin -NoMax -Avg \-t Oracle_Minimum_PercentFreeTablespace 15.000000 \-AddPar TablespaceMetrics "numPercentFreeBytes" \-AddPar TablespaceMetrics "numMBFree" \-AddPar TablespaceMetrics "numMBAllocated" \-AddPar TablespaceMetrics "numMBUsed" \-AddPar ExcludeTSWithRollbackSegments "Yes" \-e Oracle_Low_PercentFreeTablespace \-o 1 -h 0 -severity CRITICAL -SendTBSM -SendTec
Chapter 2. Resource models 105

Free Tablespace by Tablespace
DescriptionMonitors the percentage of free space for the specified tablespaces.
If free space becomes low in a tablespace, either add a new datafile to theoffending tablespace or drop unwanted database objects. If you run out of spaceand a new object needs to be allocated, you receive an Oracle error that thedatabase is unable to allocate an extent.
With Oracle Version 7.2 and higher, datafiles can be created or modified toautomatically extend using one of the following SQL commands:ALTER TABLESPACE tsname ADD DATAFILE ‘file’ AUTOEXTEND ON;
—OR—ALTER DATABASE DATAFILE ’file’ AUTOEXTEND ON;
You can set the Exclude TS With Rollback Segments argument to Yes to excludetablespaces containing rollback segments when the resource model checkstablespace free space. A database always contains the SYSTEM rollback segment inthe SYSTEM tablespace, so if Exclude TS With Rollback Segments is set to Yes,the SYSTEM tablespace will not be monitored.
This resource model can use tokens to monitor a set of tables specified by thetoken. See Appendix E, “Using tokens to customize resource model parameters” onpage 519 for more information.
Resource model overview
Internal name OracleFreeTablespaceByTablespace
Category Oracle
Indications Low Free Space Percentage occurs when the tablespace’spercentage of free space is lower than the specifiedthreshold.
Tasks and built-in actions None
Default cycle time 300 seconds (5 min)
Target managed resourceOracleDatabaseManager, OracleInstanceManager
Indications and eventsThe following table summarizes the indications for this resource model, the eventsassociated with the indications, the default severity of the events, and where tofind a detailed description of the indication. The resource model generates anevent when the threshold you specify for the indication is triggered.
Indication Generated event Defaultseverity
Clearingevents
Page
Low FreeSpacePercentage
OracleFreeTablespaceByTablespace_Low_PercentFreeTablespace
Critical Yes 107
106 IBM Tivoli Monitoring for Databases: Oracle: Reference Guide

Low Free Space Percentage indicationOccurs when the tablespace’s percentage of free space is lower than the specifiedthreshold. When the indication occurs often enough to trigger an event, the eventdelivers a message to the Tivoli Enterprise Console in the following format:<application_label>: The percentage of free space in Oracletablespace <TablespaceName> on database <DatabaseName>has crossed below the predefined threshold of <Threshold> percent and iscurrently at <PercentFreeBytes> percent.
If you have Tivoli Business Systems Manager configured for your system, TivoliEnterprise Console forwards the message to Tivoli Business Systems Manager.
You can check the health of this resource model in the IBM Tivoli Monitoring WebHealth Console. For more information, see the IBM Tivoli Monitoring Web HealthConsole documentation.
The indication has the following attributes:
DatabaseNameThe name of an Oracle database. The database name contains up to 8characters and corresponds to the name specified in the CREATEDATABASE statement and identified in the DB_NAME parameter in thedatabase initialization parameter file.
MBAllocatedTotal space dedicated for use by the tablespace. This value is thesummation of sizes of the datafiles included in the tablespace.
MBFreeSpace (in megabytes) within the tablespace which is currently unallocated.
MBUsedSpace (in megabytes) within the tablespace which has already beenallocated for use by objects stored in the tablespace.
PercentFreeBytesThe percentage of unallocated bytes within a tablespace.
TablespaceNameThe name of the tablespace. The tablespace name can contain up to 8characters.
This indication has the following threshold:v Minimum Percent Free Space
For more information about this threshold, see “Thresholds” on page 108.
The following table describes the default settings for this indication.
Setting Default value
Send indications to Tivoli Enterprise Console Yes
Send indications to Tivoli Business SystemsManager
Yes
Occurrences 1
Holes 0
Associated tasks and built-in actions None
Chapter 2. Resource models 107

Note: If you have Tivoli Business Systems Manager configured for your systems,Tivoli Enterprise Console automatically forwards events to Tivoli BusinessSystems Manager. Do not change the configuration of the indication to sendevents to Tivoli Business Systems Manager.
ThresholdsThe following table lists the thresholds that can be set for the Free Tablespace byTablespace resource model. For each threshold it shows the name, a shortdescription, and the default value:
Threshold Description Defaultvalue
Minimum Percent FreeSpace
An indication occurs when the percentage of freespace in the tablespace is lower than this value.
15
Parameters
Note: A plus symbol (+) denotes parameters that feature selective logging.Selective logging enables you to choose metrics/properties that you want tolog. The selective logging metrics are listed in the value field of theParameters window.
The following table lists the parameters that can be set for the Free Tablespace byTablespace resource model. The table shows the name, a short description, and thedefault value for each parameter:
Parameter Description Default value
Include/Exclude Includes or excludes the contents ofthe tablespaces names field.
Include
TablespaceMetrics +
Select the metrics you want to log. Seethe following logging table for adescription of each metric.
MB Allocated
MB Free
MB Used
Percent Free Bytes
Tablespace Names Designates the tablespaces names youwant to include or exclude. Use spacesto separate names.
None
Tasks and built-in actionsNone
LoggingYou can log data for the properties of the managed resource listed in the followingtable. The table shows the context of the managed resource and the properties thatthe resource model logs for the IBM Tivoli Monitoring Web Health Console.
108 IBM Tivoli Monitoring for Databases: Oracle: Reference Guide
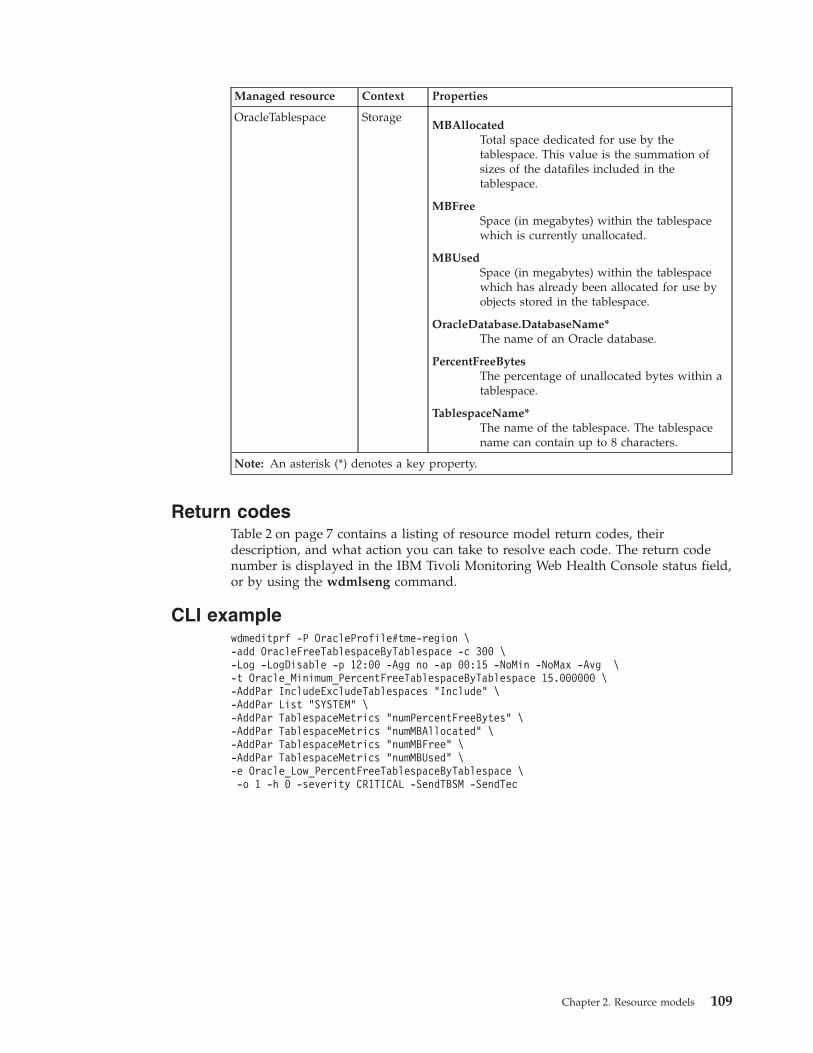
Managed resource Context Properties
OracleTablespace StorageMBAllocated
Total space dedicated for use by thetablespace. This value is the summation ofsizes of the datafiles included in thetablespace.
MBFreeSpace (in megabytes) within the tablespacewhich is currently unallocated.
MBUsedSpace (in megabytes) within the tablespacewhich has already been allocated for use byobjects stored in the tablespace.
OracleDatabase.DatabaseName*The name of an Oracle database.
PercentFreeBytesThe percentage of unallocated bytes within atablespace.
TablespaceName*The name of the tablespace. The tablespacename can contain up to 8 characters.
Note: An asterisk (*) denotes a key property.
Return codesTable 2 on page 7 contains a listing of resource model return codes, theirdescription, and what action you can take to resolve each code. The return codenumber is displayed in the IBM Tivoli Monitoring Web Health Console status field,or by using the wdmlseng command.
CLI examplewdmeditprf -P OracleProfile#tme-region \-add OracleFreeTablespaceByTablespace -c 300 \-Log -LogDisable -p 12:00 -Agg no -ap 00:15 -NoMin -NoMax -Avg \-t Oracle_Minimum_PercentFreeTablespaceByTablespace 15.000000 \-AddPar IncludeExcludeTablespaces "Include" \-AddPar List "SYSTEM" \-AddPar TablespaceMetrics "numPercentFreeBytes" \-AddPar TablespaceMetrics "numMBAllocated" \-AddPar TablespaceMetrics "numMBFree" \-AddPar TablespaceMetrics "numMBUsed" \-e Oracle_Low_PercentFreeTablespaceByTablespace \-o 1 -h 0 -severity CRITICAL -SendTBSM -SendTec
Chapter 2. Resource models 109

Full Table Scan
DescriptionMonitors the percentage of full table scans from long tables, and reports thepercentage of total rows retrieved from full table scans. If you have a large numberof full table scans, there is room for performance tuning.
If the percentage of full table scans that come from long tables exceeds 20%,investigate which tables are being scanned and consider adding indexes to reducethe number of full table scans from long tables.
If the row source percentage exceeds 15% (or whatever threshold is deemed to beunacceptable), check the percentage of long full table scans to determine thepercentage of full table scans that are from short tables. If a table has a smallnumber of rows, a full table scan can be more efficient than an index scan.
Row source percentage is calculated as:
100 * [S / (S + R)]
where:
S = rows obtained by table scans
R = rows obtained by rowid
Full table scans are typically faster than index range scans when accessing a largepercentage of data in a table because full table scans use larger I/O calls. Using afew large I/O calls is cheaper than using many small I/O calls. Oracle performsfull table scans by reading the blocks sequentially. Each row is scanned to determineif it meets the statement’s WHERE clause. I/O calls larger than a single block canbe used to speed up the process.
Long table scans are unscalable and require I/O expense. A high number of longfull table scans for high-volume or interactive online operations could indicatepoor transaction design, missing indexes, or poor SQL optimization.
Resource model overview
Internal name OracleFullTableScan
Category Oracle
Indications High Long Table Full Table Scans occurs when the numberof long table full table scans exceeds the specified threshold.
High Row Source Percentage occurs when the number ofrow source percentage is higher than the specified threshold.
Tasks and built-in actions None
Default cycle time 3600 seconds (1 hour)
Target managed resourceOracleDatabaseManager, OracleInstanceManager
110 IBM Tivoli Monitoring for Databases: Oracle: Reference Guide

Indications and eventsThe following table summarizes the indications for this resource model, the eventsassociated with the indications, the default severity of the events, and where tofind a detailed description of the indication. The resource model generates anevent when the threshold you specify for the indication is triggered.
Indication Generated event Defaultseverity
Clearingevents
Page
High Long TableFull Table Scans
Oracle_High_LongTableFullTableScans
Critical Yes 111
High RowSourcePercentage
Oracle_High_RowSourcePercentage
Critical Yes 112
High Long Table Full Table Scans indicationOccurs when the number of long table full table scans exceeds the specifiedthreshold. When the indication occurs often enough to trigger an event, the eventdelivers a message to the Tivoli Enterprise Console in the following format:<application_label>: The percentage of long full table scans for Oracleinstance <InstanceName> has crossed above the predefined threshold of<Threshold> percent and is currently at<IntervalLongTableFullTableScans> percent.
If you have Tivoli Business Systems Manager configured for your system, TivoliEnterprise Console forwards the message to Tivoli Business Systems Manager.
You can check the health of this resource model in the IBM Tivoli Monitoring WebHealth Console. For more information, see the IBM Tivoli Monitoring Web HealthConsole documentation.
The indication has the following attributes:
InstanceNameThe name of an Oracle database instance.
IntervalLongTableFullTableScansPercentage of full table scans that come from long tables for the currentmonitoring interval.
This indication has the following threshold:v Maximum Row Source Percentage
For more information about this threshold, see “Thresholds” on page 112.
The following table describes the default settings for this indication.
Setting Default value
Send indications to Tivoli Enterprise Console Yes
Send indications to Tivoli Business SystemsManager
Yes
Occurrences 1
Holes 0
Associated tasks and built-in actions None
Chapter 2. Resource models 111

Note: If you have Tivoli Business Systems Manager configured for your systems,Tivoli Enterprise Console automatically forwards events to Tivoli BusinessSystems Manager. Do not change the configuration of the indication to sendevents to Tivoli Business Systems Manager.
High Row Source Percentage indicationOccurs when the number of row source percentage is higher than the specifiedthreshold. When the indication occurs often enough to trigger an event, the eventdelivers a message to the Tivoli Enterprise Console in the following format:<application_label>: The row source percentage for Oracle instance<InstanceName> has crossed above the predefined threshold of<Threshold> percent and is currently at <RowSourcePercentage> percent.
If you have Tivoli Business Systems Manager configured for your system, TivoliEnterprise Console forwards the message to Tivoli Business Systems Manager.
You can check the health of this resource model in the IBM Tivoli Monitoring WebHealth Console. For more information, see the IBM Tivoli Monitoring Web HealthConsole documentation.
The indication has the following attributes:
InstanceNameThe name of an Oracle database instance.
RowSourcePercentageThe percentage of total rows retrieved from a full-table scan.
This indication has the following threshold:v Maximum Row Source Percentage
For more information about this threshold, see “Thresholds” on page 112.
The following table describes the default settings for this indication.
Setting Default value
Send indications to Tivoli Enterprise Console Yes
Send indications to Tivoli Business SystemsManager
Yes
Occurrences 1
Holes 0
Associated tasks and built-in actions None
Note: If you have Tivoli Business Systems Manager configured for your systems,Tivoli Enterprise Console automatically forwards events to Tivoli BusinessSystems Manager. Do not change the configuration of the indication to sendevents to Tivoli Business Systems Manager.
ThresholdsThe following table lists the thresholds that can be set for the Full Table Scanresource model. For each threshold it shows the name, a short description, and thedefault value:
112 IBM Tivoli Monitoring for Databases: Oracle: Reference Guide

Threshold Description Defaultvalue
Maximum Row SourcePercentage
An indication occurs when the row sourcepercentage exceeds this value.
15
Maximum Long TableFull Table Scans
An indication occurs when the number of longtable full table scans exceeds this value.
20
Parameters
Note: A plus symbol (+) denotes parameters that feature selective logging.Selective logging enables you to choose metrics/properties that you want tolog. The selective logging metrics are listed in the value field of theParameters window.
The following table lists the parameters that can be set for the Full Table Scanresource model. The table shows the name, a short description, and the defaultvalue for each parameter:
Parameter Description Default value
TablespaceMetrics +
Select the metrics you want to log.See the following logging table for adescription of each metric.
Num Interval Long Table FullTable Scans
Row Source Percentage
Tasks and built-in actionsNone
LoggingYou can log data for the properties of the managed resource listed in the followingtable. The table shows the context of the managed resource and the properties thatthe resource model logs for the IBM Tivoli Monitoring Web Health Console.
Managed resource Context Properties
OracleInstance I/OInstanceName
The name of an Oracle database instance.
IntervalLongTableFullTableScansPercentage of full table scans that comefrom long tables for the current monitoringinterval.
OracleDatabase.DatabaseName*The name of an Oracle database.
RowSourcePercentageThe percentage of total rows retrievedfrom a full-table scan.
Note: An asterisk (*) denotes a key property.
Chapter 2. Resource models 113

Return codesTable 2 on page 7 contains a listing of resource model return codes, theirdescription, and what action you can take to resolve each code. The return codenumber is displayed in the IBM Tivoli Monitoring Web Health Console status field,or by using the wdmlseng command.
CLI examplewdmeditprf -P OracleProfile#tme-region -add OracleFullTableScan -c 3600 \-Log -LogDisable -p 12:00 -Agg no -ap 00:15 -NoMin -NoMax -Avg \-t Oracle_Maximum_LongTableFullTableScans 20.000000 \-t Oracle_Maximum_RowSourcePercentage 15.000000 \-AddPar InstanceMetrics "numRowSourcePercentage" \-AddPar InstanceMetrics "numIntervalLongTableFullTableScans" \-e Oracle_High_RowSourcePercentage \-o 1 -h 0 -severity CRITICAL -SendTBSM -SendTec \-e Oracle_High_LongTableFullTableScans \-o 1 -h 0 -severity CRITICAL -SendTBSM -SendTec
114 IBM Tivoli Monitoring for Databases: Oracle: Reference Guide

I/O
DescriptionMonitors the number of physical reads and physical writes for the datafiles in thedatabase.
Physical reads are data blocks read from a disk. If physical reads is high relative tothe amount of returned data, this might indicate queries are executing against thedatabase which should be reviewed for optimization. Physical writes are data blockswritten to disk.
Use this resource model to determine if any particular datafile has an abnormallyhigh number of physical reads or writes. This data can be useful in determiningwhether a datafile should be moved to another disk because one of the disks is anI/O bottleneck, caused by an excessive number of reads or writes from a datafile.The data can also be used for capacity planning by charting the growth in I/Oover time.
Resource model overview
Internal name OracleIO
Category Oracle
Indications High Physical Reads occurs when the I/O read exceeds thespecified threshold.
High Physical Writes occurs when the I/O writes exceedsthe specified threshold.
Tasks and built-in actions None
Default cycle time 3600 seconds (1 hour)
Target managed resourceOracleDatabaseManager, OracleInstanceManager
Indications and eventsThe following table summarizes the indications for this resource model, the eventsassociated with the indications, the default severity of the events, and where tofind a detailed description of the indication. The resource model generates anevent when the threshold you specify for the indication is triggered.
Indication Generated event Defaultseverity
Clearingevents
Page
High PhysicalReads
Oracle_High_PhysicalReads
Critical Yes 115
High PhysicalWrites
Oracle_High_PhysicalWrites
Critical Yes 117
High Physical Reads indicationOccurs when the I/O read exceeds the specified threshold. When the indicationoccurs often enough to trigger an event, the event delivers a message to the TivoliEnterprise Console in the following format:<application_label>: The number of physical reads for Oracle file <FileName>has crossed above the predefined threshold of <Threshold> physicalreads and is currently at <PhysicalReads> physical reads.
Chapter 2. Resource models 115
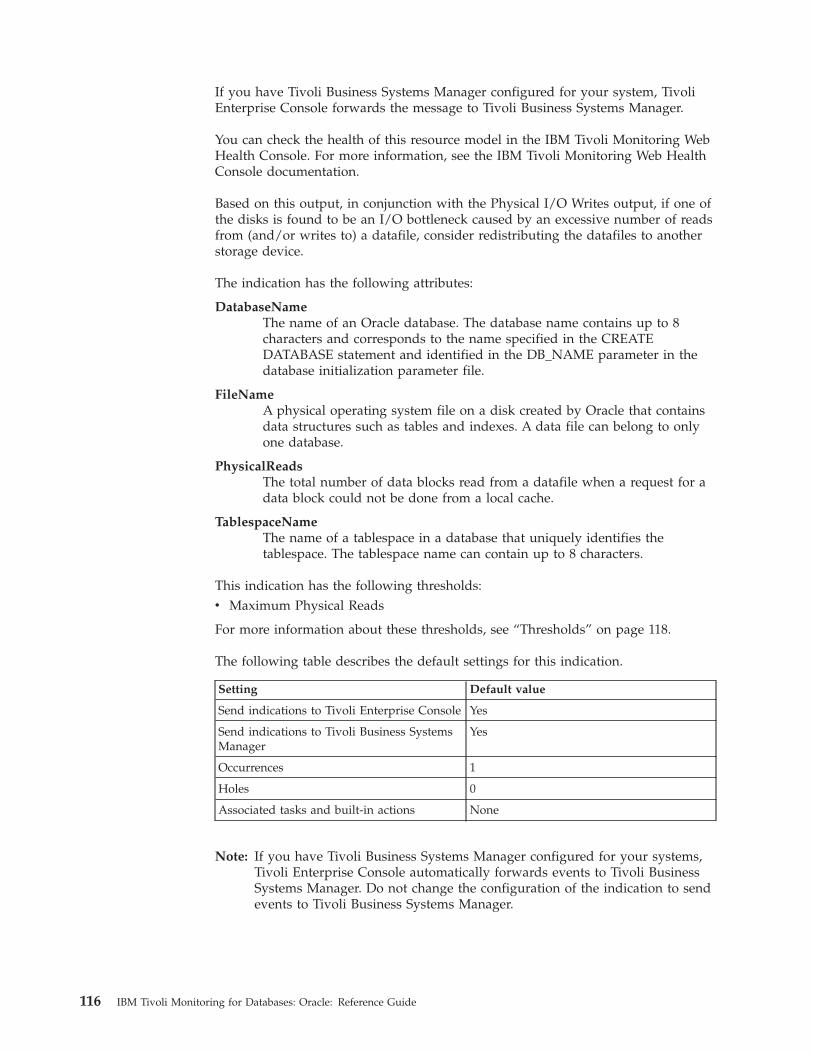
If you have Tivoli Business Systems Manager configured for your system, TivoliEnterprise Console forwards the message to Tivoli Business Systems Manager.
You can check the health of this resource model in the IBM Tivoli Monitoring WebHealth Console. For more information, see the IBM Tivoli Monitoring Web HealthConsole documentation.
Based on this output, in conjunction with the Physical I/O Writes output, if one ofthe disks is found to be an I/O bottleneck caused by an excessive number of readsfrom (and/or writes to) a datafile, consider redistributing the datafiles to anotherstorage device.
The indication has the following attributes:
DatabaseNameThe name of an Oracle database. The database name contains up to 8characters and corresponds to the name specified in the CREATEDATABASE statement and identified in the DB_NAME parameter in thedatabase initialization parameter file.
FileNameA physical operating system file on a disk created by Oracle that containsdata structures such as tables and indexes. A data file can belong to onlyone database.
PhysicalReadsThe total number of data blocks read from a datafile when a request for adata block could not be done from a local cache.
TablespaceNameThe name of a tablespace in a database that uniquely identifies thetablespace. The tablespace name can contain up to 8 characters.
This indication has the following thresholds:v Maximum Physical Reads
For more information about these thresholds, see “Thresholds” on page 118.
The following table describes the default settings for this indication.
Setting Default value
Send indications to Tivoli Enterprise Console Yes
Send indications to Tivoli Business SystemsManager
Yes
Occurrences 1
Holes 0
Associated tasks and built-in actions None
Note: If you have Tivoli Business Systems Manager configured for your systems,Tivoli Enterprise Console automatically forwards events to Tivoli BusinessSystems Manager. Do not change the configuration of the indication to sendevents to Tivoli Business Systems Manager.
116 IBM Tivoli Monitoring for Databases: Oracle: Reference Guide

High Physical Writes indicationOccurs when the I/O writes exceeds the specified threshold. When the indicationoccurs often enough to trigger an event, the event delivers a message to the TivoliEnterprise Console in the following format:<application_label>: The number of physical writes for Oracle file<FileName> has crossed above the predefined threshold of<Threshold> physical writes and is currently at<PhysicalWrites> physical writes.
If you have Tivoli Business Systems Manager configured for your system, TivoliEnterprise Console forwards the message to Tivoli Business Systems Manager.
You can check the health of this resource model in the IBM Tivoli Monitoring WebHealth Console. For more information, see the IBM Tivoli Monitoring Web HealthConsole documentation.
Based on this output, in conjunction with the Physical I/O Writes output, if one ofthe disks is found to be an I/O bottleneck caused by an excessive number of readsfrom (and/or writes to) a datafile, consider redistributing the datafiles to anotherstorage device.
The indication has the following attributes:
DatabaseNameThe name of an Oracle database. The database name contains up to 8characters and corresponds to the name specified in the CREATEDATABASE statement and identified in the DB_NAME parameter in thedatabase initialization parameter file.
FileNameA physical operating system file on a disk created by Oracle that containsdata structures such as tables and indexes. A data file can belong to onlyone database.
PhysicalWritesThe total number of data blocks written to disk.
TablespaceNameThe name of a tablespace in a database that uniquely identifies thetablespace. The tablespace name can contain up to 8 characters.
This indication has the following threshold:v Maximum Physical Writes
For more information about this threshold, see “Thresholds” on page 118.
The following table describes the default settings for this indication.
Setting Default value
Send indications to Tivoli Enterprise Console Yes
Send indications to Tivoli Business SystemsManager
Yes
Occurrences 1
Holes 0
Associated tasks and built-in actions None
Chapter 2. Resource models 117

Note: If you have Tivoli Business Systems Manager configured for your systems,Tivoli Enterprise Console automatically forwards events to Tivoli BusinessSystems Manager. Do not change the configuration of the indication to sendevents to Tivoli Business Systems Manager.
ThresholdsThe following table lists the thresholds that can be set for the I/O resource model.For each threshold it shows the name, a short description, and the default value:
Threshold Description Defaultvalue
Maximum PhysicalReads
An indication occurs when the number of I/Oreads exceeds this value.
500
Maximum PhysicalWrites
An indication occurs when the number of I/Owrites exceeds this value.
1500
Parameters
Note: A plus symbol (+) denotes parameters that feature selective logging.Selective logging enables you to choose metrics/properties that you want tolog. The selective logging metrics are listed in the value field of theParameters window.
The following table lists the parameters that can be set for the I/O resource model.The table shows the name, a short description, and the default value for eachparameter:
Parameter Description Default value
Datafile Metrics + Select the metrics you want to log.See the following logging table for adescription of each metric.
Physical Reads
Physical Writes
Tasks and built-in actionsNone
LoggingYou can log data for the properties of the managed resource listed in the followingtable. The table shows the context of the managed resource and the properties thatthe resource model logs for the IBM Tivoli Monitoring Web Health Console.
118 IBM Tivoli Monitoring for Databases: Oracle: Reference Guide

Managedresource
Context Properties
OracleIO I/OFileName*
A physical operating system file on a disk created byOracle that contains data structures such as tablesand indexes. A data file can belong to only onedatabase.
OracleDatabase.DatabaseName*The name of an Oracle database.
OracleTablespace.TablespaceName*The name of a tablespace in a database that uniquelyidentifies the tablespace. The tablespace name cancontain up to 8 characters.
PhysicalReadsThe total number of data blocks read from a datafilewhen a request for a data block could not be donefrom a local cache.
PhysicalWritesThe total number of data blocks written to disk.
Note: An asterisk (*) denotes a key property.
Return codesTable 2 on page 7 contains a listing of resource model return codes, theirdescription, and what action you can take to resolve each code. The return codenumber is displayed in the IBM Tivoli Monitoring Web Health Console status field,or by using the wdmlseng command.
CLI examplewdmeditprf -P OracleProfile#tme-region -add OracleIO -c 3600 \-Log -LogDisable -p 12:00 -Agg no -ap 00:15 -NoMin -NoMax -Avg \-t Oracle_Maximum_PhysicalReads 500.000000 \-t Oracle_Maximum_PhysicalWrites 1500.000000 \-AddPar DatafileMetrics "PhysicalReads" \-AddPar DatafileMetrics "PhysicalWrites" \-e Oracle_High_PhysicalWrites \-o 1 -h 0 -severity CRITICAL -SendTBSM -SendTec \-e Oracle_High_PhysicalReads \-o 1 -h 0 -severity CRITICAL -SendTBSM -SendTec
Chapter 2. Resource models 119

Job Queue
DescriptionMonitors the number of broken, failed, and past due jobs in the job queue.
An Oracle job is an automated standard and repetitive task, such as executing anoperating system command, or backing up a database. The job queue is a databasetable that stores complete information about jobs such as when and where to run ajob.
A failed job is a job that generates an error when Oracle attempts execution. Oracletries to execute a failed job again after one minute. If the job continues to fail,Oracle makes continued attempts with the interval time doubling between eachattempt. When a job fails sixteen times, Oracle marks the job as broken and nolonger attempts execution. The alert log and trace files record the informationabout failed jobs, including message number ORA-12012 and the job number of thefailed job. Common causes of failed jobs include network or instance failure, or anexception when executing the job. Between job execution attempts, you can correctthe problem that is preventing the job from running. This does not interrupt thejob retry cycle, and Oracle eventually attempts to run the job again.
A broken job is a job that does not execute successfully. Oracle does not try to runbroken jobs. Jobs can break for two reasons: Oracle has failed to successfullyexecute the job after 16 attempts, or you have marked the job as broken. Oracledoes not try to execute a broken job until you either mark the job as not broken, orforce the job to be executed with the DBMS_JOB.RUN procedure. Check the alertlog and trace files for error information about a broken job.
A past due job is a job that did not execute at the scheduled execution time.
Resource model overview
Internal name OracleJobQueue
Category Oracle
Indications High Oracle Job Failures occurs when an Oracle job doesnot complete.
Oracle Job is broken occurs when an Oracle job is broken.
Oracle Job Past Due occurs when an Oracle job becomespast due.
Tasks and built-in actions None
Default cycle time 3600 seconds (1 hour)
Target managed resourceOracleDatabaseManager, OracleInstanceManager
Indications and eventsThe following table summarizes the indications for this resource model, the eventsassociated with the indications, the default severity of the events, and where tofind a detailed description of the indication. The resource model generates anevent when the threshold you specify for the indication is triggered.
120 IBM Tivoli Monitoring for Databases: Oracle: Reference Guide

Indication Generated event Defaultseverity
Clearingevents
Page
High OracleJob Failures
Oracle_High_JobFailures Critical Yes 121
Oracle Job isbroken
Oracle_JobBroken Critical Yes 122
Oracle JobPast Due
Oracle_JobPastDue Critical Yes 123
High Oracle Job Failures indicationOccurs when an Oracle job does not complete. When the indication occurs oftenenough to trigger an event, the event delivers a message to the Tivoli EnterpriseConsole in the following format:<application_label>: The failure rate for Oracle Job ID <JobID>on database <DatabaseName> has crossed above the predefined threshold of<Threshold> and is currently at <Failures> failures.
If you have Tivoli Business Systems Manager configured for your system, TivoliEnterprise Console forwards the message to Tivoli Business Systems Manager.
You can check the health of this resource model in the IBM Tivoli Monitoring WebHealth Console. For more information, see the IBM Tivoli Monitoring Web HealthConsole documentation.
The indication has the following attributes:
DatabaseNameThe name of an Oracle database. The database name contains up to 8characters and corresponds to the name specified in the CREATEDATABASE statement and identified in the DB_NAME parameter in thedatabase initialization parameter file.
FailuresThe number of times this job has started and failed since its last successfulexecution.
IntervalA date function that is evaluated at the start of execution that becomesnext NEXT_DATE.
JobID The identifier of a job. Import/export and repeated executions will notchange this value.
LastSuccessDateThe most recent date on which this job successfully executed.
LogUserThe login username for a submitted job.
NextDateThe date that this job will be executed next.
SchemaUserThe default schema that is used to parse a job.
This indication has the following thresholds:v Maximum Number of Job Failures
For more information about these thresholds, see “Thresholds” on page 124.
Chapter 2. Resource models 121

The following table describes the default settings for this indication.
Setting Default value
Send indications to Tivoli Enterprise Console Yes
Send indications to Tivoli Business SystemsManager
Yes
Occurrences 1
Holes 0
Associated tasks and built-in actions None
Note: If you have Tivoli Business Systems Manager configured for your systems,Tivoli Enterprise Console automatically forwards events to Tivoli BusinessSystems Manager. Do not change the configuration of the indication to sendevents to Tivoli Business Systems Manager.
Oracle Job is broken indicationOccurs when an Oracle job is broken. When the indication occurs often enough totrigger an event, the event delivers a message to the Tivoli Enterprise Console inthe following format:<application_label>: The Oracle Job <JobID> on database<DatabaseName> is broken.
If you have Tivoli Business Systems Manager configured for your system, TivoliEnterprise Console forwards the message to Tivoli Business Systems Manager.
You can check the health of this resource model in the IBM Tivoli Monitoring WebHealth Console. For more information, see the IBM Tivoli Monitoring Web HealthConsole documentation.
The indication has the following attributes:
DatabaseNameThe name of an Oracle database. The database name contains up to 8characters and corresponds to the name specified in the CREATEDATABASE statement and identified in the DB_NAME parameter in thedatabase initialization parameter file.
JobID The identifier of a job. Import/export and repeated executions will notchange this value.
LastSuccessDateThe most recent date on which this job successfully executed.
LogUserThe login username for a submitted job.
SchemaUserThe default schema that is used to parse a job.
This indication has no thresholds.
The following table describes the default settings for this indication.
Setting Default value
Send indications to Tivoli Enterprise Console Yes
122 IBM Tivoli Monitoring for Databases: Oracle: Reference Guide

Setting Default value
Send indications to Tivoli Business SystemsManager
Yes
Occurrences 1
Holes 0
Associated tasks and built-in actions None
Note: If you have Tivoli Business Systems Manager configured for your systems,Tivoli Enterprise Console automatically forwards events to Tivoli BusinessSystems Manager. Do not change the configuration of the indication to sendevents to Tivoli Business Systems Manager.
Oracle Job Past Due indicationOccurs when an Oracle job becomes past due. When the indication occurs oftenenough to trigger an event, the event delivers a message to the Tivoli EnterpriseConsole in the following format:<application_label>: The Oracle Job <JobID> on database<DatabaseName> has crossed above the predefined threshold of <Threshold>minutes and is currently <DelayMinutes> minutes past due.
If you have Tivoli Business Systems Manager configured for your system, TivoliEnterprise Console forwards the message to Tivoli Business Systems Manager.
You can check the health of this resource model in the IBM Tivoli Monitoring WebHealth Console. For more information, see the IBM Tivoli Monitoring Web HealthConsole documentation.
The indication has the following attributes:
DatabaseNameThe name of an Oracle database. The database name contains up to 8characters and corresponds to the name specified in the CREATEDATABASE statement and identified in the DB_NAME parameter in thedatabase initialization parameter file.
DelayMinutesNumber of minutes from the current date that this job is next scheduled tobe executed. This value is positive when the scheduled time is set in thepast, and negative when the scheduled time is set in the future.
IntervalA date function that is evaluated at the start of execution that becomesnext NEXT_DATE.
JobID The identifier of a job. Import/export and repeated executions will notchange this value.
LastSuccessDateThe most recent date on which this job successfully executed.
NextDateThe date that this job will be executed next.
This indication has the following thresholds:v Maximum Job Past Due Threshold
For more information about these thresholds, see “Thresholds” on page 124.
Chapter 2. Resource models 123

The following table describes the default settings for this indication.
Setting Default value
Send indications to Tivoli Enterprise Console Yes
Send indications to Tivoli Business SystemsManager
Yes
Occurrences 1
Holes 0
Associated tasks and built-in actions None
Note: If you have Tivoli Business Systems Manager configured for your systems,Tivoli Enterprise Console automatically forwards events to Tivoli BusinessSystems Manager. Do not change the configuration of the indication to sendevents to Tivoli Business Systems Manager.
ThresholdsThe following table lists the thresholds that can be set for the Job Queue resourcemodel. For each threshold it shows the name, a short description, and the defaultvalue:
Threshold Description Defaultvalue
Maximum Number ofJob Failures
An indication occurs if the number of job failuresexceeds this value.
0
Maximum Job Past DueThreshold
An indication occurs if the number of minutes ajob is past due exceeds this value.
0
Parameters
Note: A plus symbol (+) denotes parameters that feature selective logging.Selective logging enables you to choose metrics/properties that you want tolog. The selective logging metrics are listed in the value field of theParameters window.
The following table lists the parameters that can be set for the Job Queue resourcemodel. The table shows the name, a short description, and the default value foreach parameter:
Parameter Description Default value
Job Metrics + Select the metrics you want to log.See the following logging table for adescription of each metric.
Failures
Next Date
Tasks and built-in actionsNone
LoggingYou can log data for the properties of the managed resource listed in the followingtable. The table shows the context of the managed resource and the properties thatthe resource model logs for the IBM Tivoli Monitoring Web Health Console.
124 IBM Tivoli Monitoring for Databases: Oracle: Reference Guide

Managedresource
Context Properties
OracleJob Job QueueBroken Specifies if an attempt to execute a job is
successful. Y displays when no attempt is made torun this job. N displays if an attempt is made torun this job.
FailuresThe number of times this job has started and failedsince its last successful execution.
JobID* The identifier of a job. Import/export and repeatedexecutions will not change this value.
NextDateThe date that this job will be executed next.
NextSecThe time when this job will execute next.
OracleDatabase.DatabaseName*The name of an Oracle database.
PastDueMinutesThe number of minutes a job is past due.
PrivUserThe username for the user whose default privilegesapply to this job.
SchemaUserThe default schema that is used to parse a job.
Note: An asterisk (*) denotes a key property.
Return codesTable 2 on page 7 contains a listing of resource model return codes, theirdescription, and what action you can take to resolve each code. The return codenumber is displayed in the IBM Tivoli Monitoring Web Health Console status field,or by using the wdmlseng command.
CLI examplewdmeditprf -P OracleProfile#tme-region -add OracleJobQueue -c 3600 \-Log -LogDisable -p 12:00 -Agg no -ap 00:15 -NoMin -NoMax -Avg \-t Oracle_Maximum_JobPastDue 0.000000 \-t Oracle_Maximum_JobFailures 0.000000 \-AddPar JobMetrics "strNextDate" \-AddPar JobMetrics "numFailures" \-e Oracle_JobBroken \-o 1 -h 0 -severity CRITICAL -SendTBSM -SendTec \-e Oracle_JobPastDue \-o 1 -h 0 -severity CRITICAL -SendTBSM -SendTec \-e Oracle_High_JobFailures \-o 1 -h 0 -severity CRITICAL -SendTBSM -SendTec
Chapter 2. Resource models 125

Listener State
DescriptionMonitors the state of the Oracle listeners. Distribute this resource model to theinstance object only.
The listener is a server process that listens for incoming client connection requestsand manages the traffic to the server. If the client information matches the listenerinformation, then the listener grants a connection to the server.
This resource model determines whether the Oracle Net (tnslsnr) listener process isrunning. This process accepts Oracle Net connections from clients. The resourcemodel runs a ps command on UNIX or a net start command on Windows to checkif the listener is running. You can start the listener by logging in as the Oracleowner and typing the following:lsnrctl start <listener_name>
This resource model fires indications when a listener is in one of five listenerstates. The possible states and an explanation of each appears in the followingtable:
Table 4. Listener states and explanations
Listener state State explanation
Becomes AvailableListener State
Occurs when the listener was not available in the previousrequest, but is available in the current request.
Becomes UnavailableListener State
Occurs when the listener was not unavailable in the previousrequest, but is unavailable in the current request.
Becomes UnknownListener State
Occurs when the listener was available in a previous request,but is not responding to the current request.
Unavailable Listener State Occurs when the listener is not available for the currentrequest.
Unknown Listener State Occurs when the implementation cannot determine the state ofthe listener.
The resource model should only be distributed once on each machine, regardless ofthe number of the databases on the machine. If the listeners are not available, runthe Listener Task to turn on the listeners. See “Listener” on page 351 for moreinformation about the Listener Task. See the IBM Tivoli Monitoring for Databases:Oracle User’s Guide for instructions on how to run a task.
Because the Listener State resource model determines the current state of a listener,there are no real numeric thresholds to be measured or exceeded.
Resource model overview
Internal name OracleListenerState
Category Oracle
126 IBM Tivoli Monitoring for Databases: Oracle: Reference Guide

Resource model overview
Indications Becomes Available Listener State occurs when the Oracledatabase listener makes the transition from any other state toan available state.
Becomes Unavailable Listener State occurs when the Oracledatabase instance makes the transition from any other stateto an unavailable state.
Becomes Unknown Listener State occurs when the Oracledatabase listener makes the transition from any other state toan unknown state.
Unavailable Listener State occurs when the Oracle databaselistener is unavailable.
Unknown Listener State occurs when the state of the Oracledatabase listener cannot be determined by the monitor.
Tasks and built-in actions None
Default cycle time 300 seconds (5 min)
Target managed resourceOracleInstanceManager
Indications and eventsThe following table summarizes the indications for this resource model, the eventsassociated with the indications, the default severity of the events, and where tofind a detailed description of the indication. The resource model generates anevent when the threshold you specify for the indication is triggered.
Indication Generated event Defaultseverity
Clearingevents
Page
BecomesAvailableListener State
Oracle_Becomes_Available_ListenerState
Harmless Yes 127
BecomesUnavailableListener State
Oracle_Becomes_Unavailable_ListenerState
Critical Yes 128
BecomesUnknownListener State
Oracle_Becomes_Unknown_ListenerState
Critical Yes 129
UnavailableListener State
Oracle_Unavailable_ListenerState Critical Yes 130
UnknownListener State
Oracle_Unknown_ListenerState
Critical Yes 131
Becomes Available Listener State indicationOccurs when the Oracle database listener makes the transition from any other stateto an available state. When the indication occurs often enough to trigger an event,the event delivers a message to the Tivoli Enterprise Console in the followingformat:<application_label>: The Oracle database listener<ListenerName> has become available.
Chapter 2. Resource models 127

If you have Tivoli Business Systems Manager configured for your system, TivoliEnterprise Console forwards the message to Tivoli Business Systems Manager.
You can check the health of this resource model in the IBM Tivoli Monitoring WebHealth Console. For more information, see the IBM Tivoli Monitoring Web HealthConsole documentation.
The indication has the following attributes:
ListenerNameThe name of the server process that listens for and accepts incoming clientapplication connection requests. Listener processes start up databaseprocesses to handle subsequent communications with the client.
ListenerStateThe current state of the listener process: Available, Unavailable, orUnknown.
This indication has no thresholds.
The following table describes the default settings for this indication.
Setting Default value
Send indications to Tivoli Enterprise Console Yes
Send indications to Tivoli Business SystemsManager
Yes
Occurrences 1
Holes 0
Associated tasks and built-in actions None
Note: If you have Tivoli Business Systems Manager configured for your systems,Tivoli Enterprise Console automatically forwards events to Tivoli BusinessSystems Manager. Do not change the configuration of the indication to sendevents to Tivoli Business Systems Manager.
Becomes Unavailable Listener State indicationOccurs when the Oracle database instance makes the transition from any otherstate to an unavailable state. When the indication occurs often enough to trigger anevent, the event delivers a message to the Tivoli Enterprise Console in thefollowing format:<application_label>: The Oracle database listener<ListenerName> has become unavailable.
If you have Tivoli Business Systems Manager configured for your system, TivoliEnterprise Console forwards the message to Tivoli Business Systems Manager.
You can check the health of this resource model in the IBM Tivoli Monitoring WebHealth Console. For more information, see the IBM Tivoli Monitoring Web HealthConsole documentation.
The indication has the following attributes:
ListenerNameThe name of the server process that listens for and accepts incoming client
128 IBM Tivoli Monitoring for Databases: Oracle: Reference Guide

application connection requests. Listener processes start up databaseprocesses to handle subsequent communications with the client.
ListenerStateThe current state of the listener process: Available, Unavailable, orUnknown.
This indication has no thresholds.
The following table describes the default settings for this indication.
Setting Default value
Send indications to Tivoli Enterprise Console Yes
Send indications to Tivoli Business SystemsManager
Yes
Occurrences 1
Holes 0
Associated tasks and built-in actions None
Note: If you have Tivoli Business Systems Manager configured for your systems,Tivoli Enterprise Console automatically forwards events to Tivoli BusinessSystems Manager. Do not change the configuration of the indication to sendevents to Tivoli Business Systems Manager.
Becomes Unknown Listener State indicationOccurs when the Oracle database listener makes the transition from any other stateto an unknown state. When the indication occurs often enough to trigger an event,the event delivers a message to the Tivoli Enterprise Console in the followingformat:<application_label>: The state of the Oracle database listener<ListenerName> has become unknown.
If you have Tivoli Business Systems Manager configured for your system, TivoliEnterprise Console forwards the message to Tivoli Business Systems Manager.
You can check the health of this resource model in the IBM Tivoli Monitoring WebHealth Console. For more information, see the IBM Tivoli Monitoring Web HealthConsole documentation.
The indication has the following attributes:
ListenerNameThe name of the server process that listens for and accepts incoming clientapplication connection requests. Listener processes start up databaseprocesses to handle subsequent communications with the client.
ListenerStateThe current state of the listener process: Available, Unavailable, orUnknown.
This indication has no thresholds.
Chapter 2. Resource models 129

The following table describes the default settings for this indication.
Setting Default value
Send indications to Tivoli Enterprise Console Yes
Send indications to Tivoli Business SystemsManager
Yes
Occurrences 1
Holes 0
Associated tasks and built-in actions None
Note: If you have Tivoli Business Systems Manager configured for your systems,Tivoli Enterprise Console automatically forwards events to Tivoli BusinessSystems Manager. Do not change the configuration of the indication to sendevents to Tivoli Business Systems Manager.
Unavailable Listener State indicationOccurs when the Oracle database listener is unavailable. When the indicationoccurs often enough to trigger an event, the event delivers a message to the TivoliEnterprise Console in the following format:<application_label>: The Oracle database listener<ListenerName> is Unavailable.
If you have Tivoli Business Systems Manager configured for your system, TivoliEnterprise Console forwards the message to Tivoli Business Systems Manager.
You can check the health of this resource model in the IBM Tivoli Monitoring WebHealth Console. For more information, see the IBM Tivoli Monitoring Web HealthConsole documentation.
The indication has the following attributes:
ListenerNameThe name of the server process that listens for and accepts incoming clientapplication connection requests. Listener processes start up databaseprocesses to handle subsequent communications with the client.
ListenerStateThe current state of the listener process: Available, Unavailable, orUnknown.
This indication has no thresholds.
The following table describes the default settings for this indication.
Setting Default value
Send indications to Tivoli Enterprise Console Yes
Send indications to Tivoli Business SystemsManager
Yes
Occurrences 1
Holes 0
Associated tasks and built-in actions None
130 IBM Tivoli Monitoring for Databases: Oracle: Reference Guide

Note: If you have Tivoli Business Systems Manager configured for your systems,Tivoli Enterprise Console automatically forwards events to Tivoli BusinessSystems Manager. Do not change the configuration of the indication to sendevents to Tivoli Business Systems Manager.
Unknown Listener State indicationOccurs when the state of the Oracle database listener cannot be determined by themonitor. When the indication occurs often enough to trigger an event, the eventdelivers a message to the Tivoli Enterprise Console in the following format:<application_label>: The state of the Oracle databaselistener <ListenerName> cannot be determined.Exception: <ErrorMsg>.
If you have Tivoli Business Systems Manager configured for your system, TivoliEnterprise Console forwards the message to Tivoli Business Systems Manager.
You can check the health of this resource model in the IBM Tivoli Monitoring WebHealth Console. For more information, see the IBM Tivoli Monitoring Web HealthConsole documentation.
The indication has the following attributes:
ErrorMsgThe error message text for the most recent unsuccessful execution.
ListenerNameThe name of the server process that listens for and accepts incoming clientapplication connection requests. Listener processes start up databaseprocesses to handle subsequent communications with the client.
ListenerStateThe current state of the listener process: Available, Unavailable, orUnknown.
This indication has no thresholds.
The following table describes the default settings for this indication.
Setting Default value
Send indications to Tivoli Enterprise Console Yes
Send indications to Tivoli Business SystemsManager
Yes
Occurrences 1
Holes 0
Associated tasks and built-in actions None
Note: If you have Tivoli Business Systems Manager configured for your systems,Tivoli Enterprise Console automatically forwards events to Tivoli BusinessSystems Manager. Do not change the configuration of the indication to sendevents to Tivoli Business Systems Manager.
ThresholdsNone
Chapter 2. Resource models 131
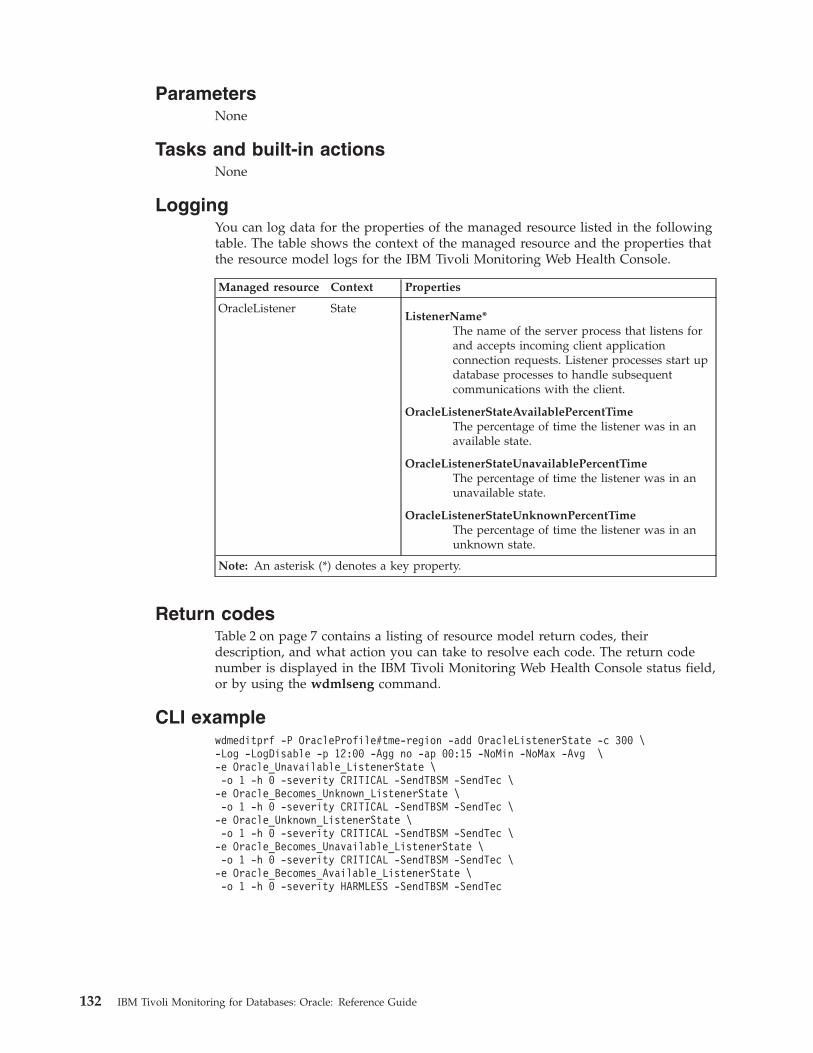
ParametersNone
Tasks and built-in actionsNone
LoggingYou can log data for the properties of the managed resource listed in the followingtable. The table shows the context of the managed resource and the properties thatthe resource model logs for the IBM Tivoli Monitoring Web Health Console.
Managed resource Context Properties
OracleListener StateListenerName*
The name of the server process that listens forand accepts incoming client applicationconnection requests. Listener processes start updatabase processes to handle subsequentcommunications with the client.
OracleListenerStateAvailablePercentTimeThe percentage of time the listener was in anavailable state.
OracleListenerStateUnavailablePercentTimeThe percentage of time the listener was in anunavailable state.
OracleListenerStateUnknownPercentTimeThe percentage of time the listener was in anunknown state.
Note: An asterisk (*) denotes a key property.
Return codesTable 2 on page 7 contains a listing of resource model return codes, theirdescription, and what action you can take to resolve each code. The return codenumber is displayed in the IBM Tivoli Monitoring Web Health Console status field,or by using the wdmlseng command.
CLI examplewdmeditprf -P OracleProfile#tme-region -add OracleListenerState -c 300 \-Log -LogDisable -p 12:00 -Agg no -ap 00:15 -NoMin -NoMax -Avg \-e Oracle_Unavailable_ListenerState \-o 1 -h 0 -severity CRITICAL -SendTBSM -SendTec \-e Oracle_Becomes_Unknown_ListenerState \-o 1 -h 0 -severity CRITICAL -SendTBSM -SendTec \-e Oracle_Unknown_ListenerState \-o 1 -h 0 -severity CRITICAL -SendTBSM -SendTec \-e Oracle_Becomes_Unavailable_ListenerState \-o 1 -h 0 -severity CRITICAL -SendTBSM -SendTec \-e Oracle_Becomes_Available_ListenerState \-o 1 -h 0 -severity HARMLESS -SendTBSM -SendTec
132 IBM Tivoli Monitoring for Databases: Oracle: Reference Guide
Lock
DescriptionMonitors the following information:v The total number of deadlocks detected since the instance was startedv The current number of Data Manipulation Language locks as a percentage of the
maximum number of locks defined for the instancev The number of active locks of a user-specified typev The number of times an enqueue lock was requested and was not granted
immediately
A lock is the means by which integrity of data is protected by preventing morethan one user from accessing or changing the same data or object at the same time.An active lock is a lock that is currently operating.
Oracle automatically assigns appropriate locks when executing SQL statements.Oracle chooses the lowest level of restrictiveness to protect data integrity, but alsokeep a high degree of data concurrency. Users may also choose to lock datamanually.
Oracle uses various locks to control concurrent access to data and to preventdestructive interaction between users. Oracle locks a resource when a transactionrequires exclusive access to that resource. This prevents other transactions frommanipulating that same resource while the active transaction is working. Oraclereleases the lock when the transaction no longer needs the resource.
Depending on the resource and the operation being performed, Oracle picks a lockwith an appropriate level of restrictiveness. Types of Oracle locks include thefollowing:
DML locks (data locks)Data Manipulation Language locks protect data — for example, table lockslock entire tables, row locks lock selected rows.
DDL locks (dictionary locks)Data Definition Language locks protect the structure of schema objects —for example, the definitions of tables and views.
Internal locks and latchesInternal locks and latches protect internal database structures such asdatafiles. Internal locks and latches are entirely automatic.
Distributed locksDistributed locks ensure that the data and other resources distributedamong the various instances of an Oracle Parallel Server remain consistent.Distributed locks are held by instances rather than transactions. Theycommunicate the current status of a resource among the instances of anOracle Parallel Server.
Parallel cache management (PCM) locksParallel cache management locks are distributed locks that cover one ormore data blocks (table or index blocks) in the buffer cache. Parallel cachemanagement locks do not lock any rows on behalf of transactions.
Resource model overview
Internal name OracleLock
Chapter 2. Resource models 133

Resource model overview
Category Oracle
Indications High DML Locks Percentage occurs when the percentage ofDML Locks exceeds the specified threshold.
High Lock Count occurs when the number of locks exceedsthe specified threshold.
High Number of Deadlocks occurs when the number ofdeadlocks exceeds the specified threshold.
High Number of Enqueue Timeouts occurs when thenumber of enqueue timeouts exceeds the specified threshold.
Tasks and built-in actions None
Default cycle time 600 seconds
Target managed resourceOracleDatabaseManager, OracleInstanceManager
Indications and eventsThe following table summarizes the indications for this resource model, the eventsassociated with the indications, the default severity of the events, and where tofind a detailed description of the indication. The resource model generates anevent when the threshold you specify for the indication is triggered.
Indication Generated event Defaultseverity
Clearingevents
Page
High DMLLocks Percentage
Oracle_High_DMLLocksPercentage
Critical Yes 134
High LockCount
Oracle_High_LockCount Critical Yes 135
High Number ofDeadlocks
Oracle_High_Deadlocks Critical Yes 136
High Number ofEnqueueTimeouts
Oracle_High_EnqueueTimeouts
Critical Yes 137
High DML Locks Percentage indicationOccurs when the percentage of DML Locks exceeds the specified threshold. Whenthe indication occurs often enough to trigger an event, the event delivers amessage to the Tivoli Enterprise Console in the following format:<application_label>: The DML Locks Percentage for Oracle instance<InstanceName> has crossed above the predefined threshold of<Threshold> percent and is currentlyat <DMLLocksPercentage> percent.
If you have Tivoli Business Systems Manager configured for your system, TivoliEnterprise Console forwards the message to Tivoli Business Systems Manager.
You can check the health of this resource model in the IBM Tivoli Monitoring WebHealth Console. For more information, see the IBM Tivoli Monitoring Web HealthConsole documentation.
134 IBM Tivoli Monitoring for Databases: Oracle: Reference Guide

This indication checks for Data Manipulation Language locks. The instance limit isset through the DML_LOCKS initialization parameter and represents the maximumnumber of locks that can be placed on all tables by all users at any one time. Thedefault is four times the maximum number of transactions. When the limit isreached, processing stops and an Oracle error is produced. Within the bounds ofthe maximum limit, the setting of the DML_LOCKS parameter has little or noeffect on the performance of the server. Therefore, it should be set artificially highto prevent hitting the maximum limit, which is operating-system specific.
The indication has the following attribute:
InstanceNameThe name of an Oracle database instance. The instance name is identifiedby the INSTANCE_NAME parameter in the database initializationparameter file and corresponds to the Oracle System Identifier (SID) of theinstance.
DMLLocksPercentageThe current number of Data Manipulation Language (DML) locks as apercentage of the maximum number of locks defined for the instance. Theinstance limit is set through the DML_LOCKS initialization parameter andrepresents the maximum number of locks that can be placed on all tablesby all users at any one time. When the limit is reached, processing stopsand an Oracle error occurs.
This indication has the following thresholds:v Maximum DML Locks Percentage
For more information about these thresholds, see “Thresholds” on page 138.
The following table describes the default settings for this indication.
Setting Default value
Send indications to Tivoli Enterprise Console Yes
Send indications to Tivoli Business SystemsManager
Yes
Occurrences 1
Holes 0
Associated tasks and built-in actions None
Note: If you have Tivoli Business Systems Manager configured for your systems,Tivoli Enterprise Console automatically forwards events to Tivoli BusinessSystems Manager. Do not change the configuration of the indication to sendevents to Tivoli Business Systems Manager.
High Lock Count indicationOccurs when the number of locks exceeds the specified threshold. When theindication occurs often enough to trigger an event, the event delivers a message tothe Tivoli Enterprise Console in the following format:<application_label>: The <Type> Lock Count for Oracle instance<InstanceName> has crossed above the predefined threshold of <Threshold> locksand is currently at <LockCount> locks.
If you have Tivoli Business Systems Manager configured for your system, TivoliEnterprise Console forwards the message to Tivoli Business Systems Manager.
Chapter 2. Resource models 135

You can check the health of this resource model in the IBM Tivoli Monitoring WebHealth Console. For more information, see the IBM Tivoli Monitoring Web HealthConsole documentation.
This indication monitors the number of active locks of a user-specified type. Theactive lock output is useful to detect potential problems in your databaseperformance. A lock is the means by which integrity of data is protected bypreventing more than one user from accessing or changing the same data or objectat the same time. An active lock is a lock that is currently operating. Lock types andthresholds are specified in the Lock Types parameter in the formLOCK_TYPE:THRESHOLD.
The indication has the following attributes:
InstanceNameThe name of an Oracle database instance. The instance name is identifiedby the INSTANCE_NAME parameter in the database initializationparameter file and corresponds to the Oracle System Identifier (SID) of theinstance.
LockCountThe number of LockType locks currently held.
Type The type of user or system lock. Locks control concurrent access to data.Any process that is blocking other processes is likely holding one of theselocks. User locks are obtained by user applications. User type locksinclude: TM (DML lock), TX (Row Transaction lock), ST (Space Transactionlock), UL (User defined lock). System type locks can be found in the Oracledocumentation.
This indication has no thresholds.
The following table describes the default settings for this indication.
Setting Default value
Send indications to Tivoli Enterprise Console Yes
Send indications to Tivoli Business SystemsManager
Yes
Occurrences 1
Holes 0
Associated tasks and built-in actions None
Note: If you have Tivoli Business Systems Manager configured for your systems,Tivoli Enterprise Console automatically forwards events to Tivoli BusinessSystems Manager. Do not change the configuration of the indication to sendevents to Tivoli Business Systems Manager.
High Number of Deadlocks indicationOccurs when the number of deadlocks exceeds the specified threshold. When theindication occurs often enough to trigger an event, the event delivers a message tothe Tivoli Enterprise Console in the following format:<application_label>: The Number of Deadlocks for Oracle instance <InstanceName> hascrossed above the predefined threshold of <Threshold> deadlocks and iscurrently at <Deadlocks> deadlocks.
136 IBM Tivoli Monitoring for Databases: Oracle: Reference Guide

If you have Tivoli Business Systems Manager configured for your system, TivoliEnterprise Console forwards the message to Tivoli Business Systems Manager.
You can check the health of this resource model in the IBM Tivoli Monitoring WebHealth Console. For more information, see the IBM Tivoli Monitoring Web HealthConsole documentation.
This indication monitors for large occurrences of deadlocks. A deadlock occurs whentwo or more users are waiting for data locked by each other. Deadlocks can causetransactions to hang. Oracle automatically resolves deadlocks by rolling back oneof the processes. When a deadlock is detected, a trace file is produced in thedirectory that is specified in the USER_DUMP_DEST initialization parameter thatshows which processes were involved in the deadlock and which processes wereblocking and waiting. If deadlocks are occurring, there could be an applicationdesign problem. The maximum number of deadlocks is specified in theV$SYSSTAT table.
The indication has the following attribute:
DeadlocksThe number of deadlocks detected since the instance was started.
InstanceNameThe name of an Oracle database instance. The instance name is identifiedby the INSTANCE_NAME parameter in the database initializationparameter file and corresponds to the Oracle System Identifier (SID) of theinstance.
This indication has the following thresholds:v Maximum Number of Deadlocks
For more information about these thresholds, see “Thresholds” on page 138.
The following table describes the default settings for this indication.
Setting Default value
Send indications to Tivoli Enterprise Console Yes
Send indications to Tivoli Business SystemsManager
Yes
Occurrences 1
Holes 0
Associated tasks and built-in actions None
Note: If you have Tivoli Business Systems Manager configured for your systems,Tivoli Enterprise Console automatically forwards events to Tivoli BusinessSystems Manager. Do not change the configuration of the indication to sendevents to Tivoli Business Systems Manager.
High Number of Enqueue Timeouts indicationOccurs when the number of enqueue timeouts exceeds the specified threshold.When the indication occurs often enough to trigger an event, the event delivers amessage to the Tivoli Enterprise Console in the following format:<application_label>: The Number of Enqueue Timeouts for Oracle instance<InstanceName> has crossed above the predefined thresholdof <Threshold> enqueue timeouts and is currentlyat <EnqueueTimeouts> enqueue timeouts.
Chapter 2. Resource models 137

If you have Tivoli Business Systems Manager configured for your system, TivoliEnterprise Console forwards the message to Tivoli Business Systems Manager.
You can check the health of this resource model in the IBM Tivoli Monitoring WebHealth Console. For more information, see the IBM Tivoli Monitoring Web HealthConsole documentation.
This indication monitors for large occurrences of enqueue timeouts. An enqueue isanother name for a lock. Enqueue timeouts occur when table and row locks time-outbefore they can complete. The default value of the ENQUEUE_RESOURCESinitialization parameter defines the number of resources that can be concurrentlylocked. This value is derived from the PROCESSES initialization parameter. Forthree or fewer processes, the default value is 20. For four to 10 processes, thedefault value is ((PROCESSES - 3) * 5) + 20, and for more than 10 processes, thedefault value is ((PROCESSES - 10) * 2) + 55. If applications are using a largenumber of tables, increase this value.
The indication has the following attribute:
EnqueueTimeoutsThe total number of enqueue (table and row) locks that timed out beforethey could complete.
InstanceNameThe name of an Oracle database instance. The instance name is identifiedby the INSTANCE_NAME parameter in the database initializationparameter file and corresponds to the Oracle System Identifier (SID) of theinstance.
This indication has the following thresholds:v Maximum Enqueue Timeouts
For more information about these thresholds, see “Thresholds” on page 138.
The following table describes the default settings for this indication.
Setting Default value
Send indications to Tivoli Enterprise Console Yes
Send indications to Tivoli Business SystemsManager
Yes
Occurrences 1
Holes 0
Associated tasks and built-in actions None
Note: If you have Tivoli Business Systems Manager configured for your systems,Tivoli Enterprise Console automatically forwards events to Tivoli BusinessSystems Manager. Do not change the configuration of the indication to sendevents to Tivoli Business Systems Manager.
ThresholdsThe following table lists the thresholds that can be set for the Lock resource model.For each threshold it shows the name, a short description, and the default value:
138 IBM Tivoli Monitoring for Databases: Oracle: Reference Guide

Threshold Description Defaultvalue
Maximum Number ofDeadlocks
An indication occurs if the number of deadlocksexceeds this value.
100
Maximum DML LocksPercentage
An indication occurs if the percentage of DMLlocks exceeds this value. The maximumpercentage of DML Locks is compared with themaximum number of DML locks as defined inthe initSID.ora parameter ’dml_locks.’
95
Maximum EnqueueTimeouts
An indication occurs if the number of enqueuetimeouts exceeds this value.
100
Parameters
Note: A plus symbol (+) denotes parameters that feature selective logging.Selective logging enables you to choose metrics/properties that you want tolog. The selective logging metrics are listed in the value field of theParameters window.
The following table lists the parameters that can be set for the Lock resourcemodel. The table shows the name, a short description, and the default value foreach parameter:
Parameter Description Default value
Lock Types The selected types of locks tomonitor and the thresholdsrepresenting the maximum numberallowed before an indication is set.The format for each entry isLOCK_TYPE:THRESHOLD.
TM:40
TX:40
UL:40
Instance LockMetrics +
Select the metrics you want to log.See the following logging table fora description of each metric.
Current DML Locks
DML Locks Maximum
DML Locks Percentage
Enqueue Timeouts
Lock count for lock type Q*: Rowcache
Lock count for lock type N*: Librarycache pin
Lock count for lock type L*: Librarycache
Number of Deadlocks
TM Lock Count
TX Lock Count
UL Lock Count
The following table lists the lock command line and GUI type name anddescription:
Chapter 2. Resource models 139

Locks Description
BL Buffer hash table instance lock
CF Cross-instance function invocation instance lock
CI Control file schema global enqueue lock
CU Cursor bind lock
DF Data file instance lock
DL Direct loader parallel index create lock
DM Mount/ startup db primary/ secondary instance lock
DR Distributed recovery process lock
DX Distributed transaction entry lock
FS File set lock
HW Space management operations on a specific segment lock
IN Instance number lock
IR Instance recovery serialization global enqueue lock
IS Instance state lock
IV Library cache invalidation instance lock
JQ Job queue lock
KK Thread kick lock
L* Library cache lock instance lock
MM Mount definition global enqueue lock
MR Media recovery lock
N* Library cache pin instance lock
PF Password File lock
PI Parallel operation lock
PR Process startup lock
PS Parallel operation lock
Q* Row cache instance lock
RT Redo thread global enqueue lock
SC System commit number instance lock
SM SMON lock
SN Sequence number instance lock
SQ Sequence number enqueue lock
SS Sort segment lock
ST Space transaction enqueue lock
SV Sequence number value lock
TA Generic enqueue lock
TM DML enqueue lock
TS Temporary segment enqueue lock
TT Temporary table enqueue lock
TX Transaction enqueue lock
UL User supplied lock
UN User name lock
140 IBM Tivoli Monitoring for Databases: Oracle: Reference Guide

Locks Description
US Undo segment DDL lock
WL Being-written redo log instance lock
Tasks and built-in actionsNone
LoggingYou can log data for the properties of the managed resource listed in the followingtable. The table shows the context of the managed resource and the properties thatthe resource model logs for the IBM Tivoli Monitoring Web Health Console.
Chapter 2. Resource models 141

Managed resource Context Properties
OracleInstance LockCurrentDMLLocks
The total number of locks on tables that areundergoing a Data Manipulation Languageoperation (insert, update, delete) currentlyreferenced by all users.
DeadlocksThe number of deadlocks detected since theinstance was started.
DMLLocksPercentageThe current number of Data ManipulationLanguage (DML) locks as a percentage of themaximum number of locks defined for theinstance.
DMLLocksMaximumThe maximum allowable total of all locks ontables currently referenced by all users.
EnqueueTimeoutsThe total number of enqueue (table and row)locks that timed out before they couldcomplete.
InstanceName*The name of an Oracle database instance.
OracleDatabase.DatabaseName*The name of an Oracle database.
BLCountThe number of buffer hash table instance locksdetected since the instance was started.
CFCountThe number of cross-instance functioninvocation instance lock detected since theinstance was started.
CICountThe number of control file schema globalenqueue locks.
CUCountThe number of cursor bind locks detectedsince the instance was started.
DFCountThe number of data file instance locksdetected since the instance was started.
Note: An asterisk (*) denotes a key property.
142 IBM Tivoli Monitoring for Databases: Oracle: Reference Guide

Managed resource Context Properties
OracleInstance LockDMCount
The number of Mount/ startup db primary/secondary instance locks detected since theinstance was started.
DRCountThe number of distributed recovery processlocks detected since the instance was started.
DXCountThe number of distributed transaction entrylocks detected since the instance was started.
FSCountThe number of file set locks detected since theinstance was started.
HWCountThe number of space management operationson a specific segment locks detected since theinstance was started.
INCountThe number of instance number locks detectedsince the instance was started.
IRCountThe number of instance recovery serializationglobal enqueue locks detected since theinstance was started.
ISCountThe number of instance state locks detectedsince the instance was started.
IVCountThe number of library cache invalidationinstance locks detected since the instance wasstarted.
JQCountThe number of job queue locks detected sincethe instance was started.
KKCountThe number of thread kick locks detectedsince the instance was started.
LibraryCacheLockCountThe number of library cache lock instancelocks detected since the instance was started.
MMCountThe number of mount definition globalenqueue locks detected since the instance wasstarted.
MRCountThe number of media recovery locks detectedsince the instance was started.
Note: An asterisk (*) denotes a key property.
Chapter 2. Resource models 143
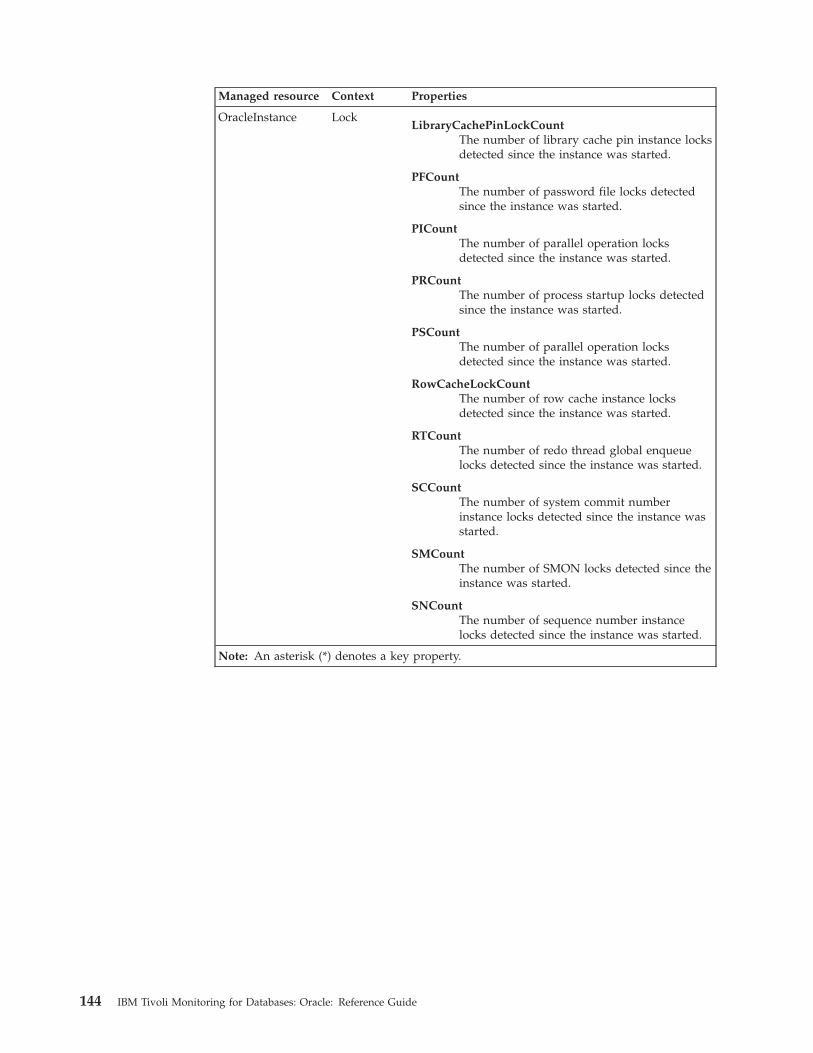
Managed resource Context Properties
OracleInstance LockLibraryCachePinLockCount
The number of library cache pin instance locksdetected since the instance was started.
PFCountThe number of password file locks detectedsince the instance was started.
PICountThe number of parallel operation locksdetected since the instance was started.
PRCountThe number of process startup locks detectedsince the instance was started.
PSCountThe number of parallel operation locksdetected since the instance was started.
RowCacheLockCountThe number of row cache instance locksdetected since the instance was started.
RTCountThe number of redo thread global enqueuelocks detected since the instance was started.
SCCountThe number of system commit numberinstance locks detected since the instance wasstarted.
SMCountThe number of SMON locks detected since theinstance was started.
SNCountThe number of sequence number instancelocks detected since the instance was started.
Note: An asterisk (*) denotes a key property.
144 IBM Tivoli Monitoring for Databases: Oracle: Reference Guide

Managed resource Context Properties
OracleInstance LockSQCount
The number of sequence number enqueuelocks detected since the instance was started.
SSCountThe number of sort segment locks detectedsince the instance was started.
STCountThe number of space transaction enqueuelocks detected since the instance was started.
SVCountThe number of sequence number value locksdetected since the instance was started.
TACountThe number of generic enqueue locks detectedsince the instance was started.
TMCountThe number of DML enqueue locks detectedsince the instance was started.
TSCountThe number of temporary segment enqueuelocks detected since the instance was started.
TTCountThe number of temporary table enqueue locksdetected since the instance was started.
TXCountThe number of transaction enqueue locksdetected since the instance was started.
ULCountThe number of user supplied locks detectedsince the instance was started.
UNCountThe number of user name locks detected sincethe instance was started.
USCountThe number of undo segment DDL locksdetected since the instance was started.
WLCountThe number of being-written redo log instancelocks detected since the instance was started.
Note: An asterisk (*) denotes a key property.
Return codesTable 2 on page 7 contains a listing of resource model return codes, theirdescription, and what action you can take to resolve each code. The return codenumber is displayed in the IBM Tivoli Monitoring Web Health Console status field,or by using the wdmlseng command.
Chapter 2. Resource models 145
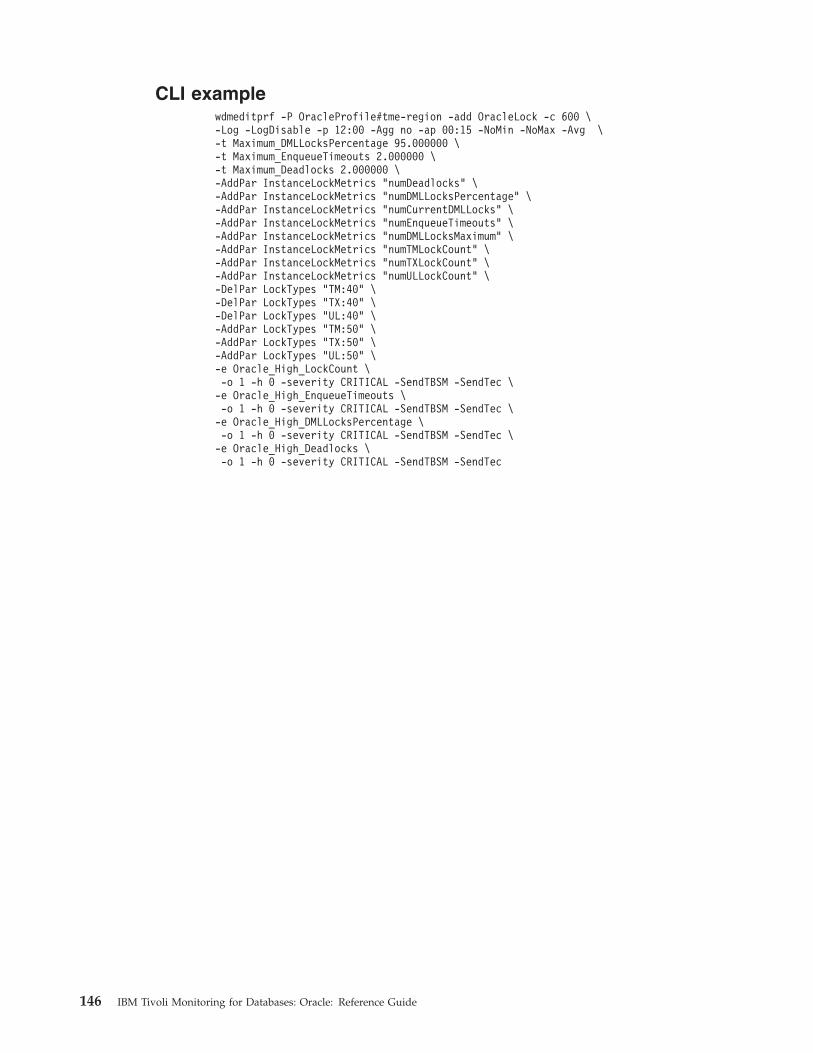
CLI examplewdmeditprf -P OracleProfile#tme-region -add OracleLock -c 600 \-Log -LogDisable -p 12:00 -Agg no -ap 00:15 -NoMin -NoMax -Avg \-t Maximum_DMLLocksPercentage 95.000000 \-t Maximum_EnqueueTimeouts 2.000000 \-t Maximum_Deadlocks 2.000000 \-AddPar InstanceLockMetrics "numDeadlocks" \-AddPar InstanceLockMetrics "numDMLLocksPercentage" \-AddPar InstanceLockMetrics "numCurrentDMLLocks" \-AddPar InstanceLockMetrics "numEnqueueTimeouts" \-AddPar InstanceLockMetrics "numDMLLocksMaximum" \-AddPar InstanceLockMetrics "numTMLockCount" \-AddPar InstanceLockMetrics "numTXLockCount" \-AddPar InstanceLockMetrics "numULLockCount" \-DelPar LockTypes "TM:40" \-DelPar LockTypes "TX:40" \-DelPar LockTypes "UL:40" \-AddPar LockTypes "TM:50" \-AddPar LockTypes "TX:50" \-AddPar LockTypes "UL:50" \-e Oracle_High_LockCount \-o 1 -h 0 -severity CRITICAL -SendTBSM -SendTec \-e Oracle_High_EnqueueTimeouts \-o 1 -h 0 -severity CRITICAL -SendTBSM -SendTec \-e Oracle_High_DMLLocksPercentage \-o 1 -h 0 -severity CRITICAL -SendTBSM -SendTec \-e Oracle_High_Deadlocks \-o 1 -h 0 -severity CRITICAL -SendTBSM -SendTec
146 IBM Tivoli Monitoring for Databases: Oracle: Reference Guide

Log Event
DescriptionMonitors events in the Oracle background log for Oracle errors.
The resource model only reports an error once and only checks for new entries inthe ALERT log each time the resource model is run. An indication is sent for eachmatched entry in the Alerts file that was added during the last cycle.
If the resource model reports any errors, check the ALERT log and any associatedtrace files for the instance. The ALERT log file is a special trace file that contains achronological log of messages and errors. The Oracle ALERT log is namedalert_sid.log on UNIX, and sidALRT.LOG or alert_sid.log on Windows. It is locatedin the BACKGROUND_DUMP_DEST initialization parameter, which defaults to$ORACLE_HOME/rdbms/log on UNIX, and %ORACLE_HOME%\rdbms onWindows. In order to determine the location of this file, the resource model firstchecks the database, and if that is unsuccessful (for example, the database isdown), the resource model checks the Oracle initialization file for the location.
The handling of messages in the alert file is based on Regular Expressionsspecified by default:v If there are category/level conflicts in format, the worst-case event is sent. For
example, if a log entry matches a Regular Expression with an assignment ofCategory 1 and a Regular Expression with an assignment of Category 0, theindication will be Category 0.
v The resource model behavior can be changed based on entries in the RegularExpressions file. The Regular Expressions file is a Java properties file. Each linecontains a key=value pair. In this case, the keys are the regular expressions thatwill be matched in the Alerts file and the values are the assigned categories forthese patterns. You can add, delete, or modify any of these regular expressionsto alter the patterns and assigned categories.You can change the categories and values that the resource model queries byaltering the Regular Expressions file. The Regular Expressions file is located in$LCF_DATDIR/LCFNEW/ITM/PACS/Oracle. The format file is a per-instancefile and has the implication that each monitored instance on the endpoint has itsown file.
v The alert file checks are based strictly on the resource model cycle time, notwhen Oracle makes entries. During each cycle, it searches all the log entries thathave been added since the last cycle.
v When the IBM Tivoli Monitoring engine is stopped and then (later) restarted, theresource model does not send indications for old entries in the log file.Therefore, if the resource model is stopped and then restarted, it will not look atlog entries that were added while it was stopped.
The errors that the resource model monitors in the alert log include the following:v Category 0 (Fatal)
– ORA-0204 error in reading control file– ORA-0206 error in writing control file– ORA-0210 cannot open control file– ORA-0257 archiver is stuck– ORA-0333 redo log read error– ORA-0345 redo log write error
Chapter 2. Resource models 147

– ORA-0440 – ORA-0485 background process failure– ORA-0600 – ORA-0639 internal errors– ORA-1114 datafile I/O write error– ORA-1115 datafile I/O read error– ORA-1116 cannot open datafile– ORA-1118 cannot add a data file– ORA-1578 data block corruption
v Category 1 (Critical)
– ORA-1135 file accessed for query is offline– ORA-1547 tablespace is full– ORA-1555 snapshot too old– ORA-1562 failed to extend rollback segment– ORA-1628 – ORA-1632 maximum extents exceeded– ORA-1650 – ORA-1656 tablespace is full– ORA-4031 out of shared memory
v Category 2 (Minor)
– ORA-3113 end of file on communication channel– ORA-6501 PL/SQL internal error– ‘cannot allocate new log’ - this error indicates that Oracle is unable to
perform a log switch. Increase the number of redo logs to resolve thisproblem.
v Category 3 (Warning)
v Category 4 (Harmless)
Resource model overview
Internal name OracleLogEvent
Category Oracle
Indications Category 0 Oracle Log Event occurs when a new CategoryZero event registers in the Oracle log.
Category 1 Oracle Log Event occurs when a new CategoryOne event registers in the Oracle log.
Category 2 Oracle Log Event occurs when a new CategoryTwo event registers in the Oracle log.
Category 3 Oracle Log Event occurs when a new CategoryThree event registers in the Oracle log.
Category 4 Oracle Log Event occurs when a new CategoryFour event registers in the Oracle log.
Tasks and built-in actions None
Default cycle time 300 seconds (5 minutes)
Target managed resourceOracleDatabaseManager, OracleInstanceManager
Indications and eventsThe following table summarizes the indications for this resource model, the eventsassociated with the indications, the default severity of the events, and where tofind a detailed description of the indication. The resource model generates an
148 IBM Tivoli Monitoring for Databases: Oracle: Reference Guide

event when the threshold you specify for the indication is triggered.
Indication Generated event Defaultseverity
Clearingevents
Page
Category 0Oracle LogEvent
Oracle_Log_Event_Category_Zero
Fatal No 149
Category 1Oracle LogEvent
Oracle_Log_Event_Category_One
Critical No 150
Category 2Oracle LogEvents
Oracle_Log_Event_Category_Two
Minor No 151
Category 3Oracle LogEvent
Oracle_Log_Event_Category_Three
Warning No 152
Category 4Oracle LogEvent
Oracle_Log_Event_Category_Four
Harmless No 153
Category 0 Oracle Log Event indicationOccurs when a new Category Zero event registers in the Oracle log. When theindication occurs often enough to trigger an event, the event delivers a message tothe Tivoli Enterprise Console in the following format:<application_label>: <Text> : Category 0
If you have Tivoli Business Systems Manager configured for your system, TivoliEnterprise Console forwards the message to Tivoli Business Systems Manager.
You can check the health of this resource model in the IBM Tivoli Monitoring WebHealth Console. For more information, see the IBM Tivoli Monitoring Web HealthConsole documentation.
The indication has the following attributes:
FileNameThe name of the file to which the Oracle instance is logging.
InstanceNameThe name of an Oracle database instance. The instance name is identifiedby the INSTANCE_NAME parameter in the database initializationparameter file and corresponds to the Oracle System Identifier (SID) of theinstance.
Offset The offset (in bytes) from the beginning of the log file where the log eventstarts.
LogEventSeverityThe severity (as an integer) of the log event. The severity number isdetermined by the number assigned to the pattern it matches in the regularexpression file.
Text The text of the log event.
This indication has no thresholds.
Chapter 2. Resource models 149

The following table describes the default settings for this indication.
Setting Default value
Send indications to Tivoli Enterprise Console Yes
Send indications to Tivoli Business SystemsManager
Yes
Occurrences 1
Holes 0
Associated tasks and built-in actions None
Note: If you have Tivoli Business Systems Manager configured for your systems,Tivoli Enterprise Console automatically forwards events to Tivoli BusinessSystems Manager. Do not change the configuration of the indication to sendevents to Tivoli Business Systems Manager.
Category 1 Oracle Log Event indicationGenerates an event a new Category One event registers in the Oracle log. Whenthe indication occurs often enough to trigger an event, the event delivers amessage to the Tivoli Enterprise Console in the following format:<application_label>: <Text> : Category 1
If you have Tivoli Business Systems Manager configured for your system, TivoliEnterprise Console forwards the message to Tivoli Business Systems Manager.
You can check the health of this resource model in the IBM Tivoli Monitoring WebHealth Console. For more information, see the IBM Tivoli Monitoring Web HealthConsole documentation.
The indication has the following attributes:
FileNameThe name of the file to which the Oracle instance is logging.
InstanceNameThe name of an Oracle database instance. The instance name is identifiedby the INSTANCE_NAME parameter in the database initializationparameter file and corresponds to the Oracle System Identifier (SID) of theinstance.
Offset The offset (in bytes) from the beginning of the log file where the log eventstarts.
LogEventSeverityThe severity (as an integer) of the log event. The severity number isdetermined by the number assigned to the pattern it matches in the regularexpression file.
Text The text of the log event.
This indication has no thresholds.
The following table describes the default settings for this indication.
Setting Default value
Send indications to Tivoli Enterprise Console Yes
150 IBM Tivoli Monitoring for Databases: Oracle: Reference Guide
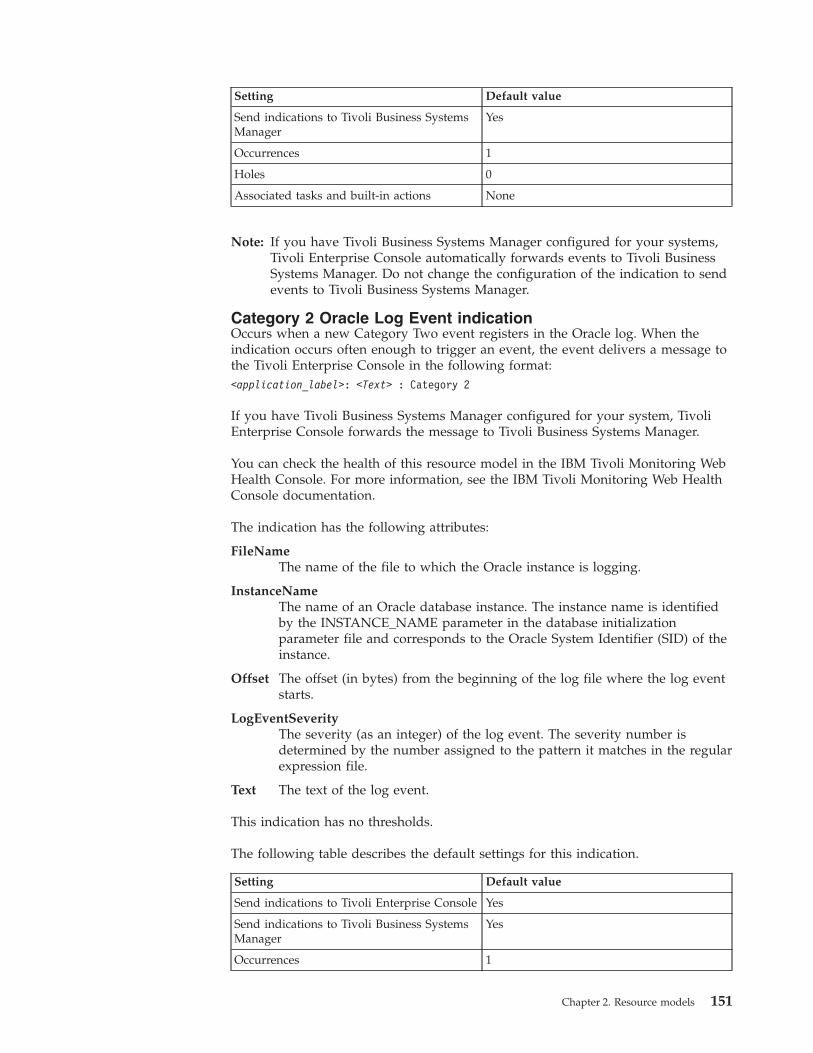
Setting Default value
Send indications to Tivoli Business SystemsManager
Yes
Occurrences 1
Holes 0
Associated tasks and built-in actions None
Note: If you have Tivoli Business Systems Manager configured for your systems,Tivoli Enterprise Console automatically forwards events to Tivoli BusinessSystems Manager. Do not change the configuration of the indication to sendevents to Tivoli Business Systems Manager.
Category 2 Oracle Log Event indicationOccurs when a new Category Two event registers in the Oracle log. When theindication occurs often enough to trigger an event, the event delivers a message tothe Tivoli Enterprise Console in the following format:<application_label>: <Text> : Category 2
If you have Tivoli Business Systems Manager configured for your system, TivoliEnterprise Console forwards the message to Tivoli Business Systems Manager.
You can check the health of this resource model in the IBM Tivoli Monitoring WebHealth Console. For more information, see the IBM Tivoli Monitoring Web HealthConsole documentation.
The indication has the following attributes:
FileNameThe name of the file to which the Oracle instance is logging.
InstanceNameThe name of an Oracle database instance. The instance name is identifiedby the INSTANCE_NAME parameter in the database initializationparameter file and corresponds to the Oracle System Identifier (SID) of theinstance.
Offset The offset (in bytes) from the beginning of the log file where the log eventstarts.
LogEventSeverityThe severity (as an integer) of the log event. The severity number isdetermined by the number assigned to the pattern it matches in the regularexpression file.
Text The text of the log event.
This indication has no thresholds.
The following table describes the default settings for this indication.
Setting Default value
Send indications to Tivoli Enterprise Console Yes
Send indications to Tivoli Business SystemsManager
Yes
Occurrences 1
Chapter 2. Resource models 151
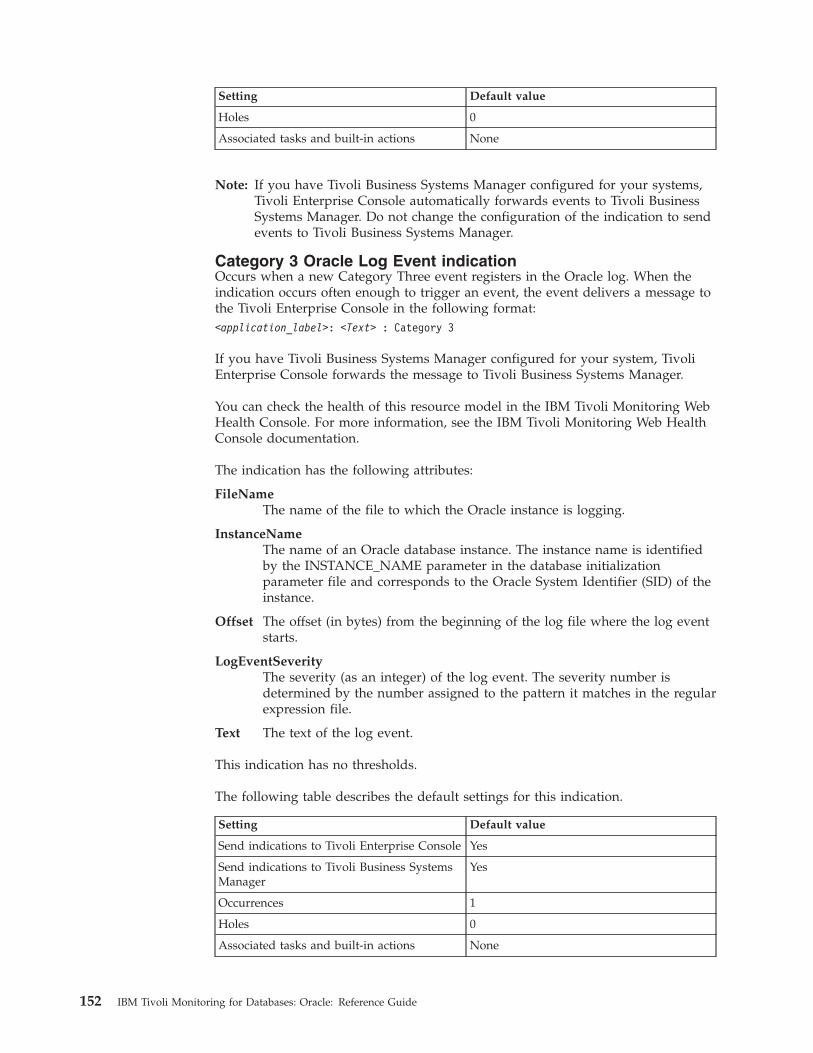
Setting Default value
Holes 0
Associated tasks and built-in actions None
Note: If you have Tivoli Business Systems Manager configured for your systems,Tivoli Enterprise Console automatically forwards events to Tivoli BusinessSystems Manager. Do not change the configuration of the indication to sendevents to Tivoli Business Systems Manager.
Category 3 Oracle Log Event indicationOccurs when a new Category Three event registers in the Oracle log. When theindication occurs often enough to trigger an event, the event delivers a message tothe Tivoli Enterprise Console in the following format:<application_label>: <Text> : Category 3
If you have Tivoli Business Systems Manager configured for your system, TivoliEnterprise Console forwards the message to Tivoli Business Systems Manager.
You can check the health of this resource model in the IBM Tivoli Monitoring WebHealth Console. For more information, see the IBM Tivoli Monitoring Web HealthConsole documentation.
The indication has the following attributes:
FileNameThe name of the file to which the Oracle instance is logging.
InstanceNameThe name of an Oracle database instance. The instance name is identifiedby the INSTANCE_NAME parameter in the database initializationparameter file and corresponds to the Oracle System Identifier (SID) of theinstance.
Offset The offset (in bytes) from the beginning of the log file where the log eventstarts.
LogEventSeverityThe severity (as an integer) of the log event. The severity number isdetermined by the number assigned to the pattern it matches in the regularexpression file.
Text The text of the log event.
This indication has no thresholds.
The following table describes the default settings for this indication.
Setting Default value
Send indications to Tivoli Enterprise Console Yes
Send indications to Tivoli Business SystemsManager
Yes
Occurrences 1
Holes 0
Associated tasks and built-in actions None
152 IBM Tivoli Monitoring for Databases: Oracle: Reference Guide

Note: If you have Tivoli Business Systems Manager configured for your systems,Tivoli Enterprise Console automatically forwards events to Tivoli BusinessSystems Manager. Do not change the configuration of the indication to sendevents to Tivoli Business Systems Manager.
Category 4 Oracle Log Event indicationGenerates an event a new Category Four event registers in the Oracle log. Whenthe indication occurs often enough to trigger an event, the event delivers amessage to the Tivoli Enterprise Console in the following format:<application_label>: <Text> : Category 4
If you have Tivoli Business Systems Manager configured for your system, TivoliEnterprise Console forwards the message to Tivoli Business Systems Manager.
You can check the health of this resource model in the IBM Tivoli Monitoring WebHealth Console. For more information, see the IBM Tivoli Monitoring Web HealthConsole documentation.
The indication has the following attributes:
FileNameThe name of the file to which the Oracle instance is logging.
InstanceNameThe name of an Oracle database instance. The instance name is identifiedby the INSTANCE_NAME parameter in the database initializationparameter file and corresponds to the Oracle System Identifier (SID) of theinstance.
Offset The offset (in bytes) from the beginning of the log file where the log eventstarts.
LogEventSeverityThe severity (as an integer) of the log event. The severity number isdetermined by the number assigned to the pattern it matches in the regularexpression file.
Text The text of the log event.
This indication has no thresholds.
The following table describes the default settings for this indication.
Setting Default value
Send indications to Tivoli Enterprise Console Yes
Send indications to Tivoli Business SystemsManager
Yes
Occurrences 1
Holes 0
Associated tasks and built-in actions None
Note: If you have Tivoli Business Systems Manager configured for your systems,Tivoli Enterprise Console automatically forwards events to Tivoli BusinessSystems Manager. Do not change the configuration of the indication to sendevents to Tivoli Business Systems Manager.
Chapter 2. Resource models 153
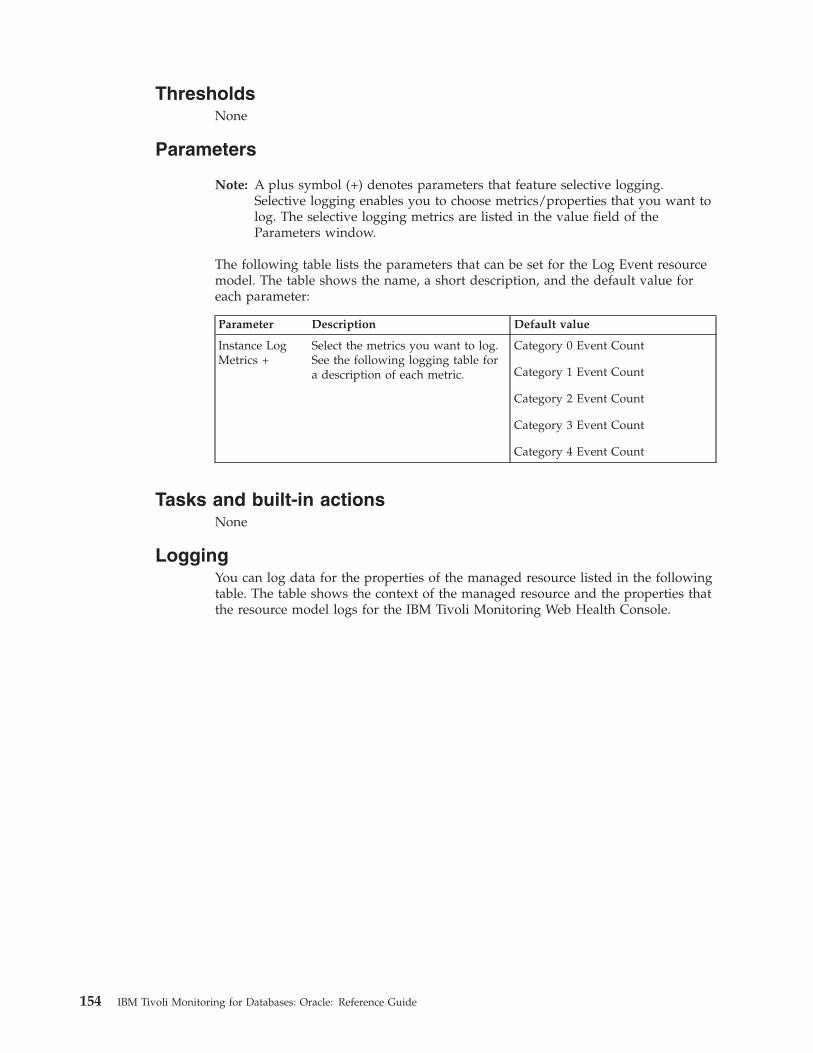
ThresholdsNone
Parameters
Note: A plus symbol (+) denotes parameters that feature selective logging.Selective logging enables you to choose metrics/properties that you want tolog. The selective logging metrics are listed in the value field of theParameters window.
The following table lists the parameters that can be set for the Log Event resourcemodel. The table shows the name, a short description, and the default value foreach parameter:
Parameter Description Default value
Instance LogMetrics +
Select the metrics you want to log.See the following logging table fora description of each metric.
Category 0 Event Count
Category 1 Event Count
Category 2 Event Count
Category 3 Event Count
Category 4 Event Count
Tasks and built-in actionsNone
LoggingYou can log data for the properties of the managed resource listed in the followingtable. The table shows the context of the managed resource and the properties thatthe resource model logs for the IBM Tivoli Monitoring Web Health Console.
154 IBM Tivoli Monitoring for Databases: Oracle: Reference Guide

Managed resource Context Properties
OracleInstance LogCategory0EventCount
The number of Category 0 Log Events in thelog event file.
Category1EventCountThe number of Category 1 Log Events in thelog event file.
Category2EventCountThe number of Category 2 Log Events in thelog event file.
Category3EventCountThe number of Category 3 Log Events in thelog event file.
Category4EventCountThe number of Category 4 Log Events in thelog event file.
OracleDatabase.DatabaseName*The name of an Oracle database.
InstanceName*The name of an Oracle database instance.
Note: An asterisk (*) denotes a key property.
Return codesTable 2 on page 7 contains a listing of resource model return codes, theirdescription, and what action you can take to resolve each code. The return codenumber is displayed in the IBM Tivoli Monitoring Web Health Console status field,or by using the wdmlseng command.
CLI examplewdmeditprf -P OracleProfile#tme-region -add OracleLogEvent -c 300 \-Log -LogDisable -p 12:00 -Agg no -ap 00:15 -NoMin -NoMax -Avg \-AddPar InstanceLogMetrics "numCategory0EventCount" \-AddPar InstanceLogMetrics "numCategory1EventCount" \-AddPar InstanceLogMetrics "numCategory2EventCount" \-AddPar InstanceLogMetrics "numCategory3EventCount" \-AddPar InstanceLogMetrics "numCategory4EventCount" \-e Oracle_Log_Event_Category_Two \-o 1 -h 0 -severity MINOR -SendTBSM -SendTec \-e Oracle_Log_Event_Category_Four \-o 1 -h 0 -severity HARMLESS -SendTBSM -SendTec \-e Oracle_Log_Event_Category_Three \-o 1 -h 0 -severity WARNING -SendTBSM -SendTec \-e Oracle_Log_Event_Category_Zero \-o 1 -h 0 -severity FATAL -SendTBSM -SendTec \-e Oracle_Log_Event_Category_One \-o 1 -h 0 -severity CRITICAL -SendTBSM -SendTec
Chapter 2. Resource models 155

Maximum Extents
DescriptionAlerts on those segments whose free extents (maximum allowed extents minus thesegment’s currently allocated extents) are less than the specified threshold. Thisinformation can help determine which segments are approaching the maximumallowable number of extents. Objects of segment_type, CACHE, are not included.
An extent is a contiguous set of data blocks allocated for storing data. Extents aregrouped into data structures called segments. Maximum extents are the total numberof extents that can be allocated for a segment.
Objects can reject additional extents for the following reasons:v The tablespace in which the object has been stored does not have enough
contiguous space to allocate additional extentsv The segment has already allocated the maximum number of extents as set by the
DBA or by the data block size and operating system
When the number of extents for an object reaches the value of the MAXEXTENTSstorage parameter, the operation fails to allocate a new extent. If the block sizevalue of MAXEXTENTS is less than the maximum allowable, increase the value ofMAXEXTENTS parameter for that object. Otherwise, export the object, drop andrecreate the object with larger extent sizes, and import the data.
Set the parameter, Exclude Rollback Segments, to Yes, to exclude the number ofextents in rollback segments.
Resource model overview
Internal name OracleMaximumExtents
Category Oracle
Indications Low Free Extents occurs when the number of freeMaxExtents is lower than the specified threshold.
Tasks and built-in actions None
Default cycle time 3600 seconds (1 hour)
Target managed resourceOracleDatabaseManager, OracleInstanceManager
Indications and eventsThe following table summarizes the indications for this resource model, the eventsassociated with the indications, the default severity of the events, and where tofind a detailed description of the indication. The resource model generates anevent when the threshold you specify for the indication is triggered.
Indication Generated event Defaultseverity
Clearingevents
Page
Low FreeExtents
Oracle_Low_FreeExtents Critical Yes 157
156 IBM Tivoli Monitoring for Databases: Oracle: Reference Guide

Low Free Extents indicationOccurs when the number of free MaxExtents is lower than the specified threshold.When the indication occurs often enough to trigger an event, the event delivers amessage to the Tivoli Enterprise Console in the following format:<application_label>: The number of free extents for the Oracle segment<SegmentOwner>.<SegmentName> in tablespace <TablespaceName>on database <DatabaseName> has crossed below the predefined threshold <Threshold>and is currently at <FreeExtents>.
If you have Tivoli Business Systems Manager configured for your system, TivoliEnterprise Console forwards the message to Tivoli Business Systems Manager.
You can check the health of this resource model in the IBM Tivoli Monitoring WebHealth Console. For more information, see the IBM Tivoli Monitoring Web HealthConsole documentation.
The indication has the following attributes:
CurrentExtentsThe number of extents currently allocated to the specified segment.
DatabaseNameThe name of an Oracle database. The database name contains up to 8characters and corresponds to the name specified in the CREATEDATABASE statement and identified in the DB_NAME parameter in thedatabase initialization parameter file.
FreeExtentsMaximum number of extents allowed for the specified segment less thenumber of extents currently allocated to the specified segment.
MaxExtentsThe maximum number of extents allowed for the specified segment.
SegmentNameThe name of the segment.
SegmentOwnerThe username of the segment owner.
SegmentTypeThe type of the segment. Segment types include: index partition, tablepartition, table, cluster, index, rollback, deferred rollback, temporary, cache,lobsegment, and lobindex.
TablespaceNameThe name of the tablespace that contains this segment.
This indication has the following threshold:v Minimum Free Extents
For more information about this threshold, see “Thresholds” on page 158.
The following table describes the default settings for this indication.
Setting Default value
Send indications to Tivoli Enterprise Console Yes
Send indications to Tivoli Business SystemsManager
Yes
Chapter 2. Resource models 157

Setting Default value
Occurrences 1
Holes 0
Associated tasks and built-in actions None
Note: If you have Tivoli Business Systems Manager configured for your systems,Tivoli Enterprise Console automatically forwards events to Tivoli BusinessSystems Manager. Do not change the configuration of the indication to sendevents to Tivoli Business Systems Manager.
ThresholdsThe following table lists the thresholds that can be set for the Maximum Extentsresource model. For each threshold it shows the name, a short description, and thedefault value:
Threshold Description Defaultvalue
Minimum Free Extents An indication occurs when the number of freeextents is lower than this value.
5
Parameters
Note: A plus symbol (+) denotes parameters that feature selective logging.Selective logging enables you to choose metrics/properties that you want tolog. The selective logging metrics are listed in the value field of theParameters window.
The following table lists the parameters that can be set for the Maximum Extentsresource model. The table shows the name, a short description, and the defaultvalue for each parameter:
Parameter Description Default value
ExcludeRollbackSegments
YES ignores rollback segments. NO doesnot ignore rollback segments.
Yes
Number ofRows
Specifies the number of objects with theworst-case extents to return.
50
Segment Metrics+
Select the metrics you want to log. See thefollowing logging table for a description ofeach metric.
Current Extents
Free Extents
Percent Extents Allocated
Tasks and built-in actionsNone
LoggingYou can log data for the properties of the managed resource listed in the followingtable. The table shows the context of the managed resource and the properties thatthe resource model logs for the IBM Tivoli Monitoring Web Health Console.
158 IBM Tivoli Monitoring for Databases: Oracle: Reference Guide

Managedresource
Context Properties
OracleSegment StorageFreeExtents
Maximum number of extents allowed for thespecified segment less the number of extentscurrently allocated to the specified segment.
CurrentExtentsThe number of extents currently allocated to thespecified segment.
OracleDatabase.DatabaseName*The name of an Oracle database.
OracleTablespace.TablespaceName*The name of the tablespace that contains thissegment.
PctExtentsAllocatedPercentage of current extents to the maximumnumber allowed for the segment.
SegmentName*The name of the segment.
SegmentOwner*The username of the segment owner.
SegmentType*The type of the segment. Segment types include:index partition, table partition, table, cluster,index, rollback, deferred rollback, temporary,cache, lobsegment, and lobindex.
Note: An asterisk (*) denotes a key property.
Return codesTable 2 on page 7 contains a listing of resource model return codes, theirdescription, and what action you can take to resolve each code. The return codenumber is displayed in the IBM Tivoli Monitoring Web Health Console status field,or by using the wdmlseng command.
CLI examplewdmeditprf -P OracleProfile#tme-region -add OracleMaximumExtents -c 3600 \-Log -LogDisable -p 12:00 -Agg no -ap 00:15 -NoMin -NoMax -Avg \-t Oracle_Minimum_FreeExtents 5.000000 \-AddPar SegmentMetrics "numPctExtentsAllocated" \-AddPar SegmentMetrics "numFreeExtents" \-AddPar SegmentMetrics "numCurrentExtents" \-DelPar NumberOfRows "50" \-AddPar NumberOfRows "25" \-AddPar ExcludeRollbackSegments "Yes" \-e Oracle_Low_FreeExtents \-o 1 -h 0 -severity CRITICAL -SendTBSM -SendTec
Chapter 2. Resource models 159

Maximum Extents by Tablespace
DescriptionAlerts on segments, in specified tablespaces, whose free extents (maximum allowedextents minus the segment’s currently allocated extents) are less than the specifiedthreshold.
An extent is a contiguous set of data blocks allocated for storing data. Extents aregrouped into data structures called segments. Maximum extents are the total numberof extents that can be allocated for a segment.
Objects can reject additional extents for the following reasons:v The tablespace in which the object has been stored does not have enough
contiguous space to allocate additional extentsv The segment has already allocated the maximum number of extents as set by the
dba or by the data block size and operating system
When the number of extents for an object reaches the value of the MAXEXTENTSstorage parameter, the operation fails to allocate a new extent. If the block sizevalue of MAXEXTENTS is less than the maximum allowable, increase the value ofMAXEXTENTS parameter for that object. Otherwise, export the object, drop andrecreate the object with larger extent sizes, and import the data.
Set the parameter, Exclude Rollback Segments, to Yes, to exclude the number ofextents in rollback segments.
This resource model can use tokens to monitor a set of tables specified by thetoken. See Appendix E, “Using tokens to customize resource model parameters” onpage 519 for more information.
Resource model overview
Internal name OracleMaximumExtentsByTablespace
Category Oracle
Indications Low Free Extents occurs when the number of free maximumextents is lower than the specified threshold.
Tasks and built-in actions None
Default cycle time 3600 seconds (1 hour)
Target managed resourceOracleDatabaseManager, OracleInstanceManager
Indications and eventsThe following table summarizes the indications for this resource model, the eventsassociated with the indications, the default severity of the events, and where tofind a detailed description of the indication. The resource model generates anevent when the threshold you specify for the indication is triggered.
Indication Generated event Defaultseverity
Clearingevents
Page
Low FreeExtents
Oracle_Low_FreeExtentsByTablespace Critical Yes 161
160 IBM Tivoli Monitoring for Databases: Oracle: Reference Guide

Low Free Extents indicationOccurs when the number of free maximum extents is lower than the specifiedthreshold. When the indication occurs often enough to trigger an event, the eventdelivers a message to the Tivoli Enterprise Console in the following format:<application_label>: The number of free extents for the Oracle segment<SegmentOwner>.<SegmentName> in tablespace <TablespaceName>on database <DatabaseName> has crossed below the predefined threshold<Threshold> and is currently at <FreeExtents>.
If you have Tivoli Business Systems Manager configured for your system, TivoliEnterprise Console forwards the message to Tivoli Business Systems Manager.
You can check the health of this resource model in the IBM Tivoli Monitoring WebHealth Console. For more information, see the IBM Tivoli Monitoring Web HealthConsole documentation.
The indication has the following attributes:
CurrentExtentsThe number of extents currently allocated to the specified segment.
DatabaseNameThe name of an Oracle database. The database name contains up to 8characters and corresponds to the name specified in the CREATEDATABASE statement and identified in the DB_NAME parameter in thedatabase initialization parameter file.
FreeExtentsMaximum number of extents allowed for the specified segment less thenumber of extents currently allocated to the specified segment.
MaxExtentsThe maximum number of extents allowed for the specified segment.
PctExtentsAllocatedPercentage of current extents to the maximum number allowed for thesegment.
SegmentNameThe name of the segment.
SegmentOwnerThe username of the segment owner.
SegmentTypeThe type of the segment. Segment types include: index partition, tablepartition, table, cluster, index, rollback, deferred rollback, temporary, cache,lobsegment, and lobindex.
TablespaceNameThe name of the tablespace that contains this segment.
This indication has the following threshold:v Minimum Free Extents
For more information about this threshold, see “Thresholds” on page 162.
Chapter 2. Resource models 161

The following table describes the default settings for this indication.
Setting Default value
Send indications to Tivoli Enterprise Console Yes
Send indications to Tivoli Business SystemsManager
Yes
Occurrences 1
Holes 0
Associated tasks and built-in actions None
Note: If you have Tivoli Business Systems Manager configured for your systems,Tivoli Enterprise Console automatically forwards events to Tivoli BusinessSystems Manager. Do not change the configuration of the indication to sendevents to Tivoli Business Systems Manager.
ThresholdsThe following table lists the thresholds that can be set for the Maximum Extents byTablespace resource model. For each threshold it shows the name, a shortdescription, and the default value:
Threshold Description Defaultvalue
Minimum Free Extents An indication occurs when the number of freeextents is lower than this value.
5
Parameters
Note: A plus symbol (+) denotes parameters that feature selective logging.Selective logging enables you to choose metrics/properties that you want tolog. The selective logging metrics are listed in the value field of theParameters window.
The following table lists the parameters that can be set for the Maximum Extentsby Tablespace resource model. The table shows the name, a short description, andthe default value for each parameter:
Parameter Description Default value
Include/Exclude Includes or excludes the contents of thetablespaces names field.
Include
Number ofRows
Specifies the number of objects with theworst-case extents to return.
50
Segment Metrics+
Select the metrics you want to log. See thefollowing logging table for a description ofeach metric.
Current Extents
Free Extents
Percent Extents Allocated
TablespaceNames
Designates the tablespaces names you wantto include or exclude. Use spaces to separatenames.
None
162 IBM Tivoli Monitoring for Databases: Oracle: Reference Guide

Tasks and built-in actionsNone
LoggingYou can log data for the properties of the managed resource listed in the followingtable. The table shows the context of the managed resource and the properties thatthe resource model logs for the IBM Tivoli Monitoring Web Health Console.
Managed resource Context Properties
Oracle Segment StorageCurrentExtents
The number of extents currently allocated tothe specified segment.
FreeExtentsMaximum number of extents allowed for thespecified segment less the number of extentscurrently allocated to the specified segment.
OracleDatabase.DatabaseName*The name of an Oracle database.
OracleTablespace.TablespaceName*The name of the tablespace that contains thissegment.
PctExtentsAllocatedPercentage of current extents to the maximumnumber allowed for the segment.
SegmentName*The name of the segment.
SegmentOwner*The username of the segment owner.
SegmentType*The type of the segment. Segment typesinclude: index partition, table partition, table,cluster, index, rollback, deferred rollback,temporary, cache, lobsegment, and lobindex.
Note: An asterisk (*) denotes a key property.
Return codesTable 2 on page 7 contains a listing of resource model return codes, theirdescription, and what action you can take to resolve each code. The return codenumber is displayed in the IBM Tivoli Monitoring Web Health Console status field,or by using the wdmlseng command.
CLI examplewdmeditprf -P OracleProfile#tme-region \-add OracleMaximumExtentsByTablespace -c 3600 \-Log -LogDisable -p 12:00 -Agg no -ap 00:15 -NoMin -NoMax -Avg \-t Oracle_Minimum_FreeExtentsByTablespace 5.000000 \-AddPar SegmentMetrics "numPctExtentsAllocated" \-AddPar SegmentMetrics "numFreeExtents" \-AddPar SegmentMetrics "numCurrentExtents" \-AddPar IncludeExcludeTablespaces "Include" \-DelPar NumberOfRows "50" \-AddPar NumberOfRows "25" \
Chapter 2. Resource models 163

-AddPar List "SYSTEM" \-e Oracle_Low_FreeExtentsByTablespace \-o 1 -h 0 -severity CRITICAL -SendTBSM -SendTec
164 IBM Tivoli Monitoring for Databases: Oracle: Reference Guide

Maximum Extents by User
DescriptionAlerts on segments, for a specified user, whose free extents (maximum allowedextents minus the segment’s currently allocated extents) are less than the specifiedthreshold. Checks the value of MAXEXTENTS for a segment of a specified userand reports the number of extents that can still be allocated to objects for segmentsof a specified user. This information can help determine which segments areapproaching the Maximum allowable number of extents. Objects of segment_type,CACHE, are not included.
This resource model checks the value of MAXEXTENTS in each object and reportsthe number of extents that can still be allocated to each object. This informationcan help determine which segments do not have room for additional extents.Objects of segment_type, CACHE, are not included.
An extent is a contiguous set of data blocks allocated for storing data. Extents aregrouped into data structures called segments. Maximum extents are the total numberof extents that can be allocated for a segment.
Objects can reject additional extents for the following reasons:v The tablespace in which the object has been stored does not have enough
contiguous space to allocate additional extentsv The segment has already allocated the maximum number of extents as set by the
DBA or by the data block size and operating system
When the number of extents for an object reaches the value of the MAXEXTENTSstorage parameter, the operation fails to allocate a new extent. If the block sizevalue of MAXEXTENTS is less than the maximum allowable, increase the value ofMAXEXTENTS parameter for that object. Otherwise, export the object, drop andrecreate the object with larger extent sizes, and import the data.
Set the parameter, Exclude Rollback Segments, to Yes, to exclude the number ofextents in rollback segments.
This resource model can use tokens to monitor a set of users specified by thetoken. See Appendix E, “Using tokens to customize resource model parameters” onpage 519 for more information.
Resource model overview
Internal name OracleMaximumExtentsbyUser
Category Oracle
Indications Low Free Extents occurs when the number of FreeMaximum Extents is lower than the specified threshold.
Tasks and built-in actions None
Default cycle time 3600 seconds (1 hour)
Target managed resourceOracleDatabaseManager, OracleInstanceManager
Chapter 2. Resource models 165

Indications and eventsThe following table summarizes the indications for this resource model, the eventsassociated with the indications, the default severity of the events, and where tofind a detailed description of the indication. The resource model generates anevent when the threshold you specify for the indication is triggered.
Indication Generated event Defaultseverity
Clearingevents
Page
Low FreeExtents
Oracle_Low_FreeExtentsByUser Critical Yes 166
Low Free Extents indicationOccurs when the number of Free Maximum Extents is lower than the specifiedthreshold. When the indication occurs often enough to trigger an event, the eventdelivers a message to the Tivoli Enterprise Console in the following format:<application_label>: The number of free extents for the Oracle segment<SegmentOwner>.<SegmentName> in tablespace <TablespaceName>on database <DatabaseName> has crossed below the predefined threshold<Threshold> and is currently at <FreeExtents>.
If you have Tivoli Business Systems Manager configured for your system, TivoliEnterprise Console forwards the message to Tivoli Business Systems Manager.
You can check the health of this resource model in the IBM Tivoli Monitoring WebHealth Console. For more information, see the IBM Tivoli Monitoring Web HealthConsole documentation.
The indication has the following attributes:
CurrentExtentsThe number of extents currently allocated to the specified segment.
DatabaseNameThe name of an Oracle database. The database name contains up to 8characters and corresponds to the name specified in the CREATEDATABASE statement and identified in the DB_NAME parameter in thedatabase initialization parameter file.
FreeExtentsMaximum number of extents allowed for the specified segment less thenumber of extents currently allocated to the specified segment.
MaxExtentsThe maximum number of extents allowed for the specified segment.
PctExtentsAllocatedPercentage of current extents to the maximum number allowed for thesegment.
SegmentNameThe name of the segment.
SegmentOwnerThe username of the segment owner.
SegmentTypeThe type of the segment. Segment types include: index partition, tablepartition, table, cluster, index, rollback, deferred rollback, temporary, cache,lobsegment, and lobindex.
166 IBM Tivoli Monitoring for Databases: Oracle: Reference Guide
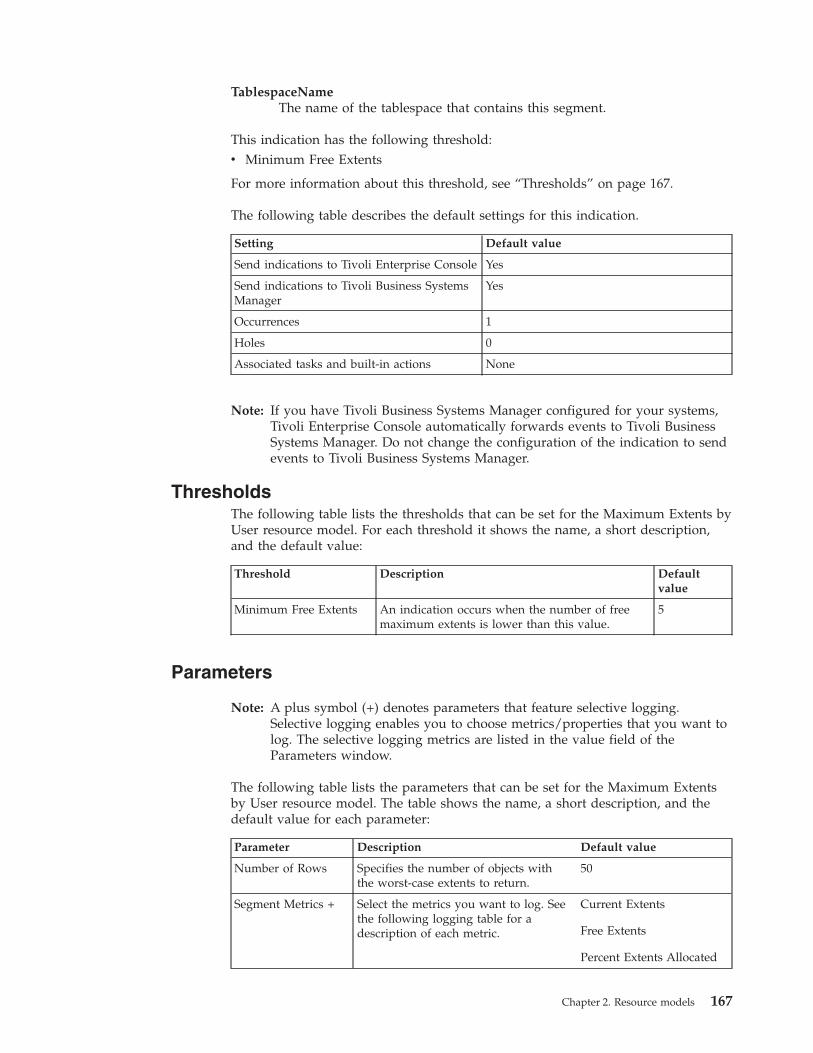
TablespaceNameThe name of the tablespace that contains this segment.
This indication has the following threshold:v Minimum Free Extents
For more information about this threshold, see “Thresholds” on page 167.
The following table describes the default settings for this indication.
Setting Default value
Send indications to Tivoli Enterprise Console Yes
Send indications to Tivoli Business SystemsManager
Yes
Occurrences 1
Holes 0
Associated tasks and built-in actions None
Note: If you have Tivoli Business Systems Manager configured for your systems,Tivoli Enterprise Console automatically forwards events to Tivoli BusinessSystems Manager. Do not change the configuration of the indication to sendevents to Tivoli Business Systems Manager.
ThresholdsThe following table lists the thresholds that can be set for the Maximum Extents byUser resource model. For each threshold it shows the name, a short description,and the default value:
Threshold Description Defaultvalue
Minimum Free Extents An indication occurs when the number of freemaximum extents is lower than this value.
5
Parameters
Note: A plus symbol (+) denotes parameters that feature selective logging.Selective logging enables you to choose metrics/properties that you want tolog. The selective logging metrics are listed in the value field of theParameters window.
The following table lists the parameters that can be set for the Maximum Extentsby User resource model. The table shows the name, a short description, and thedefault value for each parameter:
Parameter Description Default value
Number of Rows Specifies the number of objects withthe worst-case extents to return.
50
Segment Metrics + Select the metrics you want to log. Seethe following logging table for adescription of each metric.
Current Extents
Free Extents
Percent Extents Allocated
Chapter 2. Resource models 167
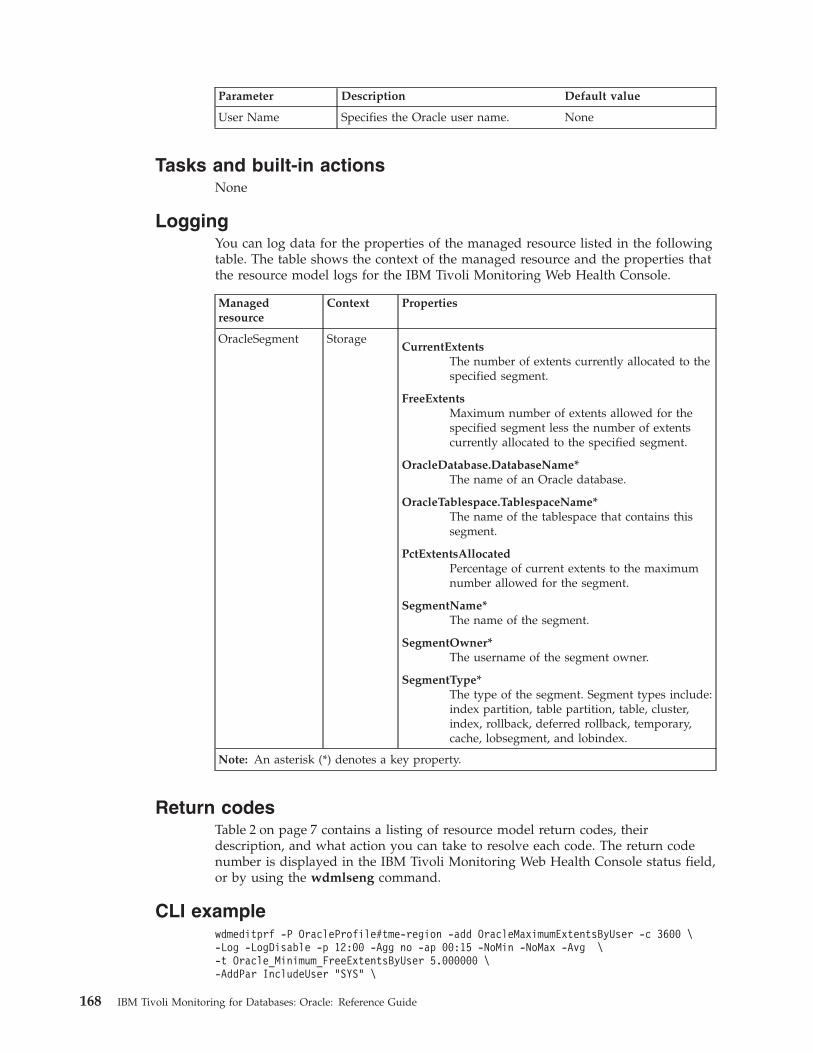
Parameter Description Default value
User Name Specifies the Oracle user name. None
Tasks and built-in actionsNone
LoggingYou can log data for the properties of the managed resource listed in the followingtable. The table shows the context of the managed resource and the properties thatthe resource model logs for the IBM Tivoli Monitoring Web Health Console.
Managedresource
Context Properties
OracleSegment StorageCurrentExtents
The number of extents currently allocated to thespecified segment.
FreeExtentsMaximum number of extents allowed for thespecified segment less the number of extentscurrently allocated to the specified segment.
OracleDatabase.DatabaseName*The name of an Oracle database.
OracleTablespace.TablespaceName*The name of the tablespace that contains thissegment.
PctExtentsAllocatedPercentage of current extents to the maximumnumber allowed for the segment.
SegmentName*The name of the segment.
SegmentOwner*The username of the segment owner.
SegmentType*The type of the segment. Segment types include:index partition, table partition, table, cluster,index, rollback, deferred rollback, temporary,cache, lobsegment, and lobindex.
Note: An asterisk (*) denotes a key property.
Return codesTable 2 on page 7 contains a listing of resource model return codes, theirdescription, and what action you can take to resolve each code. The return codenumber is displayed in the IBM Tivoli Monitoring Web Health Console status field,or by using the wdmlseng command.
CLI examplewdmeditprf -P OracleProfile#tme-region -add OracleMaximumExtentsByUser -c 3600 \-Log -LogDisable -p 12:00 -Agg no -ap 00:15 -NoMin -NoMax -Avg \-t Oracle_Minimum_FreeExtentsByUser 5.000000 \-AddPar IncludeUser "SYS" \
168 IBM Tivoli Monitoring for Databases: Oracle: Reference Guide

-AddPar SegmentMetrics "numPctExtentsAllocated" \-AddPar SegmentMetrics "numFreeExtents" \-AddPar SegmentMetrics "numCurrentExtents" \-DelPar NumberOfRows "50" \-AddPar NumberOfRows "25" \-e Oracle_Low_FreeExtentsByUser \-o 1 -h 0 -severity CRITICAL -SendTBSM -SendTec
Chapter 2. Resource models 169
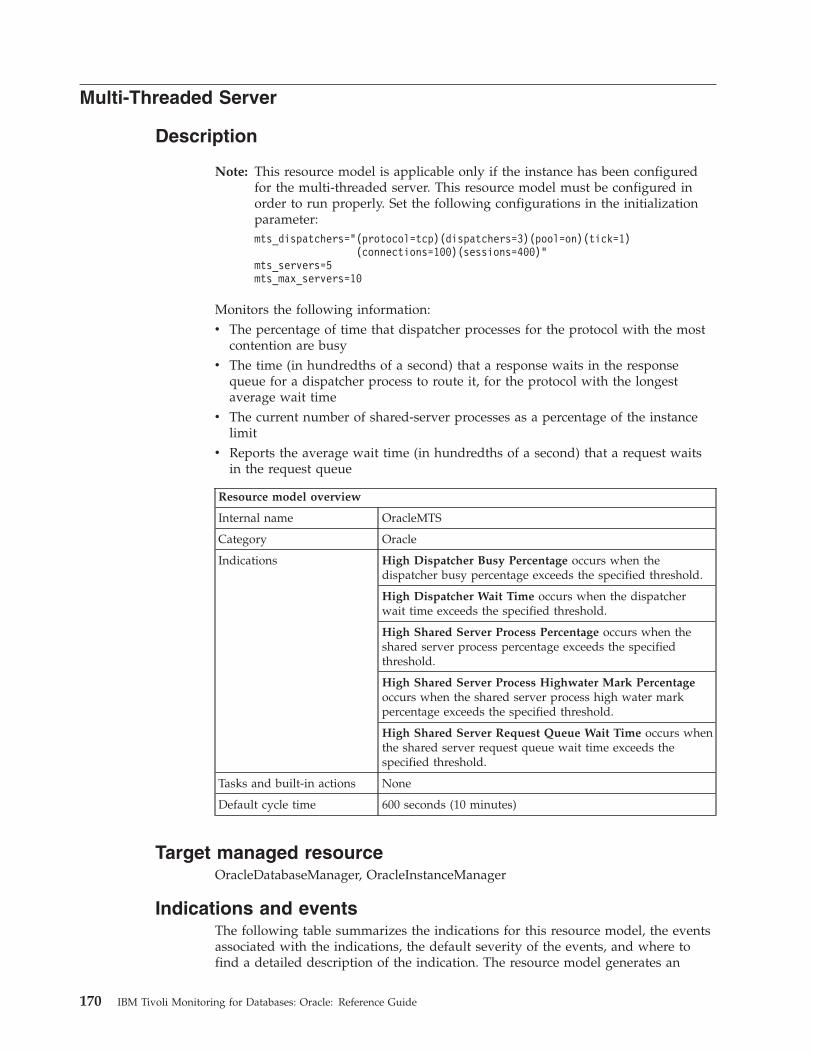
Multi-Threaded Server
Description
Note: This resource model is applicable only if the instance has been configuredfor the multi-threaded server. This resource model must be configured inorder to run properly. Set the following configurations in the initializationparameter:mts_dispatchers="(protocol=tcp)(dispatchers=3)(pool=on)(tick=1)
(connections=100)(sessions=400)"mts_servers=5mts_max_servers=10
Monitors the following information:v The percentage of time that dispatcher processes for the protocol with the most
contention are busyv The time (in hundredths of a second) that a response waits in the response
queue for a dispatcher process to route it, for the protocol with the longestaverage wait time
v The current number of shared-server processes as a percentage of the instancelimit
v Reports the average wait time (in hundredths of a second) that a request waitsin the request queue
Resource model overview
Internal name OracleMTS
Category Oracle
Indications High Dispatcher Busy Percentage occurs when thedispatcher busy percentage exceeds the specified threshold.
High Dispatcher Wait Time occurs when the dispatcherwait time exceeds the specified threshold.
High Shared Server Process Percentage occurs when theshared server process percentage exceeds the specifiedthreshold.
High Shared Server Process Highwater Mark Percentageoccurs when the shared server process high water markpercentage exceeds the specified threshold.
High Shared Server Request Queue Wait Time occurs whenthe shared server request queue wait time exceeds thespecified threshold.
Tasks and built-in actions None
Default cycle time 600 seconds (10 minutes)
Target managed resourceOracleDatabaseManager, OracleInstanceManager
Indications and eventsThe following table summarizes the indications for this resource model, the eventsassociated with the indications, the default severity of the events, and where tofind a detailed description of the indication. The resource model generates an
170 IBM Tivoli Monitoring for Databases: Oracle: Reference Guide

event when the threshold you specify for the indication is triggered.
Indication Generated event Defaultseverity
Clearingevents
Page
HighDispatcherBusyPercentage
Oracle_High_DispatcherBusyPercentage
Critical Yes 171
HighDispatcherWait Time
Oracle_High_DispatcherWaitTime
Critical Yes 172
High SharedServer ProcessPercentage
Oracle_High_SharedServerProcessPercentage
Critical Yes 173
High SharedServer ProcessHighwaterMarkPercentage
Oracle_High_SharedServerProcessHWMPercentage
Critical Yes 174
High SharedServerRequestQueue WaitTime
Oracle_High_SharedServerRequestQueueWaitTime
Critical Yes 175
High Dispatcher Busy Percentage indicationOccurs when the dispatcher busy percentage exceeds the specified threshold. Whenthe indication occurs often enough to trigger an event, the event delivers amessage to the Tivoli Enterprise Console in the following format:<application_label>: The Dispatcher Busy Percentage for the <Protocol> protocolfor Oracle instance <InstanceName> has crossed above the predefined threshold of<Threshold> percent and is currently at <DispatcherBusyPercentage> percent.
If you have Tivoli Business Systems Manager configured for your system, TivoliEnterprise Console forwards the message to Tivoli Business Systems Manager.
You can check the health of this resource model in the IBM Tivoli Monitoring WebHealth Console. For more information, see the IBM Tivoli Monitoring Web HealthConsole documentation.
Indicates the percentage of time that the dispatcher processes for each protocol arebusy. If the dispatcher processes for a specific protocol are busy for more than 50%of the time, you can improve performance by adding more dispatcher processes.Do this by increasing the value of the MTS_MAX_DISPATCHERS initializationparameter.
The indication has the following attributes:
DispatcherBusyPercentageThe percentage of time that dispatcher processes for the specified protocolare busy.
InstanceNameThe name of an Oracle database instance. The instance name is identified
Chapter 2. Resource models 171

by the INSTANCE_NAME parameter in the database initializationparameter file and corresponds to the Oracle System Identifier (SID) of theinstance.
ProtocolThe protocol utilized by one or more dispatchers.
This indication has the following thresholds:v Maximum Dispatcher Busy Percentage
For more information about these thresholds, see “Thresholds” on page 176.
The following table describes the default settings for this indication.
Setting Default value
Send indications to Tivoli Enterprise Console Yes
Send indications to Tivoli Business SystemsManager
Yes
Occurrences 1
Holes 0
Associated tasks and built-in actions None
Note: If you have Tivoli Business Systems Manager configured for your systems,Tivoli Enterprise Console automatically forwards events to Tivoli BusinessSystems Manager. Do not change the configuration of the indication to sendevents to Tivoli Business Systems Manager.
High Dispatcher Wait Time indicationOccurs when the dispatcher wait time exceeds the specified threshold. When theindication occurs often enough to trigger an event, the event delivers a message tothe Tivoli Enterprise Console in the following format:<application_label>: The Dispatcher Wait Time for the <Protocol> protocolfor Oracle instance <InstanceName> has crossed above the predefined threshold of<Threshold> hundredths of a second and is currently at<DispatcherWaitTime> hundredths of a second.
If you have Tivoli Business Systems Manager configured for your system, TivoliEnterprise Console forwards the message to Tivoli Business Systems Manager.
You can check the health of this resource model in the IBM Tivoli Monitoring WebHealth Console. For more information, see the IBM Tivoli Monitoring Web HealthConsole documentation.
If the longest average wait time exceeds 0.1 seconds, you can improve performanceby adding more dispatcher processes. Do this by increasing the value of theMTS_MAX_DISPATCHERS initialization parameter for Oracle 8i or 9i, orMAX_DISPATCHERS for Oracle 9i.
The indication has the following attributes:
DispatcherWaitTimeThe average time (in hundredths of a second) that a response waits in theresponse queue for all dispatchers of the specified protocol to route it.
InstanceNameThe name of an Oracle database instance. The instance name is identified
172 IBM Tivoli Monitoring for Databases: Oracle: Reference Guide

by the INSTANCE_NAME parameter in the database initializationparameter file and corresponds to the Oracle System Identifier (SID) of theinstance.
ProtocolThe protocol utilized by one or more dispatchers.
This indication has the following thresholds:v Maximum Dispatcher Wait Time
For more information about these thresholds, see “Thresholds” on page 176.
The following table describes the default settings for this indication.
Setting Default value
Send indications to Tivoli Enterprise Console Yes
Send indications to Tivoli Business SystemsManager
Yes
Occurrences 1
Holes 0
Associated tasks and built-in actions None
Note: If you have Tivoli Business Systems Manager configured for your systems,Tivoli Enterprise Console automatically forwards events to Tivoli BusinessSystems Manager. Do not change the configuration of the indication to sendevents to Tivoli Business Systems Manager.
High Shared Server Process Percentage indicationOccurs when the shared server process percentage exceeds the specified threshold.When the indication occurs often enough to trigger an event, the event delivers amessage to the Tivoli Enterprise Console in the following format:<application_label>: The Shared Server Process Percentage for Oracle instance<InstanceName> has crossed above the predefined threshold of <Threshold>percent and is currently at <SharedServerProcessPercentage> percent.
If you have Tivoli Business Systems Manager configured for your system, TivoliEnterprise Console forwards the message to Tivoli Business Systems Manager.
You can check the health of this resource model in the IBM Tivoli Monitoring WebHealth Console. For more information, see the IBM Tivoli Monitoring Web HealthConsole documentation.
Indicates the current number of shared server processes as a percentage of theinstance limit. This controls the maximum number of shared server processesallowed to run simultaneously (the default is 20). If the shared server process ratioexceeds 85%, consider increasing the MTS_MAX_SERVERS initialization parameterfor Oracle 8i or 9i, or MAX_SERVERS for Oracle 9i.
The indication has the following attribute:
InstanceNameThe name of an Oracle database instance. The instance name is identifiedby the INSTANCE_NAME parameter in the database initializationparameter file and corresponds to the Oracle System Identifier (SID) of theinstance.
Chapter 2. Resource models 173

SharedServerProcessPercentageThe current number of shared-server processes as a percentage of theinstance limit.
This indication has the following thresholds:v Maximum Shared Server Process Percentage
For more information about these thresholds, see “Thresholds” on page 176.
The following table describes the default settings for this indication.
Setting Default value
Send indications to Tivoli Enterprise Console Yes
Send indications to Tivoli Business SystemsManager
Yes
Occurrences 1
Holes 0
Associated tasks and built-in actions None
Note: If you have Tivoli Business Systems Manager configured for your systems,Tivoli Enterprise Console automatically forwards events to Tivoli BusinessSystems Manager. Do not change the configuration of the indication to sendevents to Tivoli Business Systems Manager.
High Shared Server Process Highwater Mark PercentageindicationOccurs when the shared server process high water mark percentage exceeds thespecified threshold. When the indication occurs often enough to trigger an event,the event delivers a message to the Tivoli Enterprise Console in the followingformat:<application_label>: The Shared Server Process Highwater Mark Percentage forOracle instance <InstanceName> has crossed above the predefined threshold of<Threshold> percent and is currently at<SharedServerProcessHWMPercentage> percent.
If you have Tivoli Business Systems Manager configured for your system, TivoliEnterprise Console forwards the message to Tivoli Business Systems Manager.
You can check the health of this resource model in the IBM Tivoli Monitoring WebHealth Console. For more information, see the IBM Tivoli Monitoring Web HealthConsole documentation.
The indication has the following attribute:
InstanceNameThe name of an Oracle database instance. The instance name is identifiedby the INSTANCE_NAME parameter in the database initializationparameter file and corresponds to the Oracle System Identifier (SID) of theinstance.
SharedServerProcessHWMPercentageThe highest number of shared-server processes as a percentage of theinstance limit.
This indication has the following thresholds:
174 IBM Tivoli Monitoring for Databases: Oracle: Reference Guide
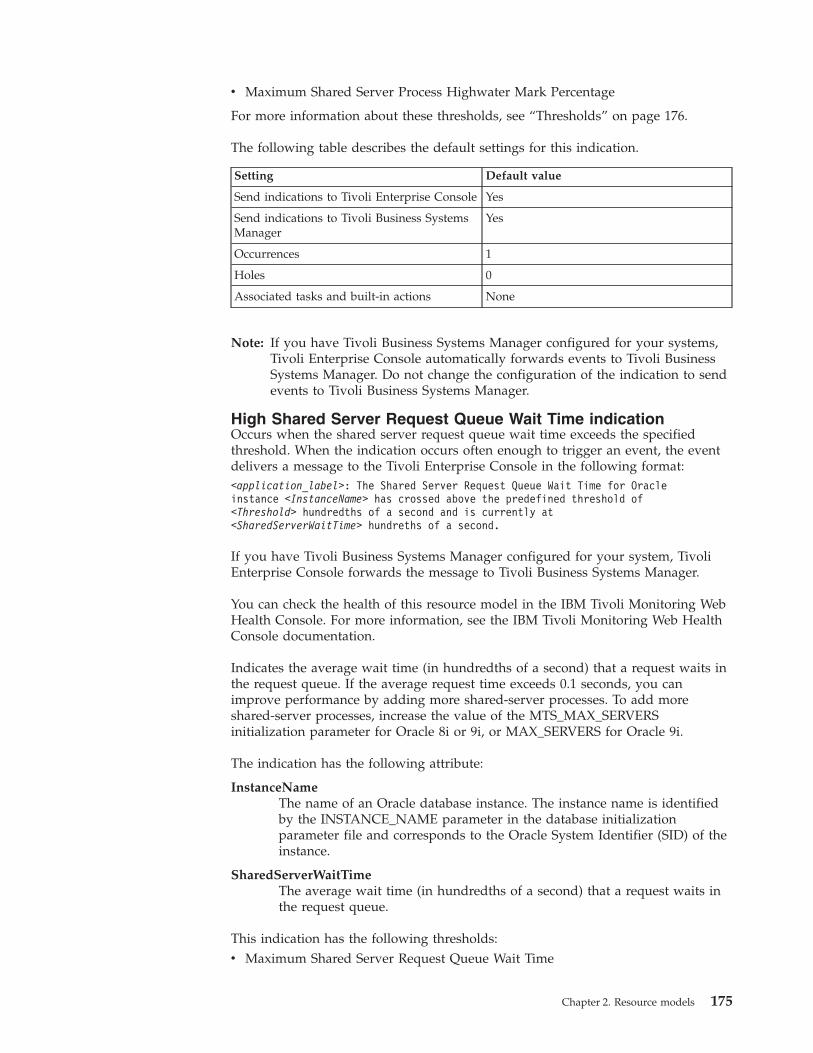
v Maximum Shared Server Process Highwater Mark Percentage
For more information about these thresholds, see “Thresholds” on page 176.
The following table describes the default settings for this indication.
Setting Default value
Send indications to Tivoli Enterprise Console Yes
Send indications to Tivoli Business SystemsManager
Yes
Occurrences 1
Holes 0
Associated tasks and built-in actions None
Note: If you have Tivoli Business Systems Manager configured for your systems,Tivoli Enterprise Console automatically forwards events to Tivoli BusinessSystems Manager. Do not change the configuration of the indication to sendevents to Tivoli Business Systems Manager.
High Shared Server Request Queue Wait Time indicationOccurs when the shared server request queue wait time exceeds the specifiedthreshold. When the indication occurs often enough to trigger an event, the eventdelivers a message to the Tivoli Enterprise Console in the following format:<application_label>: The Shared Server Request Queue Wait Time for Oracleinstance <InstanceName> has crossed above the predefined threshold of<Threshold> hundredths of a second and is currently at<SharedServerWaitTime> hundreths of a second.
If you have Tivoli Business Systems Manager configured for your system, TivoliEnterprise Console forwards the message to Tivoli Business Systems Manager.
You can check the health of this resource model in the IBM Tivoli Monitoring WebHealth Console. For more information, see the IBM Tivoli Monitoring Web HealthConsole documentation.
Indicates the average wait time (in hundredths of a second) that a request waits inthe request queue. If the average request time exceeds 0.1 seconds, you canimprove performance by adding more shared-server processes. To add moreshared-server processes, increase the value of the MTS_MAX_SERVERSinitialization parameter for Oracle 8i or 9i, or MAX_SERVERS for Oracle 9i.
The indication has the following attribute:
InstanceNameThe name of an Oracle database instance. The instance name is identifiedby the INSTANCE_NAME parameter in the database initializationparameter file and corresponds to the Oracle System Identifier (SID) of theinstance.
SharedServerWaitTimeThe average wait time (in hundredths of a second) that a request waits inthe request queue.
This indication has the following thresholds:v Maximum Shared Server Request Queue Wait Time
Chapter 2. Resource models 175

For more information about these thresholds, see “Thresholds” on page 176.
The following table describes the default settings for this indication.
Setting Default value
Send indications to Tivoli Enterprise Console Yes
Send indications to Tivoli Business SystemsManager
Yes
Occurrences 1
Holes 0
Associated tasks and built-in actions None
Note: If you have Tivoli Business Systems Manager configured for your systems,Tivoli Enterprise Console automatically forwards events to Tivoli BusinessSystems Manager. Do not change the configuration of the indication to sendevents to Tivoli Business Systems Manager.
ThresholdsThe following table lists the thresholds that can be set for the Multi-ThreadedServer resource model. For each threshold it shows the name, a short description,and the default value:
Threshold Description Defaultvalue
Maximum DispatcherBusy Percentage
An indication occurs when the dispatcher busypercentage exceeds this value.
95
Maximum DispatcherWait Time
An indication occurs when the dispatcher waittime exceeds this value.
500
Maximum Shared ServerProcess Percentage
An indication occurs when the shared serverprocess percentage exceeds this value.
95
Maximum Shared ServerProcess Highwater MarkPercentage
An indication occurs when the shared serverprocess percentage high-water-mark exceeds thisvalue.
95
Maximum Shared ServerRequest Queue WaitTime
An indication occurs when the shared serverrequest queue wait time exceeds this value.
500
Parameters
Note: A plus symbol (+) denotes parameters that feature selective logging.Selective logging enables you to choose metrics/properties that you want tolog. The selective logging metrics are listed in the value field of theParameters window.
The following table lists the parameters that can be set for the Multi-ThreadedServer resource model. The table shows the name, a short description, and thedefault value for each parameter:
176 IBM Tivoli Monitoring for Databases: Oracle: Reference Guide

Parameter Description Default value
DispatcherProtocol MTSMetrics +
Select the metrics you want to log.See the following logging table for adescription of each metric.
Busy Percentage
Dispatcher Wait Time
Instance MTSMetrics +
Select the metrics you want to log.See the following logging table for adescription of each metric.
Mark Percentage
Shared Server ProcessHighwater
Shared Server ProcessPercentage
Shared Server Wait Time
Tasks and built-in actionsNone
LoggingYou can log data for the properties of the managed resource listed in the followingtable. The table shows the context of the managed resource and the properties thatthe resource model logs for the IBM Tivoli Monitoring Web Health Console.
Managed resource Context Properties
OracleDispatcherProtocol MTSBusyPercentage
The percentage of time that dispatcherprocesses for the specified protocol arebusy.
DispatcherWaitTimeThe average time (in hundredths of asecond) that a response waits untildispatchers of the specified protocol routeit from the response queue.
InstanceName*The name of an Oracle database instance.
OracleDatabase.DatabaseName*The name of an Oracle database.
Protocol*The protocol utilized by one or moredispatchers.
Chapter 2. Resource models 177

Managed resource Context Properties
OracleInstance MTSInstanceName*
The name of an Oracle database instance.
OracleDatabase.DatabaseName*The name of an Oracle database.
SharedServerProcessHWMPercentageThe highest number of servers running atthe same time since the instance started.
SharedServerProcessPercentageThe current number of shared-serverprocesses as a percentage of the instancelimit.
SharedServerWaitTimeThe average wait time (in hundredths of asecond) that a request waits in the requestqueue.
Note: An asterisk (*) denotes a key property.
Return codesTable 2 on page 7 contains a listing of resource model return codes, theirdescription, and what action you can take to resolve each code. The return codenumber is displayed in the IBM Tivoli Monitoring Web Health Console status field,or by using the wdmlseng command.
CLI examplewdmeditprf -P OracleProfile#tme-region -add OracleMTS -c 600 \-Log -LogDisable -p 12:00 -Agg no -ap 00:15 -NoMin -NoMax -Avg \-t Maximum_DispatcherBusyPercentage 95.000000 \-t Maximum_DispatcherWaitTime 500.000000 \-t Maximum_SharedServerProcessHWMPercentage 95.000000 \-t Maximum_SharedServerProcessPercentage 95.000000 \-t Maximum_SharedServerRequestQueueWaitTime 500.000000 \-AddPar DispatcherProtocolMTSMetrics "numBusyPercentage" \-AddPar DispatcherProtocolMTSMetrics "numDispatcherWaitTime" \-AddPar InstanceMTSMetrics "numSharedServerWaitTime" \-AddPar InstanceMTSMetrics "numSharedServerProcessPercentage" \-AddPar InstanceMTSMetrics "numSharedServerProcessHWMPercentage" \-e Oracle_High_SharedServerRequestQueueWaitTime \-o 1 -h 0 -severity CRITICAL -SendTBSM -SendTec \-e Oracle_High_SharedServerProcessPercentage \-o 1 -h 0 -severity CRITICAL -SendTBSM -SendTec \-e Oracle_High_DispatcherWaitTime \-o 1 -h 0 -severity CRITICAL -SendTBSM -SendTec \-e Oracle_High_SharedServerProcessHWMPercentage \-o 1 -h 0 -severity CRITICAL -SendTBSM -SendTec \-e Oracle_High_DispatcherBusyPercentage \-o 1 -h 0 -severity CRITICAL -SendTBSM -SendTec
178 IBM Tivoli Monitoring for Databases: Oracle: Reference Guide
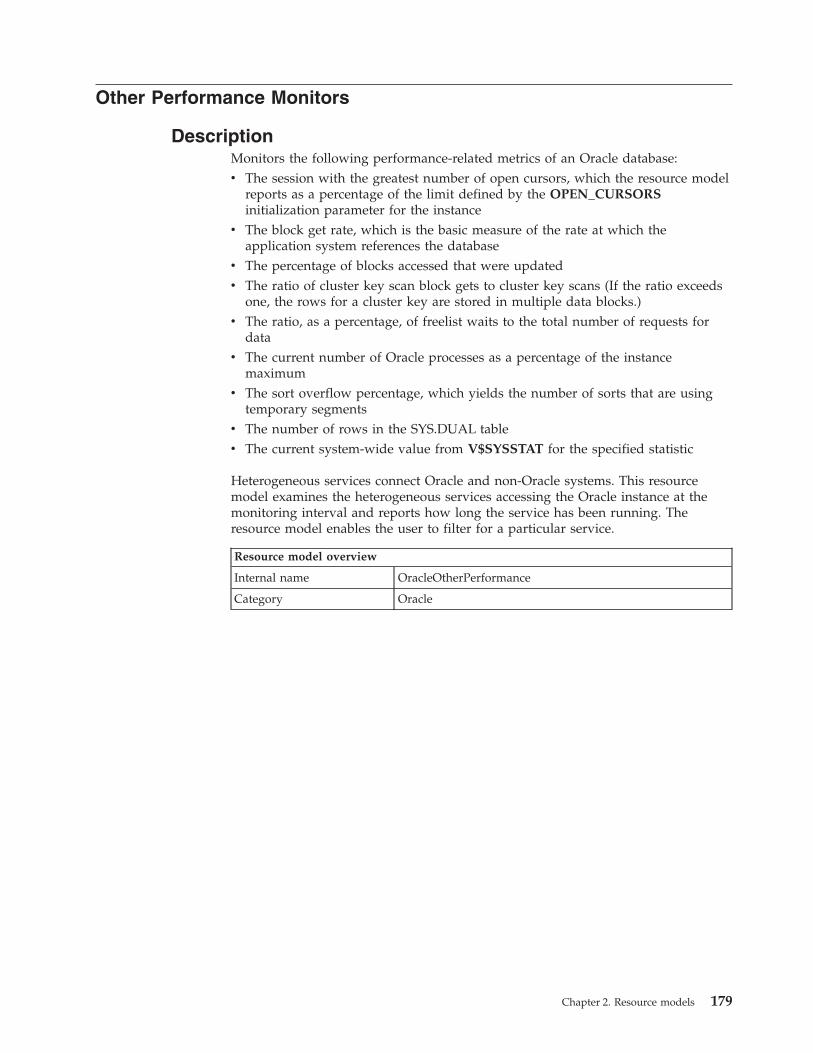
Other Performance Monitors
DescriptionMonitors the following performance-related metrics of an Oracle database:v The session with the greatest number of open cursors, which the resource model
reports as a percentage of the limit defined by the OPEN_CURSORSinitialization parameter for the instance
v The block get rate, which is the basic measure of the rate at which theapplication system references the database
v The percentage of blocks accessed that were updatedv The ratio of cluster key scan block gets to cluster key scans (If the ratio exceeds
one, the rows for a cluster key are stored in multiple data blocks.)v The ratio, as a percentage, of freelist waits to the total number of requests for
datav The current number of Oracle processes as a percentage of the instance
maximumv The sort overflow percentage, which yields the number of sorts that are using
temporary segmentsv The number of rows in the SYS.DUAL tablev The current system-wide value from V$SYSSTAT for the specified statistic
Heterogeneous services connect Oracle and non-Oracle systems. This resourcemodel examines the heterogeneous services accessing the Oracle instance at themonitoring interval and reports how long the service has been running. Theresource model enables the user to filter for a particular service.
Resource model overview
Internal name OracleOtherPerformance
Category Oracle
Chapter 2. Resource models 179

Resource model overview
Indications High Any V$SYSSTAT occurs when the value of thestatistic from V$SYSSTAT exceeds the predefined threshold.
High Changed Block Percentage occurs when the ChangedBlock Percentage for the particular Oracle Instance crossesabove the predefined threshold.
High Freelist Waits Ratio occurs when the Freelist WaitsRatio for the particular Oracle Instance exceeds thepredefined threshold.
High Open Cursors Percentage occurs when the percentageof open cursors over the maximum open cursors for aparticular session exceeds the predefined threshold.
High Process Percentage occurs when the ProcessPercentage for the particular Oracle Instance exceeds thepredefined threshold.
High Session Percentage occurs when the SessionPercentage for the particular Oracle Instance exceeds thepredefined threshold.
High Sort Overflow Percentage occurs when the SortOverflow Percentage for the particular Oracle Instancecrosses above the predefined threshold.
Low Any V$SYSSTAT occurs when the value of the statisticfrom V$SYSSTAT crosses below the predefined threshold.
Low Block Get Rate occurs when the Block Get Rate is lessthan the predefined threshold.
Unavailable Heterogeneous Agent occurs when theHeterogeneous Agent is unavailable.
Tasks and built-in actions None
Default cycle time 1800 seconds (30 minutes)
Target managed resourceOracleDatabaseManager, OracleInstanceManager
Indications and eventsThe following table summarizes the indications for this resource model, the eventsassociated with the indications, the default severity of the events, and where tofind a detailed description of the indication. The resource model generates anevent when the threshold you specify for the indication is triggered.
Indication Generated event Defaultseverity
Clearingevents
Page
High AnyV$SYSSTAT
Oracle_High_SysStat Critical Yes 181
High ChangedBlock Percentage
Oracle_High_ChangedBlockPercentage
Critical Yes 182
High FreelistWaits Ratio
Oracle_High_FreelistWaitsRatio
Critical Yes 183
High OpenCursorsPercentage
Oracle_High_OpenCursors Critical Yes 184
180 IBM Tivoli Monitoring for Databases: Oracle: Reference Guide
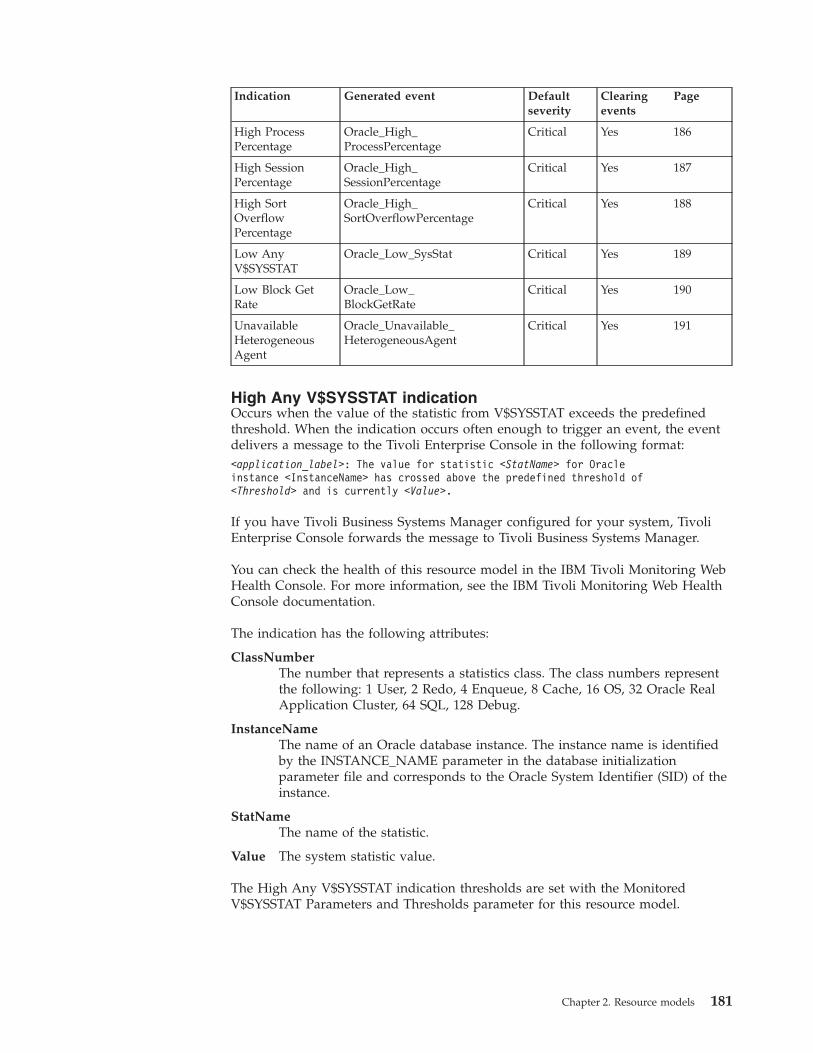
Indication Generated event Defaultseverity
Clearingevents
Page
High ProcessPercentage
Oracle_High_ProcessPercentage
Critical Yes 186
High SessionPercentage
Oracle_High_SessionPercentage
Critical Yes 187
High SortOverflowPercentage
Oracle_High_SortOverflowPercentage
Critical Yes 188
Low AnyV$SYSSTAT
Oracle_Low_SysStat Critical Yes 189
Low Block GetRate
Oracle_Low_BlockGetRate
Critical Yes 190
UnavailableHeterogeneousAgent
Oracle_Unavailable_HeterogeneousAgent
Critical Yes 191
High Any V$SYSSTAT indicationOccurs when the value of the statistic from V$SYSSTAT exceeds the predefinedthreshold. When the indication occurs often enough to trigger an event, the eventdelivers a message to the Tivoli Enterprise Console in the following format:<application_label>: The value for statistic <StatName> for Oracleinstance <InstanceName> has crossed above the predefined threshold of<Threshold> and is currently <Value>.
If you have Tivoli Business Systems Manager configured for your system, TivoliEnterprise Console forwards the message to Tivoli Business Systems Manager.
You can check the health of this resource model in the IBM Tivoli Monitoring WebHealth Console. For more information, see the IBM Tivoli Monitoring Web HealthConsole documentation.
The indication has the following attributes:
ClassNumberThe number that represents a statistics class. The class numbers representthe following: 1 User, 2 Redo, 4 Enqueue, 8 Cache, 16 OS, 32 Oracle RealApplication Cluster, 64 SQL, 128 Debug.
InstanceNameThe name of an Oracle database instance. The instance name is identifiedby the INSTANCE_NAME parameter in the database initializationparameter file and corresponds to the Oracle System Identifier (SID) of theinstance.
StatNameThe name of the statistic.
Value The system statistic value.
The High Any V$SYSSTAT indication thresholds are set with the MonitoredV$SYSSTAT Parameters and Thresholds parameter for this resource model.
Chapter 2. Resource models 181

The following table describes the default settings for this indication.
Setting Default value
Send indications to Tivoli Enterprise Console Yes
Send indications to Tivoli Business SystemsManager
Yes
Occurrences 1
Holes 0
Associated tasks and built-in actions None
Note: If you have Tivoli Business Systems Manager configured for your systems,Tivoli Enterprise Console forwards events to Tivoli Business SystemsManager. Do not change the configuration of the indication to send eventsto Tivoli Business Systems Manager.
High Changed Block Percentage indicationOccurs when the Changed Block Percentage for the particular Oracle instancecrosses above the predefined threshold. When the indication occurs often enoughto trigger an event, the event delivers a message to the Tivoli Enterprise Console inthe following format:<application_label>: The Changed Block Percentage for Oracle instance<InstanceName> has crossed above the predefined threshold of<Threshold> percent and is currently at <ChangedBlockPercentage> percent.
If you have Tivoli Business Systems Manager configured for your system, TivoliEnterprise Console forwards the message to Tivoli Business Systems Manager.
You can check the health of this resource model in the IBM Tivoli Monitoring WebHealth Console. For more information, see the IBM Tivoli Monitoring Web HealthConsole documentation.
This indication reports the balance between queries made and the DML within thedatabase application. Changes in this ratio indicate and quantify changes to indexstructures or application usage. The ratio is calculated as:
[db block changes / (db block gets + consistent gets)] * 100
The indication has the following attributes:
ChangedBlockPercentageThe percentage of blocks that were accessed and updated by users. Thepercentage is the balance between queries made and the DML within thedatabase application.
InstanceNameThe name of an Oracle database instance. The instance name is identifiedby the INSTANCE_NAME parameter in the database initializationparameter file and corresponds to the Oracle System Identifier (SID) of theinstance.
This indication has the following thresholds:v Maximum Changed Block Percentage
For more information about these thresholds, see “Thresholds” on page 192.
182 IBM Tivoli Monitoring for Databases: Oracle: Reference Guide

The following table describes the default settings for this indication.
Setting Default value
Send indications to Tivoli Enterprise Console Yes
Send indications to Tivoli Business SystemsManager
Yes
Occurrences 1
Holes 0
Associated tasks and built-in actions None
Note: If you have Tivoli Business Systems Manager configured for your systems,Tivoli Enterprise Console automatically forwards events to Tivoli BusinessSystems Manager. Do not change the configuration of the indication to sendevents to Tivoli Business Systems Manager.
High Freelist Waits Ratio indicationOccurs when the Freelist Waits Ratio for the particular Oracle Instance exceeds thepredefined threshold. When the indication occurs often enough to trigger an event,the event delivers a message to the Tivoli Enterprise Console in the followingformat:<application_label>: The Freelist Waits Ratio for Oracle instance <InstanceName>has crossed above the predefined threshold of <Threshold> percentand is currently at <FreelistWaitsRatio> percent.
If you have Tivoli Business Systems Manager configured for your system, TivoliEnterprise Console forwards the message to Tivoli Business Systems Manager.
You can check the health of this resource model in the IBM Tivoli Monitoring WebHealth Console. For more information, see the IBM Tivoli Monitoring Web HealthConsole documentation.
This indication calculates the freelist waits ratio as:
(number of free list waits / total number of requests for data) * 100
If the ratio exceeds 1%, increase the number of freelists for the relevant tables. AnOracle table is created with a default of one freelist. This might not be enough forinsert- and update-intensive tables. When two or more processes are searching thefreelist at the same time, a process might need to request additional informationfrom disk, which can result in a resource wait. To avoid this problem, export thedata from the insert- and update-intensive tables, drop the tables, recreate themwith a bigger FREELIST parameter, and import the data.
The indication has the following attributes:
FreelistWaitsRatioThe ratio of freelist waits to the total number of requests for data.
InstanceNameThe name of an Oracle database instance. The instance name is identifiedby the INSTANCE_NAME parameter in the database initializationparameter file and corresponds to the Oracle System Identifier (SID) of theinstance.
This indication has the following thresholds:
Chapter 2. Resource models 183

v Maximum Freelist Waits Ratio
For more information about these thresholds, see “Thresholds” on page 192.
The following table describes the default settings for this indication.
Setting Default value
Send indications to Tivoli Enterprise Console Yes
Send indications to Tivoli Business SystemsManager
Yes
Occurrences 1
Holes 0
Associated tasks and built-in actions None
Note: If you have Tivoli Business Systems Manager configured for your systems,Tivoli Enterprise Console automatically forwards events to Tivoli BusinessSystems Manager. Do not change the configuration of the indication to sendevents to Tivoli Business Systems Manager.
High Open Cursors Percentage indicationOccurs when the percentage of open cursors over the maximum open cursors for aparticular session exceeds the predefined threshold. When the indication occursoften enough to trigger an event, the event delivers a message to the TivoliEnterprise Console in the following format:<application_label>: The Open Cursor Percentage for Oracle Instance<InstanceName> for session <SessionID> has crossedabove the predefined threshold of <Threshold> percent and is currentlyat <OpenCursorsPercentage> percent.
If you have Tivoli Business Systems Manager configured for your system, TivoliEnterprise Console forwards the message to Tivoli Business Systems Manager.
You can check the health of this resource model in the IBM Tivoli Monitoring WebHealth Console. For more information, see the IBM Tivoli Monitoring Web HealthConsole documentation.
The location of private SQL areas is dependent on the use of a multi-threaded ordedicated server. A multi-threaded server uses the shared buffer pool to storeprivate SQL; a dedicated server uses the user’s Program Global Area (PGA). Inboth cases, the maximum number of private SQL areas that an individual sessioncan process is defined by the OPEN_CURSORS initialization parameter (thedefault is 50). Within the bounds of the maximum limit, the setting of thisparameter has little or no effect on the performance of the server; therefore, itshould be set artificially high to prevent hitting the maximum limit. The maximumlimit is operating-system dependent.
The indication has the following attributes:
AccessObjectThe name of the object currently locked by this session.
InstanceNameThe name of an Oracle database instance. The instance name is identifiedby the INSTANCE_NAME parameter in the database initializationparameter file and corresponds to the Oracle System Identifier (SID) of theinstance.
184 IBM Tivoli Monitoring for Databases: Oracle: Reference Guide

LockWaitThe address of lock waiting for, or NULL if there is none.
LockWaitTimeThe time (in seconds) since current mode was granted.
LogonTimeThe time of logon for the specified session.
MachineThe name of the machine where the client process is executing.
OpenCursorsThe number of cursors currently open by this session.
OpenCursorsPercentagePer session, the percentage of open cursors to maximum allowed cursorsper session.
OSUserThe operating system user name.
ProcessThe process identifier of the client process.
ProcessAddressThe address of the process that owns this session.
ProgramThe name of the client program being executed by the client process.
Server The server type as one of the following: dedicated, shared, pseudo, ornone.
SessionIDThe session identifier.
SQLHashValueThe hash value of the SQL statement used with SQL_ADDRESS to identifythe SQL statement that is currently being executed.
SQLTextThe text piece of a SQL statement.
UsernameThe name of the user as recognized by the Oracle server and other users sothat the user can connect to and access objects in a database. Each username is associated with a password that also must be entered to connect toan Oracle database.
This indication has the following thresholds:v Maximum Open Cursors Percentage
For more information about these thresholds, see “Thresholds” on page 192.
The following table describes the default settings for this indication.
Setting Default value
Send indications to Tivoli Enterprise Console Yes
Send indications to Tivoli Business SystemsManager
Yes
Occurrences 1
Chapter 2. Resource models 185

Setting Default value
Holes 0
Associated tasks and built-in actions None
Note: If you have Tivoli Business Systems Manager configured for your systems,Tivoli Enterprise Console automatically forwards events to Tivoli BusinessSystems Manager. Do not change the configuration of the indication to sendevents to Tivoli Business Systems Manager.
High Process Percentage indicationOccurs when the process percentage for the particular Oracle instance exceeds thepredefined threshold. When the indication occurs often enough to trigger an event,the event delivers a message to the Tivoli Enterprise Console in the followingformat:<application_label>: The Process Percentage for Oracle instance<InstanceName> has crossed above the predefined threshold of<Threshold> percent and is currently at <ProcessPercentage> percent.
If you have Tivoli Business Systems Manager configured for your system, TivoliEnterprise Console forwards the message to Tivoli Business Systems Manager.
You can check the health of this resource model in the IBM Tivoli Monitoring WebHealth Console. For more information, see the IBM Tivoli Monitoring Web HealthConsole documentation.
This indication reports the current total number of Oracle processes running on theinstance, as a percentage of the maximum. The maximum is set by thePROCESSES initialization parameter for the instance (the default is 50). If youincrease the value of the PROCESSES parameter, you must also increase the valueof SESSIONS if it is explicitly set in the initialization parameter file. Otherwise,SESSIONS defaults to PROCESSES * 1.1, which is acceptable. When setting thisparameter, set one process for each connected user, and one process for eachbackground process. Each instance requires at least four background processes(SMON, DBWR, LGWR, and PMON), but there can be a number of additionalbackground processes, including the following:v ARCn — If the database is running in ARCHIVELOG modev RECO — If the distributed option has been installedv CKPT — If the checkpoint process is runningv DBWn — One process for each additional database writerv Dnnn— One process for each dispatcherv Snnn — One process for each shared serverv LCKn — One process for each parallel server lock process
The indication has the following attributes:
InstanceNameThe name of an Oracle database instance. The instance name is identifiedby the INSTANCE_NAME parameter in the database initializationparameter file and corresponds to the Oracle System Identifier (SID) of theinstance.
ProcessPercentageThe current total number of Oracle processes running on an instance, as a
186 IBM Tivoli Monitoring for Databases: Oracle: Reference Guide
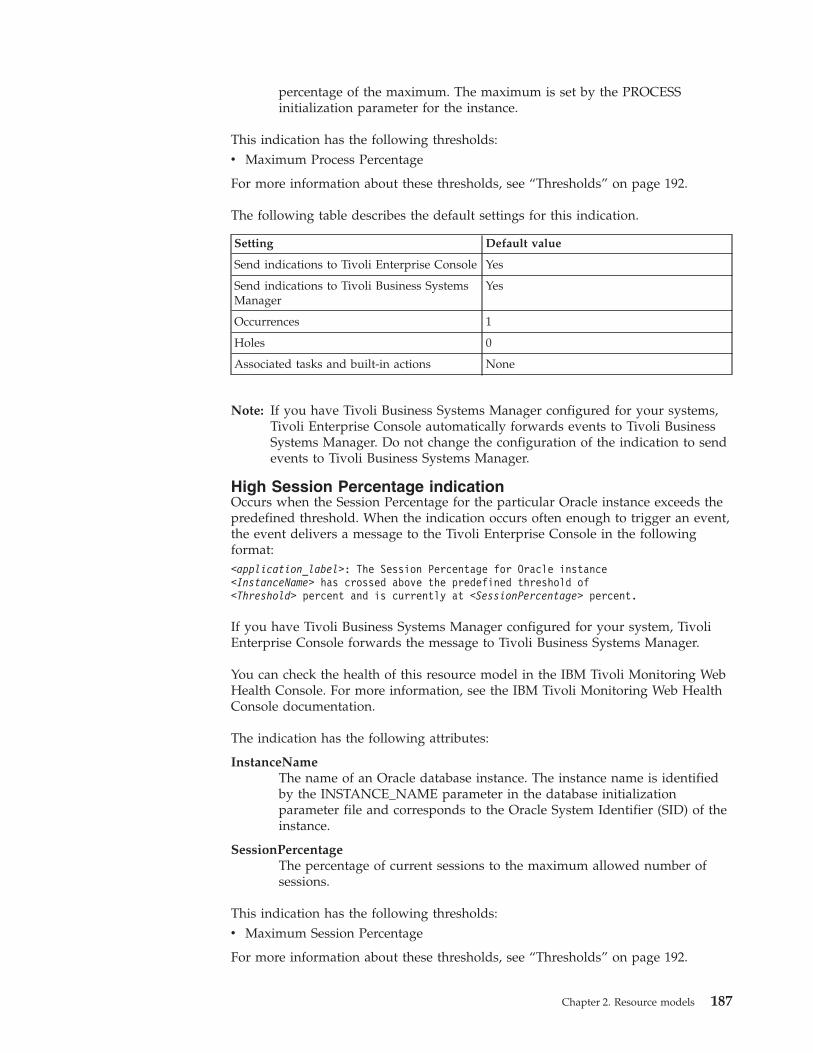
percentage of the maximum. The maximum is set by the PROCESSinitialization parameter for the instance.
This indication has the following thresholds:v Maximum Process Percentage
For more information about these thresholds, see “Thresholds” on page 192.
The following table describes the default settings for this indication.
Setting Default value
Send indications to Tivoli Enterprise Console Yes
Send indications to Tivoli Business SystemsManager
Yes
Occurrences 1
Holes 0
Associated tasks and built-in actions None
Note: If you have Tivoli Business Systems Manager configured for your systems,Tivoli Enterprise Console automatically forwards events to Tivoli BusinessSystems Manager. Do not change the configuration of the indication to sendevents to Tivoli Business Systems Manager.
High Session Percentage indicationOccurs when the Session Percentage for the particular Oracle instance exceeds thepredefined threshold. When the indication occurs often enough to trigger an event,the event delivers a message to the Tivoli Enterprise Console in the followingformat:<application_label>: The Session Percentage for Oracle instance<InstanceName> has crossed above the predefined threshold of<Threshold> percent and is currently at <SessionPercentage> percent.
If you have Tivoli Business Systems Manager configured for your system, TivoliEnterprise Console forwards the message to Tivoli Business Systems Manager.
You can check the health of this resource model in the IBM Tivoli Monitoring WebHealth Console. For more information, see the IBM Tivoli Monitoring Web HealthConsole documentation.
The indication has the following attributes:
InstanceNameThe name of an Oracle database instance. The instance name is identifiedby the INSTANCE_NAME parameter in the database initializationparameter file and corresponds to the Oracle System Identifier (SID) of theinstance.
SessionPercentageThe percentage of current sessions to the maximum allowed number ofsessions.
This indication has the following thresholds:v Maximum Session Percentage
For more information about these thresholds, see “Thresholds” on page 192.
Chapter 2. Resource models 187

The following table describes the default settings for this indication.
Setting Default value
Send indications to Tivoli Enterprise Console Yes
Send indications to Tivoli Business SystemsManager
Yes
Occurrences 1
Holes 0
Associated tasks and built-in actions None
Note: If you have Tivoli Business Systems Manager configured for your systems,Tivoli Enterprise Console automatically forwards events to Tivoli BusinessSystems Manager. Do not change the configuration of the indication to sendevents to Tivoli Business Systems Manager.
High Sort Overflow Percentage indicationOccurs when the Sort Overflow Percentage for the particular Oracle instancecrosses above the predefined threshold. When the indication occurs often enoughto trigger an event, the event delivers a message to the Tivoli Enterprise Console inthe following format:<application_label>: The Sort Overflow Percentage for Oracle instance<InstanceName> has crossed above the predefined threshold of<Threshold> percent and is currently at <SortOverflowPercentage> percent.
If you have Tivoli Business Systems Manager configured for your system, TivoliEnterprise Console forwards the message to Tivoli Business Systems Manager.
You can check the health of this resource model in the IBM Tivoli Monitoring WebHealth Console. For more information, see the IBM Tivoli Monitoring Web HealthConsole documentation.
For a system running mainly medium-sized sorts and configured with theshared-server option, increase the SORT_AREA_SIZE parameter to improveperformance. The sort overflow ratio is calculated as:
Sorts(disk) / (Sorts(memory) + Sorts(disk))
Disk sorts require the creation of temporary segments on disk to store theintermediate sort results. This occurs if the amount of data being sorted exceedsthe value of the SORT_AREA_SIZE initialization parameter. Ideally, the ratio ofdisk sorts to memory sorts should be less than 5%. To increase the percentage ofmemory sorts, increase the value of SORT_AREA_SIZE. However, the sort area isallocated for each user, so increase the value in small increments to avoidallocating too much memory to sort areas.
The indication has the following attributes:
InstanceNameThe name of an Oracle database instance. The instance name is identifiedby the INSTANCE_NAME parameter in the database initializationparameter file and corresponds to the Oracle System Identifier (SID) of theinstance.
SortOverflowPercentageThe percentage of sorts that are using temporary segments.
188 IBM Tivoli Monitoring for Databases: Oracle: Reference Guide

This indication has the following thresholds:v Maximum Sort Overflow Percentage
For more information about these thresholds, see “Thresholds” on page 192.
The following table describes the default settings for this indication.
Setting Default value
Send indications to Tivoli Enterprise Console Yes
Send indications to Tivoli Business SystemsManager
Yes
Occurrences 1
Holes 0
Associated tasks and built-in actions None
Note: If you have Tivoli Business Systems Manager configured for your systems,Tivoli Enterprise Console automatically forwards events to Tivoli BusinessSystems Manager. Do not change the configuration of the indication to sendevents to Tivoli Business Systems Manager.
Low Any V$SYSSTAT indicationOccurs when the value of the statistic from V$SYSSTAT crosses below thepredefined threshold. When the indication occurs often enough to trigger an event,the event delivers a message to the Tivoli Enterprise Console in the followingformat:<application_label>: The value for statistic <StatName>for Oracle instance <InstanceName> has crossed below the predefined threshold of<Threshold> and is currently at <Value>.
If you have Tivoli Business Systems Manager configured for your system, TivoliEnterprise Console forwards the message to Tivoli Business Systems Manager.
You can check the health of this resource model in the IBM Tivoli Monitoring WebHealth Console. For more information, see the IBM Tivoli Monitoring Web HealthConsole documentation.
The indication has the following attributes:
ClassNumberThe number that represents a statistics class. The class numbers representthe following: 1 User, 2 Redo, 4 Enqueue, 8 Cache, 16 OS, 32 Oracle RealApplication Cluster, 64 SQL, 128 Debug.
InstanceNameThe name of an Oracle database instance. The instance name is identifiedby the INSTANCE_NAME parameter in the database initializationparameter file and corresponds to the Oracle System Identifier (SID) of theinstance.
StatNameThe statistic name for the specified session.
Value The statistic value for the specified session.
The Low Any V$SYSSTAT indication thresholds are set with the MonitoredV$SYSSTAT Parameters and Thresholds parameter for this resource model.
Chapter 2. Resource models 189

The following table describes the default settings for this indication.
Setting Default value
Send indications to Tivoli Enterprise Console Yes
Send indications to Tivoli Business SystemsManager
Yes
Occurrences 1
Holes 0
Associated tasks and built-in actions None
Note: If you have Tivoli Business Systems Manager configured for your systems,Tivoli Enterprise Console automatically forwards events to Tivoli BusinessSystems Manager. Do not change the configuration of the indication to sendevents to Tivoli Business Systems Manager.
Low Block Get Rate indicationOccurs when the Block Get Rate is less than the predefined threshold. The BlockGet Rate is the basic measure of the rate at which an application system referencesthe database. When the indication occurs often enough to trigger an event, theevent delivers a message to the Tivoli Enterprise Console in the following format:<application_label>: The Block Get Rate for Oracle Instance<InstanceName> has crossed below the predefined threshold of<Threshold> and is currently <BlockGetRate>.
If you have Tivoli Business Systems Manager configured for your system, TivoliEnterprise Console forwards the message to Tivoli Business Systems Manager.
You can check the health of this resource model in the IBM Tivoli Monitoring WebHealth Console. For more information, see the IBM Tivoli Monitoring Web HealthConsole documentation.
This indication calculates the block get rate as:
(db block gets + consistent gets) / second
The indication has the following attributes:
BlockGetRateThe rate at which the application system references the database.
InstanceNameThe name of an Oracle database instance. The instance name is identifiedby the INSTANCE_NAME parameter in the database initializationparameter file and corresponds to the Oracle System Identifier (SID) of theinstance.
This indication has the following thresholds:v Minimum Block Get Rate
For more information about these thresholds, see “Thresholds” on page 192.
The following table describes the default settings for this indication.
Setting Default value
Send indications to Tivoli Enterprise Console Yes
190 IBM Tivoli Monitoring for Databases: Oracle: Reference Guide

Setting Default value
Send indications to Tivoli Business SystemsManager
Yes
Occurrences 1
Holes 0
Associated tasks and built-in actions None
Note: If you have Tivoli Business Systems Manager configured for your systems,Tivoli Enterprise Console automatically forwards events to Tivoli BusinessSystems Manager. Do not change the configuration of the indication to sendevents to Tivoli Business Systems Manager.
Unavailable Heterogeneous Agent indicationOccurs when the Heterogeneous Agent is unavailable. When the indication occursoften enough to trigger an event, the event delivers a message to the TivoliEnterprise Console in the following format:<application_label>: The Heterogenous Agent Service <AgentID>:<Program> for Oracle Instance <InstanceName> is unavailable.
If you have Tivoli Business Systems Manager configured for your system, TivoliEnterprise Console forwards the message to Tivoli Business Systems Manager.
You can check the health of this resource model in the IBM Tivoli Monitoring WebHealth Console. For more information, see the IBM Tivoli Monitoring Web HealthConsole documentation.
The indication has the following attributes:
AgentIDThe Net8 session identifier used for connections to a heterogeneous serviceagent. The identifier must be the same as listed in the LISTENER.ORA file.
Agent_TypeThe type of heterogeneous service agent.
InstanceNameThe name of an Oracle database instance. The instance name is identifiedby the INSTANCE_NAME parameter in the database initializationparameter file and corresponds to the Oracle System Identifier (SID) of theinstance.
MachineThe name of the operating system machine.
OSUserThe operating system username of the user.
ProcessIDThe operating system process identifier of the heterogeneous service agent.
ProgramThe program name of the heterogeneous service agent.
RunningDaysThe number of days this agent has been running.
This indication has no thresholds.
Chapter 2. Resource models 191

The following table describes the default settings for this indication.
Setting Default value
Send indications to Tivoli Enterprise Console Yes
Send indications to Tivoli Business SystemsManager
Yes
Occurrences 1
Holes 0
Associated tasks and built-in actions None
Note: If you have Tivoli Business Systems Manager configured for your systems,Tivoli Enterprise Console automatically forwards events to Tivoli BusinessSystems Manager. Do not change the configuration of the indication to sendevents to Tivoli Business Systems Manager.
ThresholdsThe following table lists the thresholds that can be set for the Other PerformanceMonitors resource model. For each threshold it shows the name, a shortdescription, and the default value:
Threshold Description Defaultvalue
Maximum ChangedBlock Percentage
An indication occurs if the Changed BlockPercentage for a particular Oracle instanceexceeds this value.
20
Maximum Freelist WaitsRatio
An indication occurs if the Freelist Waits ratio fora particular Oracle instance exceeds this value.This ratio is calculated as the number of freelistwaits over the total number of requests for data.
2
Maximum Open CursorsPercentage
An indication occurs if the percentage of asession’s open cursors exceeds this value. Thispercentage is reported as the session with thegreatest number of open cursors over the limitdefined by the OPEN_CURSORS initializationparameter for the instance.
85
Maximum ProcessPercentage
An indication occurs if the process percentage fora particular Oracle instance exceeds this value.
90
Maximum SessionPercentage
An indication occurs if the session percentage fora particular Oracle instance exceeds this value.
90
Maximum Sort OverflowPercentage
An indication occurs if the Sort OverflowPercentage for a particular Oracle instanceexceeds this value.
10
Minimum Block Get Rate An indication occurs if the Block Get Rate, whichis the basic measure of the rate at which anapplication system references the database, islower than this value.
40
192 IBM Tivoli Monitoring for Databases: Oracle: Reference Guide

Parameters
Note: A plus symbol (+) denotes parameters that feature selective logging.Selective logging enables you to choose metrics/properties that you want tolog. The selective logging metrics are listed in the value field of theParameters window.
The following table lists the parameters that can be set for the Other PerformanceMonitors resource model. The table shows the name, a short description, and thedefault value for each parameter:
Parameter Description Default value
Instance Metrics + Select the metrics you want to log. Seethe following logging table for adescription of each metric.
Block Get Rate
Changed Block Percentage
Freelist Waits Ratio
Process Percentage
Session Percentage
Sort Overflow Percentage
MonitoredHeterogeneousAgents
This list contains the names of allOracle Heterogeneous Agents that thisresource model monitors.
None
MonitoredV$SYSSTATParameters andThresholds
This list contains all the parametersfrom the V$SYSSTAT table that thisresource model monitors and theirappropriate threshold types and levels.For example, the default value ofenqueue waits:High:0 means that if thevalue of V$SYSSTAT.ENQUEUE WAITSis greater than 0, then it will send theHigh Any V$SYSSTAT indicationdescribed on 181. If the default valuestated enqueue waits:Low:5 then if thevalue of V$SYSSTAT.ENQUEUE WAITSwas less than 5, then it would send theLow Any V$SYSSTAT Indicationdescribed on 189.
enqueue waits:High:0
Tasks and built-in actionsNone
LoggingYou can log data for the properties of the managed resource listed in the followingtable. The table shows the context of the managed resource and the properties thatthe resource model logs for the IBM Tivoli Monitoring Web Health Console.
Chapter 2. Resource models 193
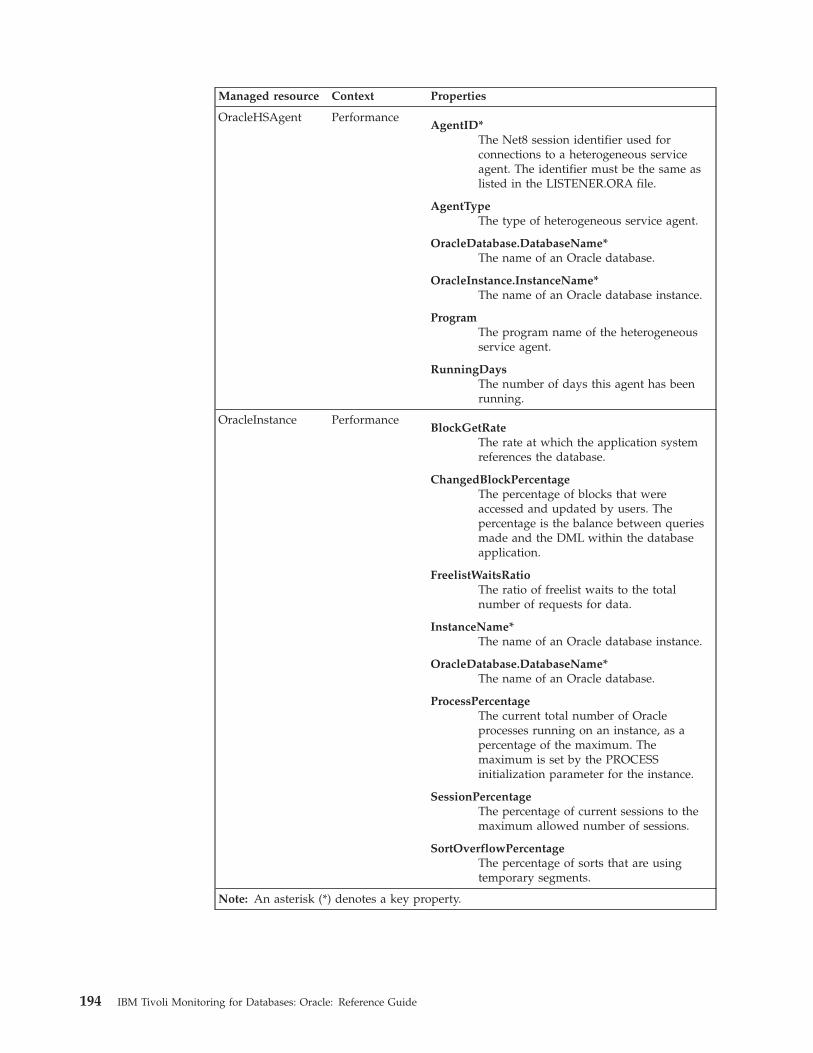
Managed resource Context Properties
OracleHSAgent PerformanceAgentID*
The Net8 session identifier used forconnections to a heterogeneous serviceagent. The identifier must be the same aslisted in the LISTENER.ORA file.
AgentTypeThe type of heterogeneous service agent.
OracleDatabase.DatabaseName*The name of an Oracle database.
OracleInstance.InstanceName*The name of an Oracle database instance.
ProgramThe program name of the heterogeneousservice agent.
RunningDaysThe number of days this agent has beenrunning.
OracleInstance PerformanceBlockGetRate
The rate at which the application systemreferences the database.
ChangedBlockPercentageThe percentage of blocks that wereaccessed and updated by users. Thepercentage is the balance between queriesmade and the DML within the databaseapplication.
FreelistWaitsRatioThe ratio of freelist waits to the totalnumber of requests for data.
InstanceName*The name of an Oracle database instance.
OracleDatabase.DatabaseName*The name of an Oracle database.
ProcessPercentageThe current total number of Oracleprocesses running on an instance, as apercentage of the maximum. Themaximum is set by the PROCESSinitialization parameter for the instance.
SessionPercentageThe percentage of current sessions to themaximum allowed number of sessions.
SortOverflowPercentageThe percentage of sorts that are usingtemporary segments.
Note: An asterisk (*) denotes a key property.
194 IBM Tivoli Monitoring for Databases: Oracle: Reference Guide

Return codesTable 2 on page 7 contains a listing of resource model return codes, theirdescription, and what action you can take to resolve each code. The return codenumber is displayed in the IBM Tivoli Monitoring Web Health Console status field,or by using the wdmlseng command.
CLI examplewdmeditprf -P OracleProfile#tme-region -add OracleOtherPerformance -c 1800 \-Log -LogDisable -p 12:00 -Agg no -ap 00:15 -NoMin -NoMax -Avg \-t Oracle_Maximum_ChangedBlockPercentage 20.000000 \-t Oracle_Maximum_FreelistWaitsRatio 2.000000 \-t Oracle_Maximum_OpenCursors 85.000000 \-t Oracle_Maximum_ProcessPercentage 90.000000 \-t Oracle_Maximum_SessionPercentage 90.000000 \-t Oracle_Maximum_SortOverflowPercentage 10.000000 \-t Oracle_Minimum_BlockGetRate 40.000000 \-AddPar HSAgentMetrics "strAgentType" \-AddPar HSAgentMetrics "strProgram" \-AddPar HSAgentMetrics "RunningDays" \-AddPar Oracle_HSAgent "MyHSAgent" \-DelPar Oracle_SysStat "enqueue waits:High:0" \-AddPar Oracle_SysStat "enqueue waits:High:1" \-AddPar InstanceMetrics "numBlockGetRate" \-AddPar InstanceMetrics "numChangedBlockPercentage" \-AddPar InstanceMetrics "numFreelistWaitsRatio" \-AddPar InstanceMetrics "numProcessPercentage" \-AddPar InstanceMetrics "numSessionPercentage" \-AddPar InstanceMetrics "numSortOverflowPercentage" \-e Oracle_High_SortOverflowPercentage \-o 1 -h 0 -severity CRITICAL -SendTBSM -SendTec \-e Oracle_High_OpenCursors \-o 1 -h 0 -severity CRITICAL -SendTBSM -SendTec \-e Oracle_Low_SysStat \-o 1 -h 0 -severity CRITICAL -SendTBSM -SendTec \-e Oracle_High_ProcessPercentage \-o 1 -h 0 -severity CRITICAL -SendTBSM -SendTec \-e Oracle_High_SysStat \-o 1 -h 0 -severity CRITICAL -SendTBSM -SendTec \-e Oracle_High_FreelistWaitsRatio \-o 1 -h 0 -severity CRITICAL -SendTBSM -SendTec \-e Oracle_Unavailable_HeterogeneousAgent \-o 1 -h 0 -severity CRITICAL -SendTBSM -SendTec \-e Oracle_Low_BlockGetRate \-o 1 -h 0 -severity CRITICAL -SendTBSM -SendTec \-e Oracle_High_ChangedBlockPercentage \-o 1 -h 0 -severity CRITICAL -SendTBSM -SendTec \-e Oracle_High_SessionPercentage \-o 1 -h 0 -severity CRITICAL -SendTBSM -SendTec
Chapter 2. Resource models 195

Other Storage
DescriptionMonitors the following information:v The percentage of rows retrieved that extend over more than one block, which is
called chained rowsv The number of chained rows calculated for a specified cluster in the endpoint
databasev The number of chained rows, calculated for a specified table in the endpoint
databasev The percentage of deleted rows from the user-specified index that have not been
repopulatedv The number of datafiles that can be added before the database reaches the
maximum number of datafiles allowed
To run this resource model, you must have a CHAINED_ROWS table to store theinformation on the chained rows. Create this table by running$ORACLE_HOME/rdbms/admin/utlchain.sql as the Oracle user SYS.
If the High Cluster Chained Rows metric shows that chaining is occurring for acluster, consider recreating the cluster with a larger SIZE parameter.
You can get rid of table chained rows in the following ways:v Use a copy-out/copy-in sequence for the chained rows. Use this if the total
number of chained rows is small in comparison to the total number of rows onthe table. See the following example.1. Create the CHAINED_ROWS table from the following Oracle script:
utlchain.sql2. ANALYZE TABLE INVOICES LIST CHAINED ROWS;3. SELECT OWNER_NAME, TABLE_NAME, HEAD_ROWID, ANALYZE_TIMESTAMP
FROM CHAINED_ROWSWHERE TABLE_NAME = ‘INVOICES’;
OWNER_NAME TABLE_NAME HEAD_ROWID ANALYZE_T-------------------- -------------------- ------------------ ---------ACCOUNTING INVOICES AAAHZkAABAAAMViAAA 21-AUG-02ACCOUNTING INVOICES AAAHZkAABAAAMViAAA 21-AUG-02ACCOUNTING INVOICES AAAHZkAABAAAMViAAB 21-AUG-02ACCOUNTING INVOICES AAAHZkAABAAAMViAAC 21-AUG-02ACCOUNTING INVOICES AAAHZkAABAAAMViAAD 21-AUG-02ACCOUNTING INVOICES AAAHZkAABAAAMViAAE 21-AUG-02ACCOUNTING INVOICES AAAHZkAABAAAMViAAF 21-AUG-02ACCOUNTING INVOICES AAAHZkAABAAAMViAAG 21-AUG-02ACCOUNTING INVOICES AAAHZkAABAAAMViAAH 21-AUG-02ACCOUNTING INVOICES AAAHZkAABAAAMViAAI 21-AUG-02ACCOUNTING INVOICES AAAHZkAABAAAMViAAJ 21-AUG-02
4. Create an intermediate table to hold the chained rowsCREATE TABLE INV_TEMP ASSELECT * FROM INVOICESWHERE ROWID IN
(SELECT HEAD_ROWIDFROM CHAINED_ROWSWHERE TABLE_NAME = ‘INVOICES’);
5. Delete the chained rows from the existing table.
196 IBM Tivoli Monitoring for Databases: Oracle: Reference Guide

DELETE FROM INVOICEWHERE ROWID IN
(SELECT HEAD_ROWIDFROM CHAINED_ROWSWHERE TABLE_NAME = ‘INVOICES’);
6. Typically, row chaining in tables is caused by inadequate PCTFREE valuefor each data block. If this is the case in your environment, increase thePCTFREE value for the table, such as in the following example:ALTER TABLE INVOICES PCTFREE <value>;
7. Insert the rows of the intermediate table into the existing table.INSERT INTO INVOICESSELECT * FROM INV_TEMP;
8. Drop the intermediate table.DROP TABLE INV_TEMP;
9. Clean out the CHAINED_ROWS table.DELETE FROM CHAINED_ROWSWHERE TABLE_NAME = ‘INVOICES’;
10. Repeat Step 1 to verify that the rows have been unchained.v Export the data, drop and re-create the table with a larger pctfree storage clause,
and then re-import the data. This is the most disruptive method of eliminatingchained rows, but it gives you a chance to adjust storage parameters. Use thismethod if there a considerable amount of chained rows.
Resource model overview
Internal name OracleOtherStorage
Category Oracle
Indications High Cluster Chained Rows occurs when the number ofchained rows for each cluster specified in the Clustersparameter exceeds the specified threshold.
High Cluster Key Ratio occurs when the cluster key ratioexceeds the specified threshold.
High Continued Row Percentage occurs when thecontinued row percentage exceeds the specified threshold.
High Percentage Deleted occurs when the percentage ofdeleted rows exceeds the specified threshold.
High Table Chained Rows occurs when the number of tablechained rows exceeds the specified threshold.
Low Number of Datafiles occurs when the number ofdatafiles is lower than the specified threshold.
Tasks and built-in actions None
Default cycle time 600 seconds
Target managed resourceOracleDatabaseManager, OracleInstanceManager
Indications and eventsThe following table summarizes the indications for this resource model, the eventsassociated with the indications, the default severity of the events, and where tofind a detailed description of the indication. The resource model generates anevent when the threshold you specify for the indication is triggered.
Chapter 2. Resource models 197

Indication Generated event Defaultseverity
Clearingevents
Page
High ClusterChainedRows
Oracle_High_ClusterChainedRows
Critical Yes 198
High ClusterKey Ratio
Oracle_High_ClusterKeyRatio
Critical Yes 199
HighContinuedRowPercentage
Oracle_High_ContinuedRowPercentage
Critical Yes 200
HighPercentageDeleted
Oracle_High_PercentageDeleted
Critical Yes 201
High TableChainedRows
Oracle_High_TableChainedRows
Critical Yes 202
Low Numberof Datafiles
Oracle_Low_NumberOfDatafiles
Critical Yes 203
High Cluster Chained Rows indicationOccurs when the number of chained rows for each cluster specified in the Clustersparameter exceeds the specified threshold. When the indication occurs oftenenough to trigger an event, the event delivers a message to the Tivoli EnterpriseConsole in the following format:<application_label>: The Number of Chained Rows for Oracle cluster<ClusterOwner>.<ClusterName> on Oracle database<DatabaseName> has crossed above the predefined threshold of<Threshold> chained rows and is currentlyat <ClusterChainedRows> chained rows.
If you have Tivoli Business Systems Manager configured for your system, TivoliEnterprise Console forwards the message to Tivoli Business Systems Manager.
You can check the health of this resource model in the IBM Tivoli Monitoring WebHealth Console. For more information, see the IBM Tivoli Monitoring Web HealthConsole documentation.
If this indication shows that chaining is occurring for a cluster, consider recreatingthe cluster with a larger SIZE parameter.
The indication has the following attributes:
ClusterChainedRowsThe number of chained rows calculated for a specified cluster.
ClusterNameThe name of the specified cluster.
ClusterOwnerThe username of the cluster owner.
This indication has the following thresholds:v Maximum Cluster Chained Rows
For more information about these thresholds, see “Thresholds” on page 204.
198 IBM Tivoli Monitoring for Databases: Oracle: Reference Guide

The following table describes the default settings for this indication.
Setting Default value
Send indications to Tivoli Enterprise Console Yes
Send indications to Tivoli Business SystemsManager
Yes
Occurrences 1
Holes 0
Associated tasks and built-in actions None
Note: If you have Tivoli Business Systems Manager configured for your systems,Tivoli Enterprise Console automatically forwards events to Tivoli BusinessSystems Manager. Do not change the configuration of the indication to sendevents to Tivoli Business Systems Manager.
High Cluster Key Ratio indicationOccurs when the cluster key ratio exceeds the specified threshold. When theindication occurs often enough to trigger an event, the event delivers a message tothe Tivoli Enterprise Console in the following format:<application_label>: The Cluster Key Ratio for Oracle instance<InstanceName> has crossed above the predefined threshold of<Threshold>-to-1 and is currently at<ClusterKeyRatio>-to-1.
If you have Tivoli Business Systems Manager configured for your system, TivoliEnterprise Console forwards the message to Tivoli Business Systems Manager.
You can check the health of this resource model in the IBM Tivoli Monitoring WebHealth Console. For more information, see the IBM Tivoli Monitoring Web HealthConsole documentation.
This indication indicates the ratio of cluster key scan block gets to cluster keyscans. If the ratio is greater than one, the rows for a cluster key are stored inmultiple data blocks. To analyze the cluster for row chaining, use the ClusterChained Rows metric.
The indication has the following attribute:
ClusterKeyRatioThe ratio of cluster key scan block gets to cluster key scans. If the ratio isgreater than one, the rows for a cluster key are stored in multiple datablocks.
This indication has the following thresholds:v Maximum Cluster Key Ratio
For more information about these thresholds, see “Thresholds” on page 204.
The following table describes the default settings for this indication.
Setting Default value
Send indications to Tivoli Enterprise Console Yes
Send indications to Tivoli Business SystemsManager
Yes
Chapter 2. Resource models 199

Setting Default value
Occurrences 1
Holes 0
Associated tasks and built-in actions None
Note: If you have Tivoli Business Systems Manager configured for your systems,Tivoli Enterprise Console automatically forwards events to Tivoli BusinessSystems Manager. Do not change the configuration of the indication to sendevents to Tivoli Business Systems Manager.
High Continued Row Percentage indicationOccurs when the continued row percentage exceeds the specified threshold. Whenthe indication occurs often enough to trigger an event, the event delivers amessage to the Tivoli Enterprise Console in the following format:<application_label>: The Continued Row Percentage for Oracle instance<InstanceName> has crossed above the predefined threshold of <Threshold>percent and is currently at <ContinuedRowPercentage> percent.
If you have Tivoli Business Systems Manager configured for your system, TivoliEnterprise Console forwards the message to Tivoli Business Systems Manager.
You can check the health of this resource model in the IBM Tivoli Monitoring WebHealth Console. For more information, see the IBM Tivoli Monitoring Web HealthConsole documentation.
Indicates the percentage of rows retrieved that extend over more than one block,which is called chained rows.
If the indication reports a percentage that is steadily increasing over time, identifywhich tables are experiencing chaining and increase the PCTFREE for these tables.A row is recorded as chained only if the access is performed by RowID. Full tablescans of tables that contain chained rows do not cause the V$SYSSTAT statistictable fetch continued row to increase.
The indication has the following attributes:
ContinuedRowPercentageThe percentage of rows retrieved that extend over more than one block,which is called chained rows. The percentage should be close to 0, exceptin applications that have long columns, or rows that are larger than oneblock (spanned rows), where chaining is unavoidable.
This indication has the following thresholds:v Maximum Continued Row Percentage
For more information about these thresholds, see “Thresholds” on page 204.
The following table describes the default settings for this indication.
Setting Default value
Send indications to Tivoli Enterprise Console Yes
Send indications to Tivoli Business SystemsManager
Yes
Occurrences 1
200 IBM Tivoli Monitoring for Databases: Oracle: Reference Guide

Setting Default value
Holes 0
Associated tasks and built-in actions None
Note: If you have Tivoli Business Systems Manager configured for your systems,Tivoli Enterprise Console automatically forwards events to Tivoli BusinessSystems Manager. Do not change the configuration of the indication to sendevents to Tivoli Business Systems Manager.
High Percentage Deleted indicationOccurs when the percentage of deleted rows exceeds the specified threshold. Whenthe indication occurs often enough to trigger an event, the event delivers amessage to the Tivoli Enterprise Console in the following format:<application_label>: The Percentage Deleted for Oracle index<IndexOwner>.<IndexName> on Oracle database<DatabaseName> has crossed above the predefined thresholdof <Threshold> percent and is currently at<PercentageDeleted> percent.
If you have Tivoli Business Systems Manager configured for your system, TivoliEnterprise Console forwards the message to Tivoli Business Systems Manager.
You can check the health of this resource model in the IBM Tivoli Monitoring WebHealth Console. For more information, see the IBM Tivoli Monitoring Web HealthConsole documentation.
Indicates the percentage of deleted rows from each index specified in the Indexesparameter that have not been repopulated. The percentage of space used by anindex determines if it needs to be rebuilt or coalesced. To prevent uneven growthof indexes, run this resource model on indexes with rows that are inserted anddeleted frequently.
The indication has the following attributes:
IndexNameThe name of the index.
IndexOwnerThe username of the index owner.
PercentageDeletedThe percentage of deleted rows from the user-specified index. Deletedrows include rows that have not been repopulated.
This indication has the following thresholds:v Maximum Percentage Deleted
For more information about these thresholds, see “Thresholds” on page 204.
The following table describes the default settings for this indication.
Setting Default value
Send indications to Tivoli Enterprise Console Yes
Send indications to Tivoli Business SystemsManager
Yes
Occurrences 1
Chapter 2. Resource models 201
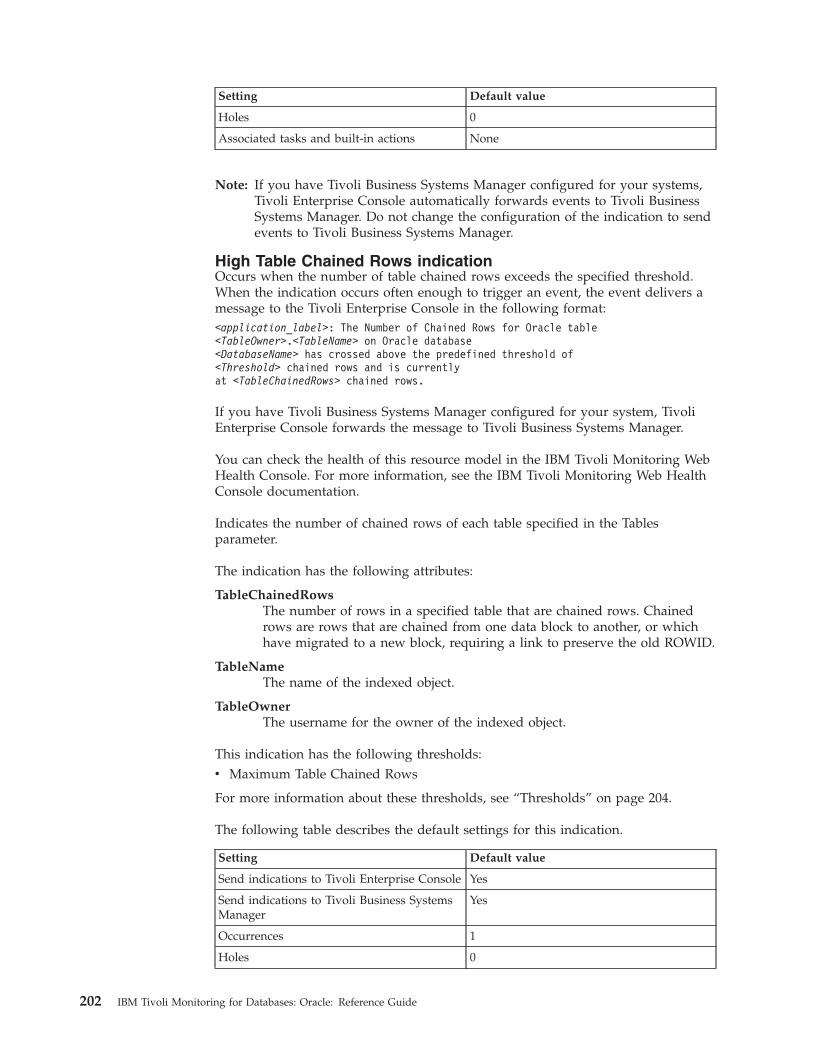
Setting Default value
Holes 0
Associated tasks and built-in actions None
Note: If you have Tivoli Business Systems Manager configured for your systems,Tivoli Enterprise Console automatically forwards events to Tivoli BusinessSystems Manager. Do not change the configuration of the indication to sendevents to Tivoli Business Systems Manager.
High Table Chained Rows indicationOccurs when the number of table chained rows exceeds the specified threshold.When the indication occurs often enough to trigger an event, the event delivers amessage to the Tivoli Enterprise Console in the following format:<application_label>: The Number of Chained Rows for Oracle table<TableOwner>.<TableName> on Oracle database<DatabaseName> has crossed above the predefined threshold of<Threshold> chained rows and is currentlyat <TableChainedRows> chained rows.
If you have Tivoli Business Systems Manager configured for your system, TivoliEnterprise Console forwards the message to Tivoli Business Systems Manager.
You can check the health of this resource model in the IBM Tivoli Monitoring WebHealth Console. For more information, see the IBM Tivoli Monitoring Web HealthConsole documentation.
Indicates the number of chained rows of each table specified in the Tablesparameter.
The indication has the following attributes:
TableChainedRowsThe number of rows in a specified table that are chained rows. Chainedrows are rows that are chained from one data block to another, or whichhave migrated to a new block, requiring a link to preserve the old ROWID.
TableNameThe name of the indexed object.
TableOwnerThe username for the owner of the indexed object.
This indication has the following thresholds:v Maximum Table Chained Rows
For more information about these thresholds, see “Thresholds” on page 204.
The following table describes the default settings for this indication.
Setting Default value
Send indications to Tivoli Enterprise Console Yes
Send indications to Tivoli Business SystemsManager
Yes
Occurrences 1
Holes 0
202 IBM Tivoli Monitoring for Databases: Oracle: Reference Guide
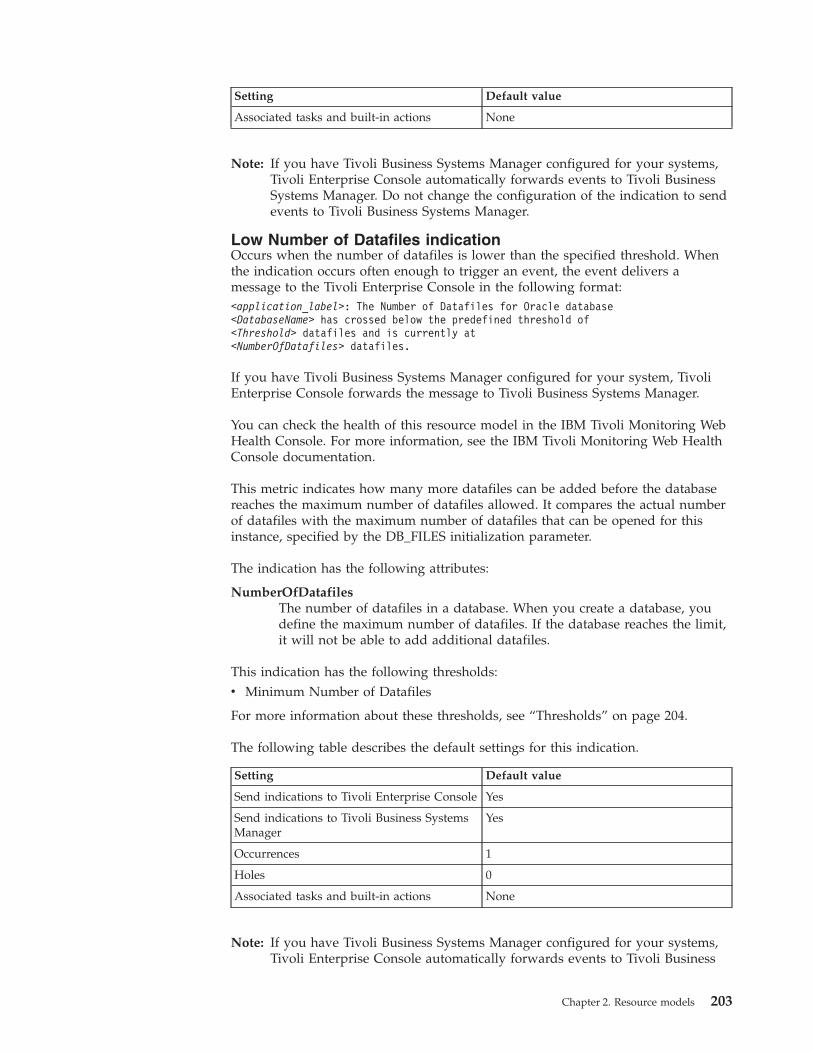
Setting Default value
Associated tasks and built-in actions None
Note: If you have Tivoli Business Systems Manager configured for your systems,Tivoli Enterprise Console automatically forwards events to Tivoli BusinessSystems Manager. Do not change the configuration of the indication to sendevents to Tivoli Business Systems Manager.
Low Number of Datafiles indicationOccurs when the number of datafiles is lower than the specified threshold. Whenthe indication occurs often enough to trigger an event, the event delivers amessage to the Tivoli Enterprise Console in the following format:<application_label>: The Number of Datafiles for Oracle database<DatabaseName> has crossed below the predefined threshold of<Threshold> datafiles and is currently at<NumberOfDatafiles> datafiles.
If you have Tivoli Business Systems Manager configured for your system, TivoliEnterprise Console forwards the message to Tivoli Business Systems Manager.
You can check the health of this resource model in the IBM Tivoli Monitoring WebHealth Console. For more information, see the IBM Tivoli Monitoring Web HealthConsole documentation.
This metric indicates how many more datafiles can be added before the databasereaches the maximum number of datafiles allowed. It compares the actual numberof datafiles with the maximum number of datafiles that can be opened for thisinstance, specified by the DB_FILES initialization parameter.
The indication has the following attributes:
NumberOfDatafilesThe number of datafiles in a database. When you create a database, youdefine the maximum number of datafiles. If the database reaches the limit,it will not be able to add additional datafiles.
This indication has the following thresholds:v Minimum Number of Datafiles
For more information about these thresholds, see “Thresholds” on page 204.
The following table describes the default settings for this indication.
Setting Default value
Send indications to Tivoli Enterprise Console Yes
Send indications to Tivoli Business SystemsManager
Yes
Occurrences 1
Holes 0
Associated tasks and built-in actions None
Note: If you have Tivoli Business Systems Manager configured for your systems,Tivoli Enterprise Console automatically forwards events to Tivoli Business
Chapter 2. Resource models 203

Systems Manager. Do not change the configuration of the indication to sendevents to Tivoli Business Systems Manager.
ThresholdsThe following table lists the thresholds that can be set for the Other Storageresource model. For each threshold it shows the name, a short description, and thedefault value:
Threshold Description Defaultvalue
Maximum ClusterChained Rows
An indication occurs if the cluster-chained rowsexceeds this value.
5
Maximum Cluster KeyRatio
An indication occurs if the cluster key ratioexceeds this value.
1
Maximum ContinuedRow Percentage
An indication occurs if the continued rowpercentage exceeds this value.
50
Maximum PercentageDeleted
An indication occurs if the percentage deletedexceeds this value.
50
Maximum Table ChainedRows
An indication occurs if the table-chained rowsexceeds this value.
5
Minimum Number ofDatafiles
An indication occurs if the number of datafiles islesser than this value.
100
Parameters
Note: A plus symbol (+) denotes parameters that feature selective logging.Selective logging enables you to choose metrics/properties that you want tolog. The selective logging metrics are listed in the value field of theParameters window.
The following table lists the parameters that can be set for the Other Storageresource model. The table shows the name, a short description, and the defaultvalue for each parameter:
Parameter Description Default value
Cluster ChainingMetrics +
Select the metrics you want to log. See thefollowing logging table for a description ofeach metric.
Chained Rows
Clusters The clusters to monitor for the ClusterChained Rows indication. Format:owner.cluster_name.
None
Database StorageMetrics +
Select the metrics you want to log. See thefollowing logging table for a description ofeach metric.
Number ofDatafiles
Index Storage Metrics+
Select the metrics you want to log. See thefollowing logging table for a description ofeach metric.
Percentage Deleted
Indexes The indexes to monitor for the PercentageDeleted indication. Format:owner.index_name.
None
204 IBM Tivoli Monitoring for Databases: Oracle: Reference Guide

Parameter Description Default value
Instance ChainingMetrics +
Select the metrics you want to log. See thefollowing logging table for a description ofeach metric.
Continued RowPercentage
Instance PerformanceMetrics +
Select the metrics you want to log. See thefollowing logging table for a description ofeach metric.
Cluster Key Ratio
Table Chaining Metrics+
Select the metrics you want to log. See thefollowing logging table for a description ofeach metric.
Chained Rows
Tables The tables to monitor for the Table ChainedRows indication. Format: owner.table_name.
None
Tasks and built-in actionsNone
LoggingYou can log data for the properties of the managed resource listed in the followingtable. The table shows the context of the managed resource and the properties thatthe resource model logs for the IBM Tivoli Monitoring Web Health Console.
Managed resource Context Properties
OracleCluster ChainingChainedRows
The number of rows in a specified table thatare chained rows. Chained rows are rowsthat are chained from one data block toanother, or which have migrated to a newblock, requiring a link to preserve the oldROWID.
ClusterName*The name of the specified cluster.
ClusterOwner*The username of the cluster owner.
OracleDatabase.DatabaseName*The name of an Oracle database.
OracleTablespace.TablespaceName*The name of the tablespace containing thespecified table. NULL appears forpartitioned, temporary and index-organizedtables.
Chapter 2. Resource models 205

Managed resource Context Properties
OracleTable ChainingChainedRows
The number of rows in a specified table thatare chained rows. Chained rows are rowsthat are chained from one data block toanother, or which have migrated to a newblock, requiring a link to preserve the oldROWID.
TableName*The name of the specified table.
TableOwner*The username of the table owner.
OracleDatabase.DatabaseName*The name of an Oracle database.
OracleTablespace.TablespaceName*The name of the tablespace that contains thissegment.
OracleInstance ChainingContinuedRowPercentage
The percentage of rows retrieved that extendover more than one block, which is calledchained rows. The percentage should beclose to 0, except in applications that havelong columns, or rows that are larger thanone block (spanned rows), where chaining isunavoidable.
InstanceName*The name of an Oracle database instance.
OracleDatabase.DatabaseName*The name of an Oracle database.
OracleInstance PerformanceClusterKeyRatio
The ratio of cluster key scan block gets tocluster key scans. If the ratio is greater thanone, the rows for a cluster key are stored inmultiple data blocks.
InstanceName*The name of an Oracle database instance.
OracleDatabase.DatabaseName*The name of an Oracle database.
206 IBM Tivoli Monitoring for Databases: Oracle: Reference Guide
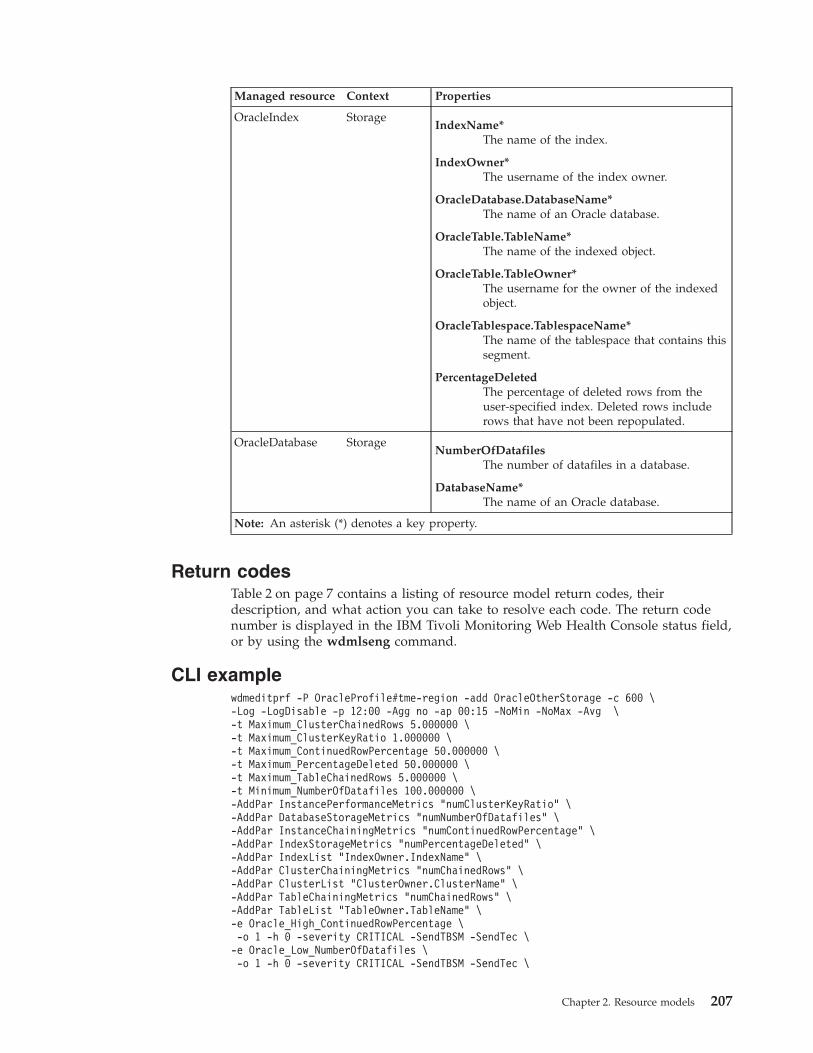
Managed resource Context Properties
OracleIndex StorageIndexName*
The name of the index.
IndexOwner*The username of the index owner.
OracleDatabase.DatabaseName*The name of an Oracle database.
OracleTable.TableName*The name of the indexed object.
OracleTable.TableOwner*The username for the owner of the indexedobject.
OracleTablespace.TablespaceName*The name of the tablespace that contains thissegment.
PercentageDeletedThe percentage of deleted rows from theuser-specified index. Deleted rows includerows that have not been repopulated.
OracleDatabase StorageNumberOfDatafiles
The number of datafiles in a database.
DatabaseName*The name of an Oracle database.
Note: An asterisk (*) denotes a key property.
Return codesTable 2 on page 7 contains a listing of resource model return codes, theirdescription, and what action you can take to resolve each code. The return codenumber is displayed in the IBM Tivoli Monitoring Web Health Console status field,or by using the wdmlseng command.
CLI examplewdmeditprf -P OracleProfile#tme-region -add OracleOtherStorage -c 600 \-Log -LogDisable -p 12:00 -Agg no -ap 00:15 -NoMin -NoMax -Avg \-t Maximum_ClusterChainedRows 5.000000 \-t Maximum_ClusterKeyRatio 1.000000 \-t Maximum_ContinuedRowPercentage 50.000000 \-t Maximum_PercentageDeleted 50.000000 \-t Maximum_TableChainedRows 5.000000 \-t Minimum_NumberOfDatafiles 100.000000 \-AddPar InstancePerformanceMetrics "numClusterKeyRatio" \-AddPar DatabaseStorageMetrics "numNumberOfDatafiles" \-AddPar InstanceChainingMetrics "numContinuedRowPercentage" \-AddPar IndexStorageMetrics "numPercentageDeleted" \-AddPar IndexList "IndexOwner.IndexName" \-AddPar ClusterChainingMetrics "numChainedRows" \-AddPar ClusterList "ClusterOwner.ClusterName" \-AddPar TableChainingMetrics "numChainedRows" \-AddPar TableList "TableOwner.TableName" \-e Oracle_High_ContinuedRowPercentage \-o 1 -h 0 -severity CRITICAL -SendTBSM -SendTec \-e Oracle_Low_NumberOfDatafiles \-o 1 -h 0 -severity CRITICAL -SendTBSM -SendTec \
Chapter 2. Resource models 207

-e Oracle_High_TableChainedRows \-o 1 -h 0 -severity CRITICAL -SendTBSM -SendTec \-e Oracle_High_PercentageDeleted \-o 1 -h 0 -severity CRITICAL -SendTBSM -SendTec \-e Oracle_High_ClusterChainedRows \-o 1 -h 0 -severity CRITICAL -SendTBSM -SendTec \-e Oracle_High_ClusterKeyRatio \-o 1 -h 0 -severity CRITICAL -SendTBSM -SendTec
208 IBM Tivoli Monitoring for Databases: Oracle: Reference Guide

PGA
Description
Note: This resource model is applicable for Oracle 9i only.
Monitors the following in the program global area:v Multipass Executions — the total number of work areas executed with
multi-pass memory size.v Optimal Percentage — the percentage of work areas executed with optimal
memory size.v Work Area Percentage — the percentage of program global area memory that is
available for work areas after other components of the database have allocated.v Work Area Max Size — the maximum size of a memory work area executed in
AUTO mode.v Component Area — the amount of memory consumed by consumers of
program global area memory other than for auto workareas.
In order for the PGA resource model to run properly, theWORKAREA_SIZE_POLICY initialization parameter must be set to ″Auto.″ Youcan set this value on a running database by typing the following SQL commands:alter system set pga_aggregate_target = <size>;alter system set workarea_size_policy = auto;
The program global area, or PGA, is a nonshared memory region that contains dataand control information for a server process. Oracle creates a program global areawhenever a server process starts. The program global area memory allocated foractive work areas is automatically derived from the PGA_AGGREGATE_TARGETinitialization parameter. Oracle honors the PGA_AGGREGATE_TARGET limit setby the DBA to control the amount of program global area memory allotted to SQLwork areas. Oracle also maximizes the number of work areas that are using anoptimal amount of program global area memory (cache memory) to maximize theperformance of all the memory-intensive SQL operators. The remaining work areasare executed in one-pass mode, unless the program global area memory limit is solow that multi-pass execution is required to further reduce the use of programglobal area memory and honor the program global area target limit.
The work area is an area of memory used to perform data work such as sorts, orhash joins. You can control and tune the size of a work area. Large work areasimprove the performance of a particular operator at the cost of higher memoryconsumption. The size of a work area should be large enough to accommodate theinput data and auxiliary memory structures allocated by the corresponding SQLoperator. This size is known as the optimal size of a work area. The optimalpercentage shows the percentage in which the work area ran in optimal mode. Awork area runs in optimal mode when it executes operations completely inmemory.
When the work area size is too small for the input data size, multiple passes overthe input data are needed, also called multipass executions. Multipass executionsincrease the response time of the operator and degrade performance. Avoidmultipass executions by configuring your system with a reasonable amount ofprogram global area memory. You should strive to have most work areas runningwith an optimal size, and a smaller number of them running with a one-pass size.Multipass executions should be avoided.
Chapter 2. Resource models 209

Resource model overview
Internal name OraclePGA
Category Oracle
Indications High PGA Multipass Executions occurs when the numberof multipass executions exceeds the specified threshold.
High PGA Optimal Percentage occurs when the programglobal area optimal percentage exceeds the specifiedthreshold.
Low PGA Component Area occurs when the programglobal area component area is less than the specifiedthreshold.
Low PGA Work Area Max Size occurs when the maximumsize for a work area in the program global area exceeds thespecified threshold.
Low PGA Work Area Percentage occurs when thepercentage of PGA memory in work areas is lower than thespecified threshold.
Tasks and built-in actions None
Default cycle time 1800 seconds
Target managed resourceOracleDatabaseManager, OracleInstanceManager
Indications and eventsThe following table summarizes the indications for this resource model, the eventsassociated with the indications, the default severity of the events, and where tofind a detailed description of the indication. The resource model generates anevent when the threshold you specify for the indication is triggered.
Indication Generated event Defaultseverity
Clearingevents
Page
High PGAMultipassExecutions
Oracle_High_PGAMultipassExecutions
Critical Yes 211
High PGAOptimalPercentage
Oracle_High_PGAOptimalPercentage
Critical Yes 212
Low PGAComponentArea
Oracle_Low_PGAComponentArea
Critical Yes 213
Low PGAWork AreaMax Size
Oracle_Low_PGAWorkAreaMaxSize
Critical Yes 214
Low PGAWork AreaPercentage
Oracle_Low_PGAWorkAreaPercentage
Critical Yes 215
210 IBM Tivoli Monitoring for Databases: Oracle: Reference Guide

High PGA Multipass Executions indicationOccurs when the number of multipass executions exceeds the specified threshold.When the indication occurs often enough to trigger an event, the event delivers amessage to the Tivoli Enterprise Console in the following format:<application_label>: The PGA multipass executions for Oracleinstance <InstanceName> has crossed above the predefined thresholdof <Threshold> executions and is currentlyat <PGAMultipassExecutions> executions.
If you have Tivoli Business Systems Manager configured for your system, TivoliEnterprise Console forwards the message to Tivoli Business Systems Manager.
You can check the health of this resource model in the IBM Tivoli Monitoring WebHealth Console. For more information, see the IBM Tivoli Monitoring Web HealthConsole documentation.
If the number of multipass executions is high, consider increasing the value of thePGA_AGGREGATE_TARGET parameter. Also consider increasing the value ofPGA_AGGREGATE_TARGET when the percentage of one-pass executions is highcompared to optimal. If the percentage of optimal work area is 100%, considerreducing PGA_AGGREGATE_TARGET.
The indication has the following attributes:
DatabaseNameThe name of an Oracle database. The database name contains up to 8characters and corresponds to the name specified in the CREATEDATABASE statement and identified in the DB_NAME parameter in thedatabase initialization parameter file.
InstanceNameThe name of an Oracle database instance. The instance name is identifiedby the INSTANCE_NAME parameter in the database initializationparameter file and corresponds to the Oracle System Identifier (SID) of theinstance.
PGAMultipassExecutionsTotal number of work areas executed with multi-pass memory size.
This indication has the following thresholds:v Maximum PGA Multipass Executions
For more information about these thresholds, see “Thresholds” on page 216.
The following table describes the default settings for this indication.
Setting Default value
Send indications to Tivoli Enterprise Console Yes
Send indications to Tivoli Business SystemsManager
Yes
Occurrences 1
Holes 0
Associated tasks and built-in actions None
Note: If you have Tivoli Business Systems Manager configured for your systems,Tivoli Enterprise Console automatically forwards events to Tivoli Business
Chapter 2. Resource models 211
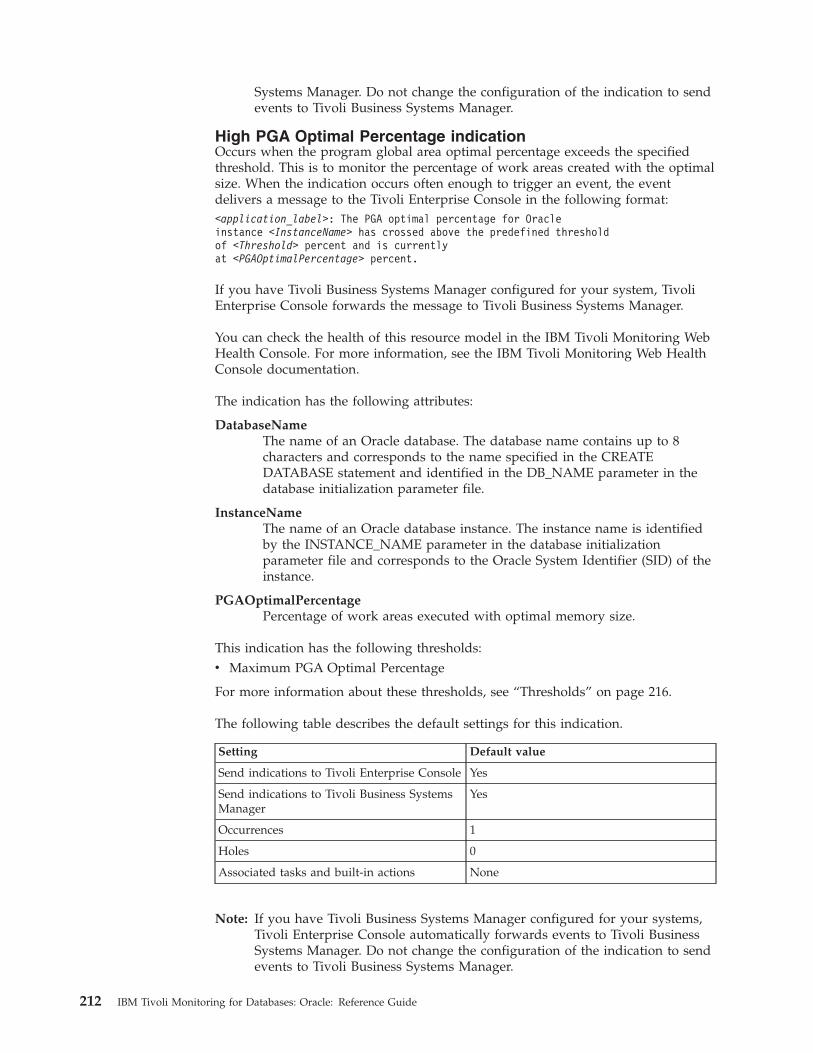
Systems Manager. Do not change the configuration of the indication to sendevents to Tivoli Business Systems Manager.
High PGA Optimal Percentage indicationOccurs when the program global area optimal percentage exceeds the specifiedthreshold. This is to monitor the percentage of work areas created with the optimalsize. When the indication occurs often enough to trigger an event, the eventdelivers a message to the Tivoli Enterprise Console in the following format:<application_label>: The PGA optimal percentage for Oracleinstance <InstanceName> has crossed above the predefined thresholdof <Threshold> percent and is currentlyat <PGAOptimalPercentage> percent.
If you have Tivoli Business Systems Manager configured for your system, TivoliEnterprise Console forwards the message to Tivoli Business Systems Manager.
You can check the health of this resource model in the IBM Tivoli Monitoring WebHealth Console. For more information, see the IBM Tivoli Monitoring Web HealthConsole documentation.
The indication has the following attributes:
DatabaseNameThe name of an Oracle database. The database name contains up to 8characters and corresponds to the name specified in the CREATEDATABASE statement and identified in the DB_NAME parameter in thedatabase initialization parameter file.
InstanceNameThe name of an Oracle database instance. The instance name is identifiedby the INSTANCE_NAME parameter in the database initializationparameter file and corresponds to the Oracle System Identifier (SID) of theinstance.
PGAOptimalPercentagePercentage of work areas executed with optimal memory size.
This indication has the following thresholds:v Maximum PGA Optimal Percentage
For more information about these thresholds, see “Thresholds” on page 216.
The following table describes the default settings for this indication.
Setting Default value
Send indications to Tivoli Enterprise Console Yes
Send indications to Tivoli Business SystemsManager
Yes
Occurrences 1
Holes 0
Associated tasks and built-in actions None
Note: If you have Tivoli Business Systems Manager configured for your systems,Tivoli Enterprise Console automatically forwards events to Tivoli BusinessSystems Manager. Do not change the configuration of the indication to sendevents to Tivoli Business Systems Manager.
212 IBM Tivoli Monitoring for Databases: Oracle: Reference Guide
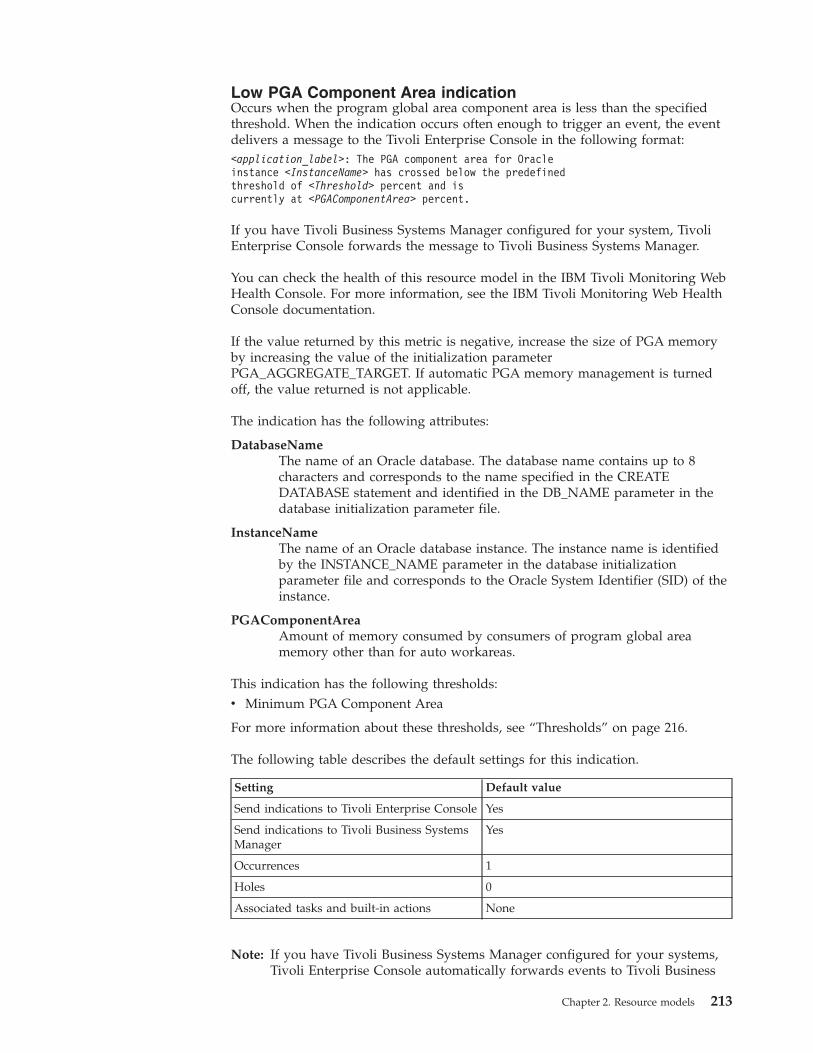
Low PGA Component Area indicationOccurs when the program global area component area is less than the specifiedthreshold. When the indication occurs often enough to trigger an event, the eventdelivers a message to the Tivoli Enterprise Console in the following format:<application_label>: The PGA component area for Oracleinstance <InstanceName> has crossed below the predefinedthreshold of <Threshold> percent and iscurrently at <PGAComponentArea> percent.
If you have Tivoli Business Systems Manager configured for your system, TivoliEnterprise Console forwards the message to Tivoli Business Systems Manager.
You can check the health of this resource model in the IBM Tivoli Monitoring WebHealth Console. For more information, see the IBM Tivoli Monitoring Web HealthConsole documentation.
If the value returned by this metric is negative, increase the size of PGA memoryby increasing the value of the initialization parameterPGA_AGGREGATE_TARGET. If automatic PGA memory management is turnedoff, the value returned is not applicable.
The indication has the following attributes:
DatabaseNameThe name of an Oracle database. The database name contains up to 8characters and corresponds to the name specified in the CREATEDATABASE statement and identified in the DB_NAME parameter in thedatabase initialization parameter file.
InstanceNameThe name of an Oracle database instance. The instance name is identifiedby the INSTANCE_NAME parameter in the database initializationparameter file and corresponds to the Oracle System Identifier (SID) of theinstance.
PGAComponentAreaAmount of memory consumed by consumers of program global areamemory other than for auto workareas.
This indication has the following thresholds:v Minimum PGA Component Area
For more information about these thresholds, see “Thresholds” on page 216.
The following table describes the default settings for this indication.
Setting Default value
Send indications to Tivoli Enterprise Console Yes
Send indications to Tivoli Business SystemsManager
Yes
Occurrences 1
Holes 0
Associated tasks and built-in actions None
Note: If you have Tivoli Business Systems Manager configured for your systems,Tivoli Enterprise Console automatically forwards events to Tivoli Business
Chapter 2. Resource models 213

Systems Manager. Do not change the configuration of the indication to sendevents to Tivoli Business Systems Manager.
Low PGA Work Area Max Size indicationOccurs when the maximum size for a work area in the program global area fallsbelow the specified threshold. When the indication occurs often enough to triggeran event, the event delivers a message to the Tivoli Enterprise Console in thefollowing format:<application_label>: The PGA work area max size for Oracle instance<InstanceName> has crossed below the predefined threshold of<Threshold> KB and is currently at <PGAWorkAreaMaxSize> KB.
If you have Tivoli Business Systems Manager configured for your system, TivoliEnterprise Console forwards the message to Tivoli Business Systems Manager.
You can check the health of this resource model in the IBM Tivoli Monitoring WebHealth Console. For more information, see the IBM Tivoli Monitoring Web HealthConsole documentation.
If the value returned by this monitor falls below one megabyte, increase the size ofPGA memory by increasing the value of the initialization parameterPGA_AGGREGATE_TARGET.
The indication has the following attributes:
DatabaseNameThe name of an Oracle database. The database name contains up to 8characters and corresponds to the name specified in the CREATEDATABASE statement and identified in the DB_NAME parameter in thedatabase initialization parameter file.
InstanceNameThe name of an Oracle database instance. The instance name is identifiedby the INSTANCE_NAME parameter in the database initializationparameter file and corresponds to the Oracle System Identifier (SID) of theinstance.
PGAWorkAreaMaxSizeThe maximum size of a work area that is executed in AUTO mode.
This indication has the following thresholds:v Minimum PGA Work Area Max Size
For more information about these thresholds, see “Thresholds” on page 216.
The following table describes the default settings for this indication.
Setting Default value
Send indications to Tivoli Enterprise Console Yes
Send indications to Tivoli Business SystemsManager
Yes
Occurrences 1
Holes 0
Associated tasks and built-in actions None
214 IBM Tivoli Monitoring for Databases: Oracle: Reference Guide

Note: If you have Tivoli Business Systems Manager configured for your systems,Tivoli Enterprise Console automatically forwards events to Tivoli BusinessSystems Manager. Do not change the configuration of the indication to sendevents to Tivoli Business Systems Manager.
Low PGA Work Area Percentage indicationOccurs when the percentage of PGA memory in work areas is lower than thespecified threshold. This indication returns the percentage of PGA memory that isavailable for work areas after other components of the database have allocatedtheir area of PGA memory. When the indication occurs often enough to trigger anevent, the event delivers a message to the Tivoli Enterprise Console in thefollowing format:<application_label>: The PGA work area percentage for Oracleinstance <InstanceName> has crossed below the predefined thresholdof <Threshold> percent and is currentlyat <PGAWorkAreaPercentage> percent.
If you have Tivoli Business Systems Manager configured for your system, TivoliEnterprise Console forwards the message to Tivoli Business Systems Manager.
You can check the health of this resource model in the IBM Tivoli Monitoring WebHealth Console. For more information, see the IBM Tivoli Monitoring Web HealthConsole documentation.
The indication has the following attributes:
DatabaseNameThe name of an Oracle database. The database name contains up to 8characters and corresponds to the name specified in the CREATEDATABASE statement and identified in the DB_NAME parameter in thedatabase initialization parameter file.
InstanceNameThe name of an Oracle database instance. The instance name is identifiedby the INSTANCE_NAME parameter in the database initializationparameter file and corresponds to the Oracle System Identifier (SID) of theinstance.
PGAWorkAreaPercentageThe percentage of program global area memory that is available for workareas after other components of the database have allocated their area ofprogram global area memory.
This indication has the following thresholds:v Minimum PGA Work Area Percentage
For more information about these thresholds, see “Thresholds” on page 216.
The following table describes the default settings for this indication.
Setting Default value
Send indications to Tivoli Enterprise Console Yes
Send indications to Tivoli Business SystemsManager
Yes
Occurrences 1
Holes 0
Associated tasks and built-in actions None
Chapter 2. Resource models 215

Note: If you have Tivoli Business Systems Manager configured for your systems,Tivoli Enterprise Console automatically forwards events to Tivoli BusinessSystems Manager. Do not change the configuration of the indication to sendevents to Tivoli Business Systems Manager.
ThresholdsThe following table lists the thresholds that can be set for the PGA resource model.For each threshold it shows the name, a short description, and the default value:
Threshold Description Defaultvalue
Maximum PGAMultipass Executions
An indication occurs if the PGA multi-passexecution number exceeds this value.
0
Maximum PGA OptimalPercentage
An indication occurs if the PGA optimalpercentage exceeds this value.
99
Minimum PGAComponent Area
An indication occurs if the PGA component areais less than this value.
0
Minimum PGA WorkArea Max Size
An indication occurs if the PGA work areamaximum size is less than this value.
1024
Minimum PGA WorkArea Percentage
An indication occurs if the PGA work areapercentage exceeds this value.
40
Parameters
Note: A plus symbol (+) denotes parameters that feature selective logging.Selective logging enables you to choose metrics/properties that you want tolog. The selective logging metrics are listed in the value field of theParameters window.
The following table lists the parameters that can be set for the PGA resourcemodel. The table shows the name, a short description, and the default value foreach parameter:
Parameter Description Default value
Instance Metrics + Select the metrics you want to log.See the following logging table for adescription of each metric.
PGA Component Area
PGA Multipass Executions
PGA Optimal Percentage
PGA Work Area Percentage
PGA Work Area Max Size
Tasks and built-in actionsNone
LoggingYou can log data for the properties of the managed resource listed in the followingtable. The table shows the context of the managed resource and the properties thatthe resource model logs for the IBM Tivoli Monitoring Web Health Console.
216 IBM Tivoli Monitoring for Databases: Oracle: Reference Guide

Managed resource Context Properties
OracleInstance MemoryInstanceName*
The name of an Oracle database instance.
OracleDatabase.DatabaseName*The name of an Oracle database.
PGAComponentAreaAmount of memory consumed by consumers ofprogram global area memory other than forauto work areas.
PGAMultipassExecutionsTotal number of work areas executed withmulti-pass memory size.
PGAOptimalPercentagePercentage of work areas executed with optimalmemory size.
PGAWorkAreaMaxSizeThe maximum size of a work area that isexecuted in AUTO mode.
PGAWorkAreaPercentageThe percentage of program global area memorythat is available for work areas after othercomponents of the database have allocated theirarea of program global area memory.
Note: An asterisk (*) denotes a key property.
Return codesTable 2 on page 7 contains a listing of resource model return codes, theirdescription, and what action you can take to resolve each code. The return codenumber is displayed in the IBM Tivoli Monitoring Web Health Console status field,or by using the wdmlseng command.
CLI examplewdmeditprf -P OracleProfile#tme-region -add OraclePGA -c 1800 \-Log -LogDisable -p 12:00 -Agg no -ap 00:15 -NoMin -NoMax -Avg \-t Oracle_Maximum_PGAMultipassExecutions 0.000000 \-t Oracle_Maximum_PGAOptimalPercentage 99.000000 \-t Oracle_Maximum_PGAWorkAreaPercentage 0.000000 \-t Oracle_Minimum_PGAComponentArea 0.000000 \-t Oracle_Minimum_PGAWorkAreaMaxSize 1024.000000 \-AddPar InstanceMetrics "PGAMultipassExecutions" \-AddPar InstanceMetrics "PGAOptimalPercentage" \-AddPar InstanceMetrics "PGAWorkAreaPercentage" \-AddPar InstanceMetrics "PGAWorkAreaMaxSize" \-AddPar InstanceMetrics "PGAComponentArea" \-e Oracle_Low_PGAComponentArea \-o 1 -h 0 -severity CRITICAL -SendTBSM -SendTec \-e Oracle_Low_PGAWorkAreaMaxSize \-o 1 -h 0 -severity CRITICAL -SendTBSM -SendTec \-e Oracle_High_PGAOptimalPercentage \-o 1 -h 0 -severity CRITICAL -SendTBSM -SendTec \-e Oracle_High_PGAMultipassExecutions \-o 1 -h 0 -severity CRITICAL -SendTBSM -SendTec \-e Oracle_High_PGAWorkAreaPercentage \-o 1 -h 0 -severity CRITICAL -SendTBSM -SendTec
Chapter 2. Resource models 217

Process State
DescriptionMonitors the state of Oracle specific processes. States returned include: Low orUnavailable.
Processes are divided into two main groups, user processes and Oracle processes.User processes occur when a user runs an application program or an Oracle tool.Oracle processes execute Oracle server code. This resource model examines the statesof Oracle processes.
Oracle processes are made up of two groups, server processes and backgroundprocesses. Server processes communicate between the user and Oracle server tocarry out requests of the user. Background processes combine functions that wouldotherwise be handled by multiple Oracle programs running for each user process.Each instance runs at least four background processes (DBWR, LGWR, SMON, andPMON), but there can be a number of additional background processes.
This resource model monitors the following processes:
ARCn Copies online redo log files to archival storage when the files are full or alog switch occurs.
CKPT (Checkpoint)Updates datafile headers to record the details of a checkpoint. Does notwrite blocks to disk.
DBWn (Database Writer)Writes modified (dirty) buffers in the database buffer cache to the datafiles.
Dnnn (Dispatcher)Runs only when shared server configuration is used. Allows user processesto share server processes.
LGWR (Log Writer)Writes all redo entries that were copied into the buffer since the last time itwrote onto a disk.
LMS (Lock Manager Server)Used in Real Application Clusters only. Provides inter-instance locking inOracle9i Real Application Clusters.
PMON (Process Monitor)Performs process recovery when a user process fails. Cleans up thedatabase buffer cache and frees resources used by the user process.
QMNn (Queue Monitor)Used in Oracle Advanced Queuing only. Monitors the message queues.QMN process failure does not cause the instance to fail.
RECO (Recoverer)Used with the distributed database configuration to automatically resolvefailures involving distributed transactions.
Snnn (Shared Server)Serves multiple client requests in a shared server configuration, but are notassociated with any specific user process.
SMON (System Monitor)Performs crash recovery, when necessary, at instance startup. Cleans up
218 IBM Tivoli Monitoring for Databases: Oracle: Reference Guide

temporary segments no longer used and coalesces contiguous free extentswithin dictionary-managed tablespaces.
SNPn (Job Queue)Used for batch processing of job queues.
This resource model can also monitor the ARC (Archiver) process by adding itfrom the Monitored Processes and Threshold parameter for this resource model.
Resource model overview
Internal name OracleProcessState
Category Oracle
Indications Low Processes occurs when the number of a particularOracle process running on the endpoint for the particularinstance crosses below the desired corresponding threshold.
Unavailable Process occurs when one of the monitoredOracle processes is not running for the particular databaseinstance.
Tasks and built-in actions None
Default cycle time 300 seconds
Target managed resourceOracleDatabaseManager, OracleInstanceManager
Indications and eventsThe following table summarizes the indications for this resource model, the eventsassociated with the indications, the default severity of the events, and where tofind a detailed description of the indication. The resource model generates anevent when the threshold you specify for the indication is triggered.
Indication Generated event Defaultseverity
Clearingevents
Page
Low Processes Oracle_Low_Processes Warning Yes 219
UnavailableProcesses
Oracle_Unavailable_Process
Critical Yes 220
Low Processes indicationOccurs when the number of a particular Oracle process running on the endpointfor the particular instance crosses below the desired corresponding threshold.When the indication occurs often enough to trigger an event, the event delivers amessage to the Tivoli Enterprise Console in the following format:<application_label>: The number of Oracle <ProcessName> Processes forOracle Instance <InstanceName> has crossed below the threshold of <Threshold>processes running and is currently at <NumRunning> processes running.
If you have Tivoli Business Systems Manager configured for your system, TivoliEnterprise Console forwards the message to Tivoli Business Systems Manager.
You can check the health of this resource model in the IBM Tivoli Monitoring WebHealth Console. For more information, see the IBM Tivoli Monitoring Web HealthConsole documentation.
Chapter 2. Resource models 219

The indication has the following attributes:
InstanceNameThe name of an Oracle database instance. The instance name is identifiedby the INSTANCE_NAME parameter in the database initializationparameter file and corresponds to the Oracle System Identifier (SID) of theinstance.
NumRunningThe number of processes running for a particular type of Oracle process.
ProcessNameThe name of a process.
This indication has no thresholds.
The following table describes the default settings for this indication.
Setting Default value
Send indications to Tivoli Enterprise Console Yes
Send indications to Tivoli Business SystemsManager
Yes
Occurrences 1
Holes 0
Associated tasks and built-in actions None
Note: If you have Tivoli Business Systems Manager configured for your systems,Tivoli Enterprise Console automatically forwards events to Tivoli BusinessSystems Manager. Do not change the configuration of the indication to sendevents to Tivoli Business Systems Manager.
Unavailable Process indicationOccurs when one of the monitored Oracle processes is not running for theparticular database instance. When the indication occurs often enough to trigger anevent, the event delivers a message to the Tivoli Enterprise Console in thefollowing format:<application_label>: The Oracle <ProcessName>Process for Oracle instance <InstanceName> is unavailable.
If you have Tivoli Business Systems Manager configured for your system, TivoliEnterprise Console forwards the message to Tivoli Business Systems Manager.
You can check the health of this resource model in the IBM Tivoli Monitoring WebHealth Console. For more information, see the IBM Tivoli Monitoring Web HealthConsole documentation.
The indication has the following attributes:
InstanceNameThe name of an Oracle database instance. The instance name is identifiedby the INSTANCE_NAME parameter in the database initializationparameter file and corresponds to the Oracle System Identifier (SID) of theinstance.
ProcessNameThe name of a process.
220 IBM Tivoli Monitoring for Databases: Oracle: Reference Guide
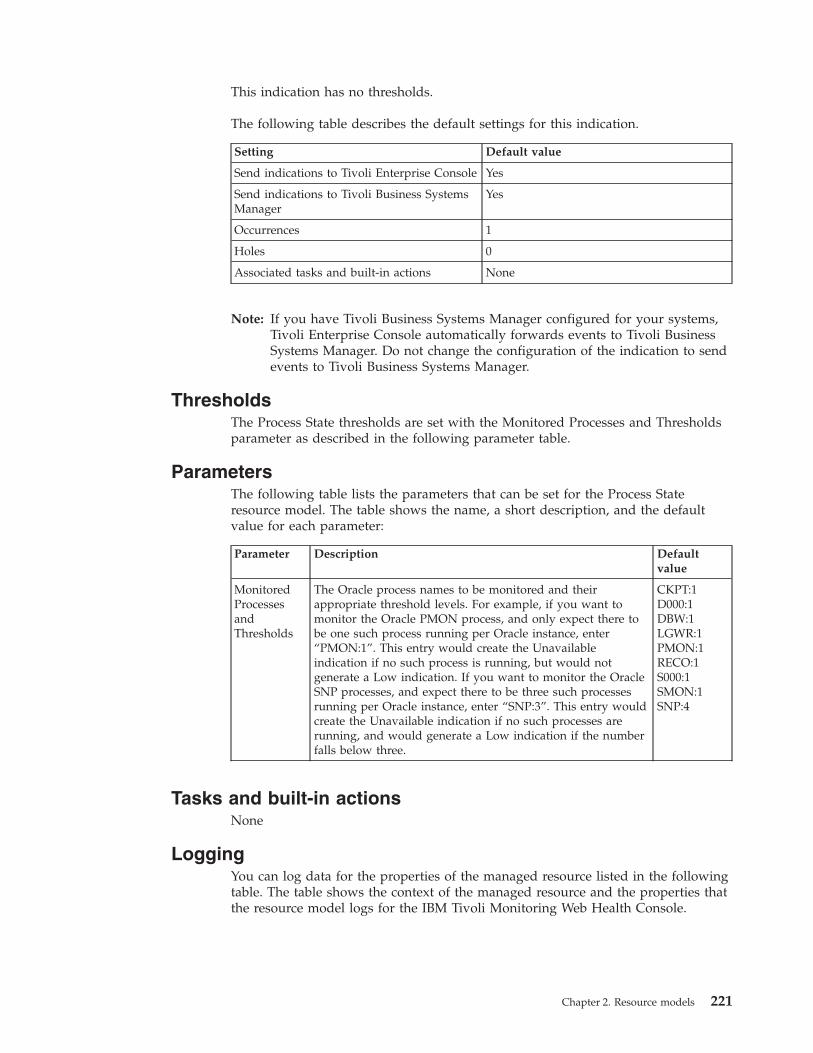
This indication has no thresholds.
The following table describes the default settings for this indication.
Setting Default value
Send indications to Tivoli Enterprise Console Yes
Send indications to Tivoli Business SystemsManager
Yes
Occurrences 1
Holes 0
Associated tasks and built-in actions None
Note: If you have Tivoli Business Systems Manager configured for your systems,Tivoli Enterprise Console automatically forwards events to Tivoli BusinessSystems Manager. Do not change the configuration of the indication to sendevents to Tivoli Business Systems Manager.
ThresholdsThe Process State thresholds are set with the Monitored Processes and Thresholdsparameter as described in the following parameter table.
ParametersThe following table lists the parameters that can be set for the Process Stateresource model. The table shows the name, a short description, and the defaultvalue for each parameter:
Parameter Description Defaultvalue
MonitoredProcessesandThresholds
The Oracle process names to be monitored and theirappropriate threshold levels. For example, if you want tomonitor the Oracle PMON process, and only expect there tobe one such process running per Oracle instance, enter“PMON:1”. This entry would create the Unavailableindication if no such process is running, but would notgenerate a Low indication. If you want to monitor the OracleSNP processes, and expect there to be three such processesrunning per Oracle instance, enter “SNP:3”. This entry wouldcreate the Unavailable indication if no such processes arerunning, and would generate a Low indication if the numberfalls below three.
CKPT:1D000:1DBW:1LGWR:1PMON:1RECO:1S000:1SMON:1SNP:4
Tasks and built-in actionsNone
LoggingYou can log data for the properties of the managed resource listed in the followingtable. The table shows the context of the managed resource and the properties thatthe resource model logs for the IBM Tivoli Monitoring Web Health Console.
Chapter 2. Resource models 221

Managedresource
Context Properties
OracleProcess StateNumRunning
The number of processes running for a particulartype of Oracle process.
OracleDatabase.DatabaseName*The name of an Oracle database.
OracleInstance.InstanceName*The name of an Oracle database instance.
OracleProcessStateAvailablePercentTimeThe percentage of time a process was in an availablestate.
OracleProcessStateUnavailablePercentTimeThe percentage of time a process was in anunavailable state.
ProcessName*The name of a process.
Note: An asterisk (*) denotes a key property.
Return codesTable 2 on page 7 contains a listing of resource model return codes, theirdescription, and what action you can take to resolve each code. The return codenumber is displayed in the IBM Tivoli Monitoring Web Health Console status field,or by using the wdmlseng command.
CLI examplewdmeditprf -P OracleProfile#tme-region -add OracleProcessState -c 300 \-Log -LogDisable -p 12:00 -Agg no -ap 00:15 -NoMin -NoMax -Avg \-DelPar Oracle_Monitored_Processes "CKPT:1" \-DelPar Oracle_Monitored_Processes "D000:1" \-DelPar Oracle_Monitored_Processes "DBW:1" \-DelPar Oracle_Monitored_Processes "LGWR:1" \-DelPar Oracle_Monitored_Processes "PMON:1" \-DelPar Oracle_Monitored_Processes "RECO:1" \-DelPar Oracle_Monitored_Processes "S000:1" \-DelPar Oracle_Monitored_Processes "SMON:1" \-DelPar Oracle_Monitored_Processes "SNP:4" \-AddPar Oracle_Monitored_Processes "CKPT:2" \-AddPar Oracle_Monitored_Processes "D000:2" \-AddPar Oracle_Monitored_Processes "DBW:2" \-AddPar Oracle_Monitored_Processes "LGWR:2" \-AddPar Oracle_Monitored_Processes "PMON:2" \-AddPar Oracle_Monitored_Processes "RECO:2" \-AddPar Oracle_Monitored_Processes "S000:2" \-AddPar Oracle_Monitored_Processes "SMON:2" \-AddPar Oracle_Monitored_Processes "SNP:5" \-e Oracle_Low_Processes \-o 1 -h 0 -severity WARNING -SendTBSM -SendTec \-e Oracle_Unavailable_Process \-o 1 -h 0 -severity CRITICAL -SendTBSM -SendTec
222 IBM Tivoli Monitoring for Databases: Oracle: Reference Guide

RDBMS State
DescriptionMonitors the state of an Oracle database instance.
The resource model connects to the database and runs a SQL statement todetermine the state of the managed Oracle database.
This resource model fires indications when an instance is in one of nine states.Table 5 lists the possible states and an explanation of each state.
Table 5. Possible RDBMS states
RDBMS state State explanation
Becomes Available Occurs when the instance was not available in the previousrequest, but is available in the current request.
Becomes Shutdown Occurs when the instance was not shutdown in the previousrequest, but is shutdown in the current request.
Becomes Suspect Occurs when the instance was not suspect in the previousrequest, but is suspect in the current request.
Becomes Unavailable Occurs when the instance was not unavailable in the previousrequest, but is unavailable in the current request.
Becomes Unknown Occurs when the instance was available in a previous request,but is not responding to the current request.
Shutdown Occurs when the instance is shutdown for the current request.
Suspect Occurs when the instance is suspect for the current request.
Unavailable Occurs when the instance is not available for the currentrequest because the instance is shutdown or suspect.
Unknown Occurs when the instance is not responding.
If the database is not available or an error is returned, the resource model readsthe Oracle Alert log to determine if the Oracle instance was properly shut down.When it determines that the instance was properly shut down, Status = shutdown.If the instance was not properly shut down or the resource model cannot connectto the instance and run a simple select statement, Status = suspect.
When a database is in the suspect state, both of the following conditions exist:v The resource model cannot access the Oracle instance and run a simple SQL
query to determine if the instance is in the available state.v The Oracle Alert log does not indicate that the Oracle instance was properly
shutdown.
Note: Providing an invalid user name and password can cause IBM TivoliMonitoring for Databases: Oracle to determine that the Oracle instance is inthe suspect state.
Strive to reduce the amount of time between an instance going down and aninstance starting up to be as little as possible. Running this resource model willalert you to any changes in the state of a database instance. If there is a problem,run the “Log Event” on page 147 to check for alerts. From the alert log, you candetermine possible causes.
Chapter 2. Resource models 223
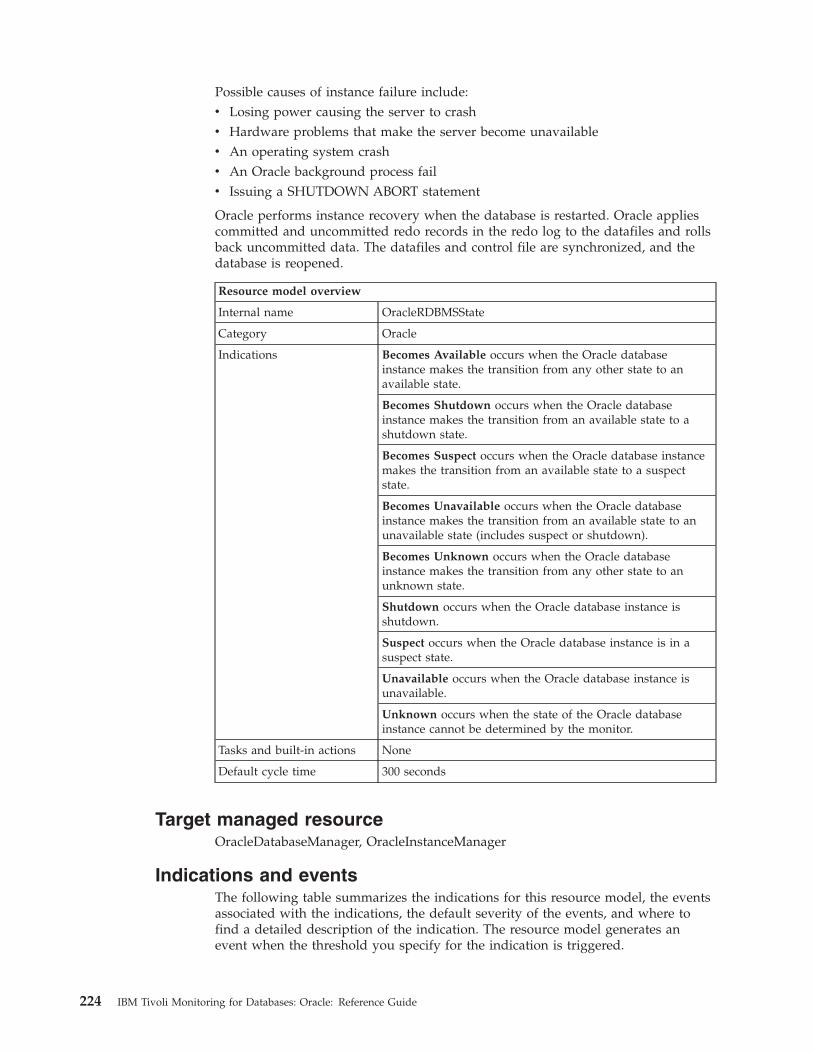
Possible causes of instance failure include:v Losing power causing the server to crashv Hardware problems that make the server become unavailablev An operating system crashv An Oracle background process failv Issuing a SHUTDOWN ABORT statement
Oracle performs instance recovery when the database is restarted. Oracle appliescommitted and uncommitted redo records in the redo log to the datafiles and rollsback uncommitted data. The datafiles and control file are synchronized, and thedatabase is reopened.
Resource model overview
Internal name OracleRDBMSState
Category Oracle
Indications Becomes Available occurs when the Oracle databaseinstance makes the transition from any other state to anavailable state.
Becomes Shutdown occurs when the Oracle databaseinstance makes the transition from an available state to ashutdown state.
Becomes Suspect occurs when the Oracle database instancemakes the transition from an available state to a suspectstate.
Becomes Unavailable occurs when the Oracle databaseinstance makes the transition from an available state to anunavailable state (includes suspect or shutdown).
Becomes Unknown occurs when the Oracle databaseinstance makes the transition from any other state to anunknown state.
Shutdown occurs when the Oracle database instance isshutdown.
Suspect occurs when the Oracle database instance is in asuspect state.
Unavailable occurs when the Oracle database instance isunavailable.
Unknown occurs when the state of the Oracle databaseinstance cannot be determined by the monitor.
Tasks and built-in actions None
Default cycle time 300 seconds
Target managed resourceOracleDatabaseManager, OracleInstanceManager
Indications and eventsThe following table summarizes the indications for this resource model, the eventsassociated with the indications, the default severity of the events, and where tofind a detailed description of the indication. The resource model generates anevent when the threshold you specify for the indication is triggered.
224 IBM Tivoli Monitoring for Databases: Oracle: Reference Guide

Indication Generated event Defaultseverity
Clearingevents
Page
BecomesAvailable
Oracle_Becomes_Available_RDBMSState
Harmless Yes 225
BecomesShutdown
Oracle_Becomes_Shutdown_RDBMSState
Critical Yes 226
BecomesSuspect
Oracle_Becomes_Suspect_RDBMSState
Critical Yes 227
BecomesUnavailable
Oracle_Becomes_Unavailable_RDBMSState
Critical Yes 227
BecomesUnknown
Oracle_Becomes_Unknown_RDBMS_State
Critical Yes 228
Shutdown Oracle_Shutdown_RDBMSState Critical Yes 229
Suspect Oracle_Suspect_RDBMSState Critical Yes 230
Unavailable Oracle_Unavailable_RDBMSState Critical Yes 231
Unknown Oracle_Unknown_RDBMSState Critical Yes 231
Becomes Available indicationOccurs when the Oracle database instance makes the transition from any otherstate to an available state. When the indication occurs often enough to trigger anevent, the event delivers a message to the Tivoli Enterprise Console in thefollowing format:<application_label>: The Oracle instance <InstanceName>has become <State> from <PreviousState>.
If you have Tivoli Business Systems Manager configured for your system, TivoliEnterprise Console forwards the message to Tivoli Business Systems Manager.
You can check the health of this resource model in the IBM Tivoli Monitoring WebHealth Console. For more information, see the IBM Tivoli Monitoring Web HealthConsole documentation.
The indication has the following attributes:
InstanceNameThe name of an Oracle database instance. The instance name is identifiedby the INSTANCE_NAME parameter in the database initializationparameter file and corresponds to the Oracle System Identifier (SID) of theinstance.
PreviousStateThe prior state of the instance.
State Displays the current state of the instance. Possible states include: Available,Unavailable, Shutdown, Suspect, Unknown.
This indication has no thresholds.
The following table describes the default settings for this indication.
Setting Default value
Send indications to Tivoli Enterprise Console Yes
Chapter 2. Resource models 225

Setting Default value
Send indications to Tivoli Business SystemsManager
Yes
Occurrences 1
Holes 0
Associated tasks and built-in actions None
Note: If you have Tivoli Business Systems Manager configured for your systems,Tivoli Enterprise Console automatically forwards events to Tivoli BusinessSystems Manager. Do not change the configuration of the indication to sendevents to Tivoli Business Systems Manager.
Becomes Shutdown indicationOccurs when the Oracle database instance makes the transition from an availablestate to a shutdown state. When the indication occurs often enough to trigger anevent, the event delivers a message to the Tivoli Enterprise Console in thefollowing format:<application_label>: The Oracle instance <InstanceName>has become <State> from <PreviousState>.
If you have Tivoli Business Systems Manager configured for your system, TivoliEnterprise Console forwards the message to Tivoli Business Systems Manager.
You can check the health of this resource model in the IBM Tivoli Monitoring WebHealth Console. For more information, see the IBM Tivoli Monitoring Web HealthConsole documentation.
The indication has the following attributes:
InstanceNameThe name of an Oracle database instance. The instance name is identifiedby the INSTANCE_NAME parameter in the database initializationparameter file and corresponds to the Oracle System Identifier (SID) of theinstance.
PreviousStateThe prior state of the instance.
State Displays the current state of the instance. Possible states include: Available,Unavailable, Shutdown, Suspect, Unknown.
This indication has no thresholds.
The following table describes the default settings for this indication.
Setting Default value
Send indications to Tivoli Enterprise Console Yes
Send indications to Tivoli Business SystemsManager
Yes
Occurrences 1
Holes 0
Associated tasks and built-in actions None
226 IBM Tivoli Monitoring for Databases: Oracle: Reference Guide

Note: If you have Tivoli Business Systems Manager configured for your systems,Tivoli Enterprise Console automatically forwards events to Tivoli BusinessSystems Manager. Do not change the configuration of the indication to sendevents to Tivoli Business Systems Manager.
Becomes Suspect indicationOccurs when the Oracle database instance makes the transition from an availablestate to a suspect state. When the indication occurs often enough to trigger anevent, the event delivers a message to the Tivoli Enterprise Console in thefollowing format:<application_label>: The Oracle instance <InstanceName>has become <State> from <PreviousState>.
If you have Tivoli Business Systems Manager configured for your system, TivoliEnterprise Console forwards the message to Tivoli Business Systems Manager.
You can check the health of this resource model in the IBM Tivoli Monitoring WebHealth Console. For more information, see the IBM Tivoli Monitoring Web HealthConsole documentation.
The indication has the following attributes:
InstanceNameThe name of an Oracle database instance. The instance name is identifiedby the INSTANCE_NAME parameter in the database initializationparameter file and corresponds to the Oracle System Identifier (SID) of theinstance.
PreviousStateThe prior state of the instance.
State Displays the current state of the instance. Possible states include: Available,Unavailable, Shutdown, Suspect, Unknown.
This indication has no thresholds.
The following table describes the default settings for this indication.
Setting Default value
Send indications to Tivoli Enterprise Console Yes
Send indications to Tivoli Business SystemsManager
Yes
Occurrences 1
Holes 0
Associated tasks and built-in actions None
Note: If you have Tivoli Business Systems Manager configured for your systems,Tivoli Enterprise Console automatically forwards events to Tivoli BusinessSystems Manager. Do not change the configuration of the indication to sendevents to Tivoli Business Systems Manager.
Becomes Unavailable indicationOccurs when the Oracle database instance makes the transition from an availablestate to an unavailable state (includes suspect or shutdown). When the indicationoccurs often enough to trigger an event, the event delivers a message to the TivoliEnterprise Console in the following format:
Chapter 2. Resource models 227
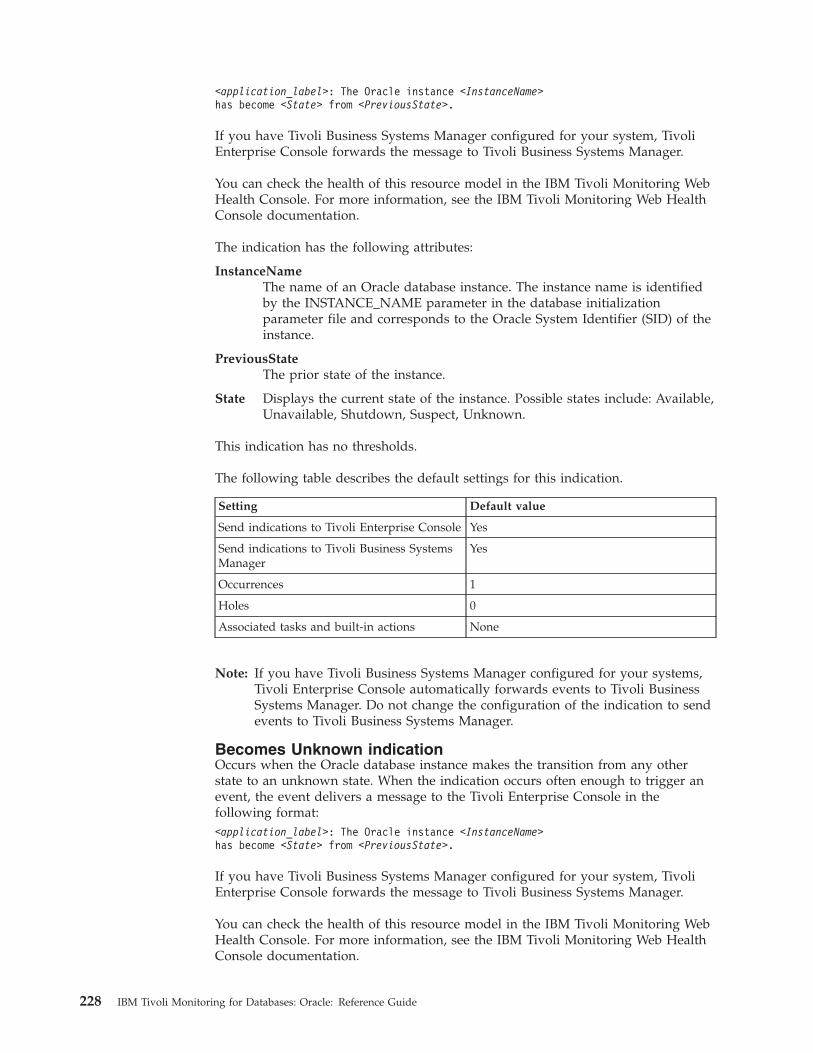
<application_label>: The Oracle instance <InstanceName>has become <State> from <PreviousState>.
If you have Tivoli Business Systems Manager configured for your system, TivoliEnterprise Console forwards the message to Tivoli Business Systems Manager.
You can check the health of this resource model in the IBM Tivoli Monitoring WebHealth Console. For more information, see the IBM Tivoli Monitoring Web HealthConsole documentation.
The indication has the following attributes:
InstanceNameThe name of an Oracle database instance. The instance name is identifiedby the INSTANCE_NAME parameter in the database initializationparameter file and corresponds to the Oracle System Identifier (SID) of theinstance.
PreviousStateThe prior state of the instance.
State Displays the current state of the instance. Possible states include: Available,Unavailable, Shutdown, Suspect, Unknown.
This indication has no thresholds.
The following table describes the default settings for this indication.
Setting Default value
Send indications to Tivoli Enterprise Console Yes
Send indications to Tivoli Business SystemsManager
Yes
Occurrences 1
Holes 0
Associated tasks and built-in actions None
Note: If you have Tivoli Business Systems Manager configured for your systems,Tivoli Enterprise Console automatically forwards events to Tivoli BusinessSystems Manager. Do not change the configuration of the indication to sendevents to Tivoli Business Systems Manager.
Becomes Unknown indicationOccurs when the Oracle database instance makes the transition from any otherstate to an unknown state. When the indication occurs often enough to trigger anevent, the event delivers a message to the Tivoli Enterprise Console in thefollowing format:<application_label>: The Oracle instance <InstanceName>has become <State> from <PreviousState>.
If you have Tivoli Business Systems Manager configured for your system, TivoliEnterprise Console forwards the message to Tivoli Business Systems Manager.
You can check the health of this resource model in the IBM Tivoli Monitoring WebHealth Console. For more information, see the IBM Tivoli Monitoring Web HealthConsole documentation.
228 IBM Tivoli Monitoring for Databases: Oracle: Reference Guide

The indication has the following attributes:
InstanceNameThe name of an Oracle database instance. The instance name is identifiedby the INSTANCE_NAME parameter in the database initializationparameter file and corresponds to the Oracle System Identifier (SID) of theinstance.
PreviousStateThe prior state of the instance.
State Displays the current state of the instance. Possible states include: Available,Unavailable, Shutdown, Suspect, Unknown.
This indication has no thresholds.
The following table describes the default settings for this indication.
Setting Default value
Send indications to Tivoli Enterprise Console Yes
Send indications to Tivoli Business SystemsManager
Yes
Occurrences 1
Holes 0
Associated tasks and built-in actions None
Note: If you have Tivoli Business Systems Manager configured for your systems,Tivoli Enterprise Console automatically forwards events to Tivoli BusinessSystems Manager. Do not change the configuration of the indication to sendevents to Tivoli Business Systems Manager.
Shutdown indicationOccurs when the Oracle database instance is shutdown. When the indicationoccurs often enough to trigger an event, the event delivers a message to the TivoliEnterprise Console in the following format:<application_label>: The Oracle instance <InstanceName> is shutdown.
If you have Tivoli Business Systems Manager configured for your system, TivoliEnterprise Console forwards the message to Tivoli Business Systems Manager.
You can check the health of this resource model in the IBM Tivoli Monitoring WebHealth Console. For more information, see the IBM Tivoli Monitoring Web HealthConsole documentation.
The indication has the following attributes:
InstanceNameThe name of an Oracle database instance. The instance name is identifiedby the INSTANCE_NAME parameter in the database initializationparameter file and corresponds to the Oracle System Identifier (SID) of theinstance.
State Displays the current state of the instance. Possible states include: Available,Unavailable, Shutdown, Suspect, Unknown.
This indication has no thresholds.
Chapter 2. Resource models 229

The following table describes the default settings for this indication.
Setting Default value
Send indications to Tivoli Enterprise Console Yes
Send indications to Tivoli Business SystemsManager
Yes
Occurrences 1
Holes 0
Associated tasks and built-in actions None
Note: If you have Tivoli Business Systems Manager configured for your systems,Tivoli Enterprise Console automatically forwards events to Tivoli BusinessSystems Manager. Do not change the configuration of the indication to sendevents to Tivoli Business Systems Manager.
Suspect indicationOccurs when the Oracle database instance is in a suspect state. When theindication occurs often enough to trigger an event, the event delivers a message tothe Tivoli Enterprise Console in the following format:<application_label>: The Oracle instance<InstanceName> is in a suspect state.
If you have Tivoli Business Systems Manager configured for your system, TivoliEnterprise Console forwards the message to Tivoli Business Systems Manager.
You can check the health of this resource model in the IBM Tivoli Monitoring WebHealth Console. For more information, see the IBM Tivoli Monitoring Web HealthConsole documentation.
The indication has the following attributes:
InstanceNameThe name of an Oracle database instance. The instance name is identifiedby the INSTANCE_NAME parameter in the database initializationparameter file and corresponds to the Oracle System Identifier (SID) of theinstance.
State Displays the current state of the instance. Possible states include: Available,Unavailable, Shutdown, Suspect, Unknown.
This indication has no thresholds.
The following table describes the default settings for this indication.
Setting Default value
Send indications to Tivoli Enterprise Console Yes
Send indications to Tivoli Business SystemsManager
Yes
Occurrences 1
Holes 0
Associated tasks and built-in actions None
230 IBM Tivoli Monitoring for Databases: Oracle: Reference Guide

Note: If you have Tivoli Business Systems Manager configured for your systems,Tivoli Enterprise Console automatically forwards events to Tivoli BusinessSystems Manager. Do not change the configuration of the indication to sendevents to Tivoli Business Systems Manager.
Unavailable indicationOccurs when the Oracle database instance is unavailable. When the indicationoccurs often enough to trigger an event, the event delivers a message to the TivoliEnterprise Console in the following format:<application_label>: The Oracle instance<InstanceName> is Unavailable.
If you have Tivoli Business Systems Manager configured for your system, TivoliEnterprise Console forwards the message to Tivoli Business Systems Manager.
You can check the health of this resource model in the IBM Tivoli Monitoring WebHealth Console. For more information, see the IBM Tivoli Monitoring Web HealthConsole documentation.
The indication has the following attributes:
InstanceNameThe name of an Oracle database instance. The instance name is identifiedby the INSTANCE_NAME parameter in the database initializationparameter file and corresponds to the Oracle System Identifier (SID) of theinstance.
State Displays the current state of the instance. Possible states include: Available,Unavailable, Shutdown, Suspect, Unknown.
This indication has no thresholds.
The following table describes the default settings for this indication.
Setting Default value
Send indications to Tivoli Enterprise Console Yes
Send indications to Tivoli Business SystemsManager
Yes
Occurrences 1
Holes 0
Associated tasks and built-in actions None
Note: If you have Tivoli Business Systems Manager configured for your systems,Tivoli Enterprise Console automatically forwards events to Tivoli BusinessSystems Manager. Do not change the configuration of the indication to sendevents to Tivoli Business Systems Manager.
Unknown indication
Note: This resource model only generates an Unknown RDBMS State indicationwhen pushed to a 9i database and the resource in down on the first push.
Occurs when the state of the Oracle database instance cannot be determined by themonitor. When the indication occurs often enough to trigger an event, the eventdelivers a message to the Tivoli Enterprise Console in the following format:
Chapter 2. Resource models 231

<application_label>: The state of the Oracleinstance <InstanceName> cannot be determined.
If you have Tivoli Business Systems Manager configured for your system, TivoliEnterprise Console forwards the message to Tivoli Business Systems Manager.
You can check the health of this resource model in the IBM Tivoli Monitoring WebHealth Console. For more information, see the IBM Tivoli Monitoring Web HealthConsole documentation.
The indication has the following attributes:
InstanceNameThe name of an Oracle database instance. The instance name is identifiedby the INSTANCE_NAME parameter in the database initializationparameter file and corresponds to the Oracle System Identifier (SID) of theinstance.
State Displays the current state of the instance. Possible states include: Available,Unavailable, Shutdown, Suspect, Unknown.
This indication has no thresholds.
The following table describes the default settings for this indication.
Setting Default value
Send indications to Tivoli Enterprise Console Yes
Send indications to Tivoli Business SystemsManager
Yes
Occurrences 1
Holes 0
Associated tasks and built-in actions None
Note: If you have Tivoli Business Systems Manager configured for your systems,Tivoli Enterprise Console automatically forwards events to Tivoli BusinessSystems Manager. Do not change the configuration of the indication to sendevents to Tivoli Business Systems Manager.
ThresholdsNone
ParametersNone
Tasks and built-in actionsNone
LoggingYou can log data for the properties of the managed resource listed in the followingtable. The table shows the context of the managed resource and the properties thatthe resource model logs for the IBM Tivoli Monitoring Web Health Console.
232 IBM Tivoli Monitoring for Databases: Oracle: Reference Guide

Managedresource
Context Properties
OracleInstance StateInstanceName*
The name of an Oracle database instance.
OracleDatabase.DatabaseName*The name of an Oracle database.
OracleInstanceStateAvailablePercentTimeThe percentage of time an instance was in anavailable state.
OracleInstanceStateSuspectPercentTimeThe percentage of time an instance was in asuspect state.
OracleInstanceStateShutdownPercentTimeThe percentage of time an instance was in ashutdown state.
OracleInstanceStateUnknownPercentTimeThe percentage of time an instance was in anunknown state.
OracleInstanceStateUnavailablePercentTimeThe percentage of time an instance was in anunavailable state.
Note: An asterisk (*) denotes a key property.
Return codesTable 2 on page 7 contains a listing of resource model return codes, theirdescription, and what action you can take to resolve each code. The return codenumber is displayed in the IBM Tivoli Monitoring Web Health Console status field,or by using the wdmlseng command.
CLI examplewdmeditprf -P OracleProfile#tme-region -add OracleRDBMSState -c 300 \-Log -LogDisable -p 12:00 -Agg no -ap 00:15 -NoMin -NoMax -Avg \-e Oracle_Becomes_Unknown_RDBMSState \-o 1 -h 0 -severity CRITICAL -SendTBSM -SendTec \-e Oracle_Unavailable_RDBMSState \-o 1 -h 0 -severity CRITICAL -SendTBSM -SendTec \-e Oracle_Suspect_RDBMSState \-o 1 -h 0 -severity CRITICAL -SendTBSM -SendTec \-e Oracle_Becomes_Shutdown_RDBMSState \-o 1 -h 0 -severity CRITICAL -SendTBSM -SendTec \-e Oracle_Becomes_Available_RDBMSState \-o 1 -h 0 -severity HARMLESS -SendTBSM -SendTec \-e Oracle_Shutdown_RDBMSState \-o 1 -h 0 -severity CRITICAL -SendTBSM -SendTec \-e Oracle_Unknown_RDBMSState \-o 1 -h 0 -severity CRITICAL -SendTBSM -SendTec \-e Oracle_Becomes_Suspect_RDBMSState \-o 1 -h 0 -severity CRITICAL -SendTBSM -SendTec \-e Oracle_Becomes_Unavailable_RDBMSState \-o 1 -h 0 -severity CRITICAL -SendTBSM -SendTec
Chapter 2. Resource models 233

Recursive Calls
DescriptionMonitors the following information:v Recursive Calls — The number of recursive calls since the instance was createdv User Calls — The number of user calls since the instance was createdv Recursive Call Rate (Interval) — The number of new recursive calls per secondv Recursive To User Call Ratio — The number of recursive calls compared to the
number of user calls
A user call is an SQL statement that is executed at the request of the user.
A recursive call occurs when one SQL statement requires the execution of a furtherseparate SQL statement. A continued increase in the reported figure indicates pooror decreasing system performance. Some recursive activity is unavoidable.
Recursive calls can be generated by the following activities:v An object requiring an additional extent for storage (dynamic extension)v Misses on the dictionary cachev Firing of database triggersv DDL statementsv Execution of SQL statements within stored procedures, packages, functions, and
anonymous PL/SQL blocksv Enforcement of referential integrity constraints
If Oracle is making an inordinate number of recursive calls, try to determine whichof the previously listed activities is causing most of the recursive calls. Run theapplication through TKPROF with EXPLAIN PLAN to see what the application isdoing. Also, monitor the number of extents in the database to see if there isnoticeable dynamic extension. If the recursive calls are caused by dynamicextension, you can reduce the number of calls by allocating larger extents to therelevant objects. A dictionary cache that is too small can also cause recursive calls.
A change in the Recursive To User Calls ratio can reflect an application change orthe need to increase the size of the shared buffer pool. A marked change in thedata definition language (DDL) workload on the database will also affect this ratio.
Resource model overview
Internal name OracleRecursiveCalls
Category Oracle
Indications High Interval Recursive Call Percentage occurs when therecursive call percentage for the current interval exceeds thespecified threshold.
High Recursive Call Percentage occurs when the recursivecall percentage exceeds the specified threshold.
High Recursive Call Rate occurs when the recursive callrate exceeds the specified threshold.
High Recursive To User Calls Ratio occurs when the ratioof recursive calls to user calls since the database was startedexceeds the specified threshold.
234 IBM Tivoli Monitoring for Databases: Oracle: Reference Guide

Resource model overview
Tasks and built-in actions None
Default cycle time 600 seconds
Target managed resourceOracleDatabaseManager, OracleInstanceManager
Indications and eventsThe following table summarizes the indications for this resource model, the eventsassociated with the indications, the default severity of the events, and where tofind a detailed description of the indication. The resource model generates anevent when the threshold you specify for the indication is triggered.
Indication Generated event Defaultseverity
Clearingevents
Page
High IntervalRecursive CallPercentage
Oracle_High_IntervalRecursiveCallPercentage
Critical Yes 235
HighRecursive CallPercentage
Oracle_High_RecursiveCallPercentage
Critical Yes 236
HighRecursive CallRate
Oracle_High_RecursiveCallRate
Critical Yes 237
HighRecursive ToUser CallsRatio
Oracle_High_RecursiveToUserCallsRatio
Critical Yes 238
High Interval Recursive Call Percentage indicationOccurs when the recursive call percentage for the current interval exceeds thespecified threshold. When the indication occurs often enough to trigger an event,the event delivers a message to the Tivoli Enterprise Console in the followingformat:<application_label>: The Interval Recursive Call Percentage for Oracleinstance <InstanceName> has crossed above the predefined threshold of<Threshold> percent and is currently at<IntervalRecursiveCallPercentage> percent.
If you have Tivoli Business Systems Manager configured for your system, TivoliEnterprise Console forwards the message to Tivoli Business Systems Manager.
You can check the health of this resource model in the IBM Tivoli Monitoring WebHealth Console. For more information, see the IBM Tivoli Monitoring Web HealthConsole documentation.
Monitors recursive calls as a percentage of total calls during the last cycle. Arecursive call is when an SQL statement requires the execution of another separateSQL statement. Total calls include recursive calls and user calls. User calls are SQLexecutions that are invoked directly by the user.
The indication has the following attributes:
Chapter 2. Resource models 235

InstanceNameThe name of an Oracle database instance. The instance name is identifiedby the INSTANCE_NAME parameter in the database initializationparameter file and corresponds to the Oracle System Identifier (SID) of theinstance.
IntervalRecursiveCallPercentageThe percentage of interval recursive calls for the instance for the currentinterval.
This indication has the following threshold:v Maximum Interval Recursive Call Percentage
For more information about this threshold, see “Thresholds” on page 239.
The following table describes the default settings for this indication.
Setting Default value
Send indications to Tivoli Enterprise Console Yes
Send indications to Tivoli Business SystemsManager
Yes
Occurrences 1
Holes 0
Associated tasks and built-in actions None
Note: If you have Tivoli Business Systems Manager configured for your systems,Tivoli Enterprise Console automatically forwards events to Tivoli BusinessSystems Manager. Do not change the configuration of the indication to sendevents to Tivoli Business Systems Manager.
High Recursive Call Percentage indicationOccurs when the recursive call percentage exceeds the specified threshold. Whenthe indication occurs often enough to trigger an event, the event delivers amessage to the Tivoli Enterprise Console in the following format:<application_label>: The Recursive Call Percentage for Oracle instance<InstanceName> has crossed above the predefined threshold of<Threshold> percent and is currently at<RecursiveCallPercentage> percent.
If you have Tivoli Business Systems Manager configured for your system, TivoliEnterprise Console forwards the message to Tivoli Business Systems Manager.
You can check the health of this resource model in the IBM Tivoli Monitoring WebHealth Console. For more information, see the IBM Tivoli Monitoring Web HealthConsole documentation.
Monitors recursive calls as a percentage of total calls since the instance wascreated. A recursive call is when an SQL statement requires the execution of anotherseparate SQL statement. Total calls include recursive calls and user calls. User callsare SQL executions that are invoked directly by the user.
The indication has the following attributes:
InstanceNameThe name of an Oracle database instance. The instance name is identified
236 IBM Tivoli Monitoring for Databases: Oracle: Reference Guide

by the INSTANCE_NAME parameter in the database initializationparameter file and corresponds to the Oracle System Identifier (SID) of theinstance.
RecursiveCallPercentageThe percentage of recursive calls for the instance.
This indication has the following threshold:v Maximum Recursive Call Percentage
For more information about this threshold, see “Thresholds” on page 239.
The following table describes the default settings for this indication.
Setting Default value
Send indications to Tivoli Enterprise Console Yes
Send indications to Tivoli Business SystemsManager
Yes
Occurrences 1
Holes 0
Associated tasks and built-in actions None
Note: If you have Tivoli Business Systems Manager configured for your systems,Tivoli Enterprise Console automatically forwards events to Tivoli BusinessSystems Manager. Do not change the configuration of the indication to sendevents to Tivoli Business Systems Manager.
High Recursive Call Rate indicationOccurs when the recursive call rate exceeds the specified threshold. When theindication occurs often enough to trigger an event, the event delivers a message tothe Tivoli Enterprise Console in the following format:<application_label>: The Recursive Call Rate for Oracle instance<InstanceName> has crossed above the predefined threshold of <Threshold> callsper second and is currently at <RecursiveCallRate> calls per second.
If you have Tivoli Business Systems Manager configured for your system, TivoliEnterprise Console forwards the message to Tivoli Business Systems Manager.
You can check the health of this resource model in the IBM Tivoli Monitoring WebHealth Console. For more information, see the IBM Tivoli Monitoring Web HealthConsole documentation.
The rate of recursive calls is expressed as calls per second. A recursive call is whenan SQL statement requires the execution of another separate SQL statement.
The indication has the following attributes:
InstanceNameThe name of an Oracle database instance. The instance name is identifiedby the INSTANCE_NAME parameter in the database initializationparameter file and corresponds to the Oracle System Identifier (SID) of theinstance.
RecursiveCallRateThe rate of recursive calls for the instance.
Chapter 2. Resource models 237
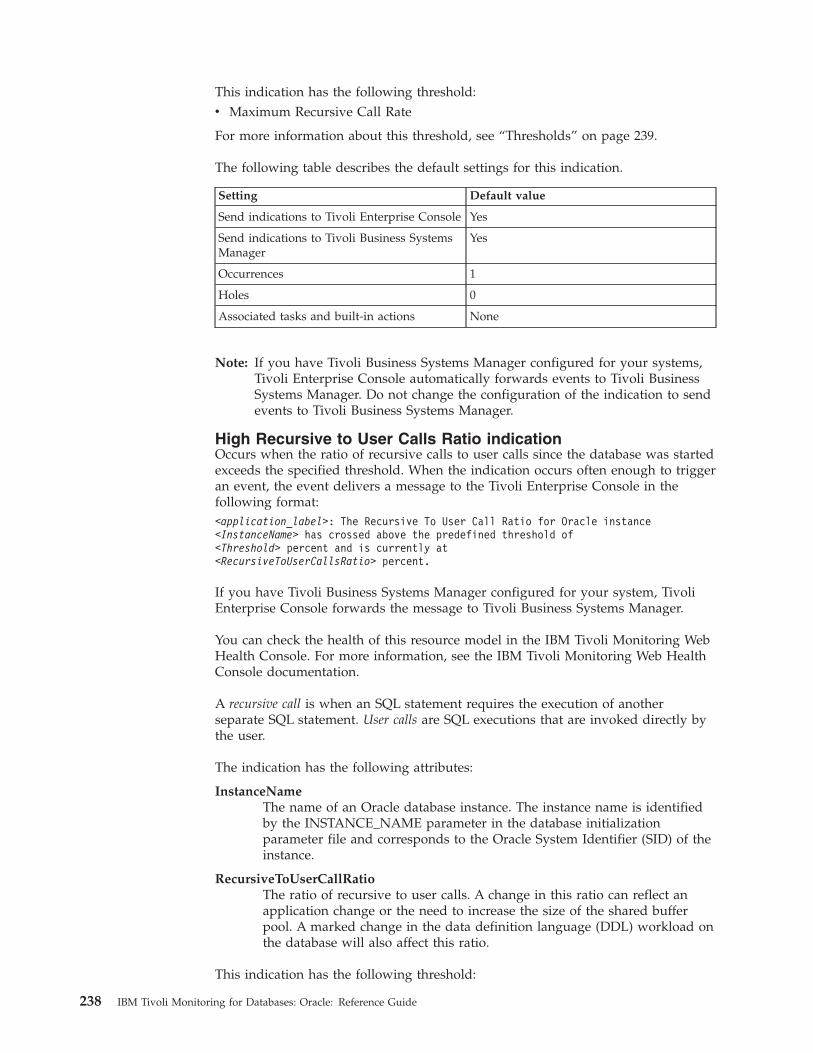
This indication has the following threshold:v Maximum Recursive Call Rate
For more information about this threshold, see “Thresholds” on page 239.
The following table describes the default settings for this indication.
Setting Default value
Send indications to Tivoli Enterprise Console Yes
Send indications to Tivoli Business SystemsManager
Yes
Occurrences 1
Holes 0
Associated tasks and built-in actions None
Note: If you have Tivoli Business Systems Manager configured for your systems,Tivoli Enterprise Console automatically forwards events to Tivoli BusinessSystems Manager. Do not change the configuration of the indication to sendevents to Tivoli Business Systems Manager.
High Recursive to User Calls Ratio indicationOccurs when the ratio of recursive calls to user calls since the database was startedexceeds the specified threshold. When the indication occurs often enough to triggeran event, the event delivers a message to the Tivoli Enterprise Console in thefollowing format:<application_label>: The Recursive To User Call Ratio for Oracle instance<InstanceName> has crossed above the predefined threshold of<Threshold> percent and is currently at<RecursiveToUserCallsRatio> percent.
If you have Tivoli Business Systems Manager configured for your system, TivoliEnterprise Console forwards the message to Tivoli Business Systems Manager.
You can check the health of this resource model in the IBM Tivoli Monitoring WebHealth Console. For more information, see the IBM Tivoli Monitoring Web HealthConsole documentation.
A recursive call is when an SQL statement requires the execution of anotherseparate SQL statement. User calls are SQL executions that are invoked directly bythe user.
The indication has the following attributes:
InstanceNameThe name of an Oracle database instance. The instance name is identifiedby the INSTANCE_NAME parameter in the database initializationparameter file and corresponds to the Oracle System Identifier (SID) of theinstance.
RecursiveToUserCallRatioThe ratio of recursive to user calls. A change in this ratio can reflect anapplication change or the need to increase the size of the shared bufferpool. A marked change in the data definition language (DDL) workload onthe database will also affect this ratio.
This indication has the following threshold:
238 IBM Tivoli Monitoring for Databases: Oracle: Reference Guide

v Maximum Recursive To User Call Ratio
For more information about this threshold, see “Thresholds” on page 239.
The following table describes the default settings for this indication.
Setting Default value
Send indications to Tivoli Enterprise Console Yes
Send indications to Tivoli Business SystemsManager
Yes
Occurrences 1
Holes 0
Associated tasks and built-in actions None
Note: If you have Tivoli Business Systems Manager configured for your systems,Tivoli Enterprise Console automatically forwards events to Tivoli BusinessSystems Manager. Do not change the configuration of the indication to sendevents to Tivoli Business Systems Manager.
ThresholdsThe following table lists the thresholds that can be set for the Recursive Callresource model. For each threshold it shows the name, a short description, and thedefault value:
Threshold Description Defaultvalue
Maximum IntervalRecursive CallPercentage
An indication occurs when the Interval RecursiveCall Percentage exceeds this value.
50
Maximum Recursive CallPercentage
An indication occurs when the Recursive CallPercentage exceeds this value.
50
Maximum Recursive CallRate
An indication occurs when the Recursive CallRate exceeds this value.
10
Maximum Recursive ToUser Calls Ratio
An indication occurs when the Recursive to UserCall Ratio exceeds this value.
1
Parameters
Note: A plus symbol (+) denotes parameters that feature selective logging.Selective logging enables you to choose metrics/properties that you want tolog. The selective logging metrics are listed in the value field of theParameters window.
The following table lists the parameters that can be set for the Recursive Callsresource model. The table shows the name, a short description, and the defaultvalue for each parameter:
Chapter 2. Resource models 239

Parameter Description Default value
InstancePerformanceMetrics +
Select the metrics you want to log.See the following logging table fora description of each metric.
Interval Recursive Call Percentage
Recursive Call Percentage
Recursive Call Rate
Recursive Calls
Recursive To User Calls Ratio
User Calls
Tasks and built-in actionsNone
LoggingYou can log data for the properties of the managed resource listed in the followingtable. The table shows the context of the managed resource and the properties thatthe resource model logs for the IBM Tivoli Monitoring Web Health Console.
Managedresource
Context Properties
OracleInstance PerformanceInstanceName*
The name of an Oracle database instance.
IntervalRecursiveCallPercentagePercentage of recursive calls to total calls overthe time interval for which the monitor wasrun.
OracleDatabase.DatabaseName*The name of an Oracle database.
RecursiveCallRateThe rate of recursive calls for the instance.
RecursiveCallsThe number of recursive calls for the instance.A recursive call occurs when one SQLstatement requires the execution of a furtherseparate SQL statement.
RecursiveCallPercentageThe percentage of recursive calls for theinstance.
RecursiveToUserCallsRatioThe ratio of recursive to user calls.
UserCallsThe number of user calls for the instance.
Note: An asterisk (*) denotes a key property.
240 IBM Tivoli Monitoring for Databases: Oracle: Reference Guide

Return codesTable 2 on page 7 contains a listing of resource model return codes, theirdescription, and what action you can take to resolve each code. The return codenumber is displayed in the IBM Tivoli Monitoring Web Health Console status field,or by using the wdmlseng command.
CLI examplewdmeditprf -P OracleProfile#tme-region -add OracleRecursiveCalls -c 600 \-Log -LogDisable -p 12:00 -Agg no -ap 00:15 -NoMin -NoMax -Avg \-t Maximum_IntervalRecursiveCallPercentage 50.000000 \-t Maximum_RecursiveCallPercentage 50.000000 \-t Maximum_RecursiveCallRate 10.000000 \-t Maximum_RecursiveToUserCallsRatio 1.000000 \-AddPar InstancePerformanceMetrics "numRecursiveCallRate" \-AddPar InstancePerformanceMetrics "numRecursiveCallPercentage" \-AddPar InstancePerformanceMetrics "numIntervalRecursiveCallPercentage" \-AddPar InstancePerformanceMetrics "numRecursiveToUserCallsRatio" \-AddPar InstancePerformanceMetrics "numRecursiveCalls" \-AddPar InstancePerformanceMetrics "numUserCalls" \-e Oracle_High_IntervalRecursiveCallPercentage \-o 1 -h 0 -severity CRITICAL -SendTBSM -SendTec \-e Oracle_High_RecursiveCallPercentage \-o 1 -h 0 -severity CRITICAL -SendTBSM -SendTec \-e Oracle_High_RecursiveCallRate \-o 1 -h 0 -severity CRITICAL -SendTBSM -SendTec \-e Oracle_High_RecursiveToUserCallsRatio \-o 1 -h 0 -severity CRITICAL -SendTBSM -SendTec
Chapter 2. Resource models 241

Redo Log
DescriptionMonitors the following:v As a percentage, the ratio of misses to gets for the redo allocation latch, and
redo copy latchv The number of times that a user process was unable to allocate space in the redo
log bufferv The number of redo log files that have not been archived, which indicates that
the archive process is falling behindv The average size of a redo entry, which is calculated as the total redo size in
bytes, divided by the number of redo entries. This information can be useful incalculating the size of the online redo logs or the log buffer in the system globalarea (SGA)
Note: The High Redo Logs Not Archived indication is applicable only when thedatabase is running in ARCHIVELOG mode. If the database is inNOARCHIVELOG mode, the metric returns a value of zero.
Redo logs record all changes made to the database. If an instance or database fails,redo logs make it possible to reconstruct. Latches are mechanisms that protectshared data structures in the system global area (SGA). Latches can protect who iscurrently accessing the database. Server and background processes acquire latcheswhile manipulating or looking at data structures. Operating systems determine theuse of latches as well as how long processes wait for a latch.
Redo allocation latches control space allocation for redo entries in the redo log buffer.The Oracle user process must obtain the redo allocation latch to allocate space inthe buffer. There is only one redo allocation latch, so only one user process canallocate space in the buffer at a time. This single latch ensures a sequential patternof buffer entries. After space is allocated for a redo entry, the user process can copythe entry into the buffer. This is known as ″copying on the redo allocation latch.″ Aprocess can only copy on the redo allocation latch if the redo entry is smaller thanthe specified threshold. If the redo entry is too large to copy, then the user processmust get a redo copy latch. The redo copy latch enables the user process to copy theredo entry into its allocated space in the buffer. Computes with multiple CPUs canhave multiple redo copy latches in the redo log buffer. Multiple latches allowmultiple processes to copy entries to the redo log buffer concurrently.
Resource model overview
Internal name OracleRedoLog
Category Oracle
242 IBM Tivoli Monitoring for Databases: Oracle: Reference Guide

Resource model overview
Indications High Average Redo Entry Size occurs when the averagesize of redo entries exceeds the specified threshold.
High Redo Allocation Latch Percentage occurs when theredo allocation latch percentage exceeds the specifiedthreshold.
High Redo Copy Latch Percentage occurs when thepercentage of redo copy latch exceeds the specifiedthreshold.
High Redo Copy Latch Percentage Increase occurs whenthe percentage increase of redo copy latch exceeds thespecified threshold.
High Redo Log Space Waits (Interval) occurs when the redolog space waits number exceeds the specified threshold.
High Redo Logs Not Archived occurs when the redo logsnot archived number exceeds the specified threshold.
Tasks and built-in actions None
Default cycle time 3600 seconds
Target managed resourceOracleDatabaseManager, OracleInstanceManager
Indications and eventsThe following table summarizes the indications for this resource model, the eventsassociated with the indications, the default severity of the events, and where tofind a detailed description of the indication. The resource model generates anevent when the threshold you specify for the indication is triggered.
Indication Generated event Defaultseverity
Clearingevents
Page
High AverageRedo EntrySize
Oracle_High_AvgRedoEntrySize
Critical Yes 244
High RedoAllocationLatchPercentage
Oracle_High_RedoAllocationLatchPercentage
Critical Yes 245
High RedoCopy LatchPercentage
Oracle_High_RedoCopyLatchPercentage
Critical Yes 246
High RedoCopy LatchPercentageIncrease
Oracle_High_RedoCopyLatchPercentageIncrease
Critical Yes 247
High RedoLog SpaceWaits(Interval)
Oracle_High_IntervalRedoLogSpaceWaits
Critical Yes 248
High RedoLogs NotArchived
Oracle_High_RedoLogsNotArchived
Critical Yes 249
Chapter 2. Resource models 243

High Average Redo Entry Size indicationOccurs when the average size of redo entries exceeds the specified threshold.When the indication occurs often enough to trigger an event, the event delivers amessage to the Tivoli Enterprise Console in the following format:<application_label>: The average redo entry size for Oracleinstance <InstanceName> has crossed above the predefinedthreshold of <Threshold> bytes per entryand is currently at <AvgRedoEntrySize> bytes per entry.
If you have Tivoli Business Systems Manager configured for your system, TivoliEnterprise Console forwards the message to Tivoli Business Systems Manager.
You can check the health of this resource model in the IBM Tivoli Monitoring WebHealth Console. For more information, see the IBM Tivoli Monitoring Web HealthConsole documentation.
The indication has the following attributes:
AvgRedoEntrySizeThe total redo size (in bytes) divided by the number of redo entries.
DatabaseNameThe name of an Oracle database. The database name contains up to 8characters and corresponds to the name specified in the CREATEDATABASE statement and identified in the DB_NAME parameter in thedatabase initialization parameter file.
InstanceNameThe name of an Oracle database instance. The instance name is identifiedby the INSTANCE_NAME parameter in the database initializationparameter file and corresponds to the Oracle System Identifier (SID) of theinstance.
This indication has the following threshold:v Maximum Average Redo Entry Size
For more information about this threshold, see “Thresholds” on page 250.
The following table describes the default settings for this indication.
Setting Default value
Send indications to Tivoli Enterprise Console Yes
Send indications to Tivoli Business SystemsManager
Yes
Occurrences 1
Holes 0
Associated tasks and built-in actions None
Note: If you have Tivoli Business Systems Manager configured for your systems,Tivoli Enterprise Console automatically forwards events to Tivoli BusinessSystems Manager. Do not change the configuration of the indication to sendevents to Tivoli Business Systems Manager.
244 IBM Tivoli Monitoring for Databases: Oracle: Reference Guide

High Redo Allocation Latch Percentage indicationOccurs when the redo allocation latch percentage exceeds the specified threshold.When the indication occurs often enough to trigger an event, the event delivers amessage to the Tivoli Enterprise Console in the following format:<application_label>: The redo allocation latch percentage for Oracleinstance <InstanceName> has crossed above the predefinedthreshold of <Threshold> percentand is currently at <RedoAllocationLatchPercentage> percent.
If you have Tivoli Business Systems Manager configured for your system, TivoliEnterprise Console forwards the message to Tivoli Business Systems Manager.
You can check the health of this resource model in the IBM Tivoli Monitoring WebHealth Console. For more information, see the IBM Tivoli Monitoring Web HealthConsole documentation.
The indication has the following attributes:
DatabaseNameThe name of an Oracle database. The database name contains up to 8characters and corresponds to the name specified in the CREATEDATABASE statement and identified in the DB_NAME parameter in thedatabase initialization parameter file.
InstanceNameThe name of an Oracle database instance. The instance name is identifiedby the INSTANCE_NAME parameter in the database initializationparameter file and corresponds to the Oracle System Identifier (SID) of theinstance.
RedoAllocationLatchPercentageThe percentage of misses to gets for the redo allocation latch.
This indication has the following threshold:v Maximum Redo Allocation Latch Percentage
For more information about this threshold, see “Thresholds” on page 250.
The following table describes the default settings for this indication.
Setting Default value
Send indications to Tivoli Enterprise Console Yes
Send indications to Tivoli Business SystemsManager
Yes
Occurrences 1
Holes 0
Associated tasks and built-in actions None
Note: If you have Tivoli Business Systems Manager configured for your systems,Tivoli Enterprise Console automatically forwards events to Tivoli BusinessSystems Manager. Do not change the configuration of the indication to sendevents to Tivoli Business Systems Manager.
Chapter 2. Resource models 245
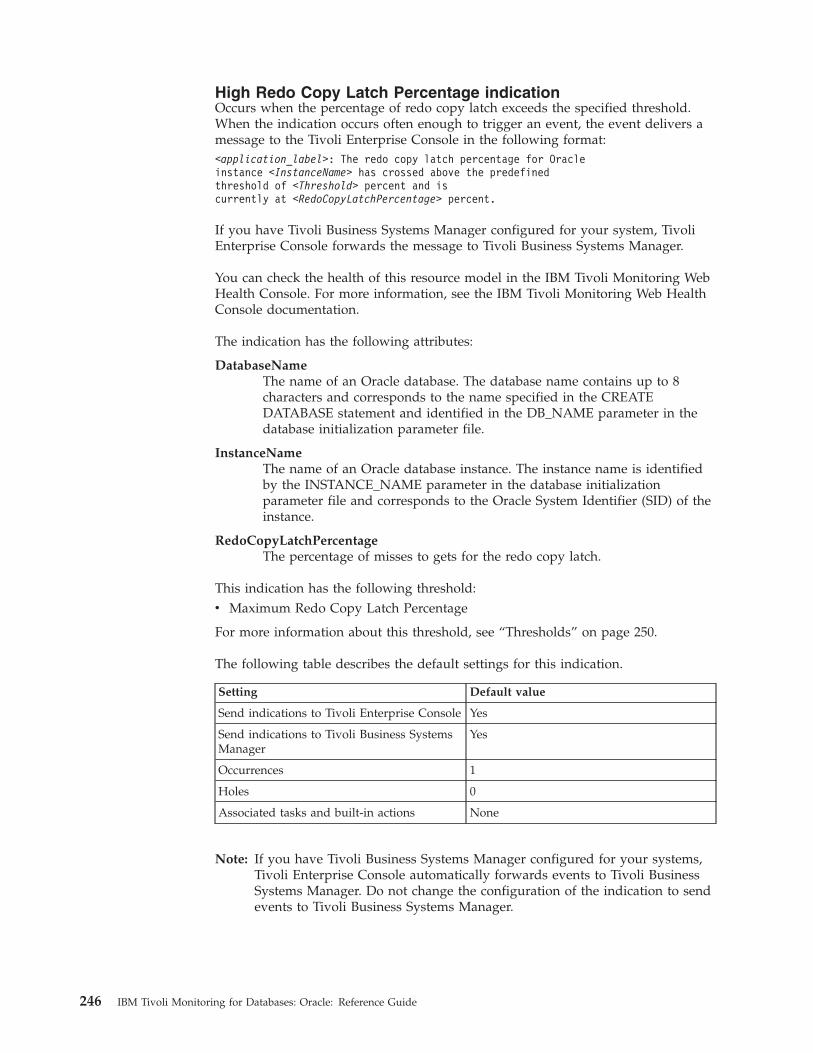
High Redo Copy Latch Percentage indicationOccurs when the percentage of redo copy latch exceeds the specified threshold.When the indication occurs often enough to trigger an event, the event delivers amessage to the Tivoli Enterprise Console in the following format:<application_label>: The redo copy latch percentage for Oracleinstance <InstanceName> has crossed above the predefinedthreshold of <Threshold> percent and iscurrently at <RedoCopyLatchPercentage> percent.
If you have Tivoli Business Systems Manager configured for your system, TivoliEnterprise Console forwards the message to Tivoli Business Systems Manager.
You can check the health of this resource model in the IBM Tivoli Monitoring WebHealth Console. For more information, see the IBM Tivoli Monitoring Web HealthConsole documentation.
The indication has the following attributes:
DatabaseNameThe name of an Oracle database. The database name contains up to 8characters and corresponds to the name specified in the CREATEDATABASE statement and identified in the DB_NAME parameter in thedatabase initialization parameter file.
InstanceNameThe name of an Oracle database instance. The instance name is identifiedby the INSTANCE_NAME parameter in the database initializationparameter file and corresponds to the Oracle System Identifier (SID) of theinstance.
RedoCopyLatchPercentageThe percentage of misses to gets for the redo copy latch.
This indication has the following threshold:v Maximum Redo Copy Latch Percentage
For more information about this threshold, see “Thresholds” on page 250.
The following table describes the default settings for this indication.
Setting Default value
Send indications to Tivoli Enterprise Console Yes
Send indications to Tivoli Business SystemsManager
Yes
Occurrences 1
Holes 0
Associated tasks and built-in actions None
Note: If you have Tivoli Business Systems Manager configured for your systems,Tivoli Enterprise Console automatically forwards events to Tivoli BusinessSystems Manager. Do not change the configuration of the indication to sendevents to Tivoli Business Systems Manager.
246 IBM Tivoli Monitoring for Databases: Oracle: Reference Guide

High Redo Copy Latch Percentage Increase indicationOccurs when the percentage increase of redo copy latch exceeds the specifiedthreshold. When the indication occurs often enough to trigger an event, the eventdelivers a message to the Tivoli Enterprise Console in the following format:<application_label>: The redo copy latch percentage increase for Oracleinstance <InstanceName> has crossed above the predefinedthreshold of <Threshold> percent and iscurrently at <RedoCopyLatchPercentageIncrease> percent.
If you have Tivoli Business Systems Manager configured for your system, TivoliEnterprise Console forwards the message to Tivoli Business Systems Manager.
You can check the health of this resource model in the IBM Tivoli Monitoring WebHealth Console. For more information, see the IBM Tivoli Monitoring Web HealthConsole documentation.
The indication has the following attributes:
DatabaseNameThe name of an Oracle database. The database name contains up to 8characters and corresponds to the name specified in the CREATEDATABASE statement and identified in the DB_NAME parameter in thedatabase initialization parameter file.
InstanceNameThe name of an Oracle database instance. The instance name is identifiedby the INSTANCE_NAME parameter in the database initializationparameter file and corresponds to the Oracle System Identifier (SID) of theinstance.
RedoCopyLatchPercentageIncreaseAs a percentage, the increase of misses to gets for the redo copy latch sincethe last resource model cycle time. This value could potentially benegative.
This indication has the following threshold:v Maximum Redo Copy Latch Percentage Increase
For more information about this threshold, see “Thresholds” on page 250.
The following table describes the default settings for this indication.
Setting Default value
Send indications to Tivoli Enterprise Console Yes
Send indications to Tivoli Business SystemsManager
Yes
Occurrences 1
Holes 0
Associated tasks and built-in actions None
Note: If you have Tivoli Business Systems Manager configured for your systems,Tivoli Enterprise Console automatically forwards events to Tivoli BusinessSystems Manager. Do not change the configuration of the indication to sendevents to Tivoli Business Systems Manager.
Chapter 2. Resource models 247

High Redo Log Space Waits (Interval) indicationOccurs when the redo log space waits number exceeds the specified threshold.When the indication occurs often enough to trigger an event, the event delivers amessage to the Tivoli Enterprise Console in the following format:<application_label>: The redo log space waits for Oracleinstance <InstanceName> has crossed above the predefinedthreshold of <Threshold> waits and iscurrently at <IntervalRedoLogSpaceWaits> waits.
If you have Tivoli Business Systems Manager configured for your system, TivoliEnterprise Console forwards the message to Tivoli Business Systems Manager.
You can check the health of this resource model in the IBM Tivoli Monitoring WebHealth Console. For more information, see the IBM Tivoli Monitoring Web HealthConsole documentation.
The V$SYSSTAT statistic, ’redo log space requests,’ indicates the number of timesthat the active log file is full and Oracle has to wait for disk space to be allocatedfor redo log entries. The redo log space is created by performing a log switch. Ifthis metric consistently increases, consider increasing the size of the online redo logfiles in order to reduce the number of redo log space waits.
The indication has the following attributes:
DatabaseNameThe name of an Oracle database. The database name contains up to 8characters and corresponds to the name specified in the CREATEDATABASE statement and identified in the DB_NAME parameter in thedatabase initialization parameter file.
InstanceNameThe name of an Oracle database instance. The instance name is identifiedby the INSTANCE_NAME parameter in the database initializationparameter file and corresponds to the Oracle System Identifier (SID) of theinstance.
IntervalRedoLogSpaceWaitsThe number of times Oracle must wait for disk space to be allocated forthe redo log entries because the active log file is full.
This indication has the following threshold:v Maximum Redo Log Space Waits
For more information about this threshold, see “Thresholds” on page 250.
The following table describes the default settings for this indication.
Setting Default value
Send indications to Tivoli Enterprise Console Yes
Send indications to Tivoli Business SystemsManager
Yes
Occurrences 1
Holes 0
Associated tasks and built-in actions None
248 IBM Tivoli Monitoring for Databases: Oracle: Reference Guide

Note: If you have Tivoli Business Systems Manager configured for your systems,Tivoli Enterprise Console automatically forwards events to Tivoli BusinessSystems Manager. Do not change the configuration of the indication to sendevents to Tivoli Business Systems Manager.
High Redo Logs Not Archived indication
Note: This indication is applicable only when the database is running inARCHIVELOG mode. If the database is in NOARCHIVELOG mode, theindication returns a value of zero.
Occurs when the redo logs not archived number exceeds the specified threshold.When the indication occurs often enough to trigger an event, the event delivers amessage to the Tivoli Enterprise Console in the following format:<application_label>: The redo logs not archived for Oracleinstance <InstanceName> has crossed above the predefinedthreshold of <Threshold> redo log filesand is currently at <RedoLogsNotArchived> redo log files.
If you have Tivoli Business Systems Manager configured for your system, TivoliEnterprise Console forwards the message to Tivoli Business Systems Manager.
You can check the health of this resource model in the IBM Tivoli Monitoring WebHealth Console. For more information, see the IBM Tivoli Monitoring Web HealthConsole documentation.
If this indication returns a non-zero value, the ARCH process is having difficultykeeping up with the LGWR process.
The indication has the following attributes:
DatabaseNameThe name of an Oracle database. The database name contains up to 8characters and corresponds to the name specified in the CREATEDATABASE statement and identified in the DB_NAME parameter in thedatabase initialization parameter file.
InstanceNameThe name of an Oracle database instance. The instance name is identifiedby the INSTANCE_NAME parameter in the database initializationparameter file and corresponds to the Oracle System Identifier (SID) of theinstance.
RedoLogsNotArchivedThe number of redo log files that have not been archived.
This indication has the following threshold:v Maximum Redo Logs Not Archived
For more information about this threshold, see “Thresholds” on page 250.
The following table describes the default settings for this indication.
Setting Default value
Send indications to Tivoli Enterprise Console Yes
Send indications to Tivoli Business SystemsManager
Yes
Chapter 2. Resource models 249

Setting Default value
Occurrences 1
Holes 0
Associated tasks and built-in actions None
Note: If you have Tivoli Business Systems Manager configured for your systems,Tivoli Enterprise Console automatically forwards events to Tivoli BusinessSystems Manager. Do not change the configuration of the indication to sendevents to Tivoli Business Systems Manager.
ThresholdsThe following table lists the thresholds that can be set for the Redo Log resourcemodel. For each threshold it shows the name, a short description, and the defaultvalue:
Threshold Description Defaultvalue
Maximum Average RedoEntry Size
An indication occurs if the average redo entrysize exceeds this value.
50000
Maximum RedoAllocation LatchPercentage
An indication occurs if the redo allocation latchpercentage exceeds this value.
3
Maximum Redo CopyLatch Percentage
An indication occurs if the redo copy latchpercentage exceeds this value.
3
Maximum Redo CopyLatch PercentageIncrease
An indication occurs if the increase of redo copylatch percentage exceeds this value.
3
Maximum Redo LogSpace Waits (Interval)
An indication occurs if the number of redo logspace waits exceeds this value.
4
Maximum Redo LogsNot Archived
An indication occurs if the number of redo logsnot archived exceeds this number.
2
Parameters
Note: A plus symbol (+) denotes parameters that feature selective logging.Selective logging enables you to choose metrics/properties that you want tolog. The selective logging metrics are listed in the value field of theParameters window.
The following table lists the parameters that can be set for the Redo Log resourcemodel. The table shows the name, a short description, and the default value foreach parameter:
250 IBM Tivoli Monitoring for Databases: Oracle: Reference Guide
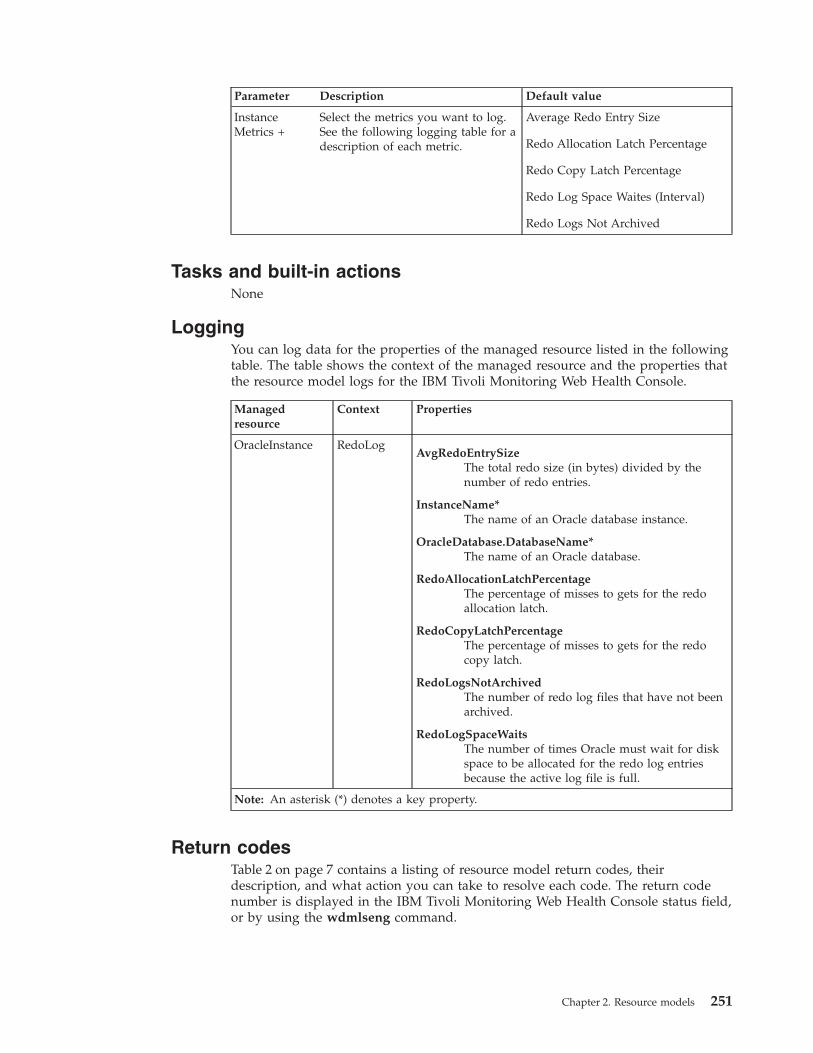
Parameter Description Default value
InstanceMetrics +
Select the metrics you want to log.See the following logging table for adescription of each metric.
Average Redo Entry Size
Redo Allocation Latch Percentage
Redo Copy Latch Percentage
Redo Log Space Waites (Interval)
Redo Logs Not Archived
Tasks and built-in actionsNone
LoggingYou can log data for the properties of the managed resource listed in the followingtable. The table shows the context of the managed resource and the properties thatthe resource model logs for the IBM Tivoli Monitoring Web Health Console.
Managedresource
Context Properties
OracleInstance RedoLogAvgRedoEntrySize
The total redo size (in bytes) divided by thenumber of redo entries.
InstanceName*The name of an Oracle database instance.
OracleDatabase.DatabaseName*The name of an Oracle database.
RedoAllocationLatchPercentageThe percentage of misses to gets for the redoallocation latch.
RedoCopyLatchPercentageThe percentage of misses to gets for the redocopy latch.
RedoLogsNotArchivedThe number of redo log files that have not beenarchived.
RedoLogSpaceWaitsThe number of times Oracle must wait for diskspace to be allocated for the redo log entriesbecause the active log file is full.
Note: An asterisk (*) denotes a key property.
Return codesTable 2 on page 7 contains a listing of resource model return codes, theirdescription, and what action you can take to resolve each code. The return codenumber is displayed in the IBM Tivoli Monitoring Web Health Console status field,or by using the wdmlseng command.
Chapter 2. Resource models 251

CLI examplewdmeditprf -P OracleProfile#tme-region -add OracleRedoLog -c 3600 \-Log -LogDisable -p 12:00 -Agg no -ap 00:15 -NoMin -NoMax -Avg \-t Oracle_Maximum_AvgRedoEntrySize 50000.000000 \-t Oracle_Maximum_RedoAllocationLatchPercentage 3.000000 \-t Oracle_Maximum_RedoCopyLatchPercentage 3.000000 \-t Oracle_Maximum_RedoCopyLatchPercentageIncrease 3.000000 \-t Oracle_Maximum_IntervalRedoLogSpaceWaits 4.000000 \-t Oracle_Maximum_RedoLogsNotArchived 2.000000 \-AddPar InstanceMetrics "numRedoAllocationLatchPercentage" \-AddPar InstanceMetrics "numRedoLogsNotArchived" \-AddPar InstanceMetrics "numAvgRedoEntrySize" \-AddPar InstanceMetrics "IntervalRedoLogSpaceWaits" \-AddPar InstanceMetrics "numRedoCopyLatchPercentage" \-e Oracle_High_IntervalRedoLogSpaceWaits \-o 1 -h 0 -severity CRITICAL -SendTBSM -SendTec \-e Oracle_High_AvgRedoEntrySize \-o 1 -h 0 -severity CRITICAL -SendTBSM -SendTec \-e Oracle_High_RedoCopyLatchPercentage \-o 1 -h 0 -severity CRITICAL -SendTBSM -SendTec \-e Oracle_High_RedoCopyLatchPercentageIncrease \-o 1 -h 0 -severity CRITICAL -SendTBSM -SendTec \-e Oracle_High_RedoLogsNotArchived \-o 1 -h 0 -severity CRITICAL -SendTBSM -SendTec \-e Oracle_High_RedoAllocationLatchPercentage \-o 1 -h 0 -severity CRITICAL -SendTBSM -SendTec
252 IBM Tivoli Monitoring for Databases: Oracle: Reference Guide
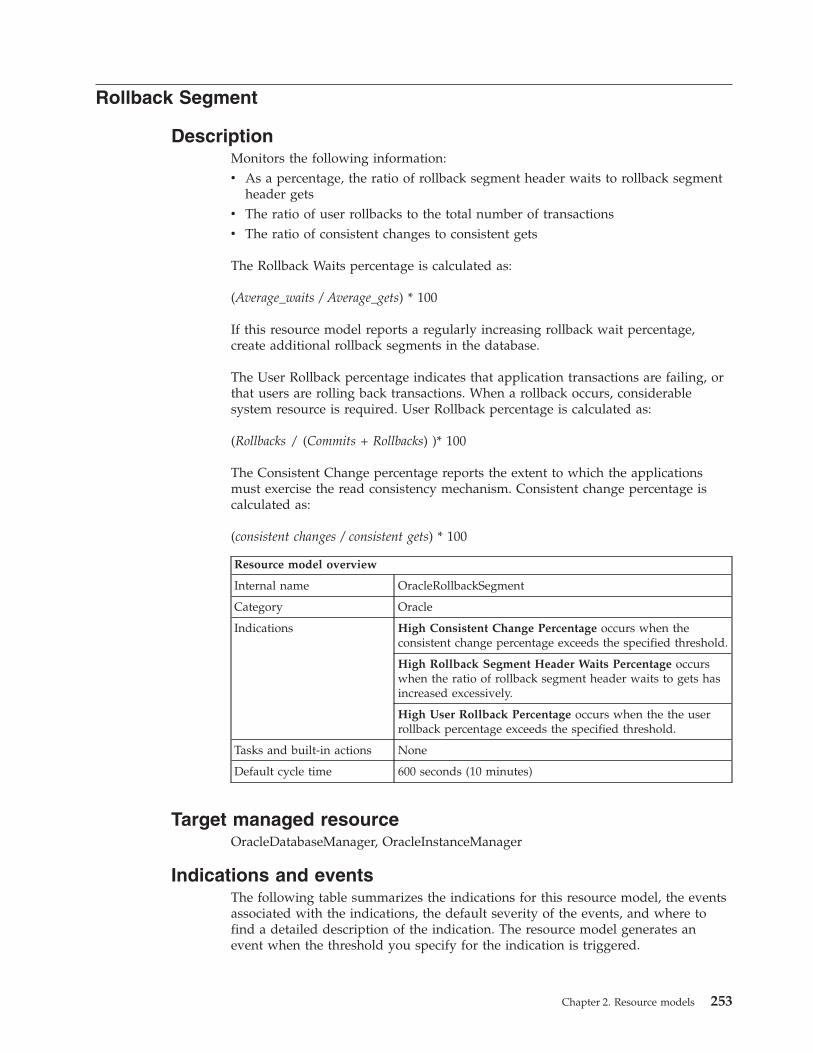
Rollback Segment
DescriptionMonitors the following information:v As a percentage, the ratio of rollback segment header waits to rollback segment
header getsv The ratio of user rollbacks to the total number of transactionsv The ratio of consistent changes to consistent gets
The Rollback Waits percentage is calculated as:
(Average_waits / Average_gets) * 100
If this resource model reports a regularly increasing rollback wait percentage,create additional rollback segments in the database.
The User Rollback percentage indicates that application transactions are failing, orthat users are rolling back transactions. When a rollback occurs, considerablesystem resource is required. User Rollback percentage is calculated as:
(Rollbacks / (Commits + Rollbacks) )* 100
The Consistent Change percentage reports the extent to which the applicationsmust exercise the read consistency mechanism. Consistent change percentage iscalculated as:
(consistent changes / consistent gets) * 100
Resource model overview
Internal name OracleRollbackSegment
Category Oracle
Indications High Consistent Change Percentage occurs when theconsistent change percentage exceeds the specified threshold.
High Rollback Segment Header Waits Percentage occurswhen the ratio of rollback segment header waits to gets hasincreased excessively.
High User Rollback Percentage occurs when the the userrollback percentage exceeds the specified threshold.
Tasks and built-in actions None
Default cycle time 600 seconds (10 minutes)
Target managed resourceOracleDatabaseManager, OracleInstanceManager
Indications and eventsThe following table summarizes the indications for this resource model, the eventsassociated with the indications, the default severity of the events, and where tofind a detailed description of the indication. The resource model generates anevent when the threshold you specify for the indication is triggered.
Chapter 2. Resource models 253

Indication Generated event Defaultseverity
Clearingevents
Page
High ConsistentChangePercentage
Oracle_High_ConsistentChangePercentage
Critical Yes 254
High RollbackSegmentHeader WaitsPercentage
Oracle_High_RollbackWaitsPercentage
Critical Yes 255
High UserRollbackPercentage
Oracle_High_UserRollbackPercentage
Critical Yes 256
High Consistent Change Percentage indicationOccurs when the consistent change percentage exceeds the specified threshold.When the indication occurs often enough to trigger an event, the event delivers amessage to the Tivoli Enterprise Console in the following format:<application_label>: The consistent change percentage for Oracleinstance <InstanceName> has crossed above the predefined thresholdof <Threshold> percent and is currentlyat <ConsistentChangePercentage> percent.
If you have Tivoli Business Systems Manager configured for your system, TivoliEnterprise Console forwards the message to Tivoli Business Systems Manager.
You can check the health of this resource model in the IBM Tivoli Monitoring WebHealth Console. For more information, see the IBM Tivoli Monitoring Web HealthConsole documentation.
The indication has the following attributes:
ConsistentChangePercentageThe percentage of consistent changes to consistent gets.
DatabaseNameThe name of an Oracle database. The database name contains up to 8characters and corresponds to the name specified in the CREATEDATABASE statement and identified in the DB_NAME parameter in thedatabase initialization parameter file.
InstanceNameThe name of an Oracle database instance. The instance name is identifiedby the INSTANCE_NAME parameter in the database initializationparameter file and corresponds to the Oracle System Identifier (SID) of theinstance.
This indication has the following threshold:v Maximum Consistent Change Percentage
For more information about this threshold, see “Thresholds” on page 257.
The following table describes the default settings for this indication.
Setting Default value
Send indications to Tivoli Enterprise Console Yes
254 IBM Tivoli Monitoring for Databases: Oracle: Reference Guide

Setting Default value
Send indications to Tivoli Business SystemsManager
Yes
Occurrences 1
Holes 0
Associated tasks and built-in actions None
Note: If you have Tivoli Business Systems Manager configured for your systems,Tivoli Enterprise Console automatically forwards events to Tivoli BusinessSystems Manager. Do not change the configuration of the indication to sendevents to Tivoli Business Systems Manager.
High Rollback Segment Header Waits Percentage indicationOccurs when the ratio of rollback segment header waits to gets has increasedexcessively. When the indication occurs often enough to trigger an event, the eventdelivers a message to the Tivoli Enterprise Console in the following format:<application_label>: The rollback segment waits percentage for Oracledatabase <DatabaseName> has crossed above the predefined threshold of<Threshold> percent and is currentlyat <RollbackWaitsPercentage> percent.
If you have Tivoli Business Systems Manager configured for your system, TivoliEnterprise Console forwards the message to Tivoli Business Systems Manager.
You can check the health of this resource model in the IBM Tivoli Monitoring WebHealth Console. For more information, see the IBM Tivoli Monitoring Web HealthConsole documentation.
The indication has the following attributes:
DatabaseNameThe name of an Oracle database. The database name contains up to 8characters and corresponds to the name specified in the CREATEDATABASE statement and identified in the DB_NAME parameter in thedatabase initialization parameter file.
InstanceNameThe name of an Oracle database instance. The instance name is identifiedby the INSTANCE_NAME parameter in the database initializationparameter file and corresponds to the Oracle System Identifier (SID) of theinstance.
Rollback WaitsPercentageThe percentage of rollback segment header waits on a specified data blockfor a specified length of time.
This indication has the following threshold:v Maximum Rollback Segment Header Waits Percentage
For more information about this threshold, see “Thresholds” on page 257.
The following table describes the default settings for this indication.
Setting Default value
Send indications to Tivoli Enterprise Console Yes
Chapter 2. Resource models 255

Setting Default value
Send indications to Tivoli Business SystemsManager
Yes
Occurrences 1
Holes 0
Associated tasks and built-in actions None
Note: If you have Tivoli Business Systems Manager configured for your systems,Tivoli Enterprise Console automatically forwards events to Tivoli BusinessSystems Manager. Do not change the configuration of the indication to sendevents to Tivoli Business Systems Manager.
High User Rollback Percentage indicationOccurs when the the user rollback percentage exceeds the specified threshold.When the indication occurs often enough to trigger an event, the event delivers amessage to the Tivoli Enterprise Console in the following format:<application_label>: The user rollback percentage for Oracledatabase <DatabaseName> has crossed above the predefined thresholdof <Threshold> percent and is currentlyat <UserRollbackPercentage> percent.
If you have Tivoli Business Systems Manager configured for your system, TivoliEnterprise Console forwards the message to Tivoli Business Systems Manager.
You can check the health of this resource model in the IBM Tivoli Monitoring WebHealth Console. For more information, see the IBM Tivoli Monitoring Web HealthConsole documentation.
The indication has the following attributes:
DatabaseNameThe name of an Oracle database. The database name contains up to 8characters and corresponds to the name specified in the CREATEDATABASE statement and identified in the DB_NAME parameter in thedatabase initialization parameter file.
InstanceNameThe name of an Oracle database instance. The instance name is identifiedby the INSTANCE_NAME parameter in the database initializationparameter file and corresponds to the Oracle System Identifier (SID) of theinstance.
UserRollbackPercentageA percentage of the number of times users manually issue the ROLLBACKstatement or an error occurs when a user attempts a transaction.
This indication has the following threshold:v Maximum User Rollback Percentage
For more information about this threshold, see “Thresholds” on page 257.
The following table describes the default settings for this indication.
Setting Default value
Send indications to Tivoli Enterprise Console Yes
256 IBM Tivoli Monitoring for Databases: Oracle: Reference Guide

Setting Default value
Send indications to Tivoli Business SystemsManager
Yes
Occurrences 1
Holes 0
Associated tasks and built-in actions None
Note: If you have Tivoli Business Systems Manager configured for your systems,Tivoli Enterprise Console automatically forwards events to Tivoli BusinessSystems Manager. Do not change the configuration of the indication to sendevents to Tivoli Business Systems Manager.
ThresholdsThe following table lists the thresholds that can be set for the Rollback Segmentresource model. For each threshold it shows the name, a short description, and thedefault value:
Threshold Description Defaultvalue
Maximum ConsistentChange Percentage
An indication occurs if the consistent changepercentage exceeds this value.
15
MaximumRollbackSegment Header WaitsPercentage
An indication occurs if the percentage of rollbacksegment header waits relative to gets exceeds thisvalue.
2
Maximum User RollbackPercentage
An indication occurs if the user rollbackpercentage exceeds this value.
20
Parameters
Note: A plus symbol (+) denotes parameters that feature selective logging.Selective logging enables you to choose metrics/properties that you want tolog. The selective logging metrics are listed in the value field of theParameters window.
The following table lists the parameters that can be set for the Rollback Segmentresource model. The table shows the name, a short description, and the defaultvalue for each parameter:
Parameter Description Default value
InstanceMetrics +
Select the metrics you want to log.See the following logging table for adescription of each metric.
Consistent Change Percentage
Rollback Waits Percentage
User Rollback Percentage
Tasks and built-in actionsNone
Chapter 2. Resource models 257

LoggingYou can log data for the properties of the managed resource listed in the followingtable. The table shows the context of the managed resource and the properties thatthe resource model logs for the IBM Tivoli Monitoring Web Health Console.
Managed resource Context Properties
OracleInstance RolllbackConsistentChangePercentage
The percentage of consistent changes toconsistent gets.
InstanceName*The name of an Oracle databaseinstance.
OracleDatabase.DatabaseName*The name of an Oracle database.
RollbackWaitsPercentageThe percentage of rollback segmentheader waits on a specified data blockfor a specified length of time.
UserRollbackPercentageA percentage of the number of timesusers manually issue the ROLLBACKstatement or an error occurs when a userattempts a transaction.
Note: An asterisk (*) denotes a key property.
Return codesTable 2 on page 7 contains a listing of resource model return codes, theirdescription, and what action you can take to resolve each code. The return codenumber is displayed in the IBM Tivoli Monitoring Web Health Console status field,or by using the wdmlseng command.
CLI examplewdmeditprf -P OracleProfile#tme-region -add OracleRollbackSegment -c 600 \-Log -LogDisable -p 12:00 -Agg no -ap 00:15 -NoMin -NoMax -Avg \-t Oracle_Maximum_ConsistentChangePercentage 15.000000 \-t Oracle_Maximum_RollbackWaitsPercentage 2.000000 \-t Oracle_Maximum_UserRollbackPercentage 20.000000 \-AddPar InstanceMetrics "numConsistentChangePercentage" \-AddPar InstanceMetrics "RollbackWaitsPercentage" \-AddPar InstanceMetrics "UserRollbackPercentage" \-e Oracle_High_ConsistentChangePercentage \-o 1 -h 0 -severity CRITICAL -SendTBSM -SendTec \-e Oracle_High_UserRollbackPercentage \-o 1 -h 0 -severity CRITICAL -SendTBSM -SendTec \-e Oracle_High_RollbackWaitsPercentage \-o 1 -h 0 -severity WARNING -SendTBSM -SendTec
258 IBM Tivoli Monitoring for Databases: Oracle: Reference Guide

SGA
DescriptionMonitors the following:v The rate at which Oracle finds the data blocks it needs in memory over the
lifetime of an instance and for the current monitoring interval. The outputindicates the current ratio of buffer cache hits to total requests
v The effectiveness of the dictionary cache over the lifetime of an instance and forthe current monitoring interval. The output shows the ratio, as a percentage, ofdictionary cache hits to total requests for the monitoring interval
v The percentage of entries in the library cache that were parsed more than once(reloads) over the lifetime of the instance and for the current monitoring interval
The SGA, System Global Area, stores a group of shared memory structures thatcontain data and control information for one Oracle database instance. The databasebuffer cache is a section of the SGA that stores copies of data blocks read fromdatafiles. The database buffer cache is shared by all user processes concurrentlyconnected to the instance. The library cache is a memory structure in the SGA thatcontains locks, shared SQL and PL/SQL areas. The dictionary cache storesinformation from the data dictionary, including a collection of database tables andviews containing reference information about the database, its structures, and itsusers.
Run the Oracle SGA resource model after the instance has run long enough to havea representative workload. When an instance is started, the Oracle caches areempty and the cache hit rate is low, so running the resource model at this timereturns misleading results.
Resource model overview
Internal name OracleSGA
Category Oracle
Chapter 2. Resource models 259
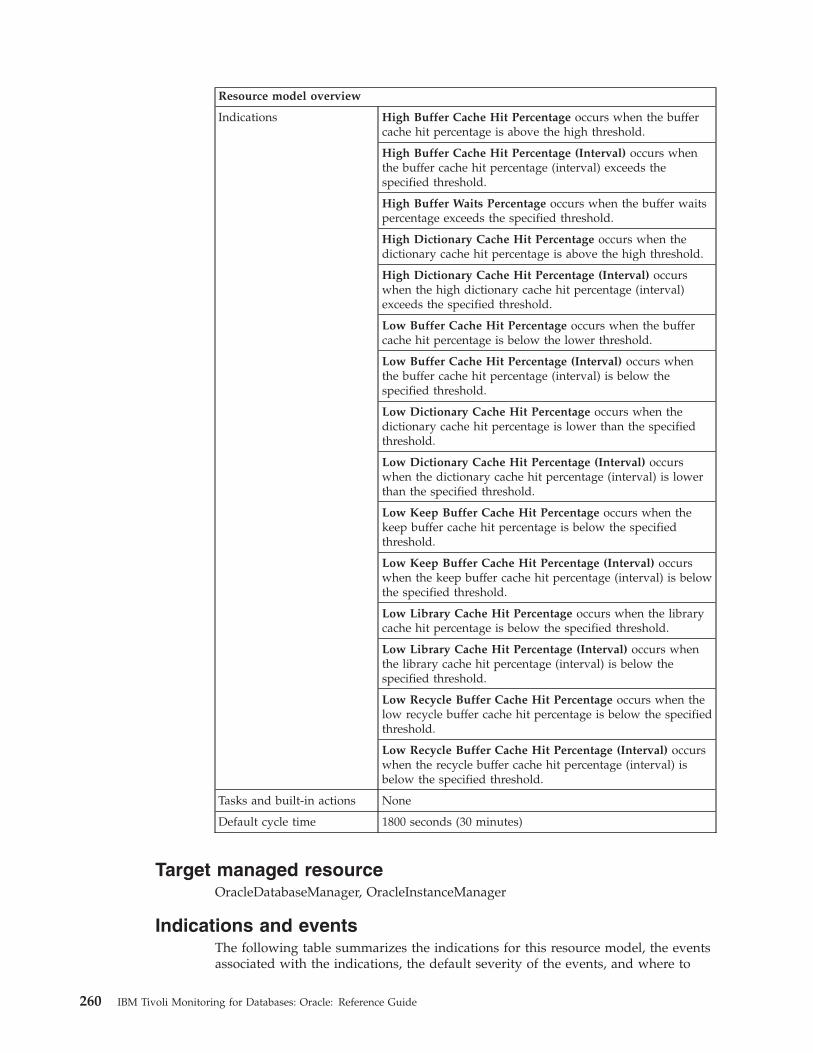
Resource model overview
Indications High Buffer Cache Hit Percentage occurs when the buffercache hit percentage is above the high threshold.
High Buffer Cache Hit Percentage (Interval) occurs whenthe buffer cache hit percentage (interval) exceeds thespecified threshold.
High Buffer Waits Percentage occurs when the buffer waitspercentage exceeds the specified threshold.
High Dictionary Cache Hit Percentage occurs when thedictionary cache hit percentage is above the high threshold.
High Dictionary Cache Hit Percentage (Interval) occurswhen the high dictionary cache hit percentage (interval)exceeds the specified threshold.
Low Buffer Cache Hit Percentage occurs when the buffercache hit percentage is below the lower threshold.
Low Buffer Cache Hit Percentage (Interval) occurs whenthe buffer cache hit percentage (interval) is below thespecified threshold.
Low Dictionary Cache Hit Percentage occurs when thedictionary cache hit percentage is lower than the specifiedthreshold.
Low Dictionary Cache Hit Percentage (Interval) occurswhen the dictionary cache hit percentage (interval) is lowerthan the specified threshold.
Low Keep Buffer Cache Hit Percentage occurs when thekeep buffer cache hit percentage is below the specifiedthreshold.
Low Keep Buffer Cache Hit Percentage (Interval) occurswhen the keep buffer cache hit percentage (interval) is belowthe specified threshold.
Low Library Cache Hit Percentage occurs when the librarycache hit percentage is below the specified threshold.
Low Library Cache Hit Percentage (Interval) occurs whenthe library cache hit percentage (interval) is below thespecified threshold.
Low Recycle Buffer Cache Hit Percentage occurs when thelow recycle buffer cache hit percentage is below the specifiedthreshold.
Low Recycle Buffer Cache Hit Percentage (Interval) occurswhen the recycle buffer cache hit percentage (interval) isbelow the specified threshold.
Tasks and built-in actions None
Default cycle time 1800 seconds (30 minutes)
Target managed resourceOracleDatabaseManager, OracleInstanceManager
Indications and eventsThe following table summarizes the indications for this resource model, the eventsassociated with the indications, the default severity of the events, and where to
260 IBM Tivoli Monitoring for Databases: Oracle: Reference Guide

find a detailed description of the indication. The resource model generates anevent when the threshold you specify for the indication is triggered.
Indication Generated event Defaultseverity
Clearingevents
Page
High BufferCache HitPercentage
Oracle_High_BufferCacheHitPercentage
Critical Yes 262
High BufferCache HitPercentage(Interval)
Oracle_High_IntervalBufferCacheHitPercentage
Critical Yes 263
High BufferWaitsPercentage
Oracle_High_BufferWaitsPercentage
Critical Yes 264
HighDictionaryCache HitPercentage
Oracle_High_DictionaryCacheHitPercentage
Critical Yes 265
HighDictionaryCache HitPercentage(Interval)
Oracle_High_IntervalDictionaryCacheHitPercentage
Critical Yes 266
Low BufferCache HitPercentage
Oracle_Low_BufferCacheHitPercentage
Warning Yes 268
Low BufferCache HitPercentage(Interval)
Oracle_Low_IntervalBufferCacheHitPercentage
Critical Yes 269
LowDictionaryCache HitPercentage
Oracle_Low_DictionaryCacheHitPercentage
Critical Yes 270
LowDictionaryCache HitPercentage(Interval)
Oracle_Low_IntervalDictionaryCacheHitPercentage
Critical Yes 271
Low KeepBuffer CacheHitPercentage
Oracle_Low_KeepCacheHitPercentage
Critical Yes 272
Low KeepBuffer CacheHitPercentage(Interval)
Oracle_Low_IntervalKeepCacheHitPercentage
Critical Yes 273
Low LibraryCache HitPercentage
Oracle_Low_LibraryCacheHitPercentage
Critical Yes 274
Chapter 2. Resource models 261

Indication Generated event Defaultseverity
Clearingevents
Page
Low LibraryCache HitPercentage(Interval)
Oracle_Low_IntervalLibraryCacheHitPercentage
Critical Yes 275
Low RecycleBuffer CacheHitPercentage
Oracle_Low_RecycleCacheHitPercentage
Critical Yes 276
Low RecycleBuffer CacheHitPercentage(Interval)
Oracle_Low_IntervalRecycleCacheHitPercentage
Critical Yes 277
High Buffer Cache Hit Percentage indicationOccurs when the buffer cache hit percentage is above the high threshold. When theindication occurs often enough to trigger an event, the event delivers a message tothe Tivoli Enterprise Console in the following format:<application_label>: The buffer cache hit percentage for Oracleinstance <InstanceName> has crossed above the predefined thresholdof <Threshold> percent and is currentlyat <BufferCacheHitPercentage> percent.
If you have Tivoli Business Systems Manager configured for your system, TivoliEnterprise Console forwards the message to Tivoli Business Systems Manager.
You can check the health of this resource model in the IBM Tivoli Monitoring WebHealth Console. For more information, see the IBM Tivoli Monitoring Web HealthConsole documentation.
If the high buffer cache hit percentage exceeds 97%, you may be able to makebetter use of available memory while still maintaining good performance bydecreasing the database buffer cache size. Decrease the value of the initializationparameter DB_BLOCK_BUFFERS for Oracle 8i, or DB_CACHE_SIZE for Oracle 9i.
The indication has the following attributes:
BufferCacheHitPercentageThe percentage of the buffer cache hits to total requests over the lifetime ofan instance. The percentage calculates how often a requested block isfound in the buffer cache without requiring disk access. The buffer cache isthe portion of the SGA that holds copies of Oracle data blocks. All userprocesses that are connected to the instance share access to the buffercache.
DatabaseNameThe name of an Oracle database. The database name contains up to 8characters and corresponds to the name specified in the CREATEDATABASE statement and identified in the DB_NAME parameter in thedatabase initialization parameter file.
InstanceNameThe name of an Oracle database instance. The instance name is identified
262 IBM Tivoli Monitoring for Databases: Oracle: Reference Guide

by the INSTANCE_NAME parameter in the database initializationparameter file and corresponds to the Oracle System Identifier (SID) of theinstance.
This indication has the following threshold:v Maximum Buffer Cache Hit Percentage
For more information about this threshold, see “Thresholds” on page 278.
The following table describes the default settings for this indication.
Setting Default value
Send indications to Tivoli Enterprise Console Yes
Send indications to Tivoli Business SystemsManager
Yes
Occurrences 1
Holes 0
Associated tasks and built-in actions None
Note: If you have Tivoli Business Systems Manager configured for your systems,Tivoli Enterprise Console automatically forwards events to Tivoli BusinessSystems Manager. Do not change the configuration of the indication to sendevents to Tivoli Business Systems Manager.
High Buffer Cache Hit Percentage (Interval) indicationOccurs when the buffer cache hit percentage (interval) exceeds the specifiedthreshold. When the indication occurs often enough to trigger an event, the eventdelivers a message to the Tivoli Enterprise Console in the following format:<application_label>: The buffer cache hit percentage (interval) for Oracleinstance <InstanceName> has crossed above the predefined threshold of<Threshold> percent and is currently at<IntervalBufferCacheHitPercentage> percent.
If you have Tivoli Business Systems Manager configured for your system, TivoliEnterprise Console forwards the message to Tivoli Business Systems Manager.
You can check the health of this resource model in the IBM Tivoli Monitoring WebHealth Console. For more information, see the IBM Tivoli Monitoring Web HealthConsole documentation.
If Buffer Cache Hit Ratio is too high, consider decreasing database buffer cachesize by decreasing the value of the initialization parameter DB_BLOCK_BUFFERS(DB_CACHE_SIZE for Oracle9i).
The indication has the following attributes:
DatabaseNameThe name of an Oracle database. The database name contains up to 8characters and corresponds to the name specified in the CREATEDATABASE statement and identified in the DB_NAME parameter in thedatabase initialization parameter file.
InstanceNameThe name of an Oracle database instance. The instance name is identified
Chapter 2. Resource models 263

by the INSTANCE_NAME parameter in the database initializationparameter file and corresponds to the Oracle System Identifier (SID) of theinstance.
IntervalBufferCacheHitPercentageThe percentage of the interval buffer cache hits to total requests over theover the time interval for which the resource model was run. Thepercentage calculates how often a requested block is found in the buffercache without requiring disk access. The buffer cache is the portion of theSGA that holds copies of Oracle data blocks. All user processes that areconnected to the instance share access to the buffer cache.
This indication has the following threshold:v Maximum Buffer Cache Hit Percentage (Interval)
For more information about this threshold, see “Thresholds” on page 278.
The following table describes the default settings for this indication.
Setting Default value
Send indications to Tivoli Enterprise Console Yes
Send indications to Tivoli Business SystemsManager
Yes
Occurrences 1
Holes 0
Associated tasks and built-in actions None
Note: If you have Tivoli Business Systems Manager configured for your systems,Tivoli Enterprise Console automatically forwards events to Tivoli BusinessSystems Manager. Do not change the configuration of the indication to sendevents to Tivoli Business Systems Manager.
High Buffer Waits Percentage indicationOccurs when the buffer waits percentage exceeds the specified threshold. When theindication occurs often enough to trigger an event, the event delivers a message tothe Tivoli Enterprise Console in the following format:<application_label>: The buffer waits percentage for Oracle instance<InstanceName> has crossed below the predefined threshold of<Threshold> percent and is currently at <BufferWaitsPercentage> percent.
If you have Tivoli Business Systems Manager configured for your system, TivoliEnterprise Console forwards the message to Tivoli Business Systems Manager.
You can check the health of this resource model in the IBM Tivoli Monitoring WebHealth Console. For more information, see the IBM Tivoli Monitoring Web HealthConsole documentation.
A non-zero value for this percentage indicates that block contention is occurring.Query the v$waitstat table to determine what kind of waits are occurring. Havingstudied this table, note the following: Avoid resource waits of any kind. If undorollback segment waits are occurring, increase the number of private rollbacksegments the monitored database contains. Run the Rollback Segment resourcemodel to examine rollback segment waits. If data block waits are occurring,increase the FREELIST parameter for heavily inserted tables. If in doubt, setFREELIST to 2 for tables suspected of being an insert or update bottleneck. Use the
264 IBM Tivoli Monitoring for Databases: Oracle: Reference Guide

Freelist Waits Percentage from the Other Performance Monitors resource model tospecifically check for this form of block contention.
The indication has the following attributes:
DatabaseNameThe name of an Oracle database. The database name contains up to 8characters and corresponds to the name specified in the CREATEDATABASE statement and identified in the DB_NAME parameter in thedatabase initialization parameter file.
InstanceNameThe name of an Oracle database instance. The instance name is identifiedby the INSTANCE_NAME parameter in the database initializationparameter file and corresponds to the Oracle System Identifier (SID) of theinstance.
BufferWaitsPercentageThe percentage of buffer busy waits to logical reads. This indicates that auser process attempted to acquire a buffer but had to wait because thebuffer was held in an incompatible mode.
This indication has the following threshold:v Maximum Buffer Waits Percentage
For more information about this threshold, see “Thresholds” on page 278.
The following table describes the default settings for this indication.
Setting Default value
Send indications to Tivoli Enterprise Console Yes
Send indications to Tivoli Business SystemsManager
Yes
Occurrences 1
Holes 0
Associated tasks and built-in actions None
Note: If you have Tivoli Business Systems Manager configured for your systems,Tivoli Enterprise Console automatically forwards events to Tivoli BusinessSystems Manager. Do not change the configuration of the indication to sendevents to Tivoli Business Systems Manager.
High Dictionary Cache Hit Percentage indicationOccurs when the dictionary cache hit percentage exceeds the high threshold. Whenthe indication occurs often enough to trigger an event, the event delivers amessage to the Tivoli Enterprise Console in the following format:<application_label>: The dictionary cache hit percentage for Oracleinstance <InstanceName> has crossed above the predefined thresholdof <Threshold> percent and is currentlyat <DictionaryCacheHitPercentage> percent.
If you have Tivoli Business Systems Manager configured for your system, TivoliEnterprise Console forwards the message to Tivoli Business Systems Manager.
Chapter 2. Resource models 265

You can check the health of this resource model in the IBM Tivoli Monitoring WebHealth Console. For more information, see the IBM Tivoli Monitoring Web HealthConsole documentation.
You might be able to make better use of available memory while still maintaininggood performance by decreasing the data dictionary cache size. Achieve this bydecreasing the value of the SHARED_POOL_SIZE initialization parameter.
The indication has the following attributes:
DatabaseNameThe name of an Oracle database. The database name contains up to 8characters and corresponds to the name specified in the CREATEDATABASE statement and identified in the DB_NAME parameter in thedatabase initialization parameter file.
DictionaryCacheHitPercentageThe ratio, as a percentage, of dictionary cache hits to total requests. If thehit ratio is less than 70%, increase the value of the SHARED_POOL_SIZEinitialization parameter. The dictionary cache is a collection of databasetables and views containing data about the database, its structures, and itsusers. The dictionary cache is also known as the row cache because itholds data as rows instead of buffers (which hold entire blocks of data).
InstanceNameThe name of an Oracle database instance. The instance name is identifiedby the INSTANCE_NAME parameter in the database initializationparameter file and corresponds to the Oracle System Identifier (SID) of theinstance.
This indication has the following threshold:v Maximum Dictionary Cache Hit Percentage
For more information about this threshold, see “Thresholds” on page 278.
The following table describes the default settings for this indication.
Setting Default value
Send indications to Tivoli Enterprise Console Yes
Send indications to Tivoli Business SystemsManager
Yes
Occurrences 1
Holes 0
Associated tasks and built-in actions None
Note: If you have Tivoli Business Systems Manager configured for your systems,Tivoli Enterprise Console automatically forwards events to Tivoli BusinessSystems Manager. Do not change the configuration of the indication to sendevents to Tivoli Business Systems Manager.
High Dictionary Cache Hit Percentage (Interval) indicationOccurs when the high dictionary cache hit percentage (interval) exceeds thespecified threshold. When the indication occurs often enough to trigger an event,the event delivers a message to the Tivoli Enterprise Console in the followingformat:
266 IBM Tivoli Monitoring for Databases: Oracle: Reference Guide

<application_label>: The dictionary cache hit percentage (interval) for Oracleinstance <InstanceName> has crossed above the predefined threshold of<Threshold> percent and is currently at<IntervalDictionaryCacheHitPercentage> percent.
If you have Tivoli Business Systems Manager configured for your system, TivoliEnterprise Console forwards the message to Tivoli Business Systems Manager.
You can check the health of this resource model in the IBM Tivoli Monitoring WebHealth Console. For more information, see the IBM Tivoli Monitoring Web HealthConsole documentation.
You might be able to make better use of available memory while still maintaininggood performance by decreasing the data dictionary cache size. Achieve this bydecreasing the value of the SHARED_POOL_SIZE initialization parameter.
The indication has the following attributes:
DatabaseNameThe name of an Oracle database. The database name contains up to 8characters and corresponds to the name specified in the CREATEDATABASE statement and identified in the DB_NAME parameter in thedatabase initialization parameter file.
InstanceNameThe name of an Oracle database instance. The instance name is identifiedby the INSTANCE_NAME parameter in the database initializationparameter file and corresponds to the Oracle System Identifier (SID) of theinstance.
IntervalDictionaryCacheHitPercentageThe percentage of entries in the library cache that were reloads (parsedmore than once) over the time interval for which the resource model wasrun. Strive to have reloads as near to zero as possible. The library cachestores executable forms of SQL cursors, PL/SQL programs, and Javaclasses.
This indication has the following threshold:v Maximum Dictionary Cache Hit Percentage (Interval)
For more information about this threshold, see “Thresholds” on page 278.
The following table describes the default settings for this indication.
Setting Default value
Send indications to Tivoli Enterprise Console Yes
Send indications to Tivoli Business SystemsManager
Yes
Occurrences 1
Holes 0
Associated tasks and built-in actions None
Note: If you have Tivoli Business Systems Manager configured for your systems,Tivoli Enterprise Console automatically forwards events to Tivoli BusinessSystems Manager. Do not change the configuration of the indication to sendevents to Tivoli Business Systems Manager.
Chapter 2. Resource models 267
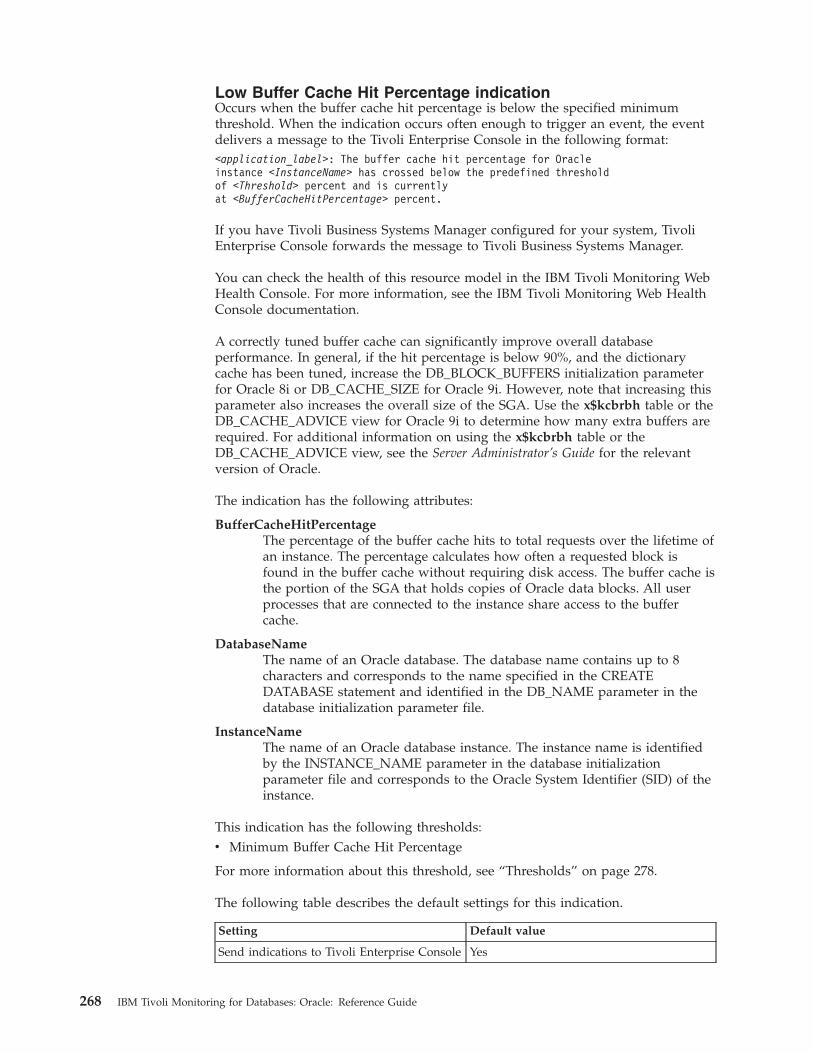
Low Buffer Cache Hit Percentage indicationOccurs when the buffer cache hit percentage is below the specified minimumthreshold. When the indication occurs often enough to trigger an event, the eventdelivers a message to the Tivoli Enterprise Console in the following format:<application_label>: The buffer cache hit percentage for Oracleinstance <InstanceName> has crossed below the predefined thresholdof <Threshold> percent and is currentlyat <BufferCacheHitPercentage> percent.
If you have Tivoli Business Systems Manager configured for your system, TivoliEnterprise Console forwards the message to Tivoli Business Systems Manager.
You can check the health of this resource model in the IBM Tivoli Monitoring WebHealth Console. For more information, see the IBM Tivoli Monitoring Web HealthConsole documentation.
A correctly tuned buffer cache can significantly improve overall databaseperformance. In general, if the hit percentage is below 90%, and the dictionarycache has been tuned, increase the DB_BLOCK_BUFFERS initialization parameterfor Oracle 8i or DB_CACHE_SIZE for Oracle 9i. However, note that increasing thisparameter also increases the overall size of the SGA. Use the x$kcbrbh table or theDB_CACHE_ADVICE view for Oracle 9i to determine how many extra buffers arerequired. For additional information on using the x$kcbrbh table or theDB_CACHE_ADVICE view, see the Server Administrator’s Guide for the relevantversion of Oracle.
The indication has the following attributes:
BufferCacheHitPercentageThe percentage of the buffer cache hits to total requests over the lifetime ofan instance. The percentage calculates how often a requested block isfound in the buffer cache without requiring disk access. The buffer cache isthe portion of the SGA that holds copies of Oracle data blocks. All userprocesses that are connected to the instance share access to the buffercache.
DatabaseNameThe name of an Oracle database. The database name contains up to 8characters and corresponds to the name specified in the CREATEDATABASE statement and identified in the DB_NAME parameter in thedatabase initialization parameter file.
InstanceNameThe name of an Oracle database instance. The instance name is identifiedby the INSTANCE_NAME parameter in the database initializationparameter file and corresponds to the Oracle System Identifier (SID) of theinstance.
This indication has the following thresholds:v Minimum Buffer Cache Hit Percentage
For more information about this threshold, see “Thresholds” on page 278.
The following table describes the default settings for this indication.
Setting Default value
Send indications to Tivoli Enterprise Console Yes
268 IBM Tivoli Monitoring for Databases: Oracle: Reference Guide
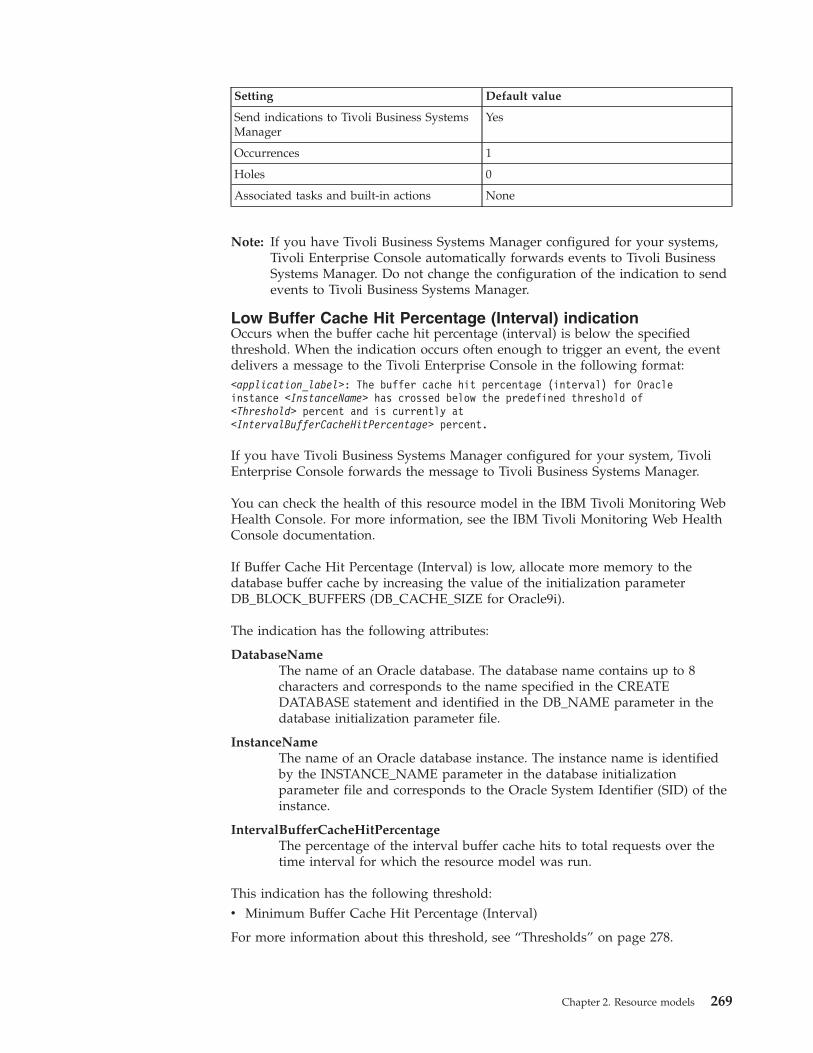
Setting Default value
Send indications to Tivoli Business SystemsManager
Yes
Occurrences 1
Holes 0
Associated tasks and built-in actions None
Note: If you have Tivoli Business Systems Manager configured for your systems,Tivoli Enterprise Console automatically forwards events to Tivoli BusinessSystems Manager. Do not change the configuration of the indication to sendevents to Tivoli Business Systems Manager.
Low Buffer Cache Hit Percentage (Interval) indicationOccurs when the buffer cache hit percentage (interval) is below the specifiedthreshold. When the indication occurs often enough to trigger an event, the eventdelivers a message to the Tivoli Enterprise Console in the following format:<application_label>: The buffer cache hit percentage (interval) for Oracleinstance <InstanceName> has crossed below the predefined threshold of<Threshold> percent and is currently at<IntervalBufferCacheHitPercentage> percent.
If you have Tivoli Business Systems Manager configured for your system, TivoliEnterprise Console forwards the message to Tivoli Business Systems Manager.
You can check the health of this resource model in the IBM Tivoli Monitoring WebHealth Console. For more information, see the IBM Tivoli Monitoring Web HealthConsole documentation.
If Buffer Cache Hit Percentage (Interval) is low, allocate more memory to thedatabase buffer cache by increasing the value of the initialization parameterDB_BLOCK_BUFFERS (DB_CACHE_SIZE for Oracle9i).
The indication has the following attributes:
DatabaseNameThe name of an Oracle database. The database name contains up to 8characters and corresponds to the name specified in the CREATEDATABASE statement and identified in the DB_NAME parameter in thedatabase initialization parameter file.
InstanceNameThe name of an Oracle database instance. The instance name is identifiedby the INSTANCE_NAME parameter in the database initializationparameter file and corresponds to the Oracle System Identifier (SID) of theinstance.
IntervalBufferCacheHitPercentageThe percentage of the interval buffer cache hits to total requests over thetime interval for which the resource model was run.
This indication has the following threshold:v Minimum Buffer Cache Hit Percentage (Interval)
For more information about this threshold, see “Thresholds” on page 278.
Chapter 2. Resource models 269

The following table describes the default settings for this indication.
Setting Default value
Send indications to Tivoli Enterprise Console Yes
Send indications to Tivoli Business SystemsManager
Yes
Occurrences 1
Holes 0
Associated tasks and built-in actions None
Note: If you have Tivoli Business Systems Manager configured for your systems,Tivoli Enterprise Console automatically forwards events to Tivoli BusinessSystems Manager. Do not change the configuration of the indication to sendevents to Tivoli Business Systems Manager.
Low Dictionary Cache Hit Percentage indicationOccurs when the dictionary cache hit percentage is lower than the specifiedthreshold. When the indication occurs often enough to trigger an event, the eventdelivers a message to the Tivoli Enterprise Console in the following format:<application_label>: The dictionary cache hit percentage for Oracleinstance <InstanceName> has crossed below the predefined thresholdof <Threshold> percent and is currentlyat <DictionaryCacheHitPercentage> percent.
If you have Tivoli Business Systems Manager configured for your system, TivoliEnterprise Console forwards the message to Tivoli Business Systems Manager.
You can check the health of this resource model in the IBM Tivoli Monitoring WebHealth Console. For more information, see the IBM Tivoli Monitoring Web HealthConsole documentation.
If the dictionary cache hit percentage is less than 85%, increase the value of theSHARED_POOL_SIZE initialization parameter. Note that increasingSHARED_POOL_SIZE will increase the size of the SGA. If this is madeunnecessarily large, it will impact the amount of memory that is available to otherprocesses.
The indication has the following attributes:
DatabaseNameThe name of an Oracle database. The database name contains up to 8characters and corresponds to the name specified in the CREATEDATABASE statement and identified in the DB_NAME parameter in thedatabase initialization parameter file.
DictionaryCacheHitPercentageThe ratio, as a percentage, of dictionary cache hits to total requests. If thehit ratio is less than 85%, increase the value of the SHARED_POOL_SIZEinitialization parameter. The dictionary cache is a collection of databasetables and views containing data about the database, its structures, and itsusers. The dictionary cache is also known as the row cache because itholds data as rows instead of buffers (which hold entire blocks of data).
InstanceNameThe name of an Oracle database instance. The instance name is identified
270 IBM Tivoli Monitoring for Databases: Oracle: Reference Guide
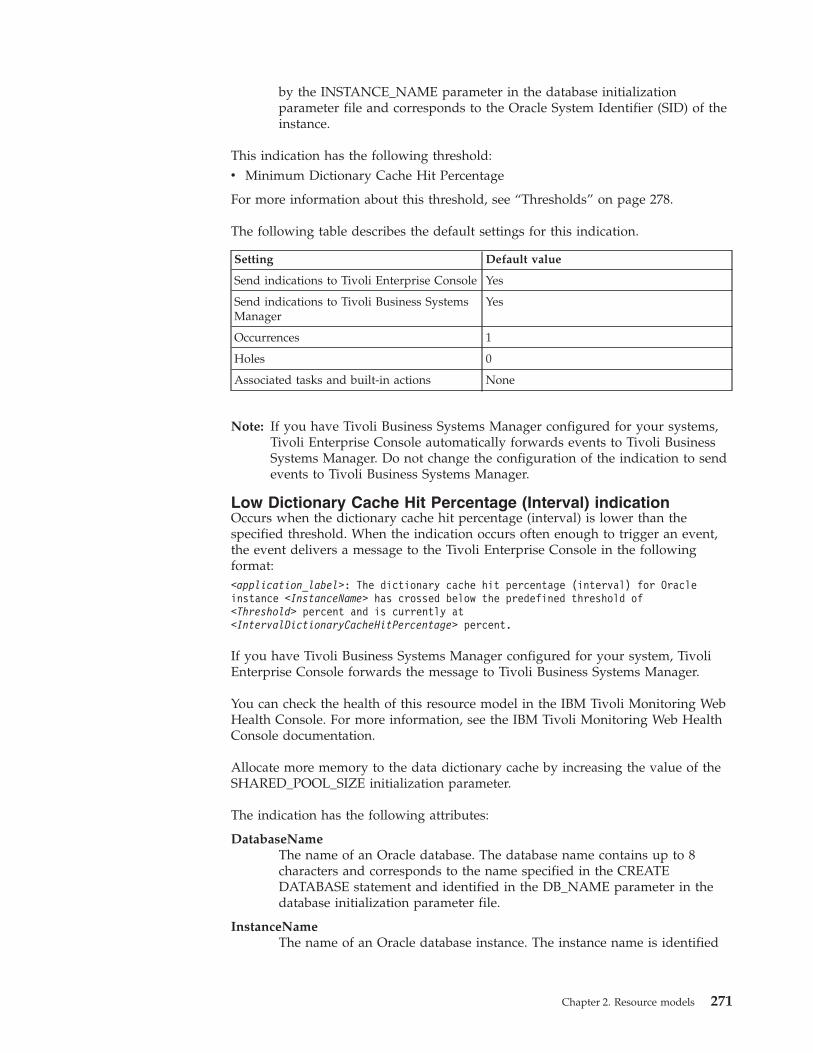
by the INSTANCE_NAME parameter in the database initializationparameter file and corresponds to the Oracle System Identifier (SID) of theinstance.
This indication has the following threshold:v Minimum Dictionary Cache Hit Percentage
For more information about this threshold, see “Thresholds” on page 278.
The following table describes the default settings for this indication.
Setting Default value
Send indications to Tivoli Enterprise Console Yes
Send indications to Tivoli Business SystemsManager
Yes
Occurrences 1
Holes 0
Associated tasks and built-in actions None
Note: If you have Tivoli Business Systems Manager configured for your systems,Tivoli Enterprise Console automatically forwards events to Tivoli BusinessSystems Manager. Do not change the configuration of the indication to sendevents to Tivoli Business Systems Manager.
Low Dictionary Cache Hit Percentage (Interval) indicationOccurs when the dictionary cache hit percentage (interval) is lower than thespecified threshold. When the indication occurs often enough to trigger an event,the event delivers a message to the Tivoli Enterprise Console in the followingformat:<application_label>: The dictionary cache hit percentage (interval) for Oracleinstance <InstanceName> has crossed below the predefined threshold of<Threshold> percent and is currently at<IntervalDictionaryCacheHitPercentage> percent.
If you have Tivoli Business Systems Manager configured for your system, TivoliEnterprise Console forwards the message to Tivoli Business Systems Manager.
You can check the health of this resource model in the IBM Tivoli Monitoring WebHealth Console. For more information, see the IBM Tivoli Monitoring Web HealthConsole documentation.
Allocate more memory to the data dictionary cache by increasing the value of theSHARED_POOL_SIZE initialization parameter.
The indication has the following attributes:
DatabaseNameThe name of an Oracle database. The database name contains up to 8characters and corresponds to the name specified in the CREATEDATABASE statement and identified in the DB_NAME parameter in thedatabase initialization parameter file.
InstanceNameThe name of an Oracle database instance. The instance name is identified
Chapter 2. Resource models 271

by the INSTANCE_NAME parameter in the database initializationparameter file and corresponds to the Oracle System Identifier (SID) of theinstance.
IntervalDictionaryCacheHitPercentageThe ratio, as a percentage, of dictionary cache hits to total requests over thetime interval for which the resource model was run.
This indication has the following threshold:v Minimum Dictionary Cache Hit Percentage (Interval)
For more information about this threshold, see “Thresholds” on page 278.
The following table describes the default settings for this indication.
Setting Default value
Send indications to Tivoli Enterprise Console Yes
Send indications to Tivoli Business SystemsManager
Yes
Occurrences 1
Holes 0
Associated tasks and built-in actions None
Note: If you have Tivoli Business Systems Manager configured for your systems,Tivoli Enterprise Console automatically forwards events to Tivoli BusinessSystems Manager. Do not change the configuration of the indication to sendevents to Tivoli Business Systems Manager.
Low Keep Buffer Cache Hit Percentage indicationOccurs when the keep buffer cache hit percentage is below the specified threshold.When the indication occurs often enough to trigger an event, the event delivers amessage to the Tivoli Enterprise Console in the following format:<application_label>: The keep buffer cache hit percentage for Oracle instance<InstanceName> has crossed below the predefined threshold of<Threshold> percent and is currently at <KeepCacheHitPercentage> percent.
If you have Tivoli Business Systems Manager configured for your system, TivoliEnterprise Console forwards the message to Tivoli Business Systems Manager.
You can check the health of this resource model in the IBM Tivoli Monitoring WebHealth Console. For more information, see the IBM Tivoli Monitoring Web HealthConsole documentation.
If the Keep Buffer Cache Hit Percentage is low, increase the size of the KEEP bufferpool by increasing the value of the BUFFER_POOL_KEEP initialization parameterfor Oracle8i instances (DB_KEEP_CACHE_SIZE for Oracle9i).
The indication has the following attributes:
DatabaseNameThe name of an Oracle database. The database name contains up to 8characters and corresponds to the name specified in the CREATEDATABASE statement and identified in the DB_NAME parameter in thedatabase initialization parameter file.
272 IBM Tivoli Monitoring for Databases: Oracle: Reference Guide
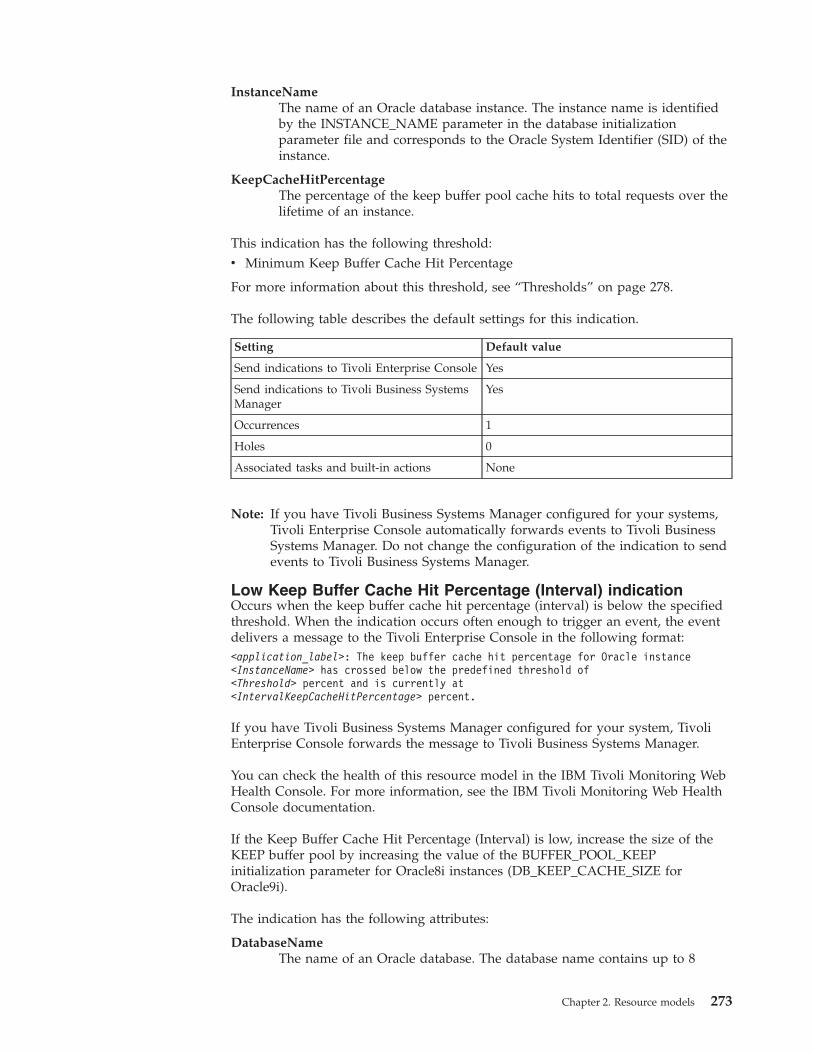
InstanceNameThe name of an Oracle database instance. The instance name is identifiedby the INSTANCE_NAME parameter in the database initializationparameter file and corresponds to the Oracle System Identifier (SID) of theinstance.
KeepCacheHitPercentageThe percentage of the keep buffer pool cache hits to total requests over thelifetime of an instance.
This indication has the following threshold:v Minimum Keep Buffer Cache Hit Percentage
For more information about this threshold, see “Thresholds” on page 278.
The following table describes the default settings for this indication.
Setting Default value
Send indications to Tivoli Enterprise Console Yes
Send indications to Tivoli Business SystemsManager
Yes
Occurrences 1
Holes 0
Associated tasks and built-in actions None
Note: If you have Tivoli Business Systems Manager configured for your systems,Tivoli Enterprise Console automatically forwards events to Tivoli BusinessSystems Manager. Do not change the configuration of the indication to sendevents to Tivoli Business Systems Manager.
Low Keep Buffer Cache Hit Percentage (Interval) indicationOccurs when the keep buffer cache hit percentage (interval) is below the specifiedthreshold. When the indication occurs often enough to trigger an event, the eventdelivers a message to the Tivoli Enterprise Console in the following format:<application_label>: The keep buffer cache hit percentage for Oracle instance<InstanceName> has crossed below the predefined threshold of<Threshold> percent and is currently at<IntervalKeepCacheHitPercentage> percent.
If you have Tivoli Business Systems Manager configured for your system, TivoliEnterprise Console forwards the message to Tivoli Business Systems Manager.
You can check the health of this resource model in the IBM Tivoli Monitoring WebHealth Console. For more information, see the IBM Tivoli Monitoring Web HealthConsole documentation.
If the Keep Buffer Cache Hit Percentage (Interval) is low, increase the size of theKEEP buffer pool by increasing the value of the BUFFER_POOL_KEEPinitialization parameter for Oracle8i instances (DB_KEEP_CACHE_SIZE forOracle9i).
The indication has the following attributes:
DatabaseNameThe name of an Oracle database. The database name contains up to 8
Chapter 2. Resource models 273
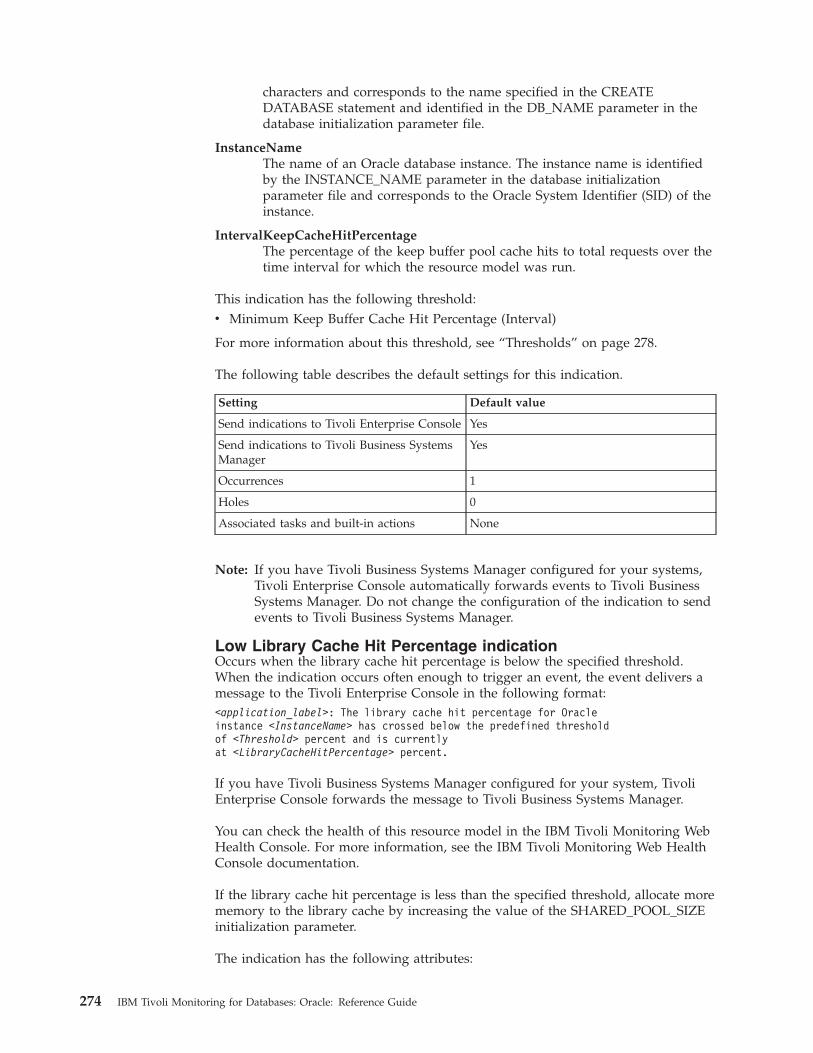
characters and corresponds to the name specified in the CREATEDATABASE statement and identified in the DB_NAME parameter in thedatabase initialization parameter file.
InstanceNameThe name of an Oracle database instance. The instance name is identifiedby the INSTANCE_NAME parameter in the database initializationparameter file and corresponds to the Oracle System Identifier (SID) of theinstance.
IntervalKeepCacheHitPercentageThe percentage of the keep buffer pool cache hits to total requests over thetime interval for which the resource model was run.
This indication has the following threshold:v Minimum Keep Buffer Cache Hit Percentage (Interval)
For more information about this threshold, see “Thresholds” on page 278.
The following table describes the default settings for this indication.
Setting Default value
Send indications to Tivoli Enterprise Console Yes
Send indications to Tivoli Business SystemsManager
Yes
Occurrences 1
Holes 0
Associated tasks and built-in actions None
Note: If you have Tivoli Business Systems Manager configured for your systems,Tivoli Enterprise Console automatically forwards events to Tivoli BusinessSystems Manager. Do not change the configuration of the indication to sendevents to Tivoli Business Systems Manager.
Low Library Cache Hit Percentage indicationOccurs when the library cache hit percentage is below the specified threshold.When the indication occurs often enough to trigger an event, the event delivers amessage to the Tivoli Enterprise Console in the following format:<application_label>: The library cache hit percentage for Oracleinstance <InstanceName> has crossed below the predefined thresholdof <Threshold> percent and is currentlyat <LibraryCacheHitPercentage> percent.
If you have Tivoli Business Systems Manager configured for your system, TivoliEnterprise Console forwards the message to Tivoli Business Systems Manager.
You can check the health of this resource model in the IBM Tivoli Monitoring WebHealth Console. For more information, see the IBM Tivoli Monitoring Web HealthConsole documentation.
If the library cache hit percentage is less than the specified threshold, allocate morememory to the library cache by increasing the value of the SHARED_POOL_SIZEinitialization parameter.
The indication has the following attributes:
274 IBM Tivoli Monitoring for Databases: Oracle: Reference Guide

DatabaseNameThe name of an Oracle database. The database name contains up to 8characters and corresponds to the name specified in the CREATEDATABASE statement and identified in the DB_NAME parameter in thedatabase initialization parameter file.
InstanceNameThe name of an Oracle database instance. The instance name is identifiedby the INSTANCE_NAME parameter in the database initializationparameter file and corresponds to the Oracle System Identifier (SID) of theinstance.
LibraryCacheHitPercentageThe percentage of entries in the library cache that were reloads (parsedmore than once) over the lifetime of the instance. Strive to have reloads asnear to zero as possible. The library cache stores executable forms of SQLcursors, PL/SQL programs, and Java classes.
This indication has the following threshold:v Minimum Library Cache Hit Percentage
For more information about this threshold, see “Thresholds” on page 278.
The following table describes the default settings for this indication.
Setting Default value
Send indications to Tivoli Enterprise Console Yes
Send indications to Tivoli Business SystemsManager
Yes
Occurrences 1
Holes 0
Associated tasks and built-in actions None
Note: If you have Tivoli Business Systems Manager configured for your systems,Tivoli Enterprise Console automatically forwards events to Tivoli BusinessSystems Manager. Do not change the configuration of the indication to sendevents to Tivoli Business Systems Manager.
Low Library Cache Hit Percentage (Interval) indicationOccurs when the library cache hit percentage (interval) is below the specifiedthreshold. When the indication occurs often enough to trigger an event, the eventdelivers a message to the Tivoli Enterprise Console in the following format:<application_label>: The library cache hit percentage (interval) for Oracleinstance <InstanceName> has crossed below the predefined thresholdof <Threshold> percent and is currentlyat <IntervalLibraryCacheHitPercentage> percent.
If you have Tivoli Business Systems Manager configured for your system, TivoliEnterprise Console forwards the message to Tivoli Business Systems Manager.
You can check the health of this resource model in the IBM Tivoli Monitoring WebHealth Console. For more information, see the IBM Tivoli Monitoring Web HealthConsole documentation.
Chapter 2. Resource models 275

The goal is to have the library cache hit percentage as near to 100% as possible. Ifthe library cache hit percentage is less than the specified threshold, allocate morememory to the library cache by increasing the value of the SHARED_POOL_SIZEinitialization parameter.
The indication has the following attributes:
DatabaseNameThe name of an Oracle database. The database name contains up to 8characters and corresponds to the name specified in the CREATEDATABASE statement and identified in the DB_NAME parameter in thedatabase initialization parameter file.
InstanceNameThe name of an Oracle database instance. The instance name is identifiedby the INSTANCE_NAME parameter in the database initializationparameter file and corresponds to the Oracle System Identifier (SID) of theinstance.
IntervalLibraryCacheHitPercentageThe percentage of entries in the interval library cache that were reloads(parsed more than once) over the time interval for which the resourcemodel was run. Strive to have reloads as near to zero as possible. Thelibrary cache stores executable forms of SQL cursors, PL/SQL programs,and Java classes.
This indication has the following threshold:v Minimum Library Cache Hit Percentage (Interval)
For more information about this threshold, see “Thresholds” on page 278.
The following table describes the default settings for this indication.
Setting Default value
Send indications to Tivoli Enterprise Console Yes
Send indications to Tivoli Business SystemsManager
Yes
Occurrences 1
Holes 0
Associated tasks and built-in actions None
Note: If you have Tivoli Business Systems Manager configured for your systems,Tivoli Enterprise Console automatically forwards events to Tivoli BusinessSystems Manager. Do not change the configuration of the indication to sendevents to Tivoli Business Systems Manager.
Low Recycle Buffer Cache Hit Percentage indicationOccurs when the low recycle buffer cache hit percentage is below the specifiedthreshold. When the indication occurs often enough to trigger an event, the eventdelivers a message to the Tivoli Enterprise Console in the following format:<application_label>: The recycle buffer cache hit percentage for Oracleinstance <InstanceName> has crossed below the predefined threshold of<Threshold> percent and is currently at <RecycleCacheHitPercentage> percent.
If you have Tivoli Business Systems Manager configured for your system, TivoliEnterprise Console forwards the message to Tivoli Business Systems Manager.
276 IBM Tivoli Monitoring for Databases: Oracle: Reference Guide

You can check the health of this resource model in the IBM Tivoli Monitoring WebHealth Console. For more information, see the IBM Tivoli Monitoring Web HealthConsole documentation.
If the Recycle Buffer Cache Hit Percentage is low, increase the size of theRECYCLE buffer pool by increasing the value of the BUFFER_POOL_RECYCLEinitialization parameter for Oracle8i instances (DB_RECYCLE_CACHE_SIZE forOracle9i).
The indication has the following attributes:
DatabaseNameThe name of an Oracle database. The database name contains up to 8characters and corresponds to the name specified in the CREATEDATABASE statement and identified in the DB_NAME parameter in thedatabase initialization parameter file.
InstanceNameThe name of an Oracle database instance. The instance name is identifiedby the INSTANCE_NAME parameter in the database initializationparameter file and corresponds to the Oracle System Identifier (SID) of theinstance.
RecycleCacheHitPercentageThe percentage of the recycle buffer pool cache hits to total requests overthe lifetime of an instance.
This indication has the following threshold:v Minimum Recycle Buffer Cache Hit Percentage
For more information about this threshold, see “Thresholds” on page 278.
The following table describes the default settings for this indication.
Setting Default value
Send indications to Tivoli Enterprise Console Yes
Send indications to Tivoli Business SystemsManager
Yes
Occurrences 1
Holes 0
Associated tasks and built-in actions None
Note: If you have Tivoli Business Systems Manager configured for your systems,Tivoli Enterprise Console automatically forwards events to Tivoli BusinessSystems Manager. Do not change the configuration of the indication to sendevents to Tivoli Business Systems Manager.
Low Recycle Buffer Cache Hit Percentage (Interval) indicationOccurs when the recycle buffer cache hit percentage (interval) is below thespecified threshold. When the indication occurs often enough to trigger an event,the event delivers a message to the Tivoli Enterprise Console in the followingformat:<application_label>: The recycle buffer cache hit percentage for Oracleinstance <InstanceName> has crossed below the predefined threshold of<Threshold> percent and is currently at<IntervalRecycleCacheHitPercentage> percent.
Chapter 2. Resource models 277

If you have Tivoli Business Systems Manager configured for your system, TivoliEnterprise Console forwards the message to Tivoli Business Systems Manager.
You can check the health of this resource model in the IBM Tivoli Monitoring WebHealth Console. For more information, see the IBM Tivoli Monitoring Web HealthConsole documentation.
If the Recycle Buffer Cache Hit Percentage (Interval) is low, increase the size of theRECYCLE buffer pool by increasing the value of the BUFFER_POOL_RECYCLEinitialization parameter for Oracle8i instances (DB_RECYCLE_CACHE_SIZE forOracle9i).
The indication has the following attributes:
DatabaseNameThe name of an Oracle database. The database name contains up to 8characters and corresponds to the name specified in the CREATEDATABASE statement and identified in the DB_NAME parameter in thedatabase initialization parameter file.
InstanceNameThe name of an Oracle database instance. The instance name is identifiedby the INSTANCE_NAME parameter in the database initializationparameter file and corresponds to the Oracle System Identifier (SID) of theinstance.
IntervalRecycleCacheHitPercentageThe percentage of the interval recycle buffer pool cache hits to totalrequests over the time interval for which the resource model was run.
This indication has the following threshold:v Minimum Recycle Buffer Cache Hit Percentage (Interval)
For more information about this threshold, see “Thresholds” on page 278.
The following table describes the default settings for this indication.
Setting Default value
Send indications to Tivoli Enterprise Console Yes
Send indications to Tivoli Business SystemsManager
Yes
Occurrences 1
Holes 0
Associated tasks and built-in actions None
Note: If you have Tivoli Business Systems Manager configured for your systems,Tivoli Enterprise Console automatically forwards events to Tivoli BusinessSystems Manager. Do not change the configuration of the indication to sendevents to Tivoli Business Systems Manager.
ThresholdsThe following table lists the thresholds that can be set for the SGA resource model.For each threshold it shows the name, a short description, and the default value:
278 IBM Tivoli Monitoring for Databases: Oracle: Reference Guide

Threshold Description Defaultvalue
Maximum Buffer CacheHit Percentage
An indication occurs when the Buffer Cache HitPercentage exceeds this value.
97
Maximum Buffer CacheHit Percentage (Interval)
An indication occurs when the Buffer Cache HitPercentage (Interval) exceeds this value.
97
Maximum Buffer WaitsPercentage
An indication occurs when the Buffer WaitsPercentage exceeds this value.
15
Maximum DictionaryCache Hit Percentage
An indication occurs when the Dictionary CacheHit Percentage exceeds this value.
95
Maximum DictionaryCache Hit Percentage(Interval)
An indication occurs when the Dictionary CacheHit Percentage (Interval) exceeds this value.
95
Minimum Buffer CacheHit Percentage
An indication occurs when the Buffer Cache HitPercentage is less than this value.
70
Minimum Buffer CacheHit Percentage (Interval)
An indication occurs when the Buffer Cache HitPercentage (Interval) is less than this value.
70
Minimum DictionaryCache Hit Percentage
An indication occurs when the Dictionary CacheHit Percentage is less than this value.
85
Minimum DictionaryCache Hit Percentage(Interval)
An indication occurs when the Dictionary CacheHit Percentage (Interval) is less than this value.
85
Minimum Keep BufferCache Hit Percentage
An indication occurs when the Keep Buffer CacheHit Percentage is less than this value.
90
Minimum Keep BufferCache Hit Percentage(Interval)
An indication occurs when the Keep Buffer CacheHit Percentage (Interval) is less than this value.
90
Minimum Library CacheHit Percentage
An indication occurs when the Library Cache HitPercentage is less than this value.
99
Minimum Library CacheHit Percentage (Interval)
An indication occurs when the Library Cache HitPercentage (Interval) is less than this value.
99
Minimum Recycle BufferCache Hit Percentage
An indication occurs when the Recycle BufferCache Hit Percentage is less than this value.
90
Minimum Recycle BufferCache Hit Percentage(Interval)
An indication occurs when the Recycle BufferCache Hit Percentage (Interval) is less than thisvalue.
90
ParametersNone
Tasks and built-in actionsNone
LoggingYou can log data for the properties of the managed resource listed in the followingtable. The table shows the context of the managed resource and the properties thatthe resource model logs for the IBM Tivoli Monitoring Web Health Console.
Chapter 2. Resource models 279

Managedresource
Context Properties
OracleInstance MemoryBufferBusyWaits
The number of buffer busy waits in a specifiedlength of time.
BufferCacheCGetsThe number of times a consistent read wasrequested for a block in a specified length of time.
BufferCacheDBGetsThe number of times a CURRENT block wasrequested in a specified length of time.
BufferCacheHitPercentageThe percentage of the buffer cache hits to totalrequests over the lifetime of an instance.
BufferCachePhysReadsDirLogged in Oracle 9i only. Number of reads directlyfrom disk, bypassing the buffer cache.
BufferCachePhysReadsDirLobLogged in Oracle 9i only. Number of lob readsdirectly from disk, bypassing the buffer cache.
BufferCacheSessLogReadsLogged in Oracle 9i only. The sum of “db blockgets” plus “consistent gets.”
BufferWaitsPercentageThe percentage of buffer busy waits to logicalreads. This indicates that a user process attemptedto acquire a buffer but had to wait because thebuffer was held in an incompatible mode.
DictionaryCacheHitPercentageThe ratio, as a percentage, of dictionary cache hitsto total requests.
InstanceName*The name of an Oracle database instance.
IntervalBufferCacheHitPercentageThe percentage of the interval buffer cache hits tototal requests over the time interval for which theresource model was run.
IntervalDictionaryCacheHitPercentageThe percentage of entries in the library cache thatwere reloads (parsed more than once) over thetime interval for which the resource model wasrun.
IntervalKeepCacheHitPercentageThe percentage of the interval keep buffer poolcache hits to total requests over the time intervalfor which the resource model was run.
Note: An asterisk (*) denotes a key property.
280 IBM Tivoli Monitoring for Databases: Oracle: Reference Guide

Managedresource
Context Properties
OracleInstance MemoryIntervalLibraryCacheHitPercentage
The percentage of entries in the interval librarycache that were reloads (parsed more than once)over the time interval for which the resource modelwas run. Strive to have reloads as near to zero aspossible. The library cache stores executable formsof SQL cursors, PL/SQL programs, and Javaclasses.
IntervalRecycleCacheHitPercentageThe percentage of the interval recycle buffer poolcache hits to total requests over the time intervalfor which the resource model was run.
KeepCacheCGetsThe number of keep cache consistent gets.
KeepCacheDBGetsThe number of keep cache database blocks gets.
KeepCacheHitPercentageThe percentage of the keep buffer pool cache hits tototal requests over the lifetime of an instance.
KeepCachePhysReadsThe number of keep cache physical reads.
LibraryCacheHitPercentageThe percentage of entries in the library cache thatwere reloads (parsed more than once) over thelifetime of the instance.
LibraryCachePinHitsLogged in Oracle 9i only. The number of times thatall of the metadata pieces of the library object werefound in memory.
LibraryCachePinsThe number of times a PIN was requested forobjects in the library cache.
LibraryCacheReloadsLogged in Oracle 8i only. The number of objectPINs following the first PIN performed since theobject handle was created, and which requiresloading the object from disk.
OracleDatabase.DatabaseName*The name of an Oracle database.
RecycleCacheCGetsThe number of recycle cache consistent gets.
RecycleCacheDBGetsThe number of recycle cache database blocks gets.
RecycleCacheHitPercentageThe percentage of the recycle buffer pool cache hitsto total requests over the lifetime of an instance.
RecycleCachePhysReadsThe number of recycle cache physical reads.
Note: An asterisk (*) denotes a key property.
Chapter 2. Resource models 281

Managedresource
Context Properties
OracleInstance MemoryRowCacheGets
The total number of requests for data objectinformation for all data dictionary caches.
RowCacheFixedThe total number of fixed entries in the cache forall data dictionary caches.
RowCacheMissesThe total number of data requests resulting incache misses for all data dictionary caches.
RowCacheUsageLogged in Oracle 8i only. The total number ofcache entries that contain valid data for all datadictionary caches.
Note: An asterisk (*) denotes a key property.
Return codesTable 2 on page 7 contains a listing of resource model return codes, theirdescription, and what action you can take to resolve each code. The return codenumber is displayed in the IBM Tivoli Monitoring Web Health Console status field,or by using the wdmlseng command.
CLI examplewdmeditprf -P OracleProfile#tme-region -add OracleSGA -c 1800 \-Log -LogDisable -p 12:00 -Agg no -ap 00:15 -NoMin -NoMax -Avg \-t Oracle_Maximum_BufferCacheHitPercentage 97.000000 \-t Oracle_Maximum_IntervalBufferCacheHitPercentage 97.000000 \-t Oracle_Maximum_BufferWaitsPercentage 15.000000 \-t Oracle_Maximum_DictionaryCacheHitPercentage 95.000000 \-t Oracle_Maximum_IntervalDictionaryCacheHitPercentage 95.000000 \-t Oracle_Minimum_BufferCacheHitPercentage 70.000000 \-t Oracle_Minimum_IntervalBufferCacheHitPercentage 70.000000 \-t Oracle_Minimum_DictionaryCacheHitPercentage 85.000000 \-t Oracle_Minimum_IntervalDictionaryCacheHitPercentage 85.000000 \-t Oracle_Minimum_KeepCacheHitPercentage 90.000000 \-t Oracle_Minimum_IntervalKeepCacheHitPercentage 90.000000 \-t Oracle_Minimum_LibraryCacheHitPercentage 99.000000 \-t Oracle_Minimum_IntervalLibraryCacheHitPercentage 99.000000 \-t Oracle_Minimum_RecycleCacheHitPercentage 90.000000 \-t Oracle_Minimum_IntervalRecycleCacheHitPercentage 90.000000 \-AddPar InstanceMetrics "numBufferCacheHitPercentage" \-AddPar InstanceMetrics "numIntervalBufferCacheHitPercentage" \-AddPar InstanceMetrics "numLibraryCacheHitPercentage" \-AddPar InstanceMetrics "numIntervalLibraryCacheHitPercentage" \-AddPar InstanceMetrics "numDictionaryCacheHitPercentage" \-AddPar InstanceMetrics "numIntervalDictionaryCacheHitPercentage" \-AddPar InstanceMetrics "numBufferWaitsPercentage" \-AddPar InstanceMetrics "numKeepCacheHitPercentage" \-AddPar InstanceMetrics "numIntervalKeepCacheHitPercentage" \-AddPar InstanceMetrics "numRecycleCacheHitPercentage" \-AddPar InstanceMetrics "numIntervalRecycleCacheHitPercentage" \-e Oracle_High_BufferWaitsPercentage \-o 1 -h 0 -severity CRITICAL -SendTBSM -SendTec \-e Oracle_High_IntervalBufferCacheHitPercentage \-o 1 -h 0 -severity CRITICAL -SendTBSM -SendTec \-e Oracle_Low_IntervalRecycleCacheHitPercentage \-o 1 -h 0 -severity CRITICAL -SendTBSM -SendTec \
282 IBM Tivoli Monitoring for Databases: Oracle: Reference Guide

-e Oracle_Low_BufferCacheHitPercentage \-o 1 -h 0 -severity WARNING -SendTBSM -SendTec \-e Oracle_Low_IntervalLibraryCacheHitPercentage \-o 1 -h 0 -severity CRITICAL -SendTBSM -SendTec \-e Oracle_Low_IntervalBufferCacheHitPercentage \-o 1 -h 0 -severity CRITICAL -SendTBSM -SendTec \-e Oracle_Low_RecycleCacheHitPercentage \-o 1 -h 0 -severity CRITICAL -SendTBSM -SendTec \-e Oracle_High_BufferCacheHitPercentage \-o 1 -h 0 -severity CRITICAL -SendTBSM -SendTec \-e Oracle_Low_LibraryCacheHitPercentage \-o 1 -h 0 -severity CRITICAL -NoSendTBSM -NoSendTec \-e Oracle_Low_DictionaryCacheHitPercentage \-o 1 -h 0 -severity CRITICAL -SendTBSM -SendTec \-e Oracle_High_IntervalDictionaryCacheHitPercentage \-o 1 -h 0 -severity CRITICAL -SendTBSM -SendTec \-e Oracle_Low_IntervalKeepCacheHitPercentage \-o 1 -h 0 -severity CRITICAL -SendTBSM -SendTec \-e Oracle_High_DictionaryCacheHitPercentage \-o 1 -h 0 -severity CRITICAL -SendTBSM -SendTec \-e Oracle_Low_IntervalDictionaryCacheHitPercentage \-o 1 -h 0 -severity CRITICAL -SendTBSM -SendTec \-e Oracle_Low_KeepCacheHitPercentage \-o 1 -h 0 -severity CRITICAL -SendTBSM -SendTec
Chapter 2. Resource models 283

SQL Number
DescriptionQueries a resource for a numeric value as specified by a user-defined SQL selectstatement.
Use this resource model to create your own method of monitoring information thatis specific to your operational needs. The ability to define a freeform SQL selectstatement enables the integration of existing performance monitoring tools(particularly those reporting monitored values to internal Oracle tables within thesubscribing database).
When specifying the SQL statement, do not terminate the SQL statement with asemicolon (;), forward slash (/), or backward slash (\). The select statement canreturn multiple columns and multiple rows. The trigger value (the value againstwhich the monitoring criteria is evaluated) must be a numeric value.
The index parameter defines which column contains the trigger value. The columnsbegin with the number one (not zero-based).
An SQL select statement might return no rows. Use the No Rows As parameter tospecify the value to be returned if no rows are returned from the SQL statement.
If you use this resource model to search for an alphanumeric value, instead of anumeric value, an error occurs. Use “SQL String” on page 294 to search for analphanumeric value.
Resource model overview
Internal name OracleFreeFormSQLNumber
Category Oracle
Indications Decreases Below SQL Number occurs when the result ofthe query decreased below the specified threshold.
Does not equal SQL Number occurs when the result of thequery does not equal the specified threshold.
Equals SQL Number occurs when the result of the queryequals the specified threshold.
Greater than SQL Number occurs when the result of thequery exceeds the specified threshold.
Increase of SQL Number occurs when the result of thequery is increased by the specified threshold amount orgreater.
Increases Beyond SQL Number occurs when the result ofthe query exceeds the specified threshold.
Less Than SQL Number occurs when the result of the queryis less than the specified threshold.
Percent increase of occurs when the result of the queryincreases as a percentage over the previous result by morethan the specified threshold.
Tasks and built-in actions None
Default cycle time 300 seconds
284 IBM Tivoli Monitoring for Databases: Oracle: Reference Guide

Target managed resourceOracleDatabaseManager, OracleInstanceManager
Indications and eventsThe following table summarizes the indications for this resource model, the eventsassociated with the indications, the default severity of the events, and where tofind a detailed description of the indication. The resource model generates anevent when the threshold you specify for the indication is triggered.
Indication Generated event Defaultseverity
Clearingevents
Page
DecreasesBelow SQLNumber
Oracle_DecreasesBelowSQLNumber
Critical Yes 285
Does not equalSQL Number
Oracle_DoesNotEqualSQLNumber
Critical Yes 286
Equals SQLNumber
Oracle_EqualsSQLNumber
Critical Yes 287
Greater thanSQL Number
Oracle_GreaterThanSQLNumber
Critical Yes 288
Increase ofSQL Number
Oracle_IncreaseOfSQLNumber
Critical Yes 289
IncreasesBeyond SQLNumber
Oracle_IncreasesBeyondSQLNumber
Critical Yes 289
Less Than SQLNumber
Oracle_LessThanSQLNumber
Critical Yes 290
Percentincrease of
Oracle_PctIncreaseOfSQLNumber
Critical Yes 291
Decreases Below SQL Number indicationOccurs when the result of the query decreased below the specified threshold.When the indication occurs often enough to trigger an event, the event delivers amessage to the Tivoli Enterprise Console in the following format:<application_label>: The result of the SQL query for Oracledatabase <DatabaseName> has decreased below the predefinedthreshold of <Threshold> and is currently <Result>.
If you have Tivoli Business Systems Manager configured for your system, TivoliEnterprise Console forwards the message to Tivoli Business Systems Manager.
You can check the health of this resource model in the IBM Tivoli Monitoring WebHealth Console. For more information, see the IBM Tivoli Monitoring Web HealthConsole documentation.
The indication has the following attributes:
DatabaseNameThe name of an Oracle database. The database name contains up to 8characters and corresponds to the name specified in the CREATEDATABASE statement and identified in the DB_NAME parameter in thedatabase initialization parameter file.
Result The value being monitored within the SQL statement specified.
Chapter 2. Resource models 285

SQL The user-defined query that monitors your resource.
This indication has the following thresholds:v Threshold for SQL Number
For more information about these thresholds, see “Thresholds” on page 292.
The following table describes the default settings for this indication.
Setting Default value
Send indications to Tivoli Enterprise Console Yes
Send indications to Tivoli Business SystemsManager
Yes
Occurrences 1
Holes 0
Associated tasks and built-in actions None
Note: If you have Tivoli Business Systems Manager configured for your systems,Tivoli Enterprise Console automatically forwards events to Tivoli BusinessSystems Manager. Do not change the configuration of the indication to sendevents to Tivoli Business Systems Manager.
Does not equal SQL Number indicationOccurs when the result of the query does not equal the specified threshold. Whenthe indication occurs often enough to trigger an event, the event delivers amessage to the Tivoli Enterprise Console in the following format:<application_label>: The result of the SQL query forOracle database <DatabaseName> does not equal thepredefined threshold of <Threshold> and is currently <Result>.
If you have Tivoli Business Systems Manager configured for your system, TivoliEnterprise Console forwards the message to Tivoli Business Systems Manager.
You can check the health of this resource model in the IBM Tivoli Monitoring WebHealth Console. For more information, see the IBM Tivoli Monitoring Web HealthConsole documentation.
The indication has the following attributes:
DatabaseNameThe name of an Oracle database. The database name contains up to 8characters and corresponds to the name specified in the CREATEDATABASE statement and identified in the DB_NAME parameter in thedatabase initialization parameter file.
Result The value being monitored within the SQL statement specified.
SQL The user-defined query that monitors your resource.
This indication has the following thresholds:v Threshold for SQL Number
For more information about these thresholds, see “Thresholds” on page 292.
286 IBM Tivoli Monitoring for Databases: Oracle: Reference Guide

The following table describes the default settings for this indication.
Setting Default value
Send indications to Tivoli Enterprise Console Yes
Send indications to Tivoli Business SystemsManager
Yes
Occurrences 1
Holes 0
Associated tasks and built-in actions None
Note: If you have Tivoli Business Systems Manager configured for your systems,Tivoli Enterprise Console automatically forwards events to Tivoli BusinessSystems Manager. Do not change the configuration of the indication to sendevents to Tivoli Business Systems Manager.
Equals SQL Number indicationOccurs when the result of the query equals the specified threshold. When theindication occurs often enough to trigger an event, the event delivers a message tothe Tivoli Enterprise Console in the following format:<application_label>: The result of the SQL query for Oracledatabase <DatabaseName> equals the predefined threshold of<Threshold> and is currently <Result>.
If you have Tivoli Business Systems Manager configured for your system, TivoliEnterprise Console forwards the message to Tivoli Business Systems Manager.
You can check the health of this resource model in the IBM Tivoli Monitoring WebHealth Console. For more information, see the IBM Tivoli Monitoring Web HealthConsole documentation.
The indication has the following attributes:
DatabaseNameThe name of an Oracle database. The database name contains up to 8characters and corresponds to the name specified in the CREATEDATABASE statement and identified in the DB_NAME parameter in thedatabase initialization parameter file.
Result The value being monitored within the SQL statement specified.
SQL The user-defined query that monitors your resource.
This indication has the following thresholds:v Threshold for SQL Number
For more information about these thresholds, see “Thresholds” on page 292.
The following table describes the default settings for this indication.
Setting Default value
Send indications to Tivoli Enterprise Console Yes
Send indications to Tivoli Business SystemsManager
Yes
Occurrences 1
Chapter 2. Resource models 287
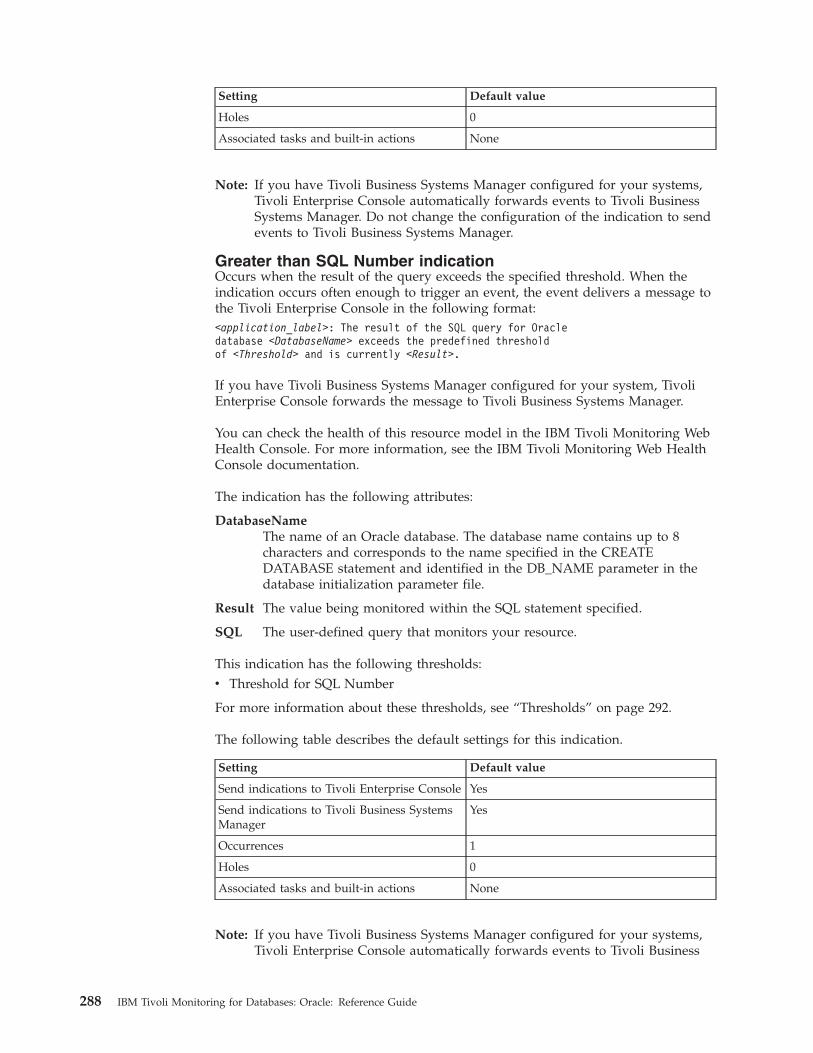
Setting Default value
Holes 0
Associated tasks and built-in actions None
Note: If you have Tivoli Business Systems Manager configured for your systems,Tivoli Enterprise Console automatically forwards events to Tivoli BusinessSystems Manager. Do not change the configuration of the indication to sendevents to Tivoli Business Systems Manager.
Greater than SQL Number indicationOccurs when the result of the query exceeds the specified threshold. When theindication occurs often enough to trigger an event, the event delivers a message tothe Tivoli Enterprise Console in the following format:<application_label>: The result of the SQL query for Oracledatabase <DatabaseName> exceeds the predefined thresholdof <Threshold> and is currently <Result>.
If you have Tivoli Business Systems Manager configured for your system, TivoliEnterprise Console forwards the message to Tivoli Business Systems Manager.
You can check the health of this resource model in the IBM Tivoli Monitoring WebHealth Console. For more information, see the IBM Tivoli Monitoring Web HealthConsole documentation.
The indication has the following attributes:
DatabaseNameThe name of an Oracle database. The database name contains up to 8characters and corresponds to the name specified in the CREATEDATABASE statement and identified in the DB_NAME parameter in thedatabase initialization parameter file.
Result The value being monitored within the SQL statement specified.
SQL The user-defined query that monitors your resource.
This indication has the following thresholds:v Threshold for SQL Number
For more information about these thresholds, see “Thresholds” on page 292.
The following table describes the default settings for this indication.
Setting Default value
Send indications to Tivoli Enterprise Console Yes
Send indications to Tivoli Business SystemsManager
Yes
Occurrences 1
Holes 0
Associated tasks and built-in actions None
Note: If you have Tivoli Business Systems Manager configured for your systems,Tivoli Enterprise Console automatically forwards events to Tivoli Business
288 IBM Tivoli Monitoring for Databases: Oracle: Reference Guide

Systems Manager. Do not change the configuration of the indication to sendevents to Tivoli Business Systems Manager.
Increase of SQL Number indicationOccurs when the result of the query is increased by the specified threshold amountor greater. When the indication occurs often enough to trigger an event, the eventdelivers a message to the Tivoli Enterprise Console in the following format:<application_label>: The result of the SQL query for Oracledatabase <DatabaseName> has increased by more than the predefinedthreshold of <Threshold> and is currently <Result>.
If you have Tivoli Business Systems Manager configured for your system, TivoliEnterprise Console forwards the message to Tivoli Business Systems Manager.
You can check the health of this resource model in the IBM Tivoli Monitoring WebHealth Console. For more information, see the IBM Tivoli Monitoring Web HealthConsole documentation.
The indication has the following attributes:
DatabaseNameThe name of an Oracle database. The database name contains up to 8characters and corresponds to the name specified in the CREATEDATABASE statement and identified in the DB_NAME parameter in thedatabase initialization parameter file.
Result The value being monitored within the SQL statement specified.
SQL The user-defined query that monitors your resource.
This indication has the following thresholds:v Threshold for SQL Number
For more information about these thresholds, see “Thresholds” on page 292.
The following table describes the default settings for this indication.
Setting Default value
Send indications to Tivoli Enterprise Console Yes
Send indications to Tivoli Business SystemsManager
Yes
Occurrences 1
Holes 0
Associated tasks and built-in actions None
Note: If you have Tivoli Business Systems Manager configured for your systems,Tivoli Enterprise Console automatically forwards events to Tivoli BusinessSystems Manager. Do not change the configuration of the indication to sendevents to Tivoli Business Systems Manager.
Increases Beyond SQL Number indicationOccurs when the result of the query exceeds the specified threshold. When theindication occurs often enough to trigger an event, the event delivers a message tothe Tivoli Enterprise Console in the following format:
Chapter 2. Resource models 289

<application_label>: The result of the SQL query for Oracledatabase <DatabaseName> has increased beyond the predefinedthreshold of <Threshold> and is currently <Result>.
If you have Tivoli Business Systems Manager configured for your system, TivoliEnterprise Console forwards the message to Tivoli Business Systems Manager.
You can check the health of this resource model in the IBM Tivoli Monitoring WebHealth Console. For more information, see the IBM Tivoli Monitoring Web HealthConsole documentation.
The indication has the following attributes:
DatabaseNameThe name of an Oracle database. The database name contains up to 8characters and corresponds to the name specified in the CREATEDATABASE statement and identified in the DB_NAME parameter in thedatabase initialization parameter file.
Result The value being monitored within the SQL statement specified.
SQL The user-defined query that monitors your resource.
This indication has the following thresholds:v Threshold for SQL Number
For more information about these thresholds, see “Thresholds” on page 292.
The following table describes the default settings for this indication.
Setting Default value
Send indications to Tivoli Enterprise Console Yes
Send indications to Tivoli Business SystemsManager
Yes
Occurrences 1
Holes 0
Associated tasks and built-in actions None
Note: If you have Tivoli Business Systems Manager configured for your systems,Tivoli Enterprise Console automatically forwards events to Tivoli BusinessSystems Manager. Do not change the configuration of the indication to sendevents to Tivoli Business Systems Manager.
Less Than SQL Number indicationOccurs when the result of the query is less than the specified threshold. When theindication occurs often enough to trigger an event, the event delivers a message tothe Tivoli Enterprise Console in the following format:<application_label>: The result of the SQL query for Oracledatabase <DatabaseName> is less than the predefined thresholdof <Threshold> and is currently <Result>.
If you have Tivoli Business Systems Manager configured for your system, TivoliEnterprise Console forwards the message to Tivoli Business Systems Manager.
290 IBM Tivoli Monitoring for Databases: Oracle: Reference Guide
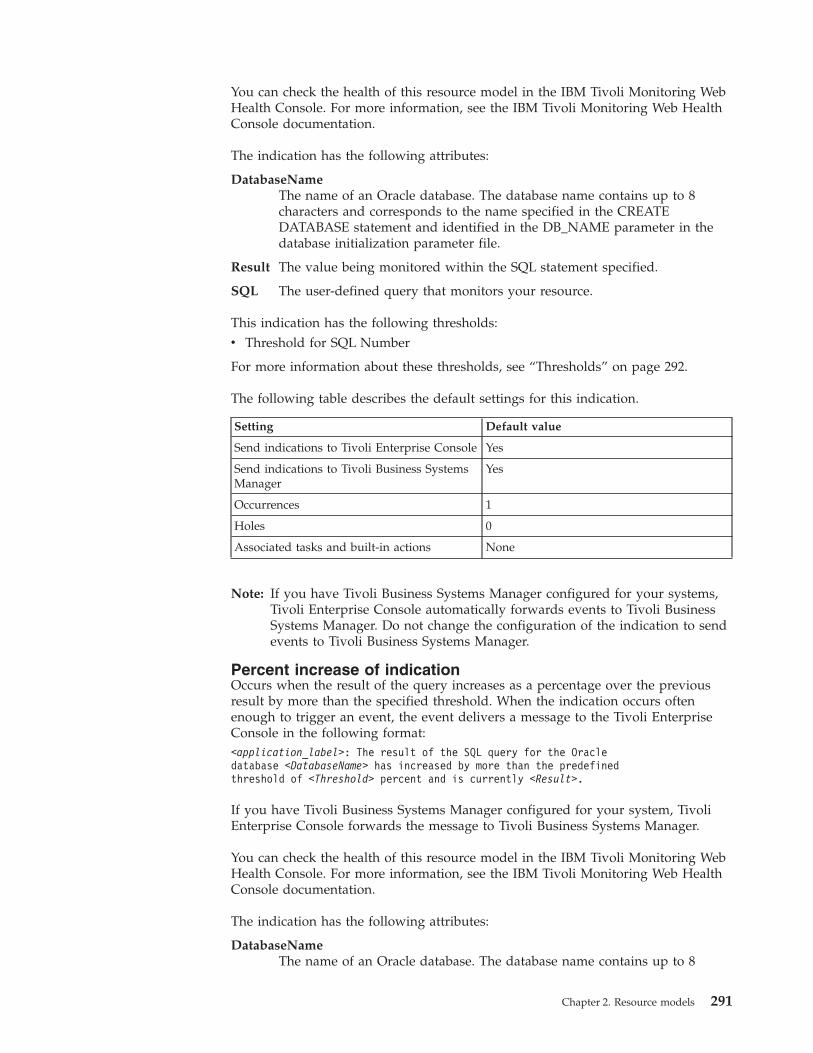
You can check the health of this resource model in the IBM Tivoli Monitoring WebHealth Console. For more information, see the IBM Tivoli Monitoring Web HealthConsole documentation.
The indication has the following attributes:
DatabaseNameThe name of an Oracle database. The database name contains up to 8characters and corresponds to the name specified in the CREATEDATABASE statement and identified in the DB_NAME parameter in thedatabase initialization parameter file.
Result The value being monitored within the SQL statement specified.
SQL The user-defined query that monitors your resource.
This indication has the following thresholds:v Threshold for SQL Number
For more information about these thresholds, see “Thresholds” on page 292.
The following table describes the default settings for this indication.
Setting Default value
Send indications to Tivoli Enterprise Console Yes
Send indications to Tivoli Business SystemsManager
Yes
Occurrences 1
Holes 0
Associated tasks and built-in actions None
Note: If you have Tivoli Business Systems Manager configured for your systems,Tivoli Enterprise Console automatically forwards events to Tivoli BusinessSystems Manager. Do not change the configuration of the indication to sendevents to Tivoli Business Systems Manager.
Percent increase of indicationOccurs when the result of the query increases as a percentage over the previousresult by more than the specified threshold. When the indication occurs oftenenough to trigger an event, the event delivers a message to the Tivoli EnterpriseConsole in the following format:<application_label>: The result of the SQL query for the Oracledatabase <DatabaseName> has increased by more than the predefinedthreshold of <Threshold> percent and is currently <Result>.
If you have Tivoli Business Systems Manager configured for your system, TivoliEnterprise Console forwards the message to Tivoli Business Systems Manager.
You can check the health of this resource model in the IBM Tivoli Monitoring WebHealth Console. For more information, see the IBM Tivoli Monitoring Web HealthConsole documentation.
The indication has the following attributes:
DatabaseNameThe name of an Oracle database. The database name contains up to 8
Chapter 2. Resource models 291
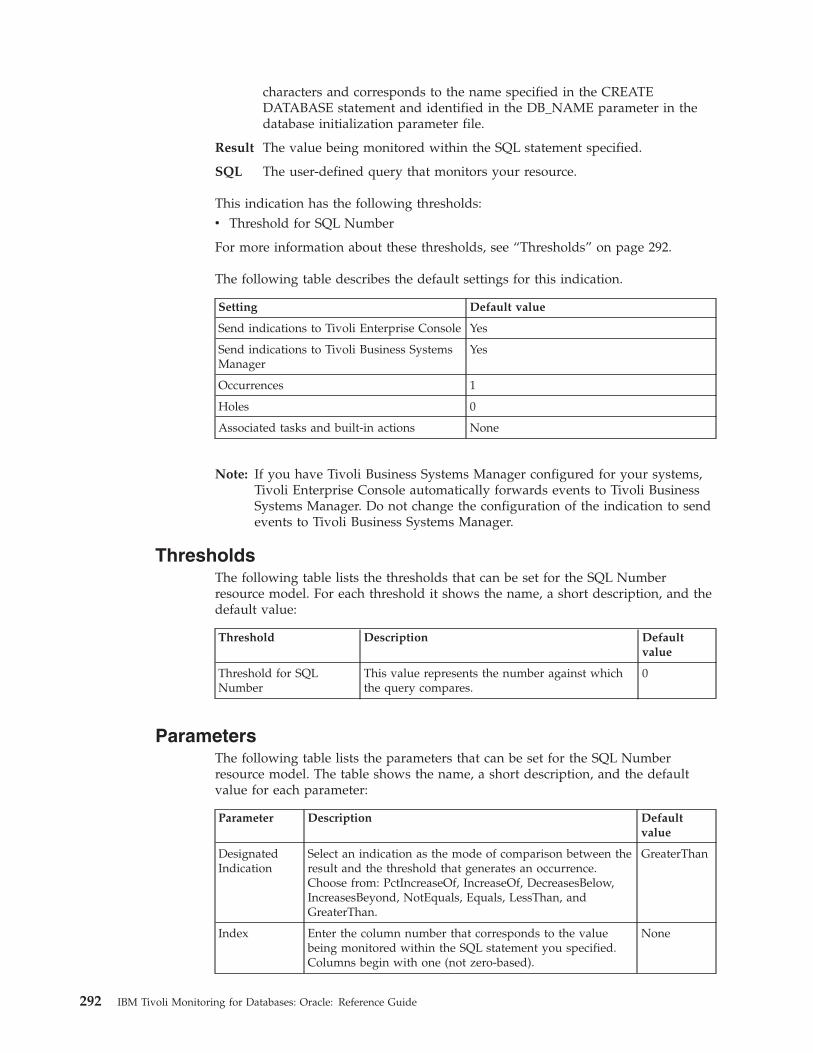
characters and corresponds to the name specified in the CREATEDATABASE statement and identified in the DB_NAME parameter in thedatabase initialization parameter file.
Result The value being monitored within the SQL statement specified.
SQL The user-defined query that monitors your resource.
This indication has the following thresholds:v Threshold for SQL Number
For more information about these thresholds, see “Thresholds” on page 292.
The following table describes the default settings for this indication.
Setting Default value
Send indications to Tivoli Enterprise Console Yes
Send indications to Tivoli Business SystemsManager
Yes
Occurrences 1
Holes 0
Associated tasks and built-in actions None
Note: If you have Tivoli Business Systems Manager configured for your systems,Tivoli Enterprise Console automatically forwards events to Tivoli BusinessSystems Manager. Do not change the configuration of the indication to sendevents to Tivoli Business Systems Manager.
ThresholdsThe following table lists the thresholds that can be set for the SQL Numberresource model. For each threshold it shows the name, a short description, and thedefault value:
Threshold Description Defaultvalue
Threshold for SQLNumber
This value represents the number against whichthe query compares.
0
ParametersThe following table lists the parameters that can be set for the SQL Numberresource model. The table shows the name, a short description, and the defaultvalue for each parameter:
Parameter Description Defaultvalue
DesignatedIndication
Select an indication as the mode of comparison between theresult and the threshold that generates an occurrence.Choose from: PctIncreaseOf, IncreaseOf, DecreasesBelow,IncreasesBeyond, NotEquals, Equals, LessThan, andGreaterThan.
GreaterThan
Index Enter the column number that corresponds to the valuebeing monitored within the SQL statement you specified.Columns begin with one (not zero-based).
None
292 IBM Tivoli Monitoring for Databases: Oracle: Reference Guide
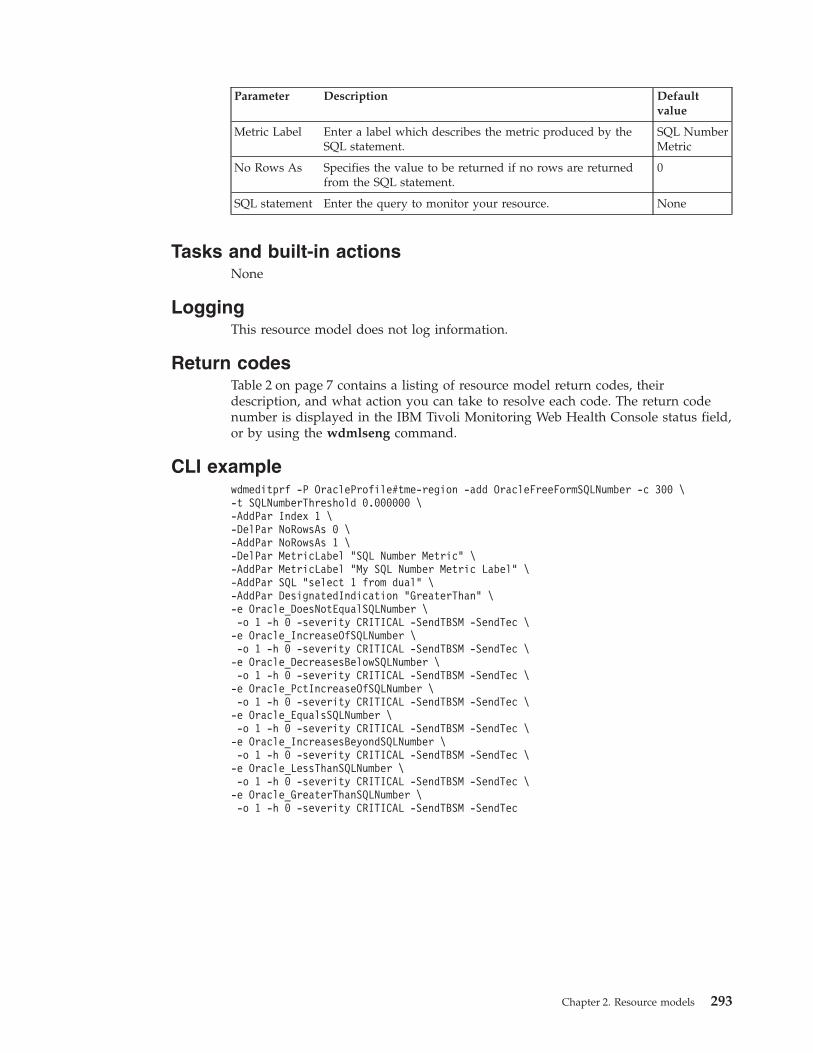
Parameter Description Defaultvalue
Metric Label Enter a label which describes the metric produced by theSQL statement.
SQL NumberMetric
No Rows As Specifies the value to be returned if no rows are returnedfrom the SQL statement.
0
SQL statement Enter the query to monitor your resource. None
Tasks and built-in actionsNone
LoggingThis resource model does not log information.
Return codesTable 2 on page 7 contains a listing of resource model return codes, theirdescription, and what action you can take to resolve each code. The return codenumber is displayed in the IBM Tivoli Monitoring Web Health Console status field,or by using the wdmlseng command.
CLI examplewdmeditprf -P OracleProfile#tme-region -add OracleFreeFormSQLNumber -c 300 \-t SQLNumberThreshold 0.000000 \-AddPar Index 1 \-DelPar NoRowsAs 0 \-AddPar NoRowsAs 1 \-DelPar MetricLabel "SQL Number Metric" \-AddPar MetricLabel "My SQL Number Metric Label" \-AddPar SQL "select 1 from dual" \-AddPar DesignatedIndication "GreaterThan" \-e Oracle_DoesNotEqualSQLNumber \-o 1 -h 0 -severity CRITICAL -SendTBSM -SendTec \-e Oracle_IncreaseOfSQLNumber \-o 1 -h 0 -severity CRITICAL -SendTBSM -SendTec \-e Oracle_DecreasesBelowSQLNumber \-o 1 -h 0 -severity CRITICAL -SendTBSM -SendTec \-e Oracle_PctIncreaseOfSQLNumber \-o 1 -h 0 -severity CRITICAL -SendTBSM -SendTec \-e Oracle_EqualsSQLNumber \-o 1 -h 0 -severity CRITICAL -SendTBSM -SendTec \-e Oracle_IncreasesBeyondSQLNumber \-o 1 -h 0 -severity CRITICAL -SendTBSM -SendTec \-e Oracle_LessThanSQLNumber \-o 1 -h 0 -severity CRITICAL -SendTBSM -SendTec \-e Oracle_GreaterThanSQLNumber \-o 1 -h 0 -severity CRITICAL -SendTBSM -SendTec
Chapter 2. Resource models 293

SQL String
DescriptionQueries a resource for an alphanumeric value that is specified by a user-definedSQL select statement.
Note: The performance of your environment may be affected if you specify a largenumber of objects to process. This resource model performs comparisons onall rows of the returned results. If a query returns 5000 rows, then theresource model completes 5000 comparisons. To compare only one row,wrap the query in a statement of the form:select <columns> from <old query> where rownum = 1
Use this resource model to create your own method of monitoring informationspecific to your operational needs. The ability to define a freeform SQL selectstatement enables the integration of existing performance monitoring tools(particularly those reporting monitored values to internal Oracle tables within thesubscribing database).
When specifying the SQL statement, do not terminate the SQL statement with asemicolon (;), forward slash (/), or backward slash (\). The select statement canreturn multiple columns and multiple rows. The trigger value (the value againstwhich the monitoring criteria is evaluated) must be an alphanumeric value.
The index parameter defines which column contains the trigger value. The columnsbegin with the number one (not zero-based).
An SQL select statement might return no rows. Use the No Rows As parameter tospecify the value to be monitored is no rows are returned from the SQL statement.
Resource model overview
Internal name OracleFreeFormSQLString
Category Oracle
Indications Changes from SQL String occurs when the string querychanged from the specified threshold.
Changes to SQL String occurs when the result of the querychanged to the specified threshold.
Mismatches SQL String occurs when the result of the querydoes not match the specified threshold.
SQL String Matches occurs when the query matches thespecified threshold.
Tasks and built-in actions None
Default cycle time 300 seconds
Target managed resourceOracleDatabaseManager, OracleInstanceManager
Indications and eventsThe following table summarizes the indications for this resource model, the eventsassociated with the indications, the default severity of the events, and where tofind a detailed description of the indication. The resource model generates an
294 IBM Tivoli Monitoring for Databases: Oracle: Reference Guide

event when the threshold you specify for the indication is triggered.
Indication Generated event Defaultseverity
Clearingevents
Page
Changes fromSQL String
Oracle_ChangesFromSQLString
Critical Yes 295
Changes to SQLString
Oracle_ChangesToSQLString
Critical Yes 296
Mismatches SQLString
Oracle_MismatchesSQLString
Critical Yes 296
SQL StringMatches
Oracle_MatchesSQLString
Critical Yes 297
Changes from SQL String indicationOccurs when the string query changed from the specified threshold. When theindication occurs often enough to trigger an event, the event delivers a message tothe Tivoli Enterprise Console in the following format:<application_label>: The result of the SQL query for Oracledatabase <DatabaseName> has changed from the predefinedthreshold of <Threshold> and is currently <Result>.
If you have Tivoli Business Systems Manager configured for your system, TivoliEnterprise Console forwards the message to Tivoli Business Systems Manager.
You can check the health of this resource model in the IBM Tivoli Monitoring WebHealth Console. For more information, see the IBM Tivoli Monitoring Web HealthConsole documentation.
The indication has the following attributes:
DatabaseNameThe name of an Oracle database. The database name contains up to 8characters and corresponds to the name specified in the CREATEDATABASE statement and identified in the DB_NAME parameter in thedatabase initialization parameter file.
Result The value being monitored within the SQL statement specified.
SQL The user-defined query that monitors your resource.
This indication has no thresholds.
The following table describes the default settings for this indication.
Setting Default value
Send indications to Tivoli Enterprise Console Yes
Send indications to Tivoli Business SystemsManager
Yes
Occurrences 1
Holes 0
Associated tasks and built-in actions None
Note: If you have Tivoli Business Systems Manager configured for your systems,Tivoli Enterprise Console automatically forwards events to Tivoli Business
Chapter 2. Resource models 295

Systems Manager. Do not change the configuration of the indication to sendevents to Tivoli Business Systems Manager.
Changes to SQL String indicationOccurs when the result of the query changed to the specified threshold. When theindication occurs often enough to trigger an event, the event delivers a message tothe Tivoli Enterprise Console in the following format:<application_label>: The result of the SQL query for Oracledatabase <DatabaseName> has changed to the predefined thresholdof <Threshold> and is currently <Result>.
If you have Tivoli Business Systems Manager configured for your system, TivoliEnterprise Console forwards the message to Tivoli Business Systems Manager.
You can check the health of this resource model in the IBM Tivoli Monitoring WebHealth Console. For more information, see the IBM Tivoli Monitoring Web HealthConsole documentation.
The indication has the following attributes:
DatabaseNameThe name of an Oracle database. The database name contains up to 8characters and corresponds to the name specified in the CREATEDATABASE statement and identified in the DB_NAME parameter in thedatabase initialization parameter file.
Result The value being monitored within the SQL statement specified.
SQL The user-defined query that monitors your resource.
This indication has no thresholds.
The following table describes the default settings for this indication.
Setting Default value
Send indications to Tivoli Enterprise Console Yes
Send indications to Tivoli Business SystemsManager
Yes
Occurrences 1
Holes 0
Associated tasks and built-in actions None
Note: If you have Tivoli Business Systems Manager configured for your systems,Tivoli Enterprise Console automatically forwards events to Tivoli BusinessSystems Manager. Do not change the configuration of the indication to sendevents to Tivoli Business Systems Manager.
Mismatches SQL String indicationOccurs when the result of the query does not match the specified threshold. Whenthe indication occurs often enough to trigger an event, the event delivers amessage to the Tivoli Enterprise Console in the following format:<application_label>: The result of the SQL query for Oracledatabase <DatabaseName> does not match the predefined thresholdof <Threshold> and is currently <Result>.
296 IBM Tivoli Monitoring for Databases: Oracle: Reference Guide

If you have Tivoli Business Systems Manager configured for your system, TivoliEnterprise Console forwards the message to Tivoli Business Systems Manager.
You can check the health of this resource model in the IBM Tivoli Monitoring WebHealth Console. For more information, see the IBM Tivoli Monitoring Web HealthConsole documentation.
The indication has the following attributes:
DatabaseNameThe name of an Oracle database. The database name contains up to 8characters and corresponds to the name specified in the CREATEDATABASE statement and identified in the DB_NAME parameter in thedatabase initialization parameter file.
Result The value being monitored within the SQL statement specified.
SQL The user-defined query that monitors your resource.
This indication has no thresholds.
The following table describes the default settings for this indication.
Setting Default value
Send indications to Tivoli Enterprise Console Yes
Send indications to Tivoli Business SystemsManager
Yes
Occurrences 1
Holes 0
Associated tasks and built-in actions None
Note: If you have Tivoli Business Systems Manager configured for your systems,Tivoli Enterprise Console automatically forwards events to Tivoli BusinessSystems Manager. Do not change the configuration of the indication to sendevents to Tivoli Business Systems Manager.
SQL String Matches indicationOccurs when the query matches the specified threshold. When the indicationoccurs often enough to trigger an event, the event delivers a message to the TivoliEnterprise Console in the following format:<application_label>: The result of the SQL query for Oracle database<DatabaseName> matches the predefined threshold of<Threshold> and is currently <Result>.
If you have Tivoli Business Systems Manager configured for your system, TivoliEnterprise Console forwards the message to Tivoli Business Systems Manager.
You can check the health of this resource model in the IBM Tivoli Monitoring WebHealth Console. For more information, see the IBM Tivoli Monitoring Web HealthConsole documentation.
The indication has the following attributes:
DatabaseNameThe name of an Oracle database. The database name contains up to 8
Chapter 2. Resource models 297
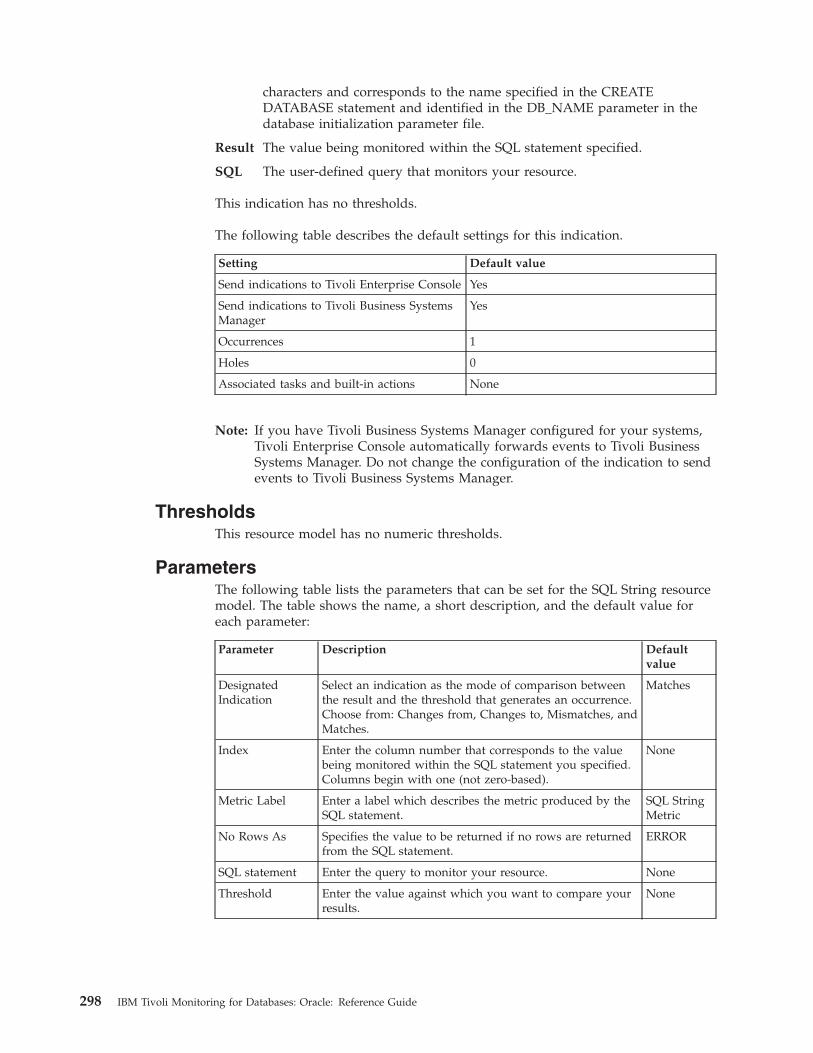
characters and corresponds to the name specified in the CREATEDATABASE statement and identified in the DB_NAME parameter in thedatabase initialization parameter file.
Result The value being monitored within the SQL statement specified.
SQL The user-defined query that monitors your resource.
This indication has no thresholds.
The following table describes the default settings for this indication.
Setting Default value
Send indications to Tivoli Enterprise Console Yes
Send indications to Tivoli Business SystemsManager
Yes
Occurrences 1
Holes 0
Associated tasks and built-in actions None
Note: If you have Tivoli Business Systems Manager configured for your systems,Tivoli Enterprise Console automatically forwards events to Tivoli BusinessSystems Manager. Do not change the configuration of the indication to sendevents to Tivoli Business Systems Manager.
ThresholdsThis resource model has no numeric thresholds.
ParametersThe following table lists the parameters that can be set for the SQL String resourcemodel. The table shows the name, a short description, and the default value foreach parameter:
Parameter Description Defaultvalue
DesignatedIndication
Select an indication as the mode of comparison betweenthe result and the threshold that generates an occurrence.Choose from: Changes from, Changes to, Mismatches, andMatches.
Matches
Index Enter the column number that corresponds to the valuebeing monitored within the SQL statement you specified.Columns begin with one (not zero-based).
None
Metric Label Enter a label which describes the metric produced by theSQL statement.
SQL StringMetric
No Rows As Specifies the value to be returned if no rows are returnedfrom the SQL statement.
ERROR
SQL statement Enter the query to monitor your resource. None
Threshold Enter the value against which you want to compare yourresults.
None
298 IBM Tivoli Monitoring for Databases: Oracle: Reference Guide

Tasks and built-in actionsNone
LoggingThis resource model does not log information.
Return codesTable 2 on page 7 contains a listing of resource model return codes, theirdescription, and what action you can take to resolve each code. The return codenumber is displayed in the IBM Tivoli Monitoring Web Health Console status field,or by using the wdmlseng command.
CLI examplewdmeditprf -P OracleProfile#tme-region -add OracleFreeFormSQLString -c 300 \-AddPar Index 1 \-DelPar MetricLabel "SQL String Metric" \-AddPar MetricLabel "My SQL String Metric Label" \-AddPar SQL "select * from dual" \-AddPar DesignatedIndication "Matches" \-DelPar NoRowsAs "ERROR" \-AddPar NoRowsAs "NO ROWS RETURNED" \-AddPar StringThreshold "STRING THRESHOLD" \-e Oracle_MismatchesSQLString \-o 1 -h 0 -severity CRITICAL -SendTBSM -SendTec \-e Oracle_ChangesToSQLString \-o 1 -h 0 -severity CRITICAL -SendTBSM -SendTec \-e Oracle_ChangesFromSQLString \-o 1 -h 0 -severity CRITICAL -SendTBSM -SendTec \-e Oracle_MatchesSQLString \-o 1 -h 0 -severity CRITICAL -SendTBSM -SendTec
Chapter 2. Resource models 299

Temporary Extents
Description
Note: This resource model is not applicable for Oracle 9i.
Alerts on those temporary segments whose free extents (maximum allowed extentsminus the segment’s currently allocated extents) are less than the specifiedthreshold.
Extents are contiguous sets of data blocks for storing data. Temporary extents areextents that make up a temporary segment. Temporary segments are created byOracle when a SQL statement needs a temporary work area to complete execution.When a statement finishes execution, the temporary segment’s extents are returnedto the system for future use.
A temporary segment is used whenever a sort is too large to be performed inmemory; that is, the amount of space required exceeds the value of theSORT_AREA_SIZE initialization parameter. Oracle creates a segment in thetemporary tablespace of the user who performs the sort operation.
If the number of extents for an object reaches the value of the MAXEXTENTSstorage parameter, and the object needs to allocate an additional extent, theoperation will fail. Check the storage parameters for the temporary tablespace, andensure that they are appropriate for your applications.
Oracle allocates and deallocates temporary segments frequently. To avoidfragmentation of the SYSTEM and other tablespaces that might hold temporarysegments by default, you should create a tablespace specifically for temporarysegments and specify this tablespace as the user’s temporary tablespace.
Resource model overview
Internal name OracleTemporaryExtents
Category Oracle
Indications Low Free Temporary Extents occurs when the number offree extents for the temporary segment is lower than thespecified threshold.
Tasks and built-in actions None
Default cycle time 600 seconds
Target managed resourceOracleDatabaseManager, OracleInstanceManager
Indications and eventsThe following table summarizes the indications for this resource model, the eventsassociated with the indications, the default severity of the events, and where tofind a detailed description of the indication. The resource model generates anevent when the threshold you specify for the indication is triggered.
300 IBM Tivoli Monitoring for Databases: Oracle: Reference Guide

Indication Generated event Defaultseverity
Clearingevents
Page
Low FreeTemporaryExtents
Oracle_Low_FreeTempExtents Critical Yes 301
Low Free Temporary Extents indicationOccurs when the number of free extents for the temporary segment is lower thanthe specified threshold. When the indication occurs often enough to trigger anevent, the event delivers a message to the Tivoli Enterprise Console in thefollowing format:<application_label>: The number of free extents for the Oracle temporary segment<SegmentOwner>.<SegmentName> in tablespace <TablespaceName>on database <DatabaseName> has crossed below the predefined threshold <Threshold>and is currently at <FreeExtents>.
If you have Tivoli Business Systems Manager configured for your system, TivoliEnterprise Console forwards the message to Tivoli Business Systems Manager.
You can check the health of this resource model in the IBM Tivoli Monitoring WebHealth Console. For more information, see the IBM Tivoli Monitoring Web HealthConsole documentation.
The indication has the following attributes:
CurrentExtentsThe number of extents currently allocated to the specified segment.
DatabaseNameThe name of an Oracle database. The database name contains up to 8characters and corresponds to the name specified in the CREATEDATABASE statement and identified in the DB_NAME parameter in thedatabase initialization parameter file.
FreeExtentsThe maximum number of extents allowed for the specified segment lessthe number of extents currently allocated to the specified segment.
MaxExtentsThe maximum number of extents allowed for the specified segment.
SegmentNameThe name of the segment.
SegmentOwnerThe username of the segment owner.
SegmentTypeThe type of the segment. Segment types include: index partition, tablepartition, table, cluster, index, rollback, deferred rollback, temporary, cache,lobsegment, and lobindex.
TablespaceNameThe name of the tablespace that contains this segment.
This indication has the following threshold:v Minimum Free Temporary Extents
For more information about this threshold, see “Thresholds” on page 302.
Chapter 2. Resource models 301

The following table describes the default settings for this indication.
Setting Default value
Send indications to Tivoli Enterprise Console Yes
Send indications to Tivoli Business SystemsManager
Yes
Occurrences 1
Holes 0
Associated tasks and built-in actions None
Note: If you have Tivoli Business Systems Manager configured for your systems,Tivoli Enterprise Console automatically forwards events to Tivoli BusinessSystems Manager. Do not change the configuration of the indication to sendevents to Tivoli Business Systems Manager.
ThresholdsThe following table lists the thresholds that can be set for the Temporary Extentsresource model. For each threshold it shows the name, a short description, and thedefault value:
Threshold Description Defaultvalue
Minimum FreeTemporary Extents
An indication occurs when the number of freetemporary extents is lower than this value.
5
ParametersThe following table lists the parameters that can be set for the Temporary Extentsresource model. The table shows the name, a short description, and the defaultvalue for each parameter:
Parameter Description Defaultvalue
Number of Rows Specifies the number of objects with the worst-caseextents to return.
50
Tasks and built-in actionsNone
LoggingYou can log data for the properties of the managed resource listed in the followingtable. The table shows the context of the managed resource and the properties thatthe resource model logs for the IBM Tivoli Monitoring Web Health Console.
302 IBM Tivoli Monitoring for Databases: Oracle: Reference Guide
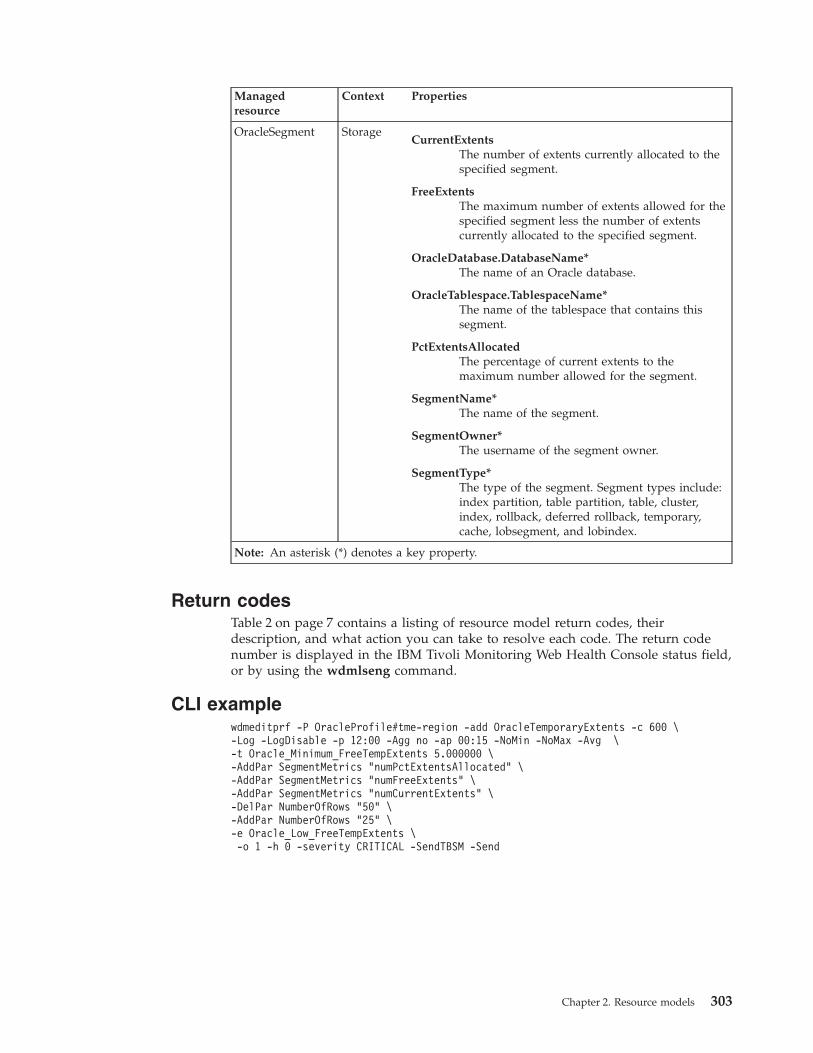
Managedresource
Context Properties
OracleSegment StorageCurrentExtents
The number of extents currently allocated to thespecified segment.
FreeExtentsThe maximum number of extents allowed for thespecified segment less the number of extentscurrently allocated to the specified segment.
OracleDatabase.DatabaseName*The name of an Oracle database.
OracleTablespace.TablespaceName*The name of the tablespace that contains thissegment.
PctExtentsAllocatedThe percentage of current extents to themaximum number allowed for the segment.
SegmentName*The name of the segment.
SegmentOwner*The username of the segment owner.
SegmentType*The type of the segment. Segment types include:index partition, table partition, table, cluster,index, rollback, deferred rollback, temporary,cache, lobsegment, and lobindex.
Note: An asterisk (*) denotes a key property.
Return codesTable 2 on page 7 contains a listing of resource model return codes, theirdescription, and what action you can take to resolve each code. The return codenumber is displayed in the IBM Tivoli Monitoring Web Health Console status field,or by using the wdmlseng command.
CLI examplewdmeditprf -P OracleProfile#tme-region -add OracleTemporaryExtents -c 600 \-Log -LogDisable -p 12:00 -Agg no -ap 00:15 -NoMin -NoMax -Avg \-t Oracle_Minimum_FreeTempExtents 5.000000 \-AddPar SegmentMetrics "numPctExtentsAllocated" \-AddPar SegmentMetrics "numFreeExtents" \-AddPar SegmentMetrics "numCurrentExtents" \-DelPar NumberOfRows "50" \-AddPar NumberOfRows "25" \-e Oracle_Low_FreeTempExtents \-o 1 -h 0 -severity CRITICAL -SendTBSM -Send
Chapter 2. Resource models 303

Temporary Extents by Tablespace
Description
Note: This resource model is not applicable for Oracle 9i.
Alerts on those temporary segments within specified tablespaces whose freeextents (maximum allowed extents minus the segment’s currently allocatedextents) are less than the specified threshold.
A temporary segment is used whenever a sort is too large to be performed inmemory; that is, the amount of space required exceeds the value of theSORT_AREA_SIZE initialization parameter. Oracle creates a segment in thetemporary tablespace of the user who performs the sort operation.
If the number of extents for an object reaches the value of the MAXEXTENTSstorage parameter, and the object needs to allocate an additional extent, theoperation will fail. Check the storage parameters for the temporary tablespace, andensure that they are appropriate for your applications.
Oracle allocates and deallocates temporary segments frequently. To avoidfragmentation of the SYSTEM and other tablespaces that might hold temporarysegments by default, you should create a tablespace specifically for temporarysegments and specify this tablespace as the user’s temporary tablespace.
This resource model can use tokens to monitor a set of tables specified by thetoken. See Appendix E, “Using tokens to customize resource model parameters” onpage 519 for more information.
Resource model overview
Internal name OracleTemporaryExtentsByTablespace
Category Oracle
Indications Low Free Temporary Extents occurs when the number offree extents for the temporary segment is lower than thespecified threshold.
Tasks and built-in actions None
Default cycle time 600 seconds
Target managed resourceOracleDatabaseManager, OracleInstanceManager
Indications and eventsThe following table summarizes the indications for this resource model, the eventsassociated with the indications, the default severity of the events, and where tofind a detailed description of the indication. The resource model generates anevent when the threshold you specify for the indication is triggered.
Indication Generated event Defaultseverity
Clearingevents
Page
Low FreeTemporaryExtents
Oracle_Low_FreeTempExtentsByTablespace Critical Yes 305
304 IBM Tivoli Monitoring for Databases: Oracle: Reference Guide
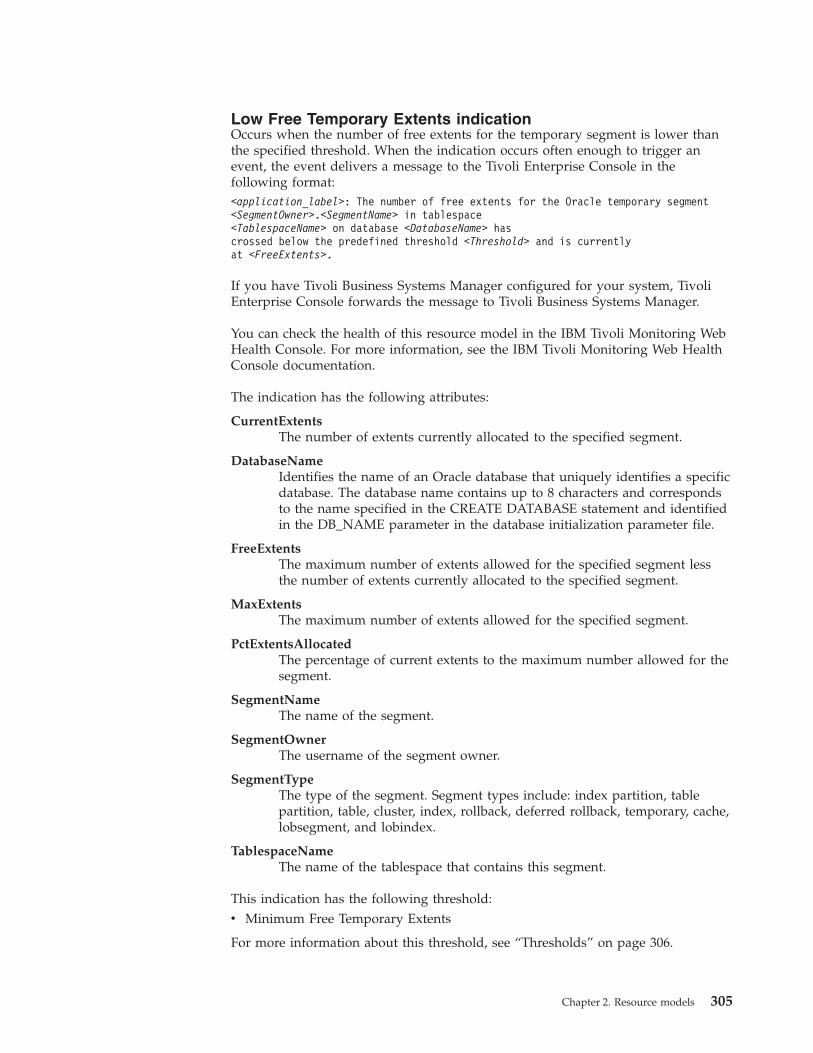
Low Free Temporary Extents indicationOccurs when the number of free extents for the temporary segment is lower thanthe specified threshold. When the indication occurs often enough to trigger anevent, the event delivers a message to the Tivoli Enterprise Console in thefollowing format:<application_label>: The number of free extents for the Oracle temporary segment<SegmentOwner>.<SegmentName> in tablespace<TablespaceName> on database <DatabaseName> hascrossed below the predefined threshold <Threshold> and is currentlyat <FreeExtents>.
If you have Tivoli Business Systems Manager configured for your system, TivoliEnterprise Console forwards the message to Tivoli Business Systems Manager.
You can check the health of this resource model in the IBM Tivoli Monitoring WebHealth Console. For more information, see the IBM Tivoli Monitoring Web HealthConsole documentation.
The indication has the following attributes:
CurrentExtentsThe number of extents currently allocated to the specified segment.
DatabaseNameIdentifies the name of an Oracle database that uniquely identifies a specificdatabase. The database name contains up to 8 characters and correspondsto the name specified in the CREATE DATABASE statement and identifiedin the DB_NAME parameter in the database initialization parameter file.
FreeExtentsThe maximum number of extents allowed for the specified segment lessthe number of extents currently allocated to the specified segment.
MaxExtentsThe maximum number of extents allowed for the specified segment.
PctExtentsAllocatedThe percentage of current extents to the maximum number allowed for thesegment.
SegmentNameThe name of the segment.
SegmentOwnerThe username of the segment owner.
SegmentTypeThe type of the segment. Segment types include: index partition, tablepartition, table, cluster, index, rollback, deferred rollback, temporary, cache,lobsegment, and lobindex.
TablespaceNameThe name of the tablespace that contains this segment.
This indication has the following threshold:v Minimum Free Temporary Extents
For more information about this threshold, see “Thresholds” on page 306.
Chapter 2. Resource models 305

The following table describes the default settings for this indication.
Setting Default value
Send indications to Tivoli Enterprise Console Yes
Send indications to Tivoli Business SystemsManager
Yes
Occurrences 1
Holes 0
Associated tasks and built-in actions None
Note: If you have Tivoli Business Systems Manager configured for your systems,Tivoli Enterprise Console automatically forwards events to Tivoli BusinessSystems Manager. Do not change the configuration of the indication to sendevents to Tivoli Business Systems Manager.
ThresholdsThe following table lists the thresholds that can be set for the Temporary Extentsby Tablespace resource model. For each threshold it shows the name, a shortdescription, and the default value:
Threshold Description Defaultvalue
Minimum FreeTemporary Extents
An indication occurs when the Free TemporaryExtents is less than this value.
5
Parameters
Note: A plus symbol (+) denotes parameters that feature selective logging.Selective logging enables you to choose metrics/properties that you want tolog. The selective logging metrics are listed in the value field of theParameters window.
The following table lists the parameters that can be set for the Temporary Extentsby Tablespace resource model. The table shows the name, a short description, andthe default value for each parameter:
Parameter Description Default value
Include/Exclude Includes or excludes the contents of thetablespaces names field.
Include
Number of Rows Specifies the number of objects with theworst-case extents to return.
50
Segment Metrics + Select the metrics you want to log. Seethe following logging table for adescription of each metric.
Current Extents
Free Extents
Percent Extents Allocated
Tablespace Names Designates the tablespace names youwant to include or exclude. Onlytemporary segments contained withinthese tablespaces will be monitored. Usespaces to separate names.
None
306 IBM Tivoli Monitoring for Databases: Oracle: Reference Guide

Tasks and built-in actionsNone
LoggingYou can log data for the properties of the managed resource listed in the followingtable. The table shows the context of the managed resource and the properties thatthe resource model logs for the IBM Tivoli Monitoring Web Health Console.
Managedresource
Context Properties
OracleSegment StorageCurrentExtents
The number of extents currently allocated to thespecified segment.
FreeExtentsThe maximum number of extents allowed forthe specified segment less the number of extentscurrently allocated to the specified segment.
OracleDatabase.DatabaseName*The name of an Oracle database.
OracleTablespace.TablespaceName*The name of the tablespace that contains thissegment.
PctExtentsAllocatedThe percentage of current extents to themaximum number allowed for the segment.
SegmentName*The name of the segment.
SegmentOwner*The username of the segment owner.
SegmentType*The type of the segment. Segment types include:index partition, table partition, table, cluster,index, rollback, deferred rollback, temporary,cache, lobsegment, and lobindex.
Note: An asterisk (*) denotes a key property.
Return codesTable 2 on page 7 contains a listing of resource model return codes, theirdescription, and what action you can take to resolve each code. The return codenumber is displayed in the IBM Tivoli Monitoring Web Health Console status field,or by using the wdmlseng command.
CLI examplewdmeditprf -P OracleProfile#tme-region \-add OracleTemporaryExtentsByTablespace -c 600 \-Log -LogDisable -p 12:00 -Agg no -ap 00:15 -NoMin -NoMax -Avg \-t Oracle_Minimum_FreeTempExtents 5.000000 \-AddPar SegmentMetrics "numPctExtentsAllocated" \-AddPar SegmentMetrics "numFreeExtents" \-AddPar SegmentMetrics "numCurrentExtents" \-AddPar IncludeExcludeTablespaces "Include" \-DelPar NumberOfRows "50" \
Chapter 2. Resource models 307

-AddPar NumberOfRows "25" \-AddPar List "SYSTEM" \-e Oracle_Low_FreeTempExtentsByTablespace \-o 1 -h 0 -severity CRITICAL -SendTBSM -SendTec
308 IBM Tivoli Monitoring for Databases: Oracle: Reference Guide

Temporary Extents by User
Description
Note: This resource model is not applicable for Oracle 9i.
Alerts on those temporary segments for a specified user whose free extents(maximum allowed extents minus the segment’s currently allocated extents) areless than the specified threshold.
A temporary segment is used whenever a sort is too large to be performed inmemory; that is, the amount of space required exceeds the value of theSORT_AREA_SIZE initialization parameter. Oracle creates a segment in thetemporary tablespace of the user who performs the sort operation.
If the number of extents for an object reaches the value of the MAXEXTENTSstorage parameter, and the object needs to allocate an additional extent, theoperation will fail. Check the storage parameters for the temporary tablespace, andensure that they are appropriate for your applications.
Oracle allocates and deallocates temporary segments frequently. To avoidfragmentation of the SYSTEM and other tablespaces that might hold temporarysegments by default, you should create a tablespace specifically for temporarysegments and specify this tablespace as the user’s temporary tablespace.
This resource model can use tokens to monitor a set of users specified by thetoken. See Appendix E, “Using tokens to customize resource model parameters” onpage 519 for more information.
Resource model overview
Internal name OracleTemporaryExtentsByUser
Category Oracle
Indications Low Free Temporary Extents occurs when the number offree extents for the temporary segment is lower than thespecified threshold.
Tasks and built-in actions None
Default cycle time 600 seconds
Target managed resourceOracleDatabaseManager, OracleInstanceManager
Indications and eventsThe following table summarizes the indications for this resource model, the eventsassociated with the indications, the default severity of the events, and where tofind a detailed description of the indication. The resource model generates anevent when the threshold you specify for the indication is triggered.
Indication Generated event Defaultseverity
Clearingevents
Page
Low FreeTemporaryExtents
Oracle_Low_FreeTempExtentsByUser Critical Yes 310
Chapter 2. Resource models 309
Low Free Temporary Extents indicationOccurs when the number of free extents for the temporary segment is lower thanthe specified threshold. When the indication occurs often enough to trigger anevent, the event delivers a message to the Tivoli Enterprise Console in thefollowing format:<application_label>: The number of free extents for the Oracle temporary segment<SegmentOwner>.<SegmentName> in tablespace <TablespaceName>on database <DatabaseName> has crossed below the predefined threshold<Threshold> and is currently at <FreeExtents>.
If you have Tivoli Business Systems Manager configured for your system, TivoliEnterprise Console forwards the message to Tivoli Business Systems Manager.
You can check the health of this resource model in the IBM Tivoli Monitoring WebHealth Console. For more information, see the IBM Tivoli Monitoring Web HealthConsole documentation.
The indication has the following attributes:
CurrentExtentsThe number of extents currently allocated to the specified segment.
DatabaseNameThe name of an Oracle database. The database name contains up to 8characters and corresponds to the name specified in the CREATEDATABASE statement and identified in the DB_NAME parameter in thedatabase initialization parameter file.
FreeExtentsThe maximum number of extents allowed for the specified segment lessthe number of extents currently allocated to the specified segment.
MaxExtentsThe maximum number of extents allowed for the specified segment.
PctExtentsAllocatedThe percentage of current extents to the maximum number allowed for thesegment.
SegmentNameThe name of the segment.
SegmentOwnerThe username of the segment owner.
SegmentTypeThe type of the segment. Segment types include: index partition, tablepartition, table, cluster, index, rollback, deferred rollback, temporary, cache,lobsegment, and lobindex.
TablespaceNameThe name of the tablespace that contains this segment.
This indication has the following threshold:v Minimum Free Temporary Extents
For more information about this threshold, see “Thresholds” on page 311.
310 IBM Tivoli Monitoring for Databases: Oracle: Reference Guide

The following table describes the default settings for this indication.
Setting Default value
Send indications to Tivoli Enterprise Console Yes
Send indications to Tivoli Business SystemsManager
Yes
Occurrences 1
Holes 0
Associated tasks and built-in actions None
Note: If you have Tivoli Business Systems Manager configured for your systems,Tivoli Enterprise Console automatically forwards events to Tivoli BusinessSystems Manager. Do not change the configuration of the indication to sendevents to Tivoli Business Systems Manager.
ThresholdsThe following table lists the thresholds that can be set for the Temporary Extentsby User resource model. For each threshold it shows the name, a short description,and the default value:
Threshold Description Defaultvalue
Minimum FreeTemporary Extents
An indication occurs when Free TemporaryExtents is less than this value.
5
Parameters
Note: A plus symbol (+) denotes parameters that feature selective logging.Selective logging enables you to choose metrics/properties that you want tolog. The selective logging metrics are listed in the value field of theParameters window.
The following table lists the parameters that can be set for the Temporary Extentsby User resource model. The table shows the name, a short description, and thedefault value for each parameter:
Parameter Description Default value
Number ofRows
Specifies the number of objects with theworst-case extents to return.
50
SegmentMetrics +
Select the metrics you want to log. See thefollowing logging table for a description ofeach metric.
Current Extents
Free Extents
Percent Extents Allocated
User Name Specifies the Oracle user name. Onlytemporary segments owned by this userwill be monitored.
None
Tasks and built-in actionsNone
Chapter 2. Resource models 311

LoggingYou can log data for the properties of the managed resource listed in the followingtable. The table shows the context of the managed resource and the properties thatthe resource model logs for the IBM Tivoli Monitoring Web Health Console.
Managedresource
Context Properties
OracleSegment StorageCurrentExtents
The number of extents currently allocated tothe specified segment.
FreeExtentsThe maximum number of extents allowed forthe specified segment less the number ofextents currently allocated to the specifiedsegment.
OracleDatabase.DatabaseName*The name of an Oracle database.
OracleTablespace.TablespaceName*The name of the tablespace that contains thissegment.
PctExtentsAllocatedThe percentage of current extents to themaximum number allowed for the segment.
SegmentName*The name of the segment.
SegmentOwner*The username of the segment owner.
SegmentType*The type of the segment. Segment typesinclude: index partition, table partition, table,cluster, index, rollback, deferred rollback,temporary, cache, lobsegment, and lobindex.
Note: An asterisk (*) denotes a key property.
Return codesTable 2 on page 7 contains a listing of resource model return codes, theirdescription, and what action you can take to resolve each code. The return codenumber is displayed in the IBM Tivoli Monitoring Web Health Console status field,or by using the wdmlseng command.
CLI examplewdmeditprf -P OracleProfile#tme-region -add OracleTemporaryExtentsByUser -c 600 \-Log -LogDisable -p 12:00 -Agg no -ap 00:15 -NoMin -NoMax -Avg \-t Oracle_Minimum_FreeTempExtentsByUser 5.000000 \-AddPar IncludeUser "SYS" \-AddPar SegmentMetrics "numPctExtentsAllocated" \-AddPar SegmentMetrics "numFreeExtents" \-AddPar SegmentMetrics "numCurrentExtents" \-DelPar NumberOfRows "50" \-AddPar NumberOfRows "25" \-e Oracle_Low_FreeTempExtentsByUser \-o 1 -h 0 -severity CRITICAL -SendTBSM -SendTec
312 IBM Tivoli Monitoring for Databases: Oracle: Reference Guide
Transaction
DescriptionMonitors the following:v Any transactions locked by another user and returns the longest time, in
seconds, that a transaction has been blockedv The total number of active transactions as a percentage of the TRANSACTIONS
initialization parameter for the instancev The number of client requests made per transactionv The amount of DML (Data Manipulation Language) work that each transaction
performsv An overview of the work rate being run against the instancev The identity of long-running transactions and how long those transactions have
been running
Set up the response level thresholds to suit your particular environment.
Transactions are logical units of work that contain one or more SQL statementsexecuted by a single user. Transactions begin with the user’s first executable SQLstatement and end when the transactions are committed or rolled back by the user.Long-running transactions are currently active transactions whose process time hasexceeded the threshold value.
Note: If a batch process occurs while this resource model is scheduled, thethresholds might not be valid during the time when the batch process isrunning.
Blocked transactions are transactions that are blocked by another user’s lock. Blockedtransactions can also occur when users connect to the system, run one or moreSQL statements, and do not commit or roll back their transactions, thus stoppingothers from performing certain tasks on the objects. For the High Lock Wait Timethreshold, you should specify an acceptable time limit in seconds that a transactionshould wait for an unreleased lock before the resource model triggers.
Active transactions are transactions that are currently executing. The activetransaction percentage is calculated by taking the number of active transactionsdivided by the maximum number of concurrent transactions as defined by theTRANSACTIONS initialization parameter for the instance. Monitoring activetransactions is useful to determine the efficiency of the database. Once thatTRANSACTIONS limit is reached, the database hangs. It remains hung until othertransactions complete.
If the active transaction value regularly reports a 90% or greater usage figure,increase the TRANSACTIONS initialization parameter for the instance. This setsthe maximum number of concurrent transactions allowed for that instance.Increasing this parameter will also increase the SGA size and can increase thenumber of rollback segments allocated for an 8i database or a 9i database inmanual undo management mode.
Active transactions require memory in the SGA for process and recording. Eachtransaction is assigned to a rollback or undo segment to record the entries. A highnumber of active transactions requires a high number of rollback or undosegments. If the percentage of active transactions is high, there could be a spaceproblem for the process and recording of these transactions. If an instance is usingrollback segments, and a transaction runs out of rollback space but needs to keep
Chapter 2. Resource models 313

writing, it will either reuse an extent from a rollback segment, or will allocate anew extent for the rollback segment. Either way, the database could slow down tohandle the space shortage. If the number of transactions is increasing, it might benecessary to add rollback segments. Use the Rollback Segments resource model todetermine if there is contention for rollback segments.
The TRANSACTIONS initialization parameter defaults to 1.1* the SESSIONSinitialization parameter, and, in turn, PROCESSES. This allows for recursivetransactions. Recursive transactions are system generated SQL statements that occurbehind the scenes in order to execute a transaction.
If this resource model regularly reports a low percentage figure, you can choose todecrease the TRANSACTIONS parameter. By decreasing this number, you free theSGA memory that can be allocated for other purposes.
Calls Per Transaction are client requests made per transaction. Calls do any of thefollowing: describe, parse, open, fetch, close, or execute. Calls per transaction canbe used to detect changes in the application, or in the way in which it is beingused. The reported value can change considerably when ad hoc queries are issued.
Block changes are caused by Data Manipulation Language (DML) work. Creating ordropping indexes impacts this value considerably and might lead to inconclusivevalues because the figure also includes changes to index blocks.
Resource model overview
Internal name OracleTransaction
Category Oracle
Indications High Active Transactions Percentage occurs when thenumber of active transactions exceeds the specifiedthreshold.
High Block Changes Per Transaction occurs when theamount of DML (Data Manipulation Language) work thateach transaction performs is high.
High Call Rate occurs when the call rate exceeds thespecified threshold.
High Calls Per Transaction occurs when the calls pertransaction value exceeds the specified threshold.
High Lock Wait Time occurs when the lock wait timeexceeds the specified threshold.
High Long Running Transactions occurs when the longrunning transaction value exceeds the specified threshold.
Tasks and built-in actions None
Default cycle time 600 seconds
Target managed resourceOracleDatabaseManager, OracleInstanceManager
Indications and eventsThe following table summarizes the indications for this resource model, the eventsassociated with the indications, the default severity of the events, and where tofind a detailed description of the indication. The resource model generates anevent when the threshold you specify for the indication is triggered.
314 IBM Tivoli Monitoring for Databases: Oracle: Reference Guide

Indication Generated event Defaultseverity
Clearingevents
Page
High ActiveTransactionsPercentage
Oracle_High_ActiveTransactionsPercentage
Critical Yes 315
High BlockChanges PerTransaction
Oracle_High_BlockChangesPerTransaction
Critical Yes 316
High Call Rate Oracle_High_CallRate Critical Yes 317
High Calls PerTransaction
Oracle_High_CallsPerTransaction
Critical Yes 318
High Lock WaitTime
Oracle_High_LockWaitTime Critical Yes 319
High LongRunningTransactions
Oracle_High_LongRunningTransactions
Critical Yes 320
High Active Transactions Percentage indicationOccurs when the number of active transactions exceeds the specified threshold.When the indication occurs often enough to trigger an event, the event delivers amessage to the Tivoli Enterprise Console in the following format:<application_label>: The active transactions percentage for Oracleinstance <InstanceName> has crossed above the predefined thresholdof <Threshold> percent and is currentlyat <ActiveTransactionsPercentage> percent.
If you have Tivoli Business Systems Manager configured for your system, TivoliEnterprise Console forwards the message to Tivoli Business Systems Manager.
You can check the health of this resource model in the IBM Tivoli Monitoring WebHealth Console. For more information, see the IBM Tivoli Monitoring Web HealthConsole documentation.
This indication provides information that can help the DBA determine whether theTRANSACTIONS parameter should be increased or decreased. TheTRANSACTIONS initialization parameter specifies the maximum number ofconcurrent transactions. Greater values increase the size of the SGA and canincrease the number of rollback segments allocated. The default value exceedsSESSIONS (and, in turn, PROCESSES) to allow for recursive transactions.
The indication has the following attributes:
ActiveTransactionsPercentageThe total number of active transactions as a percentage of theTRANSACTIONS initialization parameter for the instance.
DatabaseNameThe name of an Oracle database. The database name contains up to 8characters and corresponds to the name specified in the CREATEDATABASE statement and identified in the DB_NAME parameter in thedatabase initialization parameter file.
InstanceNameThe name of an Oracle database instance. The instance name is identified
Chapter 2. Resource models 315

by the INSTANCE_NAME parameter in the database initializationparameter file and corresponds to the Oracle System Identifier (SID) of theinstance.
This indication has the following threshold:v Maximum Active Transactions Percentage
For more information about this threshold, see “Thresholds” on page 322.
The following table describes the default settings for this indication.
Setting Default value
Send indications to Tivoli Enterprise Console Yes
Send indications to Tivoli Business SystemsManager
Yes
Occurrences 1
Holes 0
Associated tasks and built-in actions None
Note: If you have Tivoli Business Systems Manager configured for your systems,Tivoli Enterprise Console automatically forwards events to Tivoli BusinessSystems Manager. Do not change the configuration of the indication to sendevents to Tivoli Business Systems Manager.
High Block Changes Per Transaction indicationOccurs when the amount of DML (Data Manipulation Language) work that eachtransaction performs is high. When the indication occurs often enough to triggeran event, the event delivers a message to the Tivoli Enterprise Console in thefollowing format:<application_label>: The block changes per transaction for Oracle instance<InstanceName> has crossed above the predefined threshold of <Threshold>block changes per transaction and is currently at <BlockChangesPerTransaction> blockchanges per transaction.
If you have Tivoli Business Systems Manager configured for your system, TivoliEnterprise Console forwards the message to Tivoli Business Systems Manager.
You can check the health of this resource model in the IBM Tivoli Monitoring WebHealth Console. For more information, see the IBM Tivoli Monitoring Web HealthConsole documentation.
The indication has the following attributes:
BlockChangesPerTransactionThe amount of DML (Data Manipulation Language) work that eachtransaction performs.
DatabaseNameThe name of an Oracle database. The database name contains up to 8characters and corresponds to the name specified in the CREATEDATABASE statement and identified in the DB_NAME parameter in thedatabase initialization parameter file.
InstanceNameThe name of an Oracle database instance. The instance name is identified
316 IBM Tivoli Monitoring for Databases: Oracle: Reference Guide

by the INSTANCE_NAME parameter in the database initializationparameter file and corresponds to the Oracle System Identifier (SID) of theinstance.
This indication has the following threshold:v Maximum Block Changes Per Transaction
For more information about this threshold, see “Thresholds” on page 322.
The following table describes the default settings for this indication.
Setting Default value
Send indications to Tivoli Enterprise Console Yes
Send indications to Tivoli Business SystemsManager
Yes
Occurrences 1
Holes 0
Associated tasks and built-in actions None
Note: If you have Tivoli Business Systems Manager configured for your systems,Tivoli Enterprise Console automatically forwards events to Tivoli BusinessSystems Manager. Do not change the configuration of the indication to sendevents to Tivoli Business Systems Manager.
High Call Rate indicationOccurs when the call rate exceeds the specified threshold. When the indicationoccurs often enough to trigger an event, the event delivers a message to the TivoliEnterprise Console in the following format:<application_label>: The call rate for Oracle instance <InstanceName>has crossed above the predefined threshold of <Threshold> calls per secondand is currently at <CallRate> calls per second.
If you have Tivoli Business Systems Manager configured for your system, TivoliEnterprise Console forwards the message to Tivoli Business Systems Manager.
You can check the health of this resource model in the IBM Tivoli Monitoring WebHealth Console. For more information, see the IBM Tivoli Monitoring Web HealthConsole documentation.
This indication provides an overview of the work rate being run against theinstance. Calls do any of the following: describe, parse, open, fetch, close, orexecute. The call rate is dependent on the design of an application. Use of an arrayinterface will also affect this figure.
The indication has the following attributes:
CallRateThe work rate being run against the instance. Calls do any of thefollowing: describe, parse, open, fetch, close, or execute.
DatabaseNameThe name of an Oracle database. The database name contains up to 8characters and corresponds to the name specified in the CREATEDATABASE statement and identified in the DB_NAME parameter in thedatabase initialization parameter file.
Chapter 2. Resource models 317

InstanceNameThe name of an Oracle database instance. The instance name is identifiedby the INSTANCE_NAME parameter in the database initializationparameter file and corresponds to the Oracle System Identifier (SID) of theinstance.
This indication has the following threshold:v High Call Rate
For more information about this threshold, see “Thresholds” on page 322.
The following table describes the default settings for this indication.
Setting Default value
Send indications to Tivoli Enterprise Console Yes
Send indications to Tivoli Business SystemsManager
Yes
Occurrences 1
Holes 0
Associated tasks and built-in actions None
Note: If you have Tivoli Business Systems Manager configured for your systems,Tivoli Enterprise Console automatically forwards events to Tivoli BusinessSystems Manager. Do not change the configuration of the indication to sendevents to Tivoli Business Systems Manager.
High Calls Per Transaction indicationOccurs when the calls per transaction value exceeds the specified threshold. Whenthe indication occurs often enough to trigger an event, the event delivers amessage to the Tivoli Enterprise Console in the following format:<application_label>: The calls per transaction for Oracle instance<InstanceName> has crossed above the predefined threshold of <Threshold>calls per transaction and is currently at <CallsPerTransaction>calls per transaction.
If you have Tivoli Business Systems Manager configured for your system, TivoliEnterprise Console forwards the message to Tivoli Business Systems Manager.
You can check the health of this resource model in the IBM Tivoli Monitoring WebHealth Console. For more information, see the IBM Tivoli Monitoring Web HealthConsole documentation.
This metric monitors the number of client requests made per transaction. Calls doany of the following: describe, parse, open, fetch, close, or execute. Calls pertransaction can be used to detect changes in the application, or in the way inwhich it is being used. The reported value can change considerably when ad hocqueries are issued.
The indication has the following attributes:
CallsPerTransactionThe number of client requests made per transaction.
DatabaseNameThe name of an Oracle database. The database name contains up to 8
318 IBM Tivoli Monitoring for Databases: Oracle: Reference Guide
characters and corresponds to the name specified in the CREATEDATABASE statement and identified in the DB_NAME parameter in thedatabase initialization parameter file.
InstanceNameThe name of an Oracle database instance. The instance name is identifiedby the INSTANCE_NAME parameter in the database initializationparameter file and corresponds to the Oracle System Identifier (SID) of theinstance.
This indication has the following threshold:v High Calls Per Transaction
For more information about this threshold, see “Thresholds” on page 322.
The following table describes the default settings for this indication.
Setting Default value
Send indications to Tivoli Enterprise Console Yes
Send indications to Tivoli Business SystemsManager
Yes
Occurrences 1
Holes 0
Associated tasks and built-in actions None
Note: If you have Tivoli Business Systems Manager configured for your systems,Tivoli Enterprise Console automatically forwards events to Tivoli BusinessSystems Manager. Do not change the configuration of the indication to sendevents to Tivoli Business Systems Manager.
High Lock Wait Time indicationOccurs when the lock wait time exceeds the specified threshold. When theindication occurs often enough to trigger an event, the event delivers a message tothe Tivoli Enterprise Console in the following format:<application_label>: The lock wait time for Oracle session <SessionID>has crossed above the predefined threshold of <Threshold> seconds andis currently at <LockWaitTime> seconds.
If you have Tivoli Business Systems Manager configured for your system, TivoliEnterprise Console forwards the message to Tivoli Business Systems Manager.
You can check the health of this resource model in the IBM Tivoli Monitoring WebHealth Console. For more information, see the IBM Tivoli Monitoring Web HealthConsole documentation.
Monitors whether any transactions are locked by another user and returns thelongest time, in seconds, that a transaction has been blocked.
The indication has the following attributes:
DatabaseNameThe name of an Oracle database. The database name contains up to 8characters and corresponds to the name specified in the CREATEDATABASE statement and identified in the DB_NAME parameter in thedatabase initialization parameter file.
Chapter 2. Resource models 319

InstanceNameThe name of an Oracle database instance. The instance name is identifiedby the INSTANCE_NAME parameter in the database initializationparameter file and corresponds to the Oracle System Identifier (SID) of theinstance.
LockIDThe address of lock being waited for, if any.
LockWaitTimeThe time (in seconds) since current mode was granted.
ObjectThe name of the object.
ObjectOwnerThe username of the user who owns the schema that contains the table orindex.
SessionIDThe session identifier.
SQLTextThe text piece of a SQL statement.
UsernameThe name of the user as recognized by the Oracle server and other users sothat the user can connect to and access objects in a database. Each username is associated with a password that also must be entered to connect toan Oracle database.
This indication has the following threshold:v Maximum Lock Wait Time
For more information about this threshold, see “Thresholds” on page 322.
The following table describes the default settings for this indication.
Setting Default value
Send indications to Tivoli Enterprise Console Yes
Send indications to Tivoli Business SystemsManager
Yes
Occurrences 1
Holes 0
Associated tasks and built-in actions None
Note: If you have Tivoli Business Systems Manager configured for your systems,Tivoli Enterprise Console automatically forwards events to Tivoli BusinessSystems Manager. Do not change the configuration of the indication to sendevents to Tivoli Business Systems Manager.
High Long Running Transactions indicationOccurs when the long running transaction value exceeds the specified threshold.When the indication occurs often enough to trigger an event, the event delivers amessage to the Tivoli Enterprise Console in the following format:<application_label>: The longest running transaction time for Oracleinstance <InstanceName> has crossed above the predefined threshold of<Threshold> seconds and is currently at <TimeRunningSeconds> seconds.
320 IBM Tivoli Monitoring for Databases: Oracle: Reference Guide
If you have Tivoli Business Systems Manager configured for your system, TivoliEnterprise Console forwards the message to Tivoli Business Systems Manager.
You can check the health of this resource model in the IBM Tivoli Monitoring WebHealth Console. For more information, see the IBM Tivoli Monitoring Web HealthConsole documentation.
This indication reports possible issues and bottlenecks in the SQL or databasedesign. The output can be used to determine the identity of long-runningtransactions and how long those transactions have been running. Set up theresponse level thresholds to suit your particular environment.
The indication has the following attributes:
DatabaseNameThe name of an Oracle database. The database name contains up to 8characters and corresponds to the name specified in the CREATEDATABASE statement and identified in the DB_NAME parameter in thedatabase initialization parameter file.
InstanceNameThe name of an Oracle database instance. The instance name is identifiedby the INSTANCE_NAME parameter in the database initializationparameter file and corresponds to the Oracle System Identifier (SID) of theinstance.
SessionIDThe session identifier.
StartTimeThe start time for the specified transaction.
SQLTextThe text piece of a SQL statement.
TimeRunningSecondsThe number of seconds the transaction has been running.
UsernameThe name of the user as recognized by the Oracle server and other users sothat the user can connect to and access objects in a database. Each username is associated with a password that also must be entered to connect toan Oracle database.
This indication has the following threshold:v Maximum Long Running Transactions
For more information about this threshold, see “Thresholds” on page 322.
The following table describes the default settings for this indication.
Setting Default value
Send indications to Tivoli Enterprise Console Yes
Send indications to Tivoli Business SystemsManager
Yes
Occurrences 1
Holes 0
Associated tasks and built-in actions None
Chapter 2. Resource models 321

Note: If you have Tivoli Business Systems Manager configured for your systems,Tivoli Enterprise Console automatically forwards events to Tivoli BusinessSystems Manager. Do not change the configuration of the indication to sendevents to Tivoli Business Systems Manager.
ThresholdsThe following table lists the thresholds that can be set for the Transaction resourcemodel. For each threshold it shows the name, a short description, and the defaultvalue:
Threshold Description Defaultvalue
Maximum ActiveTransactions Percentage
An indication occurs when the percentage ofactive transactions exceeds this value.
95
Maximum BlockChanges Per Transaction
An indication occurs when the percentage ofblock changes per transaction exceeds this value.
3
Maximum Call Rate An indication occurs when the call rate exceedsthis value.
90
Maximum Calls PerTransaction
An indication occurs when the number of callsper transaction exceeds this value.
1500
Maximum Lock WaitTime
An indication occurs when the number of callsper transaction exceeds this value.
60
Maximum Long RunningTransactions
An indication occurs when the number of longrunning transactions exceeds this value.
180
Parameters
Note: A plus symbol (+) denotes parameters that feature selective logging.Selective logging enables you to choose metrics/properties that you want tolog. The selective logging metrics are listed in the value field of theParameters window.
The following table lists the parameters that can be set for the Transaction resourcemodel. The table shows the name, a short description, and the default value foreach parameter:
Parameter Description Default value
InstanceMetrics +
Select the metrics you want to log. Seethe following logging table for adescription of each metric.
Active Transactions Percentage
Block Changes Per Transaction
Call Rate
Calls Per Transaction
322 IBM Tivoli Monitoring for Databases: Oracle: Reference Guide

Parameter Description Default value
Session Metrics+
Select the metrics you want to log. Seethe following logging table for adescription of each metric.
Blocked Transactions
LockID
Object
Object Owner
SQL Text
User Name
TransactionMetrics +
Select the metrics you want to log. Seethe following logging table for adescription of each metric.
SQL Text
User Name
Start Time
Running Time
Tasks and built-in actionsNone
LoggingYou can log data for the properties of the managed resource listed in the followingtable. The table shows the context of the managed resource and the properties thatthe resource model logs for the IBM Tivoli Monitoring Web Health Console.
Managed resource Context Properties
OracleTransaction TransactionAddress*
The location of the transaction state object.
TransactionSecondsTime of the longest running transaction.
OracleDatabase.DatabaseName*The name of an Oracle database.
OracleInstance.InstanceName*The name of an Oracle database instance.
OracleSession.SessionID*The session identifier.
StartTimeThe start time for the specified transaction.
UsernameThe name of the user owning thetransaction.
Chapter 2. Resource models 323
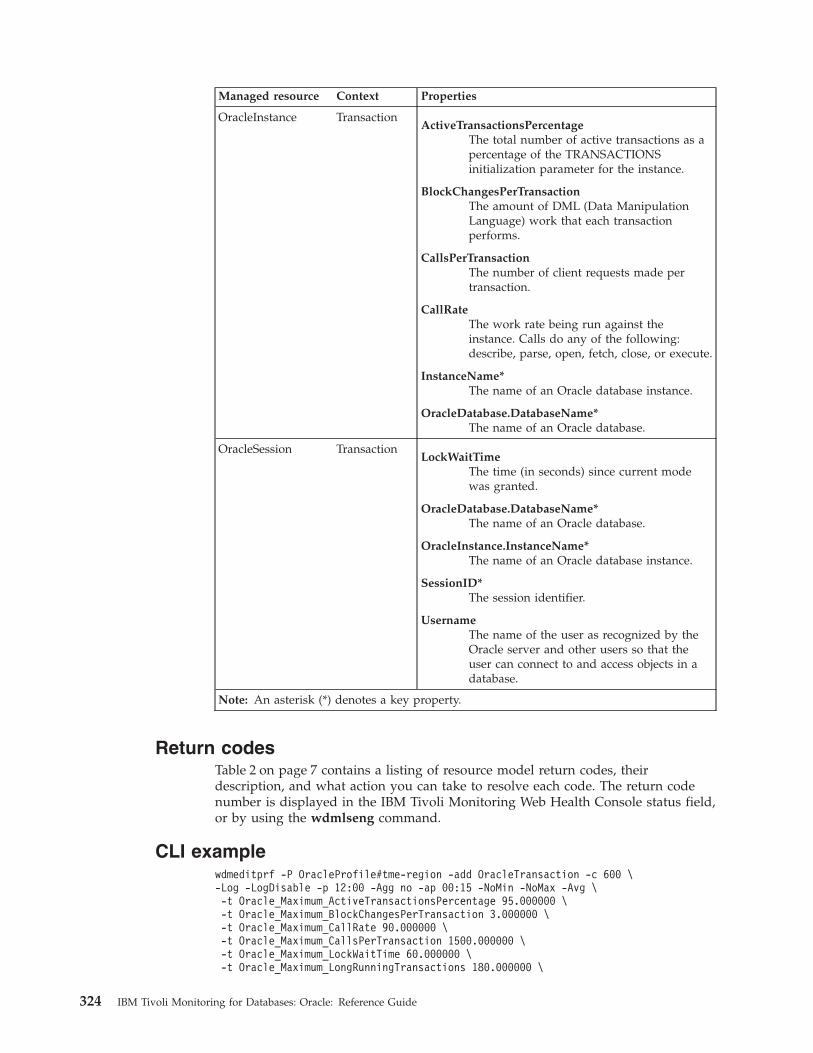
Managed resource Context Properties
OracleInstance TransactionActiveTransactionsPercentage
The total number of active transactions as apercentage of the TRANSACTIONSinitialization parameter for the instance.
BlockChangesPerTransactionThe amount of DML (Data ManipulationLanguage) work that each transactionperforms.
CallsPerTransactionThe number of client requests made pertransaction.
CallRateThe work rate being run against theinstance. Calls do any of the following:describe, parse, open, fetch, close, or execute.
InstanceName*The name of an Oracle database instance.
OracleDatabase.DatabaseName*The name of an Oracle database.
OracleSession TransactionLockWaitTime
The time (in seconds) since current modewas granted.
OracleDatabase.DatabaseName*The name of an Oracle database.
OracleInstance.InstanceName*The name of an Oracle database instance.
SessionID*The session identifier.
UsernameThe name of the user as recognized by theOracle server and other users so that theuser can connect to and access objects in adatabase.
Note: An asterisk (*) denotes a key property.
Return codesTable 2 on page 7 contains a listing of resource model return codes, theirdescription, and what action you can take to resolve each code. The return codenumber is displayed in the IBM Tivoli Monitoring Web Health Console status field,or by using the wdmlseng command.
CLI examplewdmeditprf -P OracleProfile#tme-region -add OracleTransaction -c 600 \-Log -LogDisable -p 12:00 -Agg no -ap 00:15 -NoMin -NoMax -Avg \-t Oracle_Maximum_ActiveTransactionsPercentage 95.000000 \-t Oracle_Maximum_BlockChangesPerTransaction 3.000000 \-t Oracle_Maximum_CallRate 90.000000 \-t Oracle_Maximum_CallsPerTransaction 1500.000000 \-t Oracle_Maximum_LockWaitTime 60.000000 \-t Oracle_Maximum_LongRunningTransactions 180.000000 \
324 IBM Tivoli Monitoring for Databases: Oracle: Reference Guide

-AddPar InstanceMetrics "numActiveTransactionsPercentage" \-AddPar InstanceMetrics "numCallsPerTransaction" \-AddPar InstanceMetrics "numBlockChangesPerTransaction" \-AddPar InstanceMetrics "CallRate" \-AddPar TransactionMetrics "TransactionSeconds" \-AddPar TransactionMetrics "StartTime" \-AddPar TransactionMetrics "strUsername" \-AddPar TransactionMetrics "strSQLText" \-AddPar SessionMetrics "numLockWaitTime" \-e Oracle_High_CallRate \
-o 1 -h 0 -severity CRITICAL -SendTBSM -SendTec \-e Oracle_High_ActiveTransactionsPercentage \
-o 1 -h 0 -severity CRITICAL -SendTBSM -SendTec \-e Oracle_High_BlockChangesPerTransaction \
-o 1 -h 0 -severity CRITICAL -SendTBSM -SendTec \-e Oracle_High_CallsPerTransaction \
-o 1 -h 0 -severity CRITICAL -SendTBSM -SendTec \-e Oracle_High_LongRunningTransactions \
-o 1 -h 0 -severity CRITICAL -SendTBSM -SendTec \-e Oracle_High_LockWaitTime \
-o 1 -h 0 -severity CRITICAL -SendTBSM -SendTec
Chapter 2. Resource models 325

Undo Space
Description
Note: This resource model is applicable for Oracle 9i only.
Monitors the following undo errors:v No Space Errorv Snapshot Too Old Error
All Oracle databases maintain records of committed transactions, or changes to thedata. These records are used to roll back, or undo, changes to the database. Oraclerefers to these stored transaction records as undo. The Undo Space resource modelmonitors the space availability for storing these undo records. If undo records donot have enough space to record the data, an error occurs.
There are two ways to manage undo space:v Manual undo management mode, with rollback segmentsv Automatic undo management mode, with undo tablespaces
The undo management mode is determined at instant startup using theUNDO_MANAGEMENT initialization parameter. The option to automaticallymanage undo space with undo tablespaces is new with Oracle9i.
The snapshot too old error, or ORA-01555 error, occurs when rollback records neededby a reader for consistent read are overwritten by other writers. If this error occurswhen in automatic undo management mode, increase the setting of theUNDO_RETENTION initialization parameter to be appropriate to the size of theundo tablespace.
The no space error occurs when requested space is denied in the undo tablespacebecause all of the space in the undo tablespace was in use by active transactions. Ifthis error occurs, add more space to the undo tablespace.
Resource model overview
Internal name OracleUndoSpace
Category Oracle
Indications High No Space Error Count (Interval) occurs when the nospace error count exceeds the specified threshold.
High Snapshot Old Error Count (Interval) occurs when thesnapshot old error count exceeds the specified threshold.
Tasks and built-in actions None
Default cycle time 1800 seconds
Target managed resourceOracleDatabaseManager, OracleInstanceManager
Indications and eventsThe following table summarizes the indications for this resource model, the eventsassociated with the indications, the default severity of the events, and where tofind a detailed description of the indication. The resource model generates an
326 IBM Tivoli Monitoring for Databases: Oracle: Reference Guide

event when the threshold you specify for the indication is triggered.
Indication Generated event Defaultseverity
Clearingevents
Page
High No SpaceError Count(Interval)
Oracle_High_IntervalNoSpaceErrCnt
Critical Yes 327
High SnapshotOld Error Count(Interval)
Oracle_High_IntervalSSOldErrCnt
Critical Yes 328
High No Space Error Count (Interval) indicationOccurs when the no space error count exceeds the specified threshold. When theindication occurs often enough to trigger an event, the event delivers a message tothe Tivoli Enterprise Console in the following format:<application_label>: The no space error count for Oracle instance<InstanceName> has crossed above the predefined threshold of <Threshold>executions and is currently at <IntervalNoSpaceErrCnt> executions.
If you have Tivoli Business Systems Manager configured for your system, TivoliEnterprise Console forwards the message to Tivoli Business Systems Manager.
You can check the health of this resource model in the IBM Tivoli Monitoring WebHealth Console. For more information, see the IBM Tivoli Monitoring Web HealthConsole documentation.
The No Space Error Count is the count of nospaceerrcnt occurrences for the priormonitoring cycle. If this value exceeds zero, add more space to the undotablespace.
The indication has the following attributes:
DatabaseNameThe name of an Oracle database. The database name contains up to 8characters and corresponds to the name specified in the CREATEDATABASE statement and identified in the DB_NAME parameter in thedatabase initialization parameter file.
InstanceNameThe name of an Oracle database instance. The instance name is identifiedby the INSTANCE_NAME parameter in the database initializationparameter file and corresponds to the Oracle System Identifier (SID) of theinstance.
IntervalNoSpaceErrCntIdentifies the number of times space was requested in the undo tablespace,but no free space was available. That is, all of the space in the undotablespace was in use by active transactions. To correct this, add morespace to the undo tablespace.
This indication has the following threshold:v Maximum No Space Error Count (Interval)
For more information about this threshold, see “Thresholds” on page 329.
Chapter 2. Resource models 327

The following table describes the default settings for this indication.
Setting Default value
Send indications to Tivoli Enterprise Console Yes
Send indications to Tivoli Business SystemsManager
Yes
Occurrences 1
Holes 0
Associated tasks and built-in actions None
Note: If you have Tivoli Business Systems Manager configured for your systems,Tivoli Enterprise Console automatically forwards events to Tivoli BusinessSystems Manager. Do not change the configuration of the indication to sendevents to Tivoli Business Systems Manager.
High Snapshot Old Error Count (Interval) indicationOccurs when the snapshot old error count exceeds the specified threshold. Whenthe indication occurs often enough to trigger an event, the event delivers amessage to the Tivoli Enterprise Console in the following format:<application_label>: The snapshot old error count for Oracle instance<InstanceName> has crossed above the predefined threshold of <Threshold>errors and is currently at <IntervalSSOldErrCnt> errors.
If you have Tivoli Business Systems Manager configured for your system, TivoliEnterprise Console forwards the message to Tivoli Business Systems Manager.
You can check the health of this resource model in the IBM Tivoli Monitoring WebHealth Console. For more information, see the IBM Tivoli Monitoring Web HealthConsole documentation.
The Snapshot Old Error Count is the count of ssolderrcnt for the prior monitoringcycle. If this value exceeds zero, increase the UNDO_RETENTION initializationparameter.
The indication has the following attributes:
DatabaseNameThe name of an Oracle database. The database name contains up to 8characters and corresponds to the name specified in the CREATEDATABASE statement and identified in the DB_NAME parameter in thedatabase initialization parameter file.
InstanceNameThe name of an Oracle database instance. The instance name is identifiedby the INSTANCE_NAME parameter in the database initializationparameter file and corresponds to the Oracle System Identifier (SID) of theinstance.
IntervalSSOldErrCntSnapshot Too Old error count.
This indication has the following threshold:v Maximum Snapshot Old Error Count (Interval)
For more information about this threshold, see “Thresholds” on page 329.
328 IBM Tivoli Monitoring for Databases: Oracle: Reference Guide

The following table describes the default settings for this indication.
Setting Default value
Send indications to Tivoli Enterprise Console Yes
Send indications to Tivoli Business SystemsManager
Yes
Occurrences 1
Holes 0
Associated tasks and built-in actions None
Note: If you have Tivoli Business Systems Manager configured for your systems,Tivoli Enterprise Console automatically forwards events to Tivoli BusinessSystems Manager. Do not change the configuration of the indication to sendevents to Tivoli Business Systems Manager.
ThresholdsThe following table lists the thresholds that can be set for the Undo resourcemodel. For each threshold it shows the name, a short description, and the defaultvalue:
Threshold Description Defaultvalue
Maximum No SpaceError Count (Interval)
An indication occurs when the no space errorcount exceeds this value.
0
Maximum Snapshot OldError Count (Interval)
An indication occurs when the snapshot old errorcount exceeds this value.
0
Parameters
Note: A plus symbol (+) denotes parameters that feature selective logging.Selective logging enables you to choose metrics/properties that you want tolog. The selective logging metrics are listed in the value field of theParameters window.
The following table lists the parameters that can be set for the Undo Spaceresource model. The table shows the name, a short description, and the defaultvalue for each parameter:
Parameter Description Default value
UndoStatMetrics +
Select the metrics you want to log. Seethe following logging table for adescription of each metric.
No Space Error Count(Interval)
Snapshot Old Error Count(Interval)
Tasks and built-in actionsNone
Chapter 2. Resource models 329

LoggingYou can log data for the properties of the managed resource listed in the followingtable. The table shows the context of the managed resource and the properties thatthe resource model logs for the IBM Tivoli Monitoring Web Health Console.
Managed resource Context Properties
OracleUndoStat UndoBeginTime*
The start of the specified instance timeinterval.
NoSpaceErrCntThe number of OER (snapshot too old) errorsreported in the current instance. If this is anonzero value, the current undo tablespacerequires more space.
OracleDatabase.DatabaseName*The name of an Oracle database.
OracleInstance.InstanceName*The name of an Oracle database instance.
SSOldErrCntSnapshot Too Old error count.
Note: An asterisk (*) denotes a key property.
Return codesTable 2 on page 7 contains a listing of resource model return codes, theirdescription, and what action you can take to resolve each code. The return codenumber is displayed in the IBM Tivoli Monitoring Web Health Console status field,or by using the wdmlseng command.
CLI examplewdmeditprf -P OracleProfile#tme-region -add OracleUndoSpace -c 1800 \-Log -LogDisable -p 12:00 -Agg no -ap 00:15 -NoMin -NoMax -Avg \-t Oracle_Maximum_IntervalNoSpaceErrCnt 0.000000 \-t Oracle_Maximum_IntervalSSOldErrCnt 0.000000 \-AddPar UndoStatMetrics "IntervalNoSpaceErrCnt" \-AddPar UndoStatMetrics "IntervalSSOldErrCnt" \-e Oracle_High_IntervalSSOldErrCnt \
-o 1 -h 0 -severity CRITICAL -SendTBSM -SendTec \-e Oracle_High_IntervalNoSpaceErrCnt \
-o 1 -h 0 -severity CRITICAL -SendTBSM -SendTec
330 IBM Tivoli Monitoring for Databases: Oracle: Reference Guide

Chapter 3. Tasks
IBM Tivoli Monitoring for Databases: Oracle tasks are operations or sets ofoperations that perform database operations routinely. This chapter containsinformation about the tasks for IBM Tivoli Monitoring for Databases: Oracle. Thesection for each task describes how to configure and run each task by covering thefollowing information:
DescriptionPurpose of the task.
Authorization roleRole required to run the task.
Target endpointIdentifies the target upon which the task is run. Target endpoints include:OracleDatabaseManager, OracleInstanceManager, or managed node (wherethe server is installed).
GUI data entry fieldsList of the options for the task that are available in the Tivoli desktopgraphical user interfaces. These options correspond to the parameters inthe command syntax.
CLI syntaxSyntax for the wruntask command that you use to run every task from thecommand line. All tasks that you run from the command line contain thefollowing syntax:wruntask -t <"Task Name"> -l <"Task Library Name"> -h <"Object Name"> \-a <"Additional Parameters">
where:
-t <Task Name>Name of the task to run.
-l <Task Library Name>Name of the task library that contains the task. ITMOracleTasks isthe name of the task library for IBM Tivoli Monitoring forDatabases: Oracle.
-h <Object Name>Name of the object about which the task gathers data.
-a <Additional Parameters>Additional parameters for the task, such as Date or DatabaseName. Some of the additional parameters might be required andsome might be optional. The parameters must be typed in theorder in which they appear in the syntax. If you do not want tospecify a parameter, use empty quotation marks like the following:-a ""
Use quotation marks around the name of a variable that contains spaces.
CLI exampleThe example for the task contains a brief description of the example andan example of the syntax, such as the following:
331

The task in the following example shows the current running SQL for theuser SYS:wruntask -t CurrentRunningSQL -l ITMOracleTasks -h@OracleDatabaseManager:v816@manzana -o 15 -a SelectionType=All
-a UserName="SYS"
Usage notesAdditional notes relevant to using the task.
See alsoAdditional commands of relevance for using the task.
There is a corresponding IBM Tivoli Monitoring for Databases: Oracle commandfor each of the IBM Tivoli Monitoring for Databases: Oracle tasks. Table 7 on page333 contains the names of the commands. Using a Tivoli task offers the followingbenefits:v You can set up tasks to run on a schedule within a Tivoli job.v You can set up tasks to run in response to the indications for a resource model.v You can set arguments for a task in the Tivoli desktop graphical user interface
and save them to run at another time (In contrast, you must type all argumentsevery time you run a task in the command line.).
v Tasks appear as icons that you can click and run in the Tivoli desktop graphicaluser interface.
See the Working with Tasks and Jobs chapter of the IBM Tivoli Monitoring forDatabases: Oracle User’s Guide for more information on working with tasks and jobs.
Table 6. IBM Tivoli Monitoring for Databases: Oracle tasks
Goal Refer to
Comparing the standard task GUI and CLI names “List of Tasks by GUI and CLI Names” on page333
Understanding the task dialogs common to standard tasks “Common task dialog boxes” on page 333
Understanding the AdvancedNetworkOption task “AdvancedNetworkOption” on page 336
Understanding the ConfigureTECOracle task “ConfigureTECOracle” on page 339
Understanding the CurrentRunningSQL task “CurrentRunningSQL” on page 344
Understanding the DisableResourceModels task “DisableResourceModels” on page 346
Understanding the EnableResourceModels task “EnableResourceModels” on page 349
Understanding the Listener task “Listener” on page 351
Understanding the OracleTBSMDiscovery task “OracleTBSMDiscovery” on page 353
Refer to the IBM Tivoli Monitoring for Databases: Oracle User’s Guide for informationon running and customizing tasks.
Refer to the Tivoli Management Framework Reference Manual for information on thewruntask command.
332 IBM Tivoli Monitoring for Databases: Oracle: Reference Guide
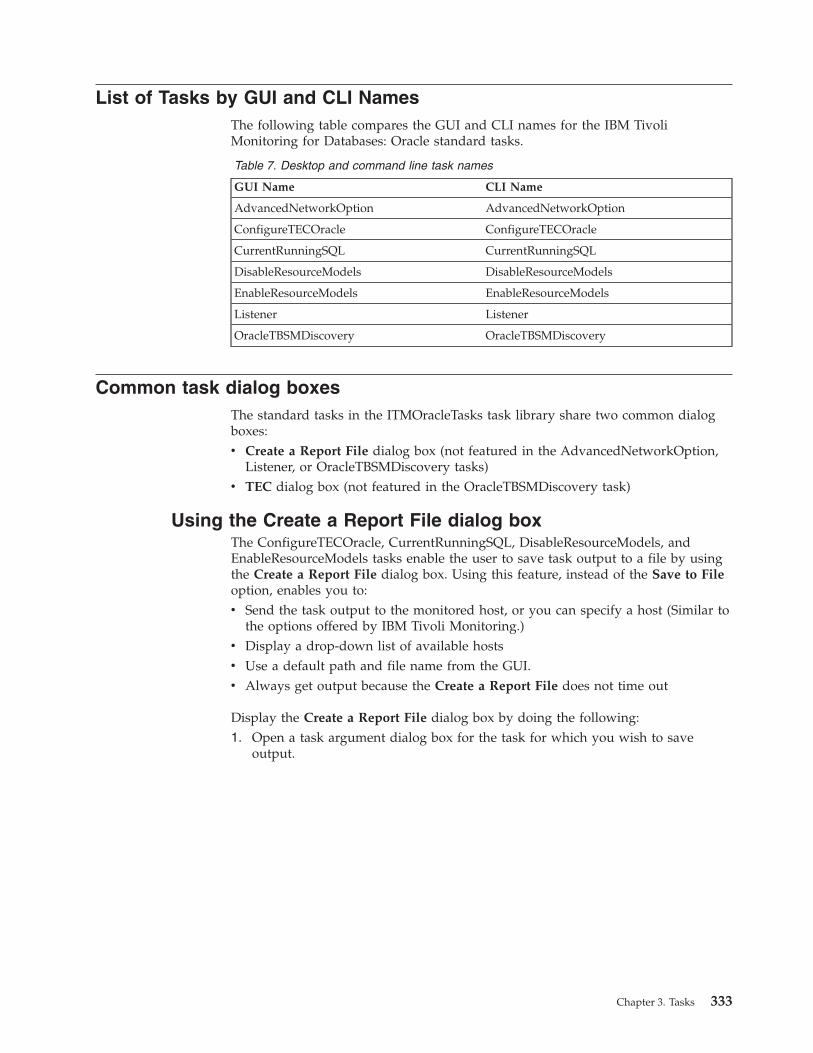
List of Tasks by GUI and CLI NamesThe following table compares the GUI and CLI names for the IBM TivoliMonitoring for Databases: Oracle standard tasks.
Table 7. Desktop and command line task names
GUI Name CLI Name
AdvancedNetworkOption AdvancedNetworkOption
ConfigureTECOracle ConfigureTECOracle
CurrentRunningSQL CurrentRunningSQL
DisableResourceModels DisableResourceModels
EnableResourceModels EnableResourceModels
Listener Listener
OracleTBSMDiscovery OracleTBSMDiscovery
Common task dialog boxesThe standard tasks in the ITMOracleTasks task library share two common dialogboxes:v Create a Report File dialog box (not featured in the AdvancedNetworkOption,
Listener, or OracleTBSMDiscovery tasks)v TEC dialog box (not featured in the OracleTBSMDiscovery task)
Using the Create a Report File dialog boxThe ConfigureTECOracle, CurrentRunningSQL, DisableResourceModels, andEnableResourceModels tasks enable the user to save task output to a file by usingthe Create a Report File dialog box. Using this feature, instead of the Save to Fileoption, enables you to:v Send the task output to the monitored host, or you can specify a host (Similar to
the options offered by IBM Tivoli Monitoring.)v Display a drop-down list of available hostsv Use a default path and file name from the GUI.v Always get output because the Create a Report File does not time out
Display the Create a Report File dialog box by doing the following:1. Open a task argument dialog box for the task for which you wish to save
output.
Chapter 3. Tasks 333

2. Click Report to File to display the Create a Report File dialog box.
Report to FileSelect to save the task output to a file.
Path and file nameDisplays the directory path for the output destination. This is also the filename for the output after it is saved.
This field displays a list of variables as a default response. All variables,except WTEMP, are local to the endpoint running the task. You can usesome or all of the variables, or you can enter your own specificinformation. The variables include:
${DATE}The current date in YYYYMMDD format.
${TIME}The current time in HHMMSS format.
${NODE}The name of the managed node (host) on which to run the task.Although this information is also included in ${ENDPOINT}, usinga separate variable, such as ${NODE}, makes sorting easier.
${TASK}The task CLI command name, such as DisableResourceModels.
${ENDPOINT}The name of the endpoint on which to run the task.
${WTEMP}A temporary directory on the managed node on which to save thefile. The task uses the wtemp command to identify this directory.
On monitored hostSelect to create the output file on the monitored host against which thetask was run (Mutually exclusive with On specified host.).
On specified hostCreates the output file on the specified host as designated in the Hostname field (Mutually exclusive with On monitored host.). You cannot saveoutput files on multiple hosts.
334 IBM Tivoli Monitoring for Databases: Oracle: Reference Guide
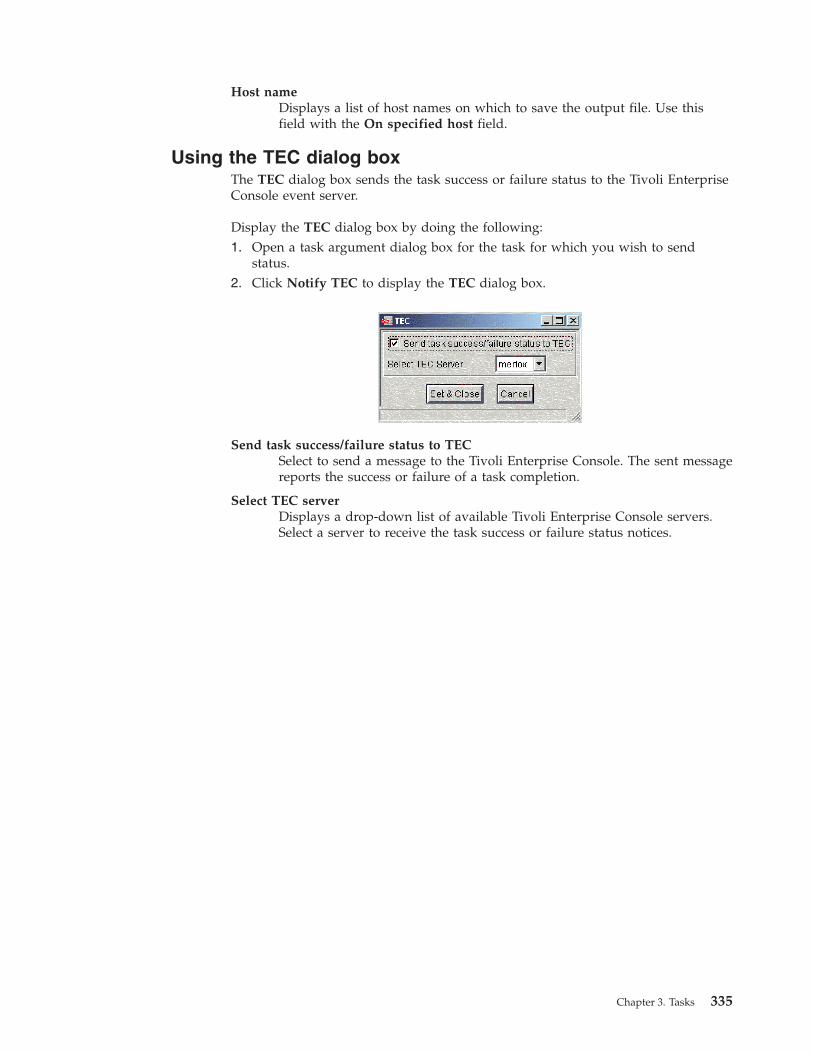
Host nameDisplays a list of host names on which to save the output file. Use thisfield with the On specified host field.
Using the TEC dialog boxThe TEC dialog box sends the task success or failure status to the Tivoli EnterpriseConsole event server.
Display the TEC dialog box by doing the following:1. Open a task argument dialog box for the task for which you wish to send
status.2. Click Notify TEC to display the TEC dialog box.
Send task success/failure status to TECSelect to send a message to the Tivoli Enterprise Console. The sent messagereports the success or failure of a task completion.
Select TEC serverDisplays a drop-down list of available Tivoli Enterprise Console servers.Select a server to receive the task success or failure status notices.
Chapter 3. Tasks 335

AdvancedNetworkOption
DescriptionAdvancedNetworkOption does the following, depending on the options youchoose:v Disables Advanced Network Optionv Enables Advanced Network Option
You must configure SQL*Net for encryption. After you install and configureSQL*Net, you must install and configure Advanced Network Option on both theclient and server machines. Configure the parameters for SQL*Net in theSQLNET.ORA file. Set the following parameters:v SQLNET.CRYPTO_SEED — Set to a random string of characters that acts as the
seed value for the generation. This value must be set on the client and theserver. The minimum length of this seed is 10 characters while the maximumlength is 70 characters. We recommend that you use many characters for the keyto ensure that it is more random and difficult to decrypt.
v SQLNET.ENCRYPTION_SERVER and SQLNET.ENCRYPTION_CLIENT —Specify one of the following set levels for each parameter:– ACCEPTED — enable encryption if requested by the other side– REJECTED — do not enable encryption if requested by the other side– REQUESTED — enable encryption if allowed by the other side– REQUIRED — enable encryption or abort the connection
You must also configure IBM Tivoli Monitoring for Databases: Oracle. The client,OracleSQLEngine, is local to the database machine. The local client means there isno network transfer of data requiring encryption. Configure the client side of theAdvanced Network Option in the SQLNET.ORA file. The database server and theremote SQLPLUS clients connecting to this database are set up for AdvancedNetwork Option in their SQLNET.ORA files. However, since the IBM TivoliMonitoring for Databases: Oracle processes that connect to the database run locallyon the database machine, these should also be considered as clients. Therefore, youmust define the client side settings locally in the SQLNET.ORA file. A mismatchwith SQLNET.CRYPTO_CHECKSUM_SERVER andSQLNET.CRYPTO_CHECKSUM_CLIENT causes an error. The following settingscause an ORA-12660 error:
sqlnet.crypto_checksum_client=REJECTED
sqlnet.crypto_checksum_server=REQUIRED
—OR—
sqlnet.crypto_checksum_client=REQUIRED
sqlnet.crypto_checksum_server=REJECTED
Valid specifications include:
sqlnet.crypto_checksum_client=REQUESTED
sqlnet.crypto_checksum_server=ACCEPTED
336 IBM Tivoli Monitoring for Databases: Oracle: Reference Guide
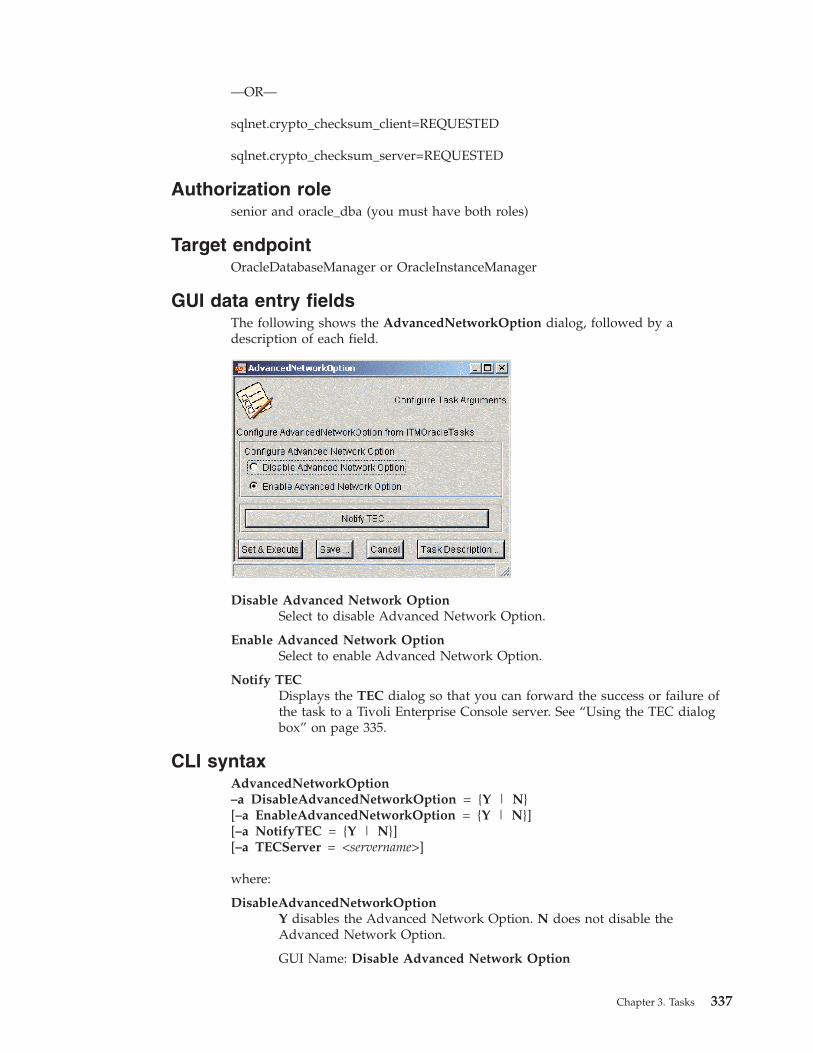
—OR—
sqlnet.crypto_checksum_client=REQUESTED
sqlnet.crypto_checksum_server=REQUESTED
Authorization rolesenior and oracle_dba (you must have both roles)
Target endpointOracleDatabaseManager or OracleInstanceManager
GUI data entry fieldsThe following shows the AdvancedNetworkOption dialog, followed by adescription of each field.
Disable Advanced Network OptionSelect to disable Advanced Network Option.
Enable Advanced Network OptionSelect to enable Advanced Network Option.
Notify TECDisplays the TEC dialog so that you can forward the success or failure ofthe task to a Tivoli Enterprise Console server. See “Using the TEC dialogbox” on page 335.
CLI syntaxAdvancedNetworkOption–a DisableAdvancedNetworkOption = {Y | N}[–a EnableAdvancedNetworkOption = {Y | N}][–a NotifyTEC = {Y | N}][–a TECServer = <servername>]
where:
DisableAdvancedNetworkOptionY disables the Advanced Network Option. N does not disable theAdvanced Network Option.
GUI Name: Disable Advanced Network Option
Chapter 3. Tasks 337
EnableAdvancedNetworkOptionY enables the Advanced Network Option. N does not enable the AdvancedNetwork Option.
GUI Name: Enable Advanced Network Option
NotifyTECY sends the success or failure message to the Tivoli Enterprise Console. Ndoes not send the success or failure message to Tivoli Enterprise Console.The default is N. If you specify Y, specify a valid TECServer argument orno message is sent.
CLI examplewruntask-t AdvancedNetworkOption-l "ITMOracleTasks"-a DisableAdvancedNetworkOption=Y
Usage notesAdvanced Network Option provides data encryption to prevent unauthorizedpersons from reading data over a network. All data is encrypted into a cipher, andthen transmitted over the network. Encryption keys, known only to the sendingand receiving parties, are used to encrypt and decrypt the data between the userand receiver. Encryption keys should not be sent over the network, so AdvancedNetwork Option uses an algorithm to automatically distribute session keys. Adifferent random session key generates for every SQL*Net connection. When thealgorithm generates a session key, a random number is used to secure the key. Theencryption process starts when the client and server generate random numbers,which helps prevent attacks that depend upon repetitive sequences.
See alsoSee also the following commands in the Tivoli Management Framework ReferenceManual: wruntask, wcrttask, wcrtjob, and wgettask.
338 IBM Tivoli Monitoring for Databases: Oracle: Reference Guide
ConfigureTECOracle
DescriptionProvides Tivoli Enterprise Console configuration options. You can configure TivoliEnterprise Console to receive events from the following:v IBM Tivoli Monitoring resource modelsv Tasks from the ITMOracleTasks task library
The task adds the class and rule set definitions of the selected configuration optionto a valid rule base, if the class and rule set definitions are not already defined inthe specified rule base. For more information, see the IBM Tivoli Monitoring forDatabases: Oracle User’s Guide.
Before you run this task, the following software must be installed:v Tivoli Enterprise Console Event Serverv IBM Tivoli Monitoring for Databases: Oracle on the Tivoli management region
server of the Tivoli management region on which you want to run this task.
ConfigureTECOracle does the following, depending on the options you choose:v Creates a rule base in the directory where Tivoli Enterprise Console is installed.v Provides Tivoli Enterprise Console configuration for the specified options. It
adds class and rule set definitions to a valid rule base for the options, if they arenot already defined in the specified rule base.
v Copies a specified rule base into the newly created rule base.v Loads the rule base.v Restarts the event server.v Creates event groups (This option is not available for Tivoli Enterprise Console,
Version 3.7.).v Adds filters to an event group for the Tivoli Enterprise Console configuration
options specified (This option is not available for Tivoli Enterprise Console,Version 3.7.).
Authorization rolesenior and oracle_dba (you must have both roles)
Target endpointManaged node (where the event server is installed)
Chapter 3. Tasks 339
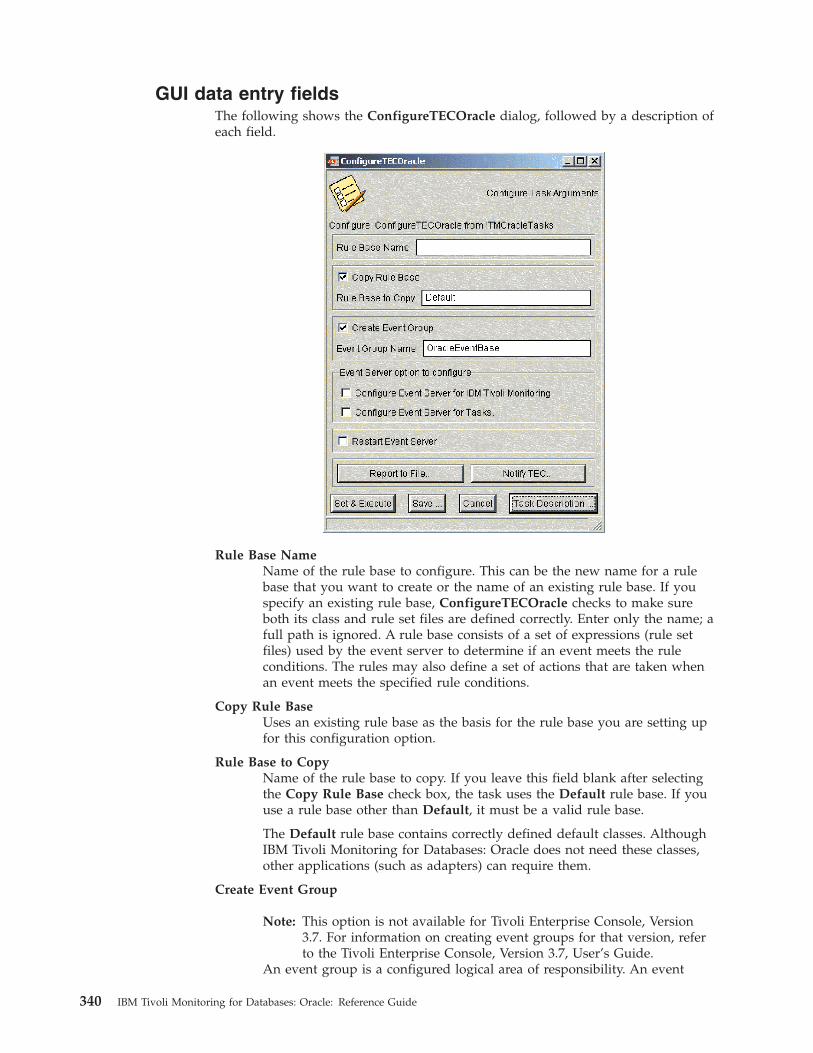
GUI data entry fieldsThe following shows the ConfigureTECOracle dialog, followed by a description ofeach field.
Rule Base NameName of the rule base to configure. This can be the new name for a rulebase that you want to create or the name of an existing rule base. If youspecify an existing rule base, ConfigureTECOracle checks to make sureboth its class and rule set files are defined correctly. Enter only the name; afull path is ignored. A rule base consists of a set of expressions (rule setfiles) used by the event server to determine if an event meets the ruleconditions. The rules may also define a set of actions that are taken whenan event meets the specified rule conditions.
Copy Rule BaseUses an existing rule base as the basis for the rule base you are setting upfor this configuration option.
Rule Base to CopyName of the rule base to copy. If you leave this field blank after selectingthe Copy Rule Base check box, the task uses the Default rule base. If youuse a rule base other than Default, it must be a valid rule base.
The Default rule base contains correctly defined default classes. AlthoughIBM Tivoli Monitoring for Databases: Oracle does not need these classes,other applications (such as adapters) can require them.
Create Event Group
Note: This option is not available for Tivoli Enterprise Console, Version3.7. For information on creating event groups for that version, referto the Tivoli Enterprise Console, Version 3.7, User’s Guide.
An event group is a configured logical area of responsibility. An event
340 IBM Tivoli Monitoring for Databases: Oracle: Reference Guide

group is used to notify users that an event that matches a specified set ofcriteria has occurred. Event groups are configured on the event server tocreate a single alarm indicator that represents many different, but related,events. Each event group has its own icon on the event console.
Event Group Name
Note: This option is not available for Tivoli Enterprise Console, Version3.7. For information on creating event groups for that version, referto the Tivoli Enterprise Console, Version 3.7, User’s Guide.
Name of the event group that you create. If you select the Create EventGroup check box and do not enter an event group name, the task createsand configures an event group called OracleEventBase. If you specify anexisting event group, the task configures the event group that you named.
Event Server option to configureTo set up an event group, you must define the selection criteria of theevents you want to monitor. This data constitutes an event group filter.You can select from the following two predefined filters to add to theEvent Group Name specified elsewhere in this dialog (see Event GroupName).v Configure Event Server for IBM Tivoli Monitoring — enables the event
server to receive all events sent from resource models.v Configure Event Server for Tasks — enables the event server to receive
all events sent from ITMOracleTasks tasks.
Restart Event ServerLoads the rule base and starts the event server, if it is not already running.When you create a new rule base or modify an existing one, you mustrestart the event server for any rule base configurations to take effect.
If the event server is not running, this task starts it. If the event server isrunning, this task stops and restarts it. If you do not use the task to restartthe event server, you must load the rule base and restart the event servermanually. (See the IBM Tivoli Enterprise Console User’s Guide for informationon how to do this.)
Report to FileDisplays the Create a Report File dialog so that you can save the outputinformation for this task to a file. See “Using the Create a Report Filedialog box” on page 333.
Notify TECDisplays the TEC dialog so that you can forward the success or failure ofthe task to a Tivoli Enterprise Console server. See “Using the TEC dialogbox” on page 335.
CLI syntaxConfigureTECOracle–a RuleBaseName = <rulebasename>[–a CopyBase = {Y | N}][–a CopyBaseName = <rulebasetocopy>][–a ConfigureForITM = {Y | N}][–a ConfigureForTask = {Y | N}]}[–a RestartServer = {Y | N}][–a NotifyTEC = {Y | N}][–a TECServer = <servername>][–a ReportToFile = {Y | N}]
Chapter 3. Tasks 341

[–a ReportFileName = <filename>][–a SaveReportFileOn = {MonitoredHost | SpecifiedHost}][–a ReportHostName = <hostname>]
where:
RuleBaseName<rulebasename> is the name to give to the rule base.
GUI Name: Rule Base Name
CopyBaseY uses an existing rule base as the basis for the rule base you are settingup. N does not use the existing rule base.
GUI Name: Copy Rule Base
CopyBaseName<rulebasetocopy> is the name of the rule base to copy.
GUI Name: Rule Base to Copy
ConfigureForITMY enables the event server to receive all events sent from resource models.N does not set this option.
GUI Name: Configure Event Server for IBM Tivoli Monitoring
ConfigureForTaskY enables the event server to receive all events sent from ITMOracleTaskstasks. N does not set this option.
GUI Name: Configure Event Server for Tasks
RestartServerY restarts the server. N does not restart the server.
GUI Name: Restart Event Server
NotifyTECY sends the success or failure message to the Tivoli Enterprise Console. Ndoes not send the success or failure message to Tivoli Enterprise Console.The default is N. If you specify Y, specify a valid TECServer argument orno message is sent.
TECServer<servername> is the name of the Tivoli Enterprise Console server to receivethe message.
ReportToFileY saves the output of this task to a file. N does not save the output of thistask to a file and is the default. If Y, specify the file with ReportFileNameand, optionally, the host with SaveReportFileOn.
ReportFileName<filename> is the path to and the name of the file to create as the taskoutput.
SaveReportFileOnMonitoredHost puts the output file on the host the task was run against.SpecifiedHost puts the output file on a specified host. Specify the hostwith ReportHostName.
342 IBM Tivoli Monitoring for Databases: Oracle: Reference Guide

ReportHostName<hostname> is the name of the host on which to save the file created whenyou use the SpecifiedHost argument.
CLI examplewruntask-t ConfigureTECOracle-l "ITMOracleTasks"-h @ManagedNode:nemuchay-a RuleBaseName=OracleBase1-a CopyBase=Y-a CopyBaseName=Default-a ConfigureForITM=Y-a ConfigureForTask=Y
Usage notesYou must restart the event server after defining new classes so that TivoliEnterprise Console can recognize and display instances of classes. Because eachcommand defines new classes, you must stop and restart the event server for eachinstance of these defined classes.
See alsoSee also the following commands in the Tivoli Management Framework ReferenceManual: wruntask, wcrttask, wcrtjob and wgettask.
Chapter 3. Tasks 343
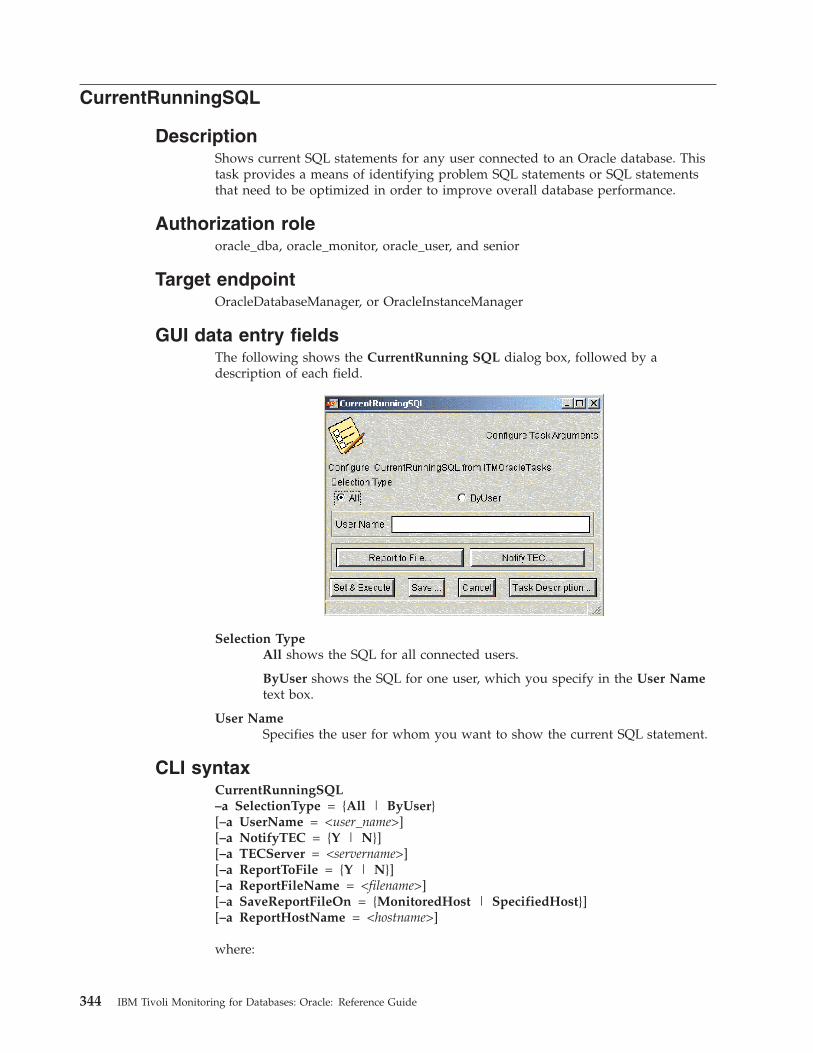
CurrentRunningSQL
DescriptionShows current SQL statements for any user connected to an Oracle database. Thistask provides a means of identifying problem SQL statements or SQL statementsthat need to be optimized in order to improve overall database performance.
Authorization roleoracle_dba, oracle_monitor, oracle_user, and senior
Target endpointOracleDatabaseManager, or OracleInstanceManager
GUI data entry fieldsThe following shows the CurrentRunning SQL dialog box, followed by adescription of each field.
Selection TypeAll shows the SQL for all connected users.
ByUser shows the SQL for one user, which you specify in the User Nametext box.
User NameSpecifies the user for whom you want to show the current SQL statement.
CLI syntaxCurrentRunningSQL–a SelectionType = {All | ByUser}[–a UserName = <user_name>][–a NotifyTEC = {Y | N}][–a TECServer = <servername>][–a ReportToFile = {Y | N}][–a ReportFileName = <filename>][–a SaveReportFileOn = {MonitoredHost | SpecifiedHost}][–a ReportHostName = <hostname>]
where:
344 IBM Tivoli Monitoring for Databases: Oracle: Reference Guide

SelectionTypeAll specifies that you want to display the current SQL statements for allusers.
ByUser specifies that you want to display the SQL statement for a specificuser account.
UserName<user_name> specifies the user for whom you want to show the currentSQL statement.
NotifyTECY sends the success or failure message to the Tivoli Enterprise Console. Ndoes not send the success or failure message to Tivoli Enterprise Console.The default is N. If you specify Y, specify a valid TECServer argument orno message is sent.
TECServer<servername> is the name of the Tivoli Enterprise Console server to sendthe message to.
ReportToFileY saves the output of this task to a file. N does not save the output of thistask to a file and is the default. If Y, specify the file with ReportFileNameand, optionally, the host with SaveReportFileOn.
ReportFileName<filename> is the path to and the name of the file to create as the taskoutput.
SaveReportFileOnMonitoredHost puts the output file on the host the task was run against.SpecifiedHost puts the output file on a specified host. Specify the hostwith ReportHostName.
ReportHostName<hostname> is the name of the host on which to save the file created whenyou use the SpecifiedHost argument.
CLI exampleThe following example shows the current running SQL for the user SYS.wruntask-t CurrentRunningSQL-l ITMOracleTasks-h @OracleDatabaseManager:v817@manzana-o 15-a SelectionType=All-a UserName="SYS"
Usage notesMost system performance problems are caused by poorly written SQL and PL/SQLstatements. This task enables the DBA to identify SQL statements that are mostfrequently executed during the course of an applications execution. Analysis andoptimization of the SQL statement can improve application performance.
See alsoSee also the following commands in the Tivoli Management Framework ReferenceManual: wruntask, wcrttask, wcrtjob and wgettask.
Chapter 3. Tasks 345

DisableResourceModels
DescriptionDisables any resource models that are running on an Oracle database or instanceendpoint and optionally shuts down the database.
Note: Upon machine reboot or IBM Tivoli Monitoring engine restart, IBM TivoliMonitoring enables all resource models previously distributed to thedatabase or instance object to monitor the database or instance. If you wantto disable monitoring for an Oracle database or instance to which youpreviously distributed resource models, following any machine reboot orengine restart, run this task to disable any resource models from monitoringthe database or instance.
Authorization roleoracle_dba and senior
Target endpointOracleDatabaseManager, or OracleInstanceManager
GUI data entry fieldsThe following shows the DisableResourceModels dialog, followed by adescription of each field.
Shutdown Displays a list of the shutdown options that determine whathappens to the database when the resource models are disabled.v Abort — Specifies that the database will be aborted.v Immediate — Specifies that the database will shut down
immediately.v NoShutdown — Specifies that the database will not be shut
down.v Normal — Specifies that the database will shut down normally.v Transactional — Allows active transactions to complete before
shutting down the database.
CLI syntaxDisableResourceModels–a ShutdownOption = {Abort | Immediate | NoShutdown |Normal | Transactional}[–a NotifyTEC = {Y | N}]
346 IBM Tivoli Monitoring for Databases: Oracle: Reference Guide

[–a TECServer = <servername>][–a ReportToFile = {Y | N}][–a ReportFileName = <filename>][–a SaveReportFileOn = {MonitoredHost | SpecifiedHost}][–a ReportHostName = <hostname>]
where:
ShutdownOptionSpecifies what happens to the database when the resource models aredisabled. See the description in the GUI Data Entry Fields section.
NotifyTECY sends the success or failure message to the Tivoli Enterprise Console. Ndoes not send the success or failure message to Tivoli Enterprise Console.The default is N. If you specify Y, specify a valid TECServer argument orno message is sent.
TECServer<servername> the name of the Tivoli Enterprise Console server to receivethe message.
ReportToFileY saves the output of this task to a file. N does not save the output of thistask to a file and is the default. If Y, specify the file with ReportFileNameand, optionally, the host with SaveReportFileOn.
ReportFileName<filename> is the path to and the name of the file to create as the taskoutput.
SaveReportFileOnMonitoredHost puts the output file on the host the task was run against.SpecifiedHost puts the output file on a specified host. Specify the hostwith ReportHostName.
ReportHostName<hostname> is the name of the host on which to save the file created whenyou use the SpecifiedHost argument.
CLI exampleThe following example disables Oracle resource models running against thedatabase v817@manzana, but does not shut down the database.wruntask-t DisableResourceModels-l ITMOracleTasks-h @OracleDatabaseManager:v817@manzana-o 15-a ShutdownOption=NoShutdown
Usage notesThis task disables any resource models that are running on an Oracle database orinstance endpoint and optionally shuts down the database. This is useful if thedatabase is taken down for maintenance purposes. If this task is not run, the usermust manually disable all resource models to prevent spurious alerts from firing.In a spurious alert, resource models give errors because they are unable to connectto the database endpoint. When this task is run, the IBM Tivoli Monitoring engineis updated to disable the resource models , but IBM Tivoli Monitoring profiles are
Chapter 3. Tasks 347

not updated and may still show the resource models as enabled. To selectivelydisable resource models, edit and distribute the relevant IBM Tivoli Monitoringprofiles rather than running this task.
See alsoSee also the following commands in the Tivoli Management Framework ReferenceManual: wruntask, wcrttask, wcrtjob, and wgettask.
348 IBM Tivoli Monitoring for Databases: Oracle: Reference Guide

EnableResourceModels
DescriptionEnables previously disabled resource models by directly updating the IBM TivoliMonitoring engine at the endpoint and, optionally, starting the database.
Authorization roleoracle_dba and senior
Target endpointOracleDatabaseManager, or OracleInstanceManager
GUI data entry fieldsThe following shows the EnableResourceModels dialog box. A description of eachfield follows.
StartupDisplays the startup options that determine what happens to the databaseafter you enable the resource models. If your Oracle server allows multipleinstances to access a single database concurrently, specify whether to startthe instance in Exclusive or Parallel mode. NoStartup does not start upthe database.
CLI syntaxEnableResourceModels–a StartupOption = {Exclusive | Parallel | NoStartup}[–a NotifyTEC = {Y | N}][–a TECServer = <servername>][–a ReportToFile = {Y | N}][–a ReportFileName = <filename>][–a SaveReportFileOn = {MonitoredHost | SpecifiedHost}][–a ReportHostName = <hostname>]
where:
StartupOptionIf your Oracle server allows multiple instances to access a single databaseconcurrently, specify whether to start the instance in Exclusive or Parallelmode. NoStartup does not start up the database.
NotifyTECY sends the success or failure message to the Tivoli Enterprise Console. N
Chapter 3. Tasks 349

does not send the success or failure message to Tivoli Enterprise Console.The default is N. If you specify Y, specify a valid TECServer argument orno message is sent.
TECServer<servername> is the name of the Tivoli Enterprise Console server to sendthe message to.
ReportToFileY saves the output of this task to a file. N does not save the output of thistask to a file and is the default. If Y, specify the file with ReportFileNameand, optionally, the host with SaveReportFileOn.
ReportFileName<filename> is the path to and the name of the file to create as the taskoutput.
SaveReportFileOnMonitoredHost puts the output file on the host the task was run against.SpecifiedHost puts the output file on a specified host. Specify the hostwith ReportHostName.
ReportHostName<hostname> is the name of the host on which to save the file created whenyou use the SpecifiedHost argument.
CLI exampleThe following example enables Oracle resource models that are running against thedatabase v817@manzana, but does not start the database.wruntask-t EnableResourceModels-l ITMOracleTasks-h @OracleDatabaseManager:v817@manzana-o 15-a StartupOption=NoStartup
Usage notesThis task enables previously disabled resource models by directly updating theIBM Tivoli Monitoring engine at the endpoint. It does not alter the resource modelstate in IBM Tivoli Monitoring profiles. The task only enables resource models thatwere previously disabled by the DisableResourceModels task. The task alsooptionally starts up the Oracle database.
See alsoSee also the following commands in the Tivoli Management Framework ReferenceManual: wruntask, wcrttask, wcrtjob, and wgettask.
350 IBM Tivoli Monitoring for Databases: Oracle: Reference Guide

Listener
DescriptionStarts or stops the Oracle Listener. The Oracle Listener is a process on the Oracleserver that listens for connection requests from clients.
Authorization roleoracle_dba and senior
Target endpointOracleDatabaseManager, or OracleInstanceManager
GUI data entry fieldsThe following shows the Listener dialog box, followed by a description of eachfield.
Set Listener stateStarts or stops the Oracle Listener.
Start Listener specifies that the listener process will be started.
Stop Listener specifies that the listener process will be stopped.
Name Specifies the name of the specific listener to start or stop. The defaultlistener name,listener, displays automatically in the Name text box.
PasswordSpecifies the password required to stop a listener process as specified inOracle.
Note: The value entered in this field must match the value assigned to thePASSWORDS_LISTENER parameter in the Administrator’slistener.ORA file. The listener.ORA file is located in the installedOracle directory.
Chapter 3. Tasks 351

Notify TECDisplays the TEC dialog so that you can forward the success or failure ofthe task to a Tivoli Enterprise Console server. See “Using the TEC dialogbox” on page 335.
CLI syntaxListener–a listener_mode = {Start Listener | Stop Listener}[–a listener_name = <listener_name>][–a listener_password = <listener_password>]
where:
listener_modeSpecifies whether to start or stop the listener function on the Oracle Server.
listener_nameThe name of the Oracle Listener as defined by the Oracle Administrator.The default value for this parameter is “listener.”
listener_passwordSpecifies the password required to stop a listener process as specified inOracle.
Note: The value entered in this field must match the value assigned to thePASSWORDS_LISTENER parameter in the Administrator’slistener.ORA file. The listener.ORA file is located in the installedOracle directory.
CLI examplewruntask -t Listener-l ITMOracleTasks-h @OracleDatabaseManager:v817@manzana-o 15-a listener_mode="Start Listener"-a listener_name="ohioServer"-a listener_password="swordfish"
Usage notesThe Listener utility in Oracle establishes listen endpoints on a machine. Theselisten endpoints are addresses that clients and servers use to connect to a database.Use the Listener task to start and stop the Listener utility in Oracle. Tivoli usesOracle’s lsnrctl utility to start and stop the Listener.
The Oracle Listener is capable of supporting multiple Oracle instances or oneinstance for every Listener depending on the Oracle configuration.
See alsoSee also the following commands in the Tivoli Management Framework ReferenceManual: wruntask, wcrttask, wcrtjob, and wgettask.
352 IBM Tivoli Monitoring for Databases: Oracle: Reference Guide

OracleTBSMDiscovery
DescriptionSends a DISCOVER event to Tivoli Business Systems Manager for each Oracleadministration server and application server that IBM Tivoli Monitoring forDatabases: Oracle discovered (or is currently managing). For any resources thatwere removed since the last time this task was run, this task sends a GONE eventto Tivoli Business Systems Manager. If the task completes successfully, you receivea list of resources for which DISCOVER and GONE events were sent to TivoliBusiness Systems Manager.
You must install the following software before running this task:v Tivoli Enterprise Console Event Serverv Tivoli Enterprise Console Logfile Adapterv IBM Tivoli Monitoring for Databases: Oracle (install on the Tivoli management
region server where you want to run this task)
For more information on discovery or Tivoli Business Systems Manager, see theIBM Tivoli Monitoring for Databases: Oracle User’s Guide.
Authorization rolesenior
Target endpointManaged node (where the event server is installed)
GUI data entry fieldsThis task has no arguments.
CLI syntaxOracleTBSMDiscovery
CLI examplewruntask-t OracleTBSMDiscovery-l "ITMOracleTasks"-h nemuchay
Usage notesNone.
See alsoSee also the following commands in the Tivoli Management Framework ReferenceManual: wruntask, wcrtjob, and wgettask.
Chapter 3. Tasks 353

354 IBM Tivoli Monitoring for Databases: Oracle: Reference Guide

Chapter 4. Commands
This chapter describes the IBM Tivoli Monitoring for Databases: Oracle commandsand provides a brief description and the authorization required to run thecommand. IBM Tivoli Monitoring for Databases: Oracle commands begin with woto distinguish them from Tivoli w commands.
Before running commands, you must establish the Tivoli environment, and installIBM Tivoli Monitoring for Databases: Oracle.
Table 8 on page 356 summarizes these commands. After the table, a section for eachcommand describes how to run the command by covering the followinginformation:
DescriptionPurpose of the command.
Authorization roleRole required to run the command.
CLI syntaxSyntax that you enter on the command line. The syntax contains thecommand name, which begins with the wo prefix. A list of the parametersfor the command and a definition of each parameter follow the commandname.
CLI exampleThe example for the command contains a brief description of the exampleand an example of the syntax.
Tivoli command syntaxThe following special characters define Tivoli command syntax:
[ ] Identifies elements that are optional. Those not enclosed in brackets arerequired
... Indicates that you can specify multiple values for the previous element.Separate multiple values by a space, unless otherwise directed by acommand’s information.
If the ellipsis for an element follows a closing bracket, use the syntaxwithin the brackets to specify multiple values. For example, to specify twoadministrators for the option [–a admin]..., use –a admin1 –a admin2.
If the ellipses for an element is within the brackets, use the syntax of thelast element to specify multiple values. For example, to specify two hostsfor the option [–h host ...], use –h host host2.
| Indicates mutually exclusive information. You can use the element oneither the left or right of the vertical bar.
′{ }′ Delimits a set of mutually exclusive elements when one of them isrequired. If the elements are optional, they are enclosed in brackets ([ ]).
In addition to the special characters, the typeface conventions described in thePreface are used.
355

Following are two examples:v wcrtpr [–a admin] ... [–s region] [–m resource] ... name
The name argument is the only required element for the wcrtpr command. Thebrackets around the options indicate that they are optional. The ellipsis after the–a admin and –m resource options indicate that you can use those optionsmultiple times to specify multiple administrators and resources, respectively.
v wchkdb [–o outfile] [–u] [–x] ′{–f infile | –i | object ...}′The –f, –i, and object elements are mutually exclusive. The braces surroundingthem indicate that one of these elements is required. If you specify the objectargument, you can specify more than one object.
List of commandsThe following table lists command names, purpose statements, and required roles:
Table 8. Command quick reference table
Command Purpose Required Role
wochregdb Changes the properties of a registeredOracleDatabaseManager resource in a Tivolimanagement region
oracle_dba
wocpresource Copies Oracle resource records betweenprofiles
admin
wocprole Copies Oracle role records between profiles admin
wocpuser Copies Oracle user records between profiles admin
wocrtresource Creates a new Oracle resource record admin
wocrtrole Creates a new Oracle role record admin
wocrtuser Creates a new Oracle user record admin
wodelresource Deletes Oracle resource records admin
wodelrole Deletes Oracle role records admin
wodeluser Deletes Oracle user records admin
wogetresource Lists information about an existing Oracleresource
user
wogetrole Lists information about an existing Oraclerole
user
wogetuser Lists information about an existing Oracleuser
user
wolsresources Lists the Oracle resources in a profile user
wolsroles Lists the Oracle roles in a profile user
wolsusers Lists the Oracle users in a profile user
womvresource Moves Oracle resources from one profile toanother
admin
womvrole Moves Oracle roles from one profile toanother
admin
womvuser Moves Oracle users from one profile toanother
admin
wopopresources Populates a resource profile from anOracleDatabaseManager resource
admin, oracle_user
356 IBM Tivoli Monitoring for Databases: Oracle: Reference Guide

Table 8. Command quick reference table (continued)
Command Purpose Required Role
wopoproles Populates a role profile from anOracleDatabaseManager resource
admin, oracle_user
wopopusers Populates a user profile from anOracleDatabaseManager resource
admin, oracle_user
woregdb Creates and registers anOracleDatabaseManager resource in a Tivolimanagement region
oracle_dba
wosetresource Modifies the attributes of an Oracle resourcerecord
admin, oracle_user
wosetresources Modifies the attributes of multiple Oracleresource records
admin
wosetrole Modifies the attributes of an Oracle rolerecord
admin
wosetroles Modifies the attributes of multiple Oracle rolerecords
admin
wosetuser Modify the attributes of an Oracle user record admin
wosetusers Modifies the attributes of multiple Oracleuser records
admin
wocprole Copies Oracle role records between profiles admin
woshutdown Shuts down an OracleDatabaseManager orOracleInstanceManager resource
oracle_dba
wostartup Starts up an OracleDatabaseManager orOracleInstanceManager resource
oracle_dba
Chapter 4. Commands 357

wochregdb
PurposeChanges the properties of a registered OracleDatabaseManager resource in a Tivolimanagement region.
Authorizationoracle_dba
Formatwochregdb[–h ORACLE_HOME][–t TNS_ADMIN][–o owner][–g owner-group][–u username][–p password]database-name
where:
-h ORACLE_HOMEThe full path of the Oracle database directory.
-t TNS_ADMINThe directory path to the SQL*Net configuration files. If this optionis left blank, the default directory /var/opt/oracle orORACLE_HOME/network/admin is used.
-o owner The owner of the Oracle server binaries at the endpoint. This is theuser ID on the host.
-g owner-group The operating system group of the Oracle database owner.
-u username The Oracle dba user name under which this database is registered.
-p password The password for username.
-n database-nameThe name of the database.
ExamplesIn this example, you change the home directory, the owner, and the user for thedatabase named inventory@gordo on a Windows NT machine:wochregdb -h "D:\orant"-o oracle -u sysuser inventory@gordo
UsageThe wochregdbcommand enables you to edit the database properties so you canmodify the database information.
CommentsNone.
358 IBM Tivoli Monitoring for Databases: Oracle: Reference Guide

wocpresource
PurposeCopies Oracle resource records between profiles, provided they are in differentprofile managers.
Authorizationadmin
Formatwocpresource source destination [resource_name ...]
where:
source Specifies the profile from which the resource records are copied.
destination Specifies the profile to which the resource records are copied.
resource name Specifies a resource name in the resource profile. This argument canbe specified multiple times.
ExamplesThe following command example copies a resource record from one profile toanother.wocpresource NorthAmerica International EpsonLP1
where:
NorthAmerica Identifies the profile from which to copy the resource record.
International Identifies the profile to which to copy the resource record.
EpsonLP1 Identifies the resource record to copy.
UsageThe wocpresource command copies one or more resource records specified in theresource_name argument from the source profile to the destination profile. Ifresource_name is not specified, all resource records from the source profile arecopied to the destination profile. The source and destination profiles must be indifferent profile managers.
CommentsSee also, the wodelresource and womvresource commands.
Chapter 4. Commands 359

wocprole
PurposeCopies Oracle role records between profiles, provided they are in different profilemanagers.
Authorizationadmin
Formatwocprole source_profile destination_profile [role_name ...]
where:
source_profile Specifies the profile from which the role records are copied.
destination_profileSpecifies the profile to which the role records are copied.
role_name Specifies a role name in the role profile. This argument can bespecified multiple times.
ExamplesThe following command example copies a role record from one profile to another.wocprole accounting human_resource PAYROLL
where:
accounting Identifies the profile from which to copy the role record.
human_resourceIdentifies the profile to which the role record is copied.
PAYROLL Identifies the role record to copy.
UsageThe wocprole command copies one or more role records specified in the role_nameargument from the profile specified in the source_profile argument to the profilespecified in the destination_profile argument. If role_name is not specified, all rolerecords from the source profile are copied to the destination profile. The sourceand destination profiles must be in different profile managers.
CommentsSee also, the wodelrole and womvrole commands.
360 IBM Tivoli Monitoring for Databases: Oracle: Reference Guide

wocpuser
PurposeCopies Oracle user records between profiles, provided they are in different profilemanagers.
Authorizationadmin
Formatwocpuser source_profile destination_profile [user_name ...]
where:
source_profile Specifies the profile from which the user records are copied.
destination_profileSpecifies the profile to which the user records are copied.
user_name Specifies a user name in the user profile. This argument can bespecified multiple times.
ExamplesThe following command example copies a user record from one profile to another.wocpuser accounting human_resource R_LYNCH
where:
accounting Identifies the profile from which to copy the user record.
human_resourceIdentifies the profile to which the user record is copied.
R_LYNCH Identifies the user record to copy.
UsageThe wocpuser command copies one or more user records specified in theuser_name argument from the profile specified in the source_profile argument to theprofile specified in the destination_profile argument. If user_name is not specified, alluser records from the source profile are copied to the destination profile. Thesource and destination profiles must be in different profile managers.
CommentsSee also, the wodeluser and womvuser commands.
Chapter 4. Commands 361
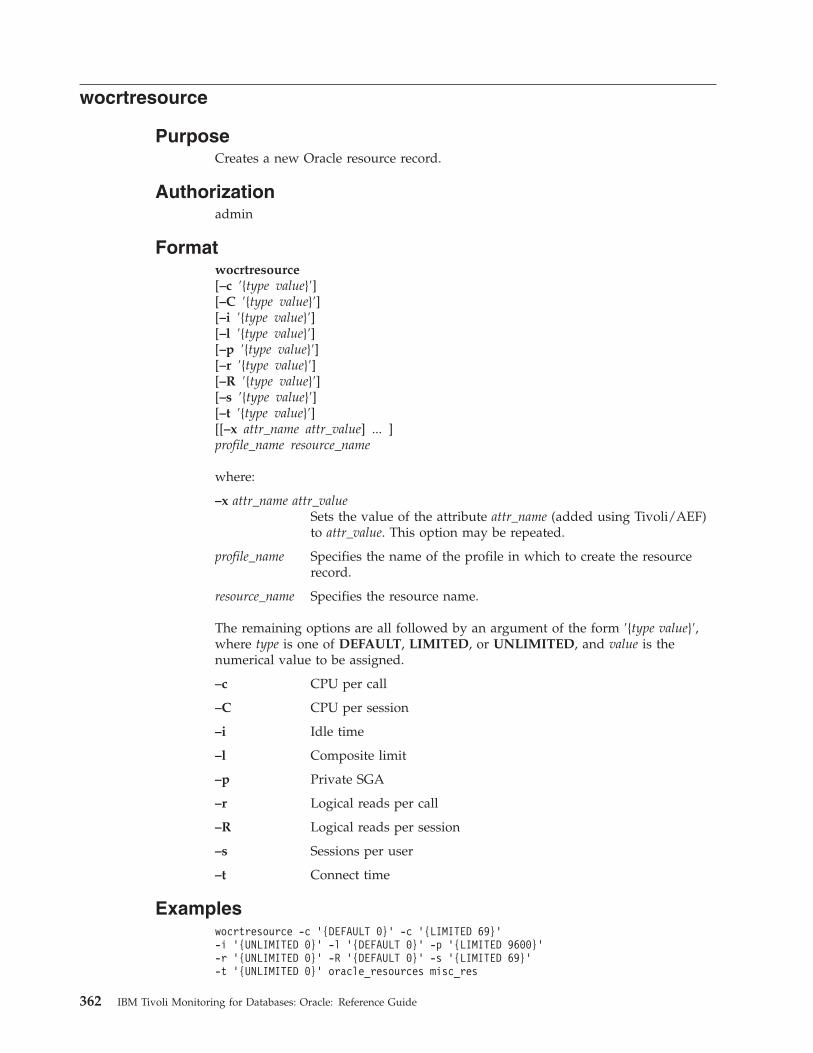
wocrtresource
PurposeCreates a new Oracle resource record.
Authorizationadmin
Formatwocrtresource[–c ′{type value}′][–C ′{type value}′][–i ′{type value}′][–l ′{type value}′][–p ′{type value}′][–r ′{type value}′][–R ′{type value}′][–s ′{type value}′][–t ′{type value}′][[–x attr_name attr_value] ... ]profile_name resource_name
where:
–x attr_name attr_valueSets the value of the attribute attr_name (added using Tivoli/AEF)to attr_value. This option may be repeated.
profile_name Specifies the name of the profile in which to create the resourcerecord.
resource_name Specifies the resource name.
The remaining options are all followed by an argument of the form ′{type value}′,where type is one of DEFAULT, LIMITED, or UNLIMITED, and value is thenumerical value to be assigned.
–c CPU per call
–C CPU per session
–i Idle time
–l Composite limit
–p Private SGA
–r Logical reads per call
–R Logical reads per session
–s Sessions per user
–t Connect time
Exampleswocrtresource -c ’{DEFAULT 0}’ -c ’{LIMITED 69}’-i ’{UNLIMITED 0}’ -l ’{DEFAULT 0}’ -p ’{LIMITED 9600}’-r ’{UNLIMITED 0}’ -R ’{DEFAULT 0}’ -s ’{LIMITED 69}’-t ’{UNLIMITED 0}’ oracle_resources misc_res
362 IBM Tivoli Monitoring for Databases: Oracle: Reference Guide

where:
-c ’{DEFAULT 0}’Specifies the default CPU per call.
-c ’{LIMITED 69}’Specifies a limit of 69 for CPU per session.
-i ’{UNLIMITED 0}’Specifies unlimited idle time.
-l ’{DEFAULT 0}’Specifies the default composite limit.
-p ’{LIMITED 9600}’Specifies a limit of 9600 for SGA size.
-r ’{UNLIMITED 0}’Specifies an unlimited number of reads per call.
-R ’{DEFAULT 0}’Specifies a default number of logical reads per session.
-s ’{LIMITED 69}’Specifies a limit of 69 sessions per user.
-t ’{UNLIMITED 0}’Specifies an unlimited connect time.
oracle_resourcesIdentifies the profile in which to create the resource.
misc_res Provides the name of the resource to create.
UsageThe wocrtresource command creates a new resource specified by the resource_nameargument in the Oracle resource profile specified by the profile_name argument.Any attributes not explicitly specified on the command line are generated from theresource default record. If an attribute is neither specified on the command line nordefaulted by the profile, an error is generated and the resource record is notcreated. All attributes are validated against the profile validation policy.
CommentsSee also, the wosetresource, wodelresource, and wogetresource commands.
Chapter 4. Commands 363

wocrtrole
PurposeCreates a new Oracle role record.
Authorizationadmin
Formatwocrtrole[–a NONE | OS | PASSWORD][–p password][–R assigned_roles][–S system_privileges][[–x attr_name attr_value] ...]profile_name role_name
where:
–a NONE Selects no authentication.
–a OS Selects OS authentication.
–a PASSWORDSelects password authentication.
–p password Specifies a password.
–R assigned rolesSpecifies the assigned roles of this role, where assigned_roles is astring representation of a sequence of the form:
′{count [{role_name is_grantable is_default}] ... }′
where count is the number of assigned roles, role_name is thedouble-quoted role name, and is_grantable and is_default can takethe value TRUE or FALSE.
For example:’{2 {"payroll" FALSE FALSE}{"payables" FALSE TRUE}}’
–S system_privilegesSpecifies the role’s system privileges, where system_privileges is astring representation of a sequence of the form:
′{count [{privilege is_grantable}] ... }′
where count is the number of privileges, privilege is thedouble-quoted privilege name, and is_grantable takes the valueTRUE or FALSE.
For example:’{2 {"updatesalary" FALSE}{"createsalary" FALSE}}’
–x attr_name attr_valueSets the value of the attribute attr_name (added using Tivoli/AEF)to attr_value.
profile_name Specifies the name of the profile in which to create the role record.
364 IBM Tivoli Monitoring for Databases: Oracle: Reference Guide

role_name Specifies the role name.
Exampleswocrtrole -a PASSWORD -p new_role1 -R ’{2 {"payroll" FALSE FALSE}{"payables" FALSE TRUE}}’ -S ’{2 {"updatesalary" FALSE}{"createsalary" FALSE}}’ oracle_roles new_role
where:
-a PASSWORD Specifies that the role is password authenticated.
-p new_role1 Identifies the password for the role as “new_role1.”
-R ’{2 {"payroll" FALSE FALSE} {"payables" FALSE TRUE}}’Specifies that the new role has two assigned roles: payroll, whichis not grantable and is not the default, and payables, which is notgrantable, but is the default.
-S ’{2 {"updatesalary" FALSE} {"createsalary" FALSE}}’Specifies that the new role has two system privileges: updatesalaryand createsalary, neither of which is grantable.
oracle_roles Identifies the profile in which to create the role.
new_role Provides the name of the new role.
UsageThe wocrtrole command creates a new role specified by the role_name argument inthe Oracle role profile specified by the profile_name argument. Any attributes notexplicitly specified on the command line are generated from the role defaultrecord. If an attribute is neither specified on the command line nor defaulted bythe profile, an error is generated and the role record is not created. All attributesare validated against the profile validation policy.
CommentsSee also, the wosetrole, wodelrole, and wogetrole commands.
Chapter 4. Commands 365

wocrtuser
PurposeCreates a new Oracle user record.
Authorizationadmin
Formatwocrtuser[–a TRUE | FALSE][–o TRUE | FALSE][–p password][–d default_tablespace][–t temporary_tablespace][–R roles][–S system_privileges][–O object_privileges][–Q quotas][–r resource_profile][[–x attr_name attr_value] ... ]profile_name user_name
where:
–a TRUE Selects OS authentication.
–a FALSE Selects database authentication.
–o TRUE Allows the Oracle user to change the password.
–o FALSE Disallows the Oracle user from changing the password.
–p password Specifies a password.
–d default_tablespaceSpecifies a default tablespace.
–t temporary_tablespaceSpecifies a temporary tablespace.
–R roles Specifies the user’s roles, where roles is a string representation of asequence of the form:
′{count [{role_name is_grantable is_default}] ... }′
where count is the number of roles, role_name is the double-quotedrole name, and is_grantable and is_default can take the value TRUEor FALSE.
For example:’{2 {"payroll" TRUE FALSE}{"payables" FALSE TRUE}}’
–S system_privilegesSpecifies the user’s system privileges, where system_privileges is astring representation of a sequence of the form:
′{count [{privilege is_grantable}] ... }′
366 IBM Tivoli Monitoring for Databases: Oracle: Reference Guide

where count is the number of privileges, privilege is thedouble-quoted privilege name, and is_grantable takes the valueTRUE or FALSE.
For example:’{2 {"updatesalary" FALSE}{"createsalary" TRUE}}’
–O object_privilegesSpecifies the user’s object privileges, where object_privileges is astring representation of a sequence of the form:
′{priv_count [{grantee privilege {col_count [column] ... } schema objectis_grantable}] ... }
where priv_count is the number of privileges, grantee is the name ofthe user receiving this privilege, privilege is the privilege name,col_count is the number of columns this applies to, column is acolumn name, schema is the schema name of the database, object isthe object name, and is_grantable can take the value TRUE orFALSE. The names are all double quoted.
For example:’{1 {"R_LYNCH" "update" {1 "Salary"}"Acctg1" "GrossPay" FALSE}}
–Q quotas Specifies the user’s quotas, where quotas is a string representationof a sequence of the form:
′{count [{tablespace is_limited limit_value}] ... }′
where count is the number of quotas, tablespace is thedouble-quoted tablespace name, is_limited can take the value TRUEor FALSE, and limit_value is the numerical value of the limit.
For example:’{2 {"Acctg_01" FALSE 0}{"Acctg_02" TRUE 5}}
–r resource_profileSpecifies a resource profile.
–x attr_name attr_valueSets the value of the attribute attr_name (added using Tivoli/AEF)to attr_value.
profile_name Specifies the name of the profile in which to create the user record.
user_name Specifies the user’s name.
Exampleswocrtuser -a FALSE -o TRUE -p rsmith -r default -d SYSTEM-t TEMP -R ’{2 {"payroll" TRUE FALSE} {"payables" FALSE TRUE}}’-S ’{2 {"updatesalary" FALSE} {"createsalary" TRUE}}’-O ’{1 {"R_LYNCH" "Updage" {1 "Salary"} "GrossPay" "Acctg1" FALSE}}’-Q ’{2 {"TEMP" FALSE 0} {"USER" TRUE 50000}}’ oracle_users r_lynch
where:
-a FALSE Specifies that the user is not OS authorized.
-o TRUE Specifies that the user can change the password.
-p rsmith Identifies the password as “rsmith”.
Chapter 4. Commands 367

-r default Specifies that the resource profile is the “default.
-d SYSTEM Identifies the default tablespace as “SYSTEM”.
-t TEMP Identifies the temporary tablespace as “TEMP”.
-R ’{2 {"payroll" TRUE FALSE} {"payables" FALSE TRUE}}Specifies that the user has two roles: payroll, which is grantablebut not the default, and payables, which is not grantable but is thedefault.
-S ’{2 {"updatesalary" FALSE} {"createsalary" TRUE}}’Specifies that the user has two system privileges: updatesalary,which is not grantable, and createsalary, which is grantable.
-O ’{1 {"R_LYNCH" "update" {1 "Salary"} "GrossPay" "Acctg1" FALSE}}’Specifies that the user has one object privilege. In this case, a usercalled R_LYNCH receives the update privilege on column Salary forthe object GrossPay.Acctg1. This privilege is not grantable.
-Q ’{2 {"TEMP" FALSE 0} {"USER" TRUE 50000}}’Specifies that the user has two tablespace quotas. In tablespaceTEMP, the user can allocate unlimited space. In tablespace USER, theuser can allocate up to 50000 bytes.
oracle_users Identifies the profile in which to create the new user.
r_lynch Provides the name of the new user.
UsageThe wocrtuser command creates a new Oracle user specified by the user_nameargument in the Oracle user profile specified by the profile_name argument. Anyattributes not explicitly specified on the command line are generated from the userdefault record. If an attribute is neither specified on the command line nordefaulted by the profile, an error is generated and the user record is not created.All attributes are validated against the profile validation policy.
CommentsSee also, the wosetuser, wodeluser, and wogetuser commands.
368 IBM Tivoli Monitoring for Databases: Oracle: Reference Guide

wodelresource
PurposeDeletes Oracle resource records.
Authorizationadmin
Formatwodelresource [–u] profile_name resource_name ...
where:
–u Finds occurrences of this resource in user profiles and changesthem to DEFAULT.
profile_name Specifies the name of the profile from which to delete the records.
resource_name Specifies resource names of the records to delete. This argumentcan be specified multiple times.
ExamplesThe following command example deletes two resource records:wodelresource accounting CPARKER BTURNER
where:
accounting Identifies the profile from which to delete the resource record.
CPARKER and BTURNERIdentify the names of the resource records to delete.
UsageThe wodelresource command deletes the resource or resources specified in theresource_name argument from the profile specified in the profile_name argument.
ContextSee also, the wocrtresource command.
Chapter 4. Commands 369

wodelrole
PurposeDeletes Oracle role records.
Authorizationadmin
Formatwodelrole profile_name role_name ...
where:
profile_name Specifies the name of the profile from which to delete the records.
role_name Specifies role names of the records to delete. This argument can bespecified multiple times.
ExamplesThe following command example deletes two role records:wodelrole humanresource LSMITH RPOSSO
where:
humanresource Identifies the profile from which to delete the role record.
LSMITH RPOSSO Identifies the names of the role records to delete.
UsageThe wodelrole command deletes the role or roles specified in the role_nameargument from the profile specified in the profile_name argument.
CommentsSee also, the wocrtrole command.
370 IBM Tivoli Monitoring for Databases: Oracle: Reference Guide

wodeluser
PurposeDeletes Oracle user records.
Authorizationadmin
Formatwodeluser profile_name user_name ...
where:
profile_name Specifies the name of the profile from which to delete the records.
user_name Specifies user names of the records to delete. This argument can bespecified multiple times.
ExamplesThe following command example deletes a user record:wodeluser accounting LJOHNSON
where:
accounting Identifies the profile from which to delete the user record
LJOHNSON Identifies the user record to delete.
UsageThe wodeluser command deletes the user or users specified in the user_nameargument from the profile specified in the profile_name argument.
CommentsSee also, the wocrtuser command.
Chapter 4. Commands 371

wogetresource
PurposeLists information about an existing Oracle resource.
Authorizationuser
Formatwogetresource [–c] [–C] [–i] [–l] [–p] [–r] [–R] [–s] [–t] [–x] profile_nameresource_name
where:
–c Returns the CPU per call.
–C Returns the CPU per session.
–i Returns the idle time.
–l Returns the composite limit.
–p Returns the private SGA.
–r Returns the number of logical reads per call.
–R Returns the number of logical reads per session.
–s Returns the number of sessions per user.
–t Returns the connect time.
–x Lists the role’s AEF attributes, detailing for each one the attributename and value.
profile_name Specifies the name of the profile in which to create the resourcerecord.
resource_name Specifies the resource name.
If no options are specified, the command behaves as if all options were specified.
Exampleswogetresource northamerica_mktg ab3print_ibm
Database Resource Details:Resource Name: AB3PRINT_IBMCPU Per Call: DefaultCPU Per Session: 69Idle Time: UnlimitedComposite Limit: DefaultPrivate SGA: 96Logical Reads Per Call: UnlimitedLogical Reads Per Session: DefaultSessions Per User: 69Connect Time: Unlimited
AEF attributes:None.
372 IBM Tivoli Monitoring for Databases: Oracle: Reference Guide

UsageThe wogetresource command lists information about the existing resourcespecified in the resource_name argument from the profile specified in theprofile_name argument.
CommentsSee also, the wocrtresource, wosetresource, and wosetresources commands.
Chapter 4. Commands 373

wogetrole
PurposeLists information about an existing Oracle role.
Authorizationuser
Formatwogetrole [–a] [–p] [–R] [–S] [–x] profile role_name
where:
–a Returns the authentication type.
–p Returns the password.
–R Lists the role’s assigned roles, detailing for each one the role name,whether it is a grantable role, and whether it is a default role.
–S Lists the role’s system privileges, detailing for each one the nameand whether it is grantable.
–x Lists the role’s AEF attributes, detailing for each one the attributename and value.
profile Specifies the name of the profile.
role_name Specifies the name of the Oracle role.
If no options are specified, the command behaves as if all options were specified.
ExamplesThe following command example lists all of a role record’s attributes:wogetrole NorthAmerica payroll
Database Role Details:Role Name: RECEIVABLE_1Authentication: PASSWORDPassword: _FjKlU0RbtXe003V1cGM31C
Assigned Roles:PAYROLL:
Grant Option: NoDefault Role: No
PAYABLES:Grant Option: NoDefault Role: Yes
System Privileges:updatesalary:
Grant Option: Nocreatesalary:
Grant Option: No
AEF attributes:None.
374 IBM Tivoli Monitoring for Databases: Oracle: Reference Guide

UsageThe wogetrole command lists information about the existing role specified in therole_name argument from the profile specified in the profile argument.
CommentsSee also, the wocrtrole, wosetrole, and wosetroles commands.
Chapter 4. Commands 375

wogetuser
PurposeLists information about an existing Oracle user.
Authorizationuser
Formatwogetuser [–a] [–o] [–p] [–r] [–d] [–t] [–R] [–S] [–O] [–Q] [–x] profile user_name
where:
–a Returns the authentication type.
–o Indicates whether the Oracle user has control of the password.
–p Returns the password.
–r Returns the resource profile name.
–d Returns the default tablespace name.
–t Returns the temporary tablespace name.
–R Lists the user’s roles, detailing for each one the role name, whetherit is a grantable role, and whether it is a default role.
–S Lists the user’s system privileges, detailing for each one the nameand whether it is grantable.
–O Lists the user’s object privileges, detailing for each one the grantee,the privilege name, the schema name, the object name, whether itis grantable, and a list of columns to which it applies.
–Q Lists the user’s quotas, detailing for each one the tablespace nameand the size, which is either unlimited or a numerical value inbytes.
–x Lists the user’s AEF attributes, detailing for each one the attributename and value.
profile Specifies the name of the profile.
user_name Specifies the name of the Oracle user.
If no options are specified, the command behaves as if all options were specified.
ExamplesThe following example lists all of a user record’s attributes:wogetuser NorthAmerica jw_smith
Database User Details:User Name: JW_SMITHAuthentication: DatabaseCan the Oracle user change password: YesPassword: _FzAfzYXYJFAY4HbTCResource Profile: DEFAULTTemporary Tablespace: TEMPDefault Tablespace: SYSTEM
376 IBM Tivoli Monitoring for Databases: Oracle: Reference Guide
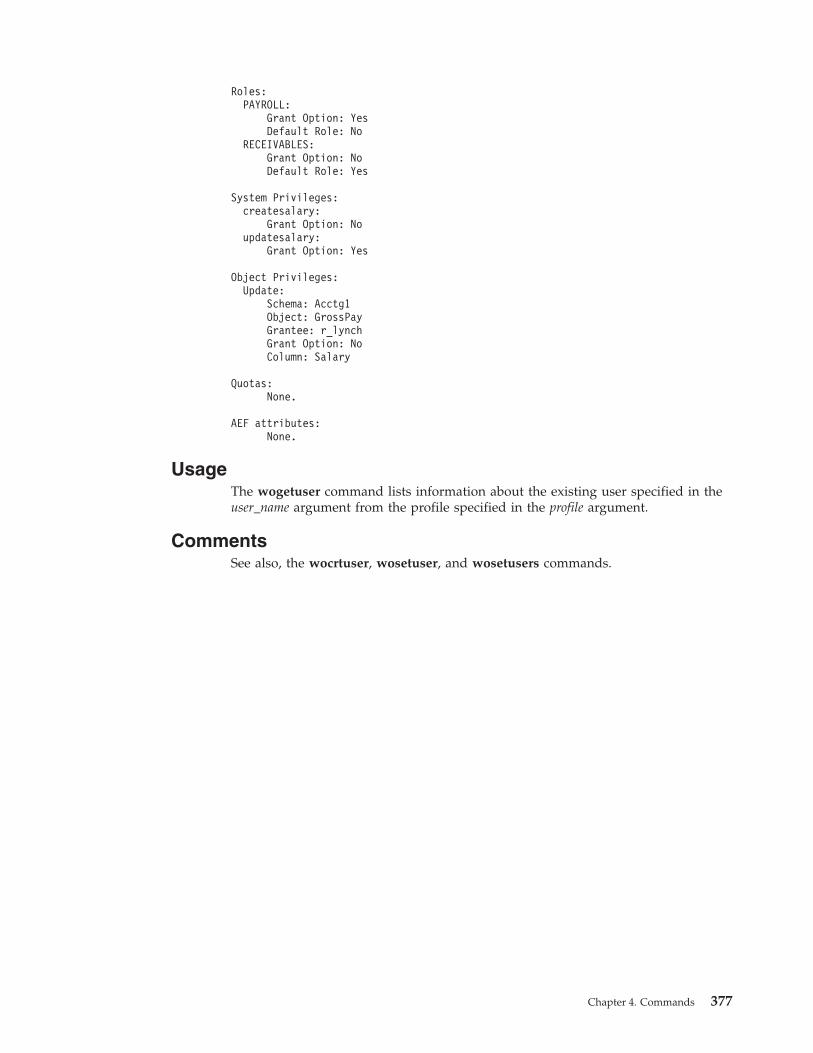
Roles:PAYROLL:
Grant Option: YesDefault Role: No
RECEIVABLES:Grant Option: NoDefault Role: Yes
System Privileges:createsalary:
Grant Option: Noupdatesalary:
Grant Option: Yes
Object Privileges:Update:
Schema: Acctg1Object: GrossPayGrantee: r_lynchGrant Option: NoColumn: Salary
Quotas:None.
AEF attributes:None.
UsageThe wogetuser command lists information about the existing user specified in theuser_name argument from the profile specified in the profile argument.
CommentsSee also, the wocrtuser, wosetuser, and wosetusers commands.
Chapter 4. Commands 377

wolsresources
PurposeLists the Oracle resources in a profile.
Authorizationuser
Formatwolsresources profile
where profile specifies the name of the resource profile whose members to list.
ExamplesThe following example lists all the resources in a profile:wolsresources NorthAmerica
which returns:SMITHLYNCHBROWNDAVISBAKERMORGANDORHAMFARMERHUBBARD
UsageThe wolsresources command lists the names of the resources that are members ofthe Oracle resource profile specified in the profile argument.
CommentsSee also, the wogetresource command.
378 IBM Tivoli Monitoring for Databases: Oracle: Reference Guide

wolsroles
PurposeLists the Oracle roles in a profile.
Authorizationuser
Formatwolsroles profile
where profile specifies the name of the resource profile whose members to list.
ExamplesThe following example lists all the roles in a profile:wolsroles NorthAmerica
which returns:PAYROLLPAYABLESRECEIVABLESINVOICECREDIT
UsageThe wolsroles command lists the names of the roles that are members of theOracle role profile specified in the profile argument.
CommentsSee also, the wogetrole command.
Chapter 4. Commands 379

wolsusers
PurposeLists the Oracle users in a profile.
Authorizationuser
Formatwolsusers profile
where profile specifies the name of the user profile whose members to list.
ExamplesThe following command example lists all the users in a profile:wolsusers NorthAmerica_Mktg
which returns:HAWKINSWEBSTERYOUNGGORDONCOLTRANEROLLINSSHORTERHENDERSONSHEPPARDWELLINSRAMIREZ
UsageThe wolsusers command lists the names of the users that are members of theOracle user profile specified in the profile argument.
CommentsSee also, the wogetuser command.
380 IBM Tivoli Monitoring for Databases: Oracle: Reference Guide

womvresource
PurposeMove Oracle resources from one profile to another.
Authorizationadmin
Formatwomvresource source destination [resource_name...]
where:
source Specifies the profile from which the resource records are moved.
destination Specifies the profile to which the resource records are moved.
resource_name Specifies the resource name of the record to move. This argumentcan be specified multiple times.
ExamplesThe following command example moves a resource record from one profile toanother:womvresource NorthAmerica International jw_smith
where:
NorthAmerica Identifies the profile from which to move the resource record.
International Identifies the profile to which the resource record is moved.
jw_smith Identifies the resource record to move.
UsageThe womvresource command moves one or more resources identified by theresource_name argument from the profile specified in the source argument to theprofile specified in the destination argument. If resource_name is not specified, allresources in the profile are moved.
CommentsSee also, the wocpresource and wolsresources commands.
Chapter 4. Commands 381
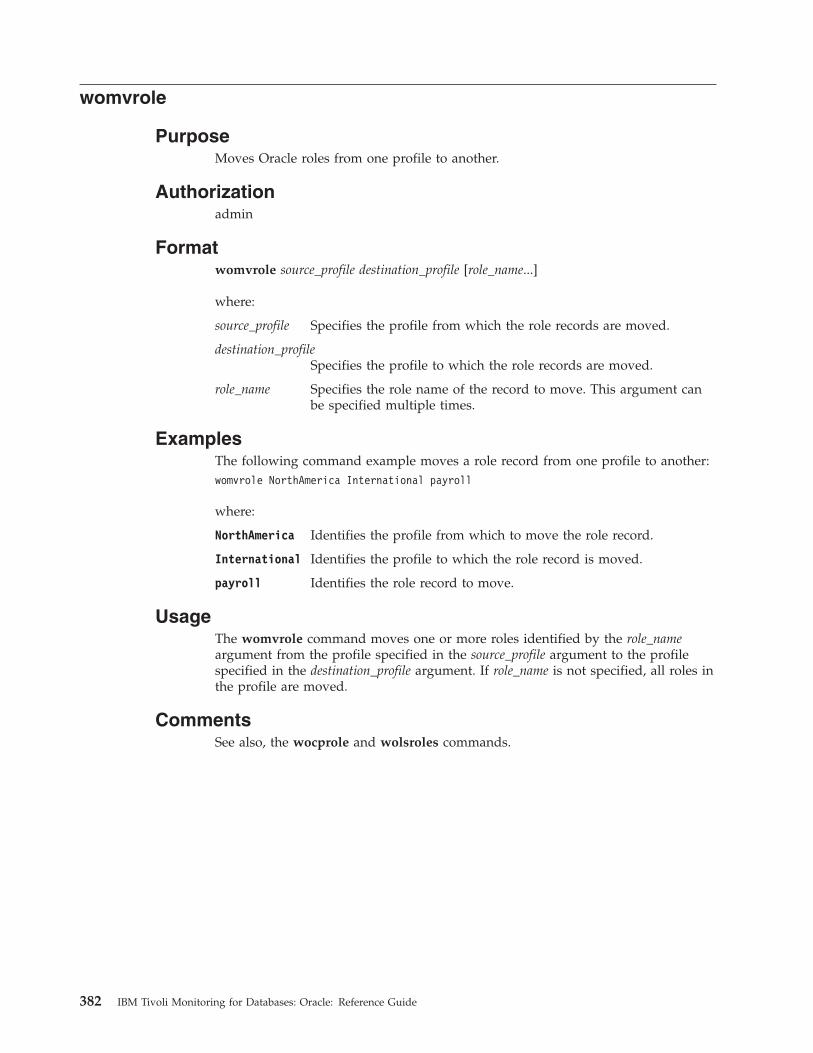
womvrole
PurposeMoves Oracle roles from one profile to another.
Authorizationadmin
Formatwomvrole source_profile destination_profile [role_name...]
where:
source_profile Specifies the profile from which the role records are moved.
destination_profileSpecifies the profile to which the role records are moved.
role_name Specifies the role name of the record to move. This argument canbe specified multiple times.
ExamplesThe following command example moves a role record from one profile to another:womvrole NorthAmerica International payroll
where:
NorthAmerica Identifies the profile from which to move the role record.
International Identifies the profile to which the role record is moved.
payroll Identifies the role record to move.
UsageThe womvrole command moves one or more roles identified by the role_nameargument from the profile specified in the source_profile argument to the profilespecified in the destination_profile argument. If role_name is not specified, all roles inthe profile are moved.
CommentsSee also, the wocprole and wolsroles commands.
382 IBM Tivoli Monitoring for Databases: Oracle: Reference Guide

womvuser
PurposeMoves Oracle users from one profile to another.
Authorizationadmin
Formatwomvuser source_profile destination_profile [user_name...]
where:
source_profile Specifies the profile from which the user records are moved.
destination_profileSpecifies the profile to which the user records are moved
user_name Specifies the user name of the record to move. This argument canbe specified multiple times.
ExamplesThe following command example moves a user record from one profile to another:womvuser International NorthAmerica r_lynch
where:
international Identifies the profile from which to move the user record.
NorthAmerica Identifies the profile to which the user record is moved.
r_lynch Identifies the user record to move
UsageThe womvuser command moves one or more users identified by the user_nameargument from the profile specified in the source_profile argument to the profilespecified in the destination_profile argument. If user_name is not specified, all usersin the profile are moved.
CommentsSee also, the wocpuser and wolsusers commands.
Chapter 4. Commands 383

wopopresources
PurposePopulates a resource profile from an OracleDatabaseManager resource.
Authorizationadmin and oracle_user
Formatwopopresources [–m | –o] database_name profile_name
where:
–m An entry that exists on a database_name and profile_name is notupdated, but any other entries on database_name are appended toprofile_name.
–o Any entry in database_name is written into profile_name. An attemptto add an existing record will result in the old record beingoverwritten.
database_name Specifies the database name.
profile_name Identifies the resource profile to populate.
Exampleswopopresources -o orcl@hyde oracle_resources
UsageThe wopopresources command populates the OracleResourceManagerProfileprofile_name from the OracleDatabaseManager database_name. Existing entries inprofile_name can either be appended to or overwritten depending on the optionsspecified.
CommentsSee also, the wopoproles and wopopusers commands.
384 IBM Tivoli Monitoring for Databases: Oracle: Reference Guide

wopoproles
PurposePopulates a role profile from an OracleDatabaseManager resource.
Authorizationadmin and oracle_user
Formatwopoproles [–m | –o] database_name profile_name
where:
–m An entry that exists on database_name and profile_name is notupdated, but any other entries on database_name are appended toprofile_name.
–o Any entry in database_name is written into profile_name. An attemptto add an existing record results in the old record beingoverwritten.
database_name Specifies the database name.
profile_name Identifies the user profile to populate.
Exampleswopoproles -o orcl@hyde oracle_users
UsageThe wopoproles command populates the OracleRoleManagerProfile profile_namefrom the OracleDatabaseManager database_name. Existing entries in profile_name caneither be appended to, or overwritten, depending on the options specified.
CommentsSee also, the wopoproles and wopopresources commands.
Chapter 4. Commands 385

wopopusers
PurposePopulates a user profile from an OracleDatabaseManager resource.
Authorizationadmin and oracle_user
Formatwopopusers [–m | –o] database_name profile_name
where:
–m An entry that exists on database_name and profile_name is notupdated, but any other entries on database_name are appended toprofile_name.
–o Any entry in database_name is written into profile_name. An attemptto add an existing record will result in the old record beingoverwritten.
database_name Specifies the database name.
profile_name Identifies the user profile to populate.
Exampleswopopusers -o orcl@hyde oracle_users
UsageThe wopopusers command populates the OracleUserManagerProfile profile_namefrom the OracleDatabaseManager database_name. Existing entries in profile_name caneither be appended to or overwritten depending on the options specified.
CommentsSee also, the wopoproles and wopopresources commands.
386 IBM Tivoli Monitoring for Databases: Oracle: Reference Guide
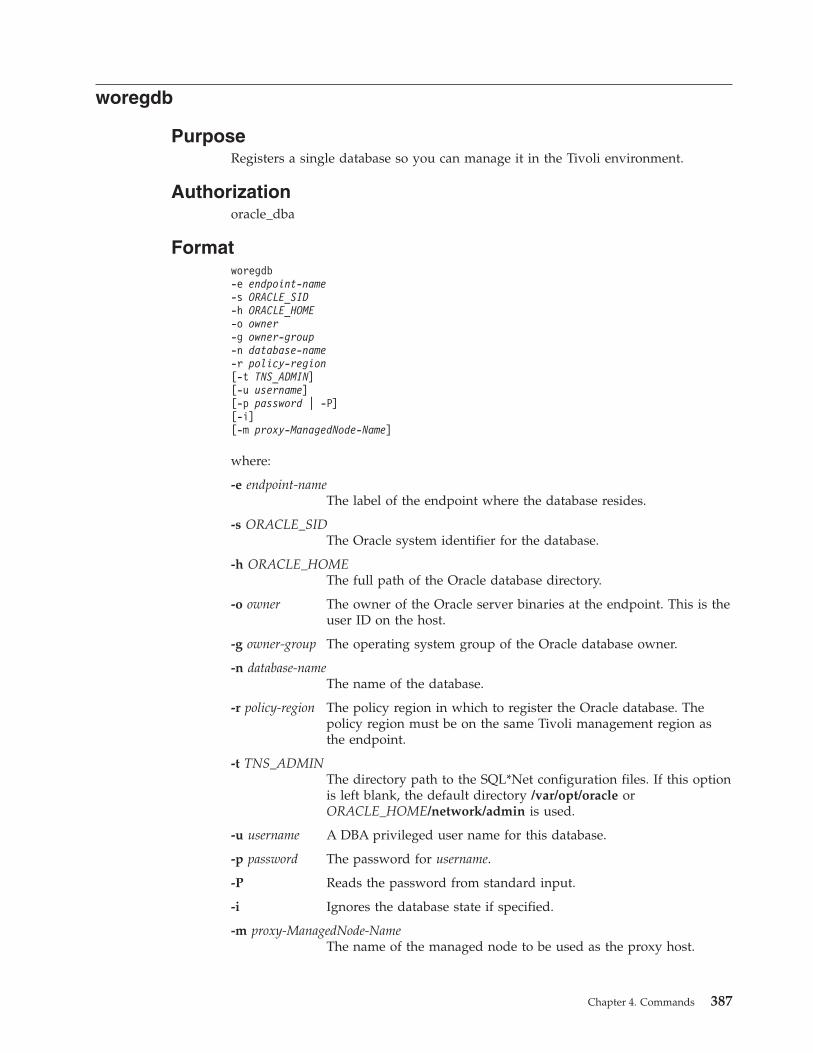
woregdb
PurposeRegisters a single database so you can manage it in the Tivoli environment.
Authorizationoracle_dba
Formatworegdb-e endpoint-name-s ORACLE_SID-h ORACLE_HOME-o owner-g owner-group-n database-name-r policy-region[-t TNS_ADMIN][-u username][-p password | -P][-i][-m proxy-ManagedNode-Name]
where:
-e endpoint-nameThe label of the endpoint where the database resides.
-s ORACLE_SIDThe Oracle system identifier for the database.
-h ORACLE_HOMEThe full path of the Oracle database directory.
-o owner The owner of the Oracle server binaries at the endpoint. This is theuser ID on the host.
-g owner-group The operating system group of the Oracle database owner.
-n database-nameThe name of the database.
-r policy-region The policy region in which to register the Oracle database. Thepolicy region must be on the same Tivoli management region asthe endpoint.
-t TNS_ADMINThe directory path to the SQL*Net configuration files. If this optionis left blank, the default directory /var/opt/oracle orORACLE_HOME/network/admin is used.
-u username A DBA privileged user name for this database.
-p password The password for username.
-P Reads the password from standard input.
-i Ignores the database state if specified.
-m proxy-ManagedNode-NameThe name of the managed node to be used as the proxy host.
Chapter 4. Commands 387

ExamplesThe following example registers a database named Inventory on endpoint gordonin the offline state, where ORACLE_SID = PROD, ORACLE_HOME = /opt/oracle,policy-region = gordon_region, owner = oracle, and owner-group = dba:woregdb -e gordon -s PROD -h /opt/oracle -o oracle -g dba \-n Inventory -r gordon_region -i
The following example registers a database named Inventory on endpoint jekyll inthe online state, where ORACLE_SID = v817, ORACLE_HOME =/jekyll/disk0/oracle/8.1.7, policy_region = Databases, owner = oracle, andowner-group = dba:woregdb -e jekyll -s v817 -h /jekyll/disk0/oracle/8.1.7 -o oracle \-g dba -n Inventory -r Databases
UsageThe woregdb command registers a single database so you can manage it in aTivoli environment.
CommentsNone.
388 IBM Tivoli Monitoring for Databases: Oracle: Reference Guide
wosetresource
PurposeModifies the attributes of an Oracle resource record.
Authorizationadmin
Formatwosetresource[–c ′{type value}′][–C ′{type value}′][–i ′{type value}′][–l ′{type value}′][–p ′{type value}′][–r ′{type value}′][–R ′{type value}′][–s ′{type value}′][–t ′{type value}′][[–x attr_name attr_value] ... ]profile_name resource_name
where:
–x attr_name attr_valueSets the value of the attribute attr_name (added using Tivoli/AEF)to attr_value. This option can be repeated.
profile_name Specifies the name of the profile in which to create the resourcerecord.
resource_name Specifies the resource name.
The remaining options are all followed by an argument of the form:
′{type value}′
where type is one of DEFAULT, LIMITED, or UNLIMITED, and value is thenumerical value to be assigned.
–c CPU per call
–C CPU per session
–i Idle time
–l Composite limit
–p Private SGA
–r Logical reads per call
–R Logical reads per session
–s Sessions per user
–t Connect time
Chapter 4. Commands 389

Exampleswosetresources -c ’{UNLIMITED 0}’ oracle_resources misc_res misc_res2
UsageThe wosetresources command modifies the attributes of the existing Oracleresources identified by the resource_name argument, in the Oracle resource profilespecified by the profile_name argument. All attributes are validated against theprofile validation policy.
CommentsSee also, the wosetresource, wodelresource, and wogetresource commands.
390 IBM Tivoli Monitoring for Databases: Oracle: Reference Guide

wosetresources
PurposeModifies the attributes of multiple Oracle resource records.
Authorizationadmin
Formatwosetresources[–c ′{type value}′][–C ′{type value}′][–i ′{type value}′][–l ′{type value}′][–p ′{type value}′][–r ′{type value}′][–R ′{type value}′][–s ′{type value}′][–t ′{type value}′][[–x attr_name attr_value] ... ]profile_name resource_name ...
where:
–x attr_name attr_valueSets the value of the attribute attr_name (added using Tivoli/AEF)to attr_value. This option can be repeated.
profile_name Specifies the name of the profile in which to find the resourcerecords.
resource_name Specifies a resource name. This argument can be repeated.
The remaining options are all followed by an argument of the form:
′{type value}′
where type is one of DEFAULT, LIMITED, or UNLIMITED, and value is thenumerical value to be assigned.
–c CPU per call
–C CPU per session
–i Idle time
–l Composite limit
–p Private SGA
–r Logical reads per call
–R Logical reads per session
–s Sessions per user
–t Connect time
Chapter 4. Commands 391

Exampleswosetresources -c ’{UNLIMITED 0}’ oracle_resources misc_res misc_res2
UsageThe wosetresources command modifies the attributes of the existing Oracleresources identified by the resource_name argument, in the Oracle resource profilespecified by the profile_name argument. All attributes are validated against theprofile validation policy.
CommentsSee also, the wosetresource, wodelresource, and wogetresource commands.
392 IBM Tivoli Monitoring for Databases: Oracle: Reference Guide

wosetrole
PurposeModifies the attributes of an Oracle role record.
Authorizationadmin
Formatwosetrole[–a NONE | OS | PASSWORD][–R assigned_roles][–p password][–S system_privileges][–n new_role_name][[–x attr_name attr_value] ... ]profile_name role_name
where:
–a NONE Selects no authentication.
–a OS Selects OS authentication.
–a PASSWORDSelects password authentication.
–R assigned_rolesSpecifies the assigned roles of this role, where assigned_roles is astring representation of a sequence of the form:
′{count [{role_name is_grantable is_default}] ... }′
where count is the number of assigned roles, role_name is thedouble-quoted role name, and is_grantable and is_default can takethe value TRUE or FALSE.
For example:’{2 {"payroll" TRUE TRUE}{"payables" TRUE FALSE}}’
–p password Specifies a password.
–S system_privilegesSpecifies the role’s system privileges, where system_privileges is astring representation of a sequence of the form:
′{count [{privilege is_grantable}] ... }′
where count is the number of privileges, privilege is thedouble-quoted privilege name, and is_grantable takes the valueTRUE or FALSE.
–n new_role_nameChanges the role name.
–x attr_name attr_valueSets the value of the attribute attr_name (added using Tivoli/AEF)to attr_value.
profile_name Specifies the name of the profile in which to find the role record.
Chapter 4. Commands 393

role_name Specifies the role name.
Exampleswosetrole -R ’{1 {"International" FALSE FALSE}}’ oracle_roles test_role
UsageThe wosetrole command modifies the attributes of the existing Oracle roleidentified by the role_name argument in the Oracle role profile specified by theprofile_name argument. All attributes are validated against the profile validationpolicy.
CommentsSee also, the wocrtrole, wosetroles, and wogetrole commands.
394 IBM Tivoli Monitoring for Databases: Oracle: Reference Guide

wosetroles
PurposeModifies the attributes of multiple Oracle role records.
Authorizationadmin
Formatwosetroles[–a NONE | OS | PASSWORD]][–p password][–R assigned_roles][–S system_privileges][[–x attr_name attr_value] ... ] profile_name role_name ...
where:
–a NONE Selects no authentication.
–a OS Selects OS authentication.
–a PASSWORDSelects password authentication.
–R assigned_rolesSpecifies the assigned roles of these roles, where assigned_roles is astring representation of a sequence of the form:
′{count [{role_name is_grantable is_default}] ... }′
where count is the number of assigned roles, role_name is thedouble-quoted role name, and is_grantable and is_default can takethe value TRUE or FALSE.
For example:’{2 {"payroll" FALSE FALSE} \{"payables" TRUE FALSE}}’
–p password Specifies a password.
–S system_privilegesSpecifies the roles’ system privileges, where system_privileges is astring representation of a sequence of the form:
′{count [{privilege is_grantable}] ... }′
where count is the number of privileges, privilege is thedouble-quoted privilege name, and is_grantable takes the valueTRUE or FALSE.
For example:’{2 {"updatesalary" TRUE} {"createsalary" TRUE}}’
–x attr_name attr_valueSets the value of the attribute attr_name (added using Tivoli/AEF)to attr_value.
profile_name Specifies the name of the profile in which to find the role records.
Chapter 4. Commands 395

role_name Specifies a role name. This argument can be specified multipletimes.
Exampleswosetroles -R ’{1 {"NorthAmerica" FALSE FALSE 0}}’ oracle_usersjw_smith
UsageThe wosetroles command modifies the attributes of the existing Oracle rolesidentified by the role_name arguments in the Oracle role profile specified by theprofile_name argument. All attributes are validated against the profile validationpolicy.
CommentsSee also, the wocrtrole, wosetrole, and wogetrole commands.
396 IBM Tivoli Monitoring for Databases: Oracle: Reference Guide

wosetuser
PurposeModifies the attributes of an Oracle user record.
Authorizationadmin
Formatwosetuser[–a TRUE | FALSE][–o TRUE | FALSE][–p password][–d default_tablespace][–t temporary_tablespace][–R roles][–S system_privileges][–O object_privileges][–Q quotas][–r resource_profile][[–x attr_name attr_value] ... ][–u new_user_name]profile_name user_name
where:
–a TRUE Selects OS authentication.
–a FALSE Selects database authentication.
–o TRUE Allows Oracle user to change password.
–o FALSE Disallows Oracle user from changing password.
–p password Specifies a password.
–d default_tablespaceSpecifies a default tablespace.
–t temporary_tablespaceSpecifies a temporary tablespace.
–R roles Specifies the user’s roles, where roles is a string representation of asequence of the form:
′{count [{role_name is_grantable is_default}] ... }′
where count is the number of roles, role_name is the double-quotedrole name, and is_grantable and is_default can take the value TRUEor FALSE.
For example:’{2 {"createinvoice" FALSE}"creditinvoice" FALSE}}’
–O object_privilegesSpecifies the user’s object privileges, where object_privileges is astring representation of a sequence of the form:
Chapter 4. Commands 397

′{priv_count [{grantee privilege {col_count [column] ... } schema objectis_grantable}] ... }′
where priv_count is the number of privileges, grantee is the name ofthe user receiving the privilege, privilege is the privilege name,col_count is the number of columns this applies to, column is acolumn name, schema is the schema name, object is the object name,and is_grantable can take the value TRUE or FALSE. The names areall double quoted.
For example:’{1 {"jw_smith" "create" {1 "Invoice"}"Acctg2" "invoice" TRUE}}’
–Q quotas Specifies the user’s quotas, where quotas is a string representationof a sequence of the form:
′{count [{tablespace is_limited limit_value}] ... }′
where count is the number of quotas, tablespace is thedouble-quoted tablespace name, is_limited can take the value TRUEor FALSE, and limit_value is the numerical value of the limit.
For example:’{2 {"Invoices" TRUE 70}"Credits" TRUE 160}}’
–r resource_profileSpecifies a resource profile.
–x attr_name attr_valueSets the value of the attribute attr_name (added using Tivoli/AEF)to attr_value.
–u new_user_nameChanges the user name.
profile_name Specifies the name of the profile.
user_name Specifies the user’s current name.
Exampleswosetuser -Q ’{1 {"SYSTEM" FALSE 0}}’ oracle_users jw_smith
UsageThe wosetuser command modifies the attributes of the existing Oracle useridentified by the user_name argument in the Oracle user profile specified by theprofile_name argument. All attributes are validated against the profile validationpolicy.
CommentsSee also, the wocrtuser, wodeluser, and wogetuser commands.
398 IBM Tivoli Monitoring for Databases: Oracle: Reference Guide

wosetusers
PurposeModifies the attributes of multiple Oracle user records.
Authorizationadmin
Formatwosetusers[–a TRUE | FALSE][–o TRUE | FALSE][–p password][–d default_tablespace][–t temporary_tablespace][–R roles][–S system_privileges][–O object_privileges][–Q quotas][–r resource_profile][[–x attr_name attr_value] ... ]profile_name user_name ...
where:
–a TRUE Selects OS authentication.
–a FALSE Selects database authentication.
–o TRUE Allows Oracle user to change password.
–o FALSE Disallows Oracle user from changing password.
–p password Specifies a password.
–d default_tablespaceSpecifies a default tablespace.
–t temporary_tablespaceSpecifies a temporary tablespace.
–R roles Specifies the user’s roles, where roles is a string representation of asequence of the form:
′{count [{role_name is_grantable is_default}] ... }′
where count is the number of roles, role_name is the double-quotedrole name, and is_grantable and is_default can take the value TRUEor FALSE.
For example:’{2 {"invoice" FALSE TRUE}{"receive" FALSE FALSE}}’
–S system_privilegesSpecifies the users’ system privileges, where system_privileges is astring representation of a sequence of the form:
′{count [{privilege is_grantable}] ... }′
Chapter 4. Commands 399

where count is the number of privileges, privilege is thedouble-quoted privilege name, and is_grantable takes the valueTRUE or FALSE.
For example:’{2 {"createinvoice" FALSE}{"creditinvoice" FALSE}}’
–O object_privilegesSpecifies the users’ object privileges, where object_privileges is astring representation of a sequence of the form:
′{priv_count [{grantee privilege {col_count [column] ... } schema objectis_grantable}] ... }′
where priv_count is the number of privileges, grantee is the name ofthe user receiving the privilege, privilege is the privilege name,col_count is the number of columns this applies to, column is acolumn name, schema is the schema name, object is the object name,and is_grantable can take the value TRUE or FALSE. The names areall double quoted.
For example:’{1 {"jw_smith" "credit" {1 "Invoice"} "Acctg2" "invoice" FALSE}}’
–Q quotas Specifies the users’ quotas, where quotas is a string representationof a sequence of the form:
′{count [{tablespace is_limited limit_value}] ... }′
where count is the number of quotas, tablespace is thedouble-quoted tablespace name, is_limited can take the value TRUEor FALSE, and limit_value is the numerical value of the limit.
For example:’{2 {"Credits" TRUE 100}{"Returns" FALSE 0}}’
–r resource_profileSpecifies a resource profile.
–x attr_name attr_valueSets the value of the attribute attr_name (added using Tivoli/AEF)to attr_value.
–u new_user_nameChanges the user name.
profile_name Specifies the name of the profile.
user_name Specifies each user name. This argument can be specified multipletimes.
Exampleswosetusers -Q ’{1 {"SYSTEM" FALSE 0}}’ oracle_users jw_smith r_lynch
UsageThe wosetusers command modifies the attributes of the multiple Oracle usersidentified by the user_name arguments in the Oracle user profile specified by theprofile_name argument. All attributes are validated against the profile validationpolicy.
400 IBM Tivoli Monitoring for Databases: Oracle: Reference Guide

CommentsSee also, the wocrtuser, wodeluser, and wogetuser commands.
Chapter 4. Commands 401
woshutdown
PurposeTo shutdown an Oracle database from the Tivoli desktop so you can stop thedatabase operations.
Authorizationoracle_dba
Formatwoshutdown [–n | –i | –a | –t][–I] database-name
where:
–n Normal – Waits for all transactions to complete and all users to logoff before shutting down the database.
–i Immediate (default) – Rolls back any uncommitted transactionsand disconnects all connected users, and then shuts down thedatabase.
–a Abort – Does not wait for transactions to complete or users to logoff. Be careful when using this option, because the database mightneed recovery afterwards.
–t Transactional Abort – Allows active transactions to complete beforeshutting down the instance.
–I Specifies that resource-name refers to an instance (not needed for adatabase).
resource-name The name for the database.
ExamplesThe following example shows an immediate shutdown of a database namedgordon:woshutdown -i gordon@manzana
The following example shows an immediate shutdown of an instance namedorcl@orcl@hyde:woshutdown -i -I orcl@orcl@hyde
UsageThe woshutdown command shuts down an Oracle database from the Tivolidesktop so you can stop the database operations.
CommentsNone.
402 IBM Tivoli Monitoring for Databases: Oracle: Reference Guide
wostartup
PurposeTo start a database from the Tivoli desktop so you can use or edit the database.
Authorizationoracle_dba
Formatwostartup [–p][–r][–f][–n | –m | –o][–I] resource-name
where:
–p Parallel.
–r Restricted – Allows only users with RESTRICTED SESSION rightsto connect to the database when it is running.
–f Force (abort).
–n Nomount – Starts the database, but does not associate it with aninstance.
–m Mount – Associates the database with an instance.
–o Open (default) – Makes the database available to users.
–I Only used when starting an instance. Specifies that resource-namerefers to a database instance.
resource-name The name of the database.
ExamplesThe following example performs a default startup of the v817@manzana database:wostartup v817@manzana
The following example starts up the example database in restricted mode, withoutmounting the database:wostartup -r -n v817@manzana
UsageThe wostartup command starts a database from the Tivoli desktop so you can useor edit the database.
CommentsNone.
Chapter 4. Commands 403

404 IBM Tivoli Monitoring for Databases: Oracle: Reference Guide

Appendix A. Monitor to resource model migration table
The following table compares the previous Tivoli Manager for Oracle monitorswith the current IBM Tivoli Monitoring for Databases: Oracle resource models.Alternatively, Table 10 on page 408 compares resource models to the previous TivoliManager for Oracle monitors. Use these tables for functionality mapping. Forcomplete details on the IBM Tivoli Monitoring for Databases: Oracle resourcemodels, see Chapter 2, “Resource models” on page 5. Also included is a taskmigration table. See Table 11 on page 410 for task name comparisons.
Table 9. Monitor to resource model migration table
Tivoli Manager for Oracle, Version 2.0monitor name
IBM Tivoli Monitoring for Databases:Oracle, Version 5.1.0 resource model
Active Transactions Transaction
Advanced Queue Propagation Status (8i) Advanced Queue
Alerts Log Event
Any v$lock Lock
Any v$sysstat Other Performance Monitors
AQ (Advanced Queue) SchedulePropagation errors (8i)
Advanced Queue
Archive Free Space Archive Destinations
Archive Percent Free Space Archive Destinations
Archive Space (Number of Redo Logs) Archive Destinations
Archive Used Space Archive Destinations
Average Message Propagation Rate (acrossschedule) (8i)
Advanced Queue
Average Redo Entry Size Redo Log
Average waiting time of ″READY″ messages(8i)
Advanced Queue
Background Dump Space Dump Space
Block Changes Per Transaction Transaction
Block Get Rate Other Performance Monitors
Blocked Transactions Transaction
Buffer Cache Hit Ratio SGA
Buffer Cache Hit Ratio (Interval) SGA
Buffer Waits Ratio SGA
Call Rate Transaction
Calls Per Transaction Transaction
Chained Rows (cluster) Other Storage
Chained Rows (table) Other Storage
Changed Block Ratio Other Performance Monitors
Cluster Key Ratio Other Storage
Completed Background Checkpoints Checkpoints
405

Table 9. Monitor to resource model migration table (continued)
Tivoli Manager for Oracle, Version 2.0monitor name
IBM Tivoli Monitoring for Databases:Oracle, Version 5.1.0 resource model
Consistent Change Ratio Rollback Segment
Continued Row Ratio Other Storage
Currently Running Heterogeneous Services(8i)
Other Performance Monitors
DBWR Checkpoints Checkpoints
Dictionary Cache Hit Ratio SGA
Dictionary Cache Hit Ratio (Interval) SGA
Dispatcher Busy Rate Multi-Threaded Server
Dispatcher Wait Times Multi-Threaded Server
DML Locks Ratio Lock
Enqueue Timeouts Lock
Extents Extents
Extents by Tablespace Extents by Tablespace
Extents by User Extents by User
Free Space Deficit Free Space Deficit
Free Space Deficit by Tablespace Free Space Deficit by Tablespace
Free Space Deficit by User Free Space Deficit by User
Free Space Fragmentation Free Space Fragmentation
Free Space Fragmentation by Tablespace Free Space Fragmentation by Tablespace
Free Tablespace Free Tablespace
Free Tablespace by Tablespace Free Tablespace by Tablespace
Freelist Waits Ratio Other Performance Monitors
Index Statistics Other Storage
Library Cache Hit Ratio SGA
Library Cache Hit Ratio (Interval) SGA
Lock Hit Ratio – Parallel Withdrawn
Long Running Transactions Transaction
Long Table Full Table Scans (Interval) Full Table Scan
Maximum Extents Maximum Extents
Maximum Extents by Tablespace Maximum Extents by Tablespace
Maximum Extents by User Maximum Extents by User
NT Service Status Process State
Number of Datafiles Other Storage
Number of Deadlocks Lock
Open Cursors Other Performance Monitors
PCM Conversion Waits Withdrawn
PCM Lock Conversion Time Withdrawn
Percentage of False Pings Withdrawn
Physical I/O Reads I/O
406 IBM Tivoli Monitoring for Databases: Oracle: Reference Guide

Table 9. Monitor to resource model migration table (continued)
Tivoli Manager for Oracle, Version 2.0monitor name
IBM Tivoli Monitoring for Databases:Oracle, Version 5.1.0 resource model
Physical I/O Writes I/O
Ping Rate Withdrawn
Process Ratio Other Performance Monitors
RDBMS State RDBMS State
Recursive Call Rate Recursive Calls
Recursive Calls Recursive Calls
Recursive To User Calls Ratio Recursive Calls
Redo Allocation Latch Ratio Redo Log
Redo Copy Latch Ratio Redo Log
Redo Log Space Waits Redo Log
Redo Logs Not Archived Redo Log
Redo Small Copy Ratio Redo Log
Rollback Waits Rollback Segment
Row Source Ratio Full Table Scan
Rows in DUAL Table Other Performance Monitors
Shared Server Process Ratio Multi-Threaded Server
Shared Server Wait Time Multi-Threaded Server
Sort Overflow Ratio Other Performance Monitors
SQL Number SQL Number
SQL String SQL String
Temporary Extents Temporary Extents
Temporary Extents by Tablespace Temporary Extents by Tablespace
Temporary Extents by User Temporary Extents by User
Total waiting time of READY messages Advanced Queue
Unix Core Dump Space Dump Space
Unix SQL*Net V1 TCP/IP Listener Listener State
Unix SQL*Net V2 Listener Listener State
User Dump Space Dump Space
User Rollback Ratio Rollback Segment
Appendix A. Monitor to resource model migration table 407

Table 10. Resource model and monitor comparison
IBM Tivoli Monitoring for Databases:Oracle, Version 5.1.0 resource model
Tivoli Manager for Oracle, Version 2.0monitor name
Advanced Queue Advanced Queue Propagation Status (8i)
AQ (Advanced Queue) SchedulePropagation errors (8i)
Average Message Propagation Rate (acrossschedule) (8i)
Average waiting time of ″READY″ messages(8i)
Total waiting time of READY messages
Archive Destination Archive Free Space
Archive Percent Free Space
Archive Space (Number of Redo Logs)
Archive Used Space
Checkpoints Completed Background Checkpoints
DBWR Checkpoints
Dump Space Background Dump Space
Unix Core Dump Space
User Dump Space
Extents Extents
Extents by Tablespace Extents by Tablespace
Extents by User Extents by User
Free Space Deficit Free Space Deficit
Free Space Deficit by Tablespace Free Space Deficit by Tablespace
Free Space Deficit by User Free Space Deficit by User
Free Space Fragmentation Free Space Fragmentation
Free Space Fragmentation by Tablespace Free Space Fragmentation by Tablespace
Free Tablespace Free Tablespace
Free Tablespace by Tablespace Free Tablespace by Tablespace
Full Table Scan Long Table Full Table Scans (Interval)
Row Source Ratio
I/O Physical I/O Reads
Physical I/O Writes
Job Queue New
Listener State Unix SQL*Net V1 TCP/IP Listener
Unix SQL*Net V2 Listener
408 IBM Tivoli Monitoring for Databases: Oracle: Reference Guide

Table 10. Resource model and monitor comparison (continued)
IBM Tivoli Monitoring for Databases:Oracle, Version 5.1.0 resource model
Tivoli Manager for Oracle, Version 2.0monitor name
Lock Any v$lock
DML Locks Ratio
Enqueue Timeouts
Log Event Alerts
Maximum Extents Maximum Extents
Maximum Extents by Tablespace Maximum Extents by Tablespace
Maximum Extents by User Maximum Extents by User
Multi-Threaded Server Dispatcher Busy Rate
Dispatcher Wait Times
Shared Server Process Ratio
Shared Server Wait Time
Other Performance Monitors Any v$sysstat
Block Get Rate
Changed Block Ratio
Currently Running Heterogeneous Services(8i)
Freelist Waits Ratio
Open Cursors
Process Ratio
Rows in DUAL Table
Sort Overflow Ratio
Other Storage Chained Rows (cluster)
Chained Rows (table)
Cluster Key Ratio
Continued Row Ratio
Index Statistics
Number of Datafiles
PGA New
Process State NT Service Status
RDBMS State RDBMS State
Recursive Calls Recursive Call Rate
Recursive Calls
Recursive To User Calls Ratio
Appendix A. Monitor to resource model migration table 409

Table 10. Resource model and monitor comparison (continued)
IBM Tivoli Monitoring for Databases:Oracle, Version 5.1.0 resource model
Tivoli Manager for Oracle, Version 2.0monitor name
Redo Log Average Redo Entry Size
Redo Allocation Latch Ratio
Redo Copy Latch Ratio
Redo Log Space Waits
Redo Logs Not Archived
Redo Small Copy Ratio
Rollback Segment Consistent Change Ratio
Rollback Segment
User Rollback Ratio
SGA Buffer Cache Hit Ratio
Buffer Cache Hit Ratio (Interval)
Buffer Waits Ratio
Dictionary Cache Hit Ratio
Dictionary Cache Hit Ratio (Interval)
Library Cache Hit Ratio
Library Cache Hit Ratio (Interval)
SQL Number SQL Number
SQL String SQL String
Temporary Extents Temporary Extents
Temporary Extents by Tablespace Temporary Extents by Tablespace
Temporary Extents by User Temporary Extents by User
Transaction Active Transactions
Block Changes Per Transaction
Blocked Transactions
Call Rate
Calls Per Transaction
Long Running Transactions
Undo Space New
Table 11. Task migration table
Tivoli Manager for Oracle, Version 2.0 taskname
IBM Tivoli Monitoring for Databases:Oracle, Version 5.1.0, task name
DisableMonitoring DisableResourceModels
EnableMonitoring EnableResourceModels
410 IBM Tivoli Monitoring for Databases: Oracle: Reference Guide

Appendix B. Resource model CIM class quick reference
The following table lists the IBM Tivoli Monitoring for Databases: Oracle resourcemodels and the CIM classes they reference. For complete details on the IBM TivoliMonitoring for Databases: Oracle resource models, see Chapter 2, “Resourcemodels” on page 5.
Table 12. Resource models and their referenced CIM classes
Resource Model CIM Class
Advanced Queue OracleQueue
OracleQueueSchedule
Archive Destination OracleArchiveDest
OracleDatabase
OracleRedoLogGroup
Checkpoints OracleDatabase
OracleInstance
Dump Space OracleDatabase
OracleDumpSpace
Extents OracleSegment
Extents by Tablespace OracleSegment
Extents by User OracleSegment
Free Space Deficit OracleEquity
Free Space Deficit by Tablespace OracleEquity
Free Space Deficit by User OracleEquity
Free Space Fragmentation OracleDatabase
OracleTablespace
Free Space Fragmentation by Tablespace OracleDatabase
OracleTablespace
Free Tablespace OracleTablespace
Free Tablespace by Tablespace OracleTablespace
Full Table Scan OracleDatabase
OracleInstance
I/O OracleDatabase
OracleDatafile
Job Queue OracleJob
Listener State OracleDatabase
OracleListener
411

Table 12. Resource models and their referenced CIM classes (continued)
Resource Model CIM Class
Lock OracleDatabase
OracleInstance
OracleLock
OracleParameter
Log Event OracleDatabase
OracleLogEvent
Maximum Extents OracleSegment
Maximum Extents by Tablespace OracleSegment
Maximum Extents by User OracleSegment
Multi-Threaded Server OracleDatabase
OracleDispatcherProtocol
OracleNetwork
OracleParameter
Other Performance Monitors OracleDatabase
OracleHSAgent
OracleInstance
OracleParameter
OracleSession
OracleSysStat
Other Storage OracleCluster
OracleDatabase
OracleIndex
OracleInstance
OracleParameter
OracleTable
PGA OracleDatabase
OracleInstance
Process State OracleDatabase
OracleState
OracleProcess
OracleUnixProcess
RDBMS State OracleState
Recursive Calls OracleDatabase
OracleInstance
412 IBM Tivoli Monitoring for Databases: Oracle: Reference Guide

Table 12. Resource models and their referenced CIM classes (continued)
Resource Model CIM Class
Redo Log OracleDatabase
OracleInstance
Rollback Segment OracleDatabase
OracleInstance
SGA OracleDatabase
OracleInstance
SQL Number OracleDatabase
OracleFreeform
SQL String OracleDatabase
OracleFreeform
Temporary Extents OracleSegment
Temporary Extents by Tablespace OracleSegment
Temporary Extents by User OracleSegment
Transaction OracleDatabase
OracleInstance
OracleSession
OracleTransaction
Undo Space OracleDatabase
OracleUndoStat
Appendix B. Resource model CIM class quick reference 413

414 IBM Tivoli Monitoring for Databases: Oracle: Reference Guide
Appendix C. Creating custom resource models using CIMclasses
The IBM Tivoli Monitoring Workbench is a programming tool for creating,modifying, debugging, and packaging resource models for use with IBM TivoliMonitoring products. Samples of Best Practice Resource Models have also beenprovided for you to use within the IBM Tivoli Monitoring Workbench. Theseresource models are intended to be used as working examples for creating newresource models. Customers need to have a current Tivoli Maintenance & SupportContract to receive assistance with problems and issues related to the operation ofthe IBM Tivoli Monitoring Workbench.
Note: Resource models created with Oracle CIM classes must only be pushed toOracleDatabaseManagers or OracleInstanceManagers. Resource modelscreated with the OracleListener CIM class can only be pushed toOracleInstanceManagers.
Creating custom resource models using the IBM Tivoli MonitoringWorkbench
ObjectiveTo create customized resource models in the Workbench using IBM TivoliMonitoring for Databases: Oracle CIM classes and the Resource Model Wizard toguide you through the process.
Background informationThe IBM Tivoli Monitoring Workbench is a programming tool for creating,modifying, debugging, and packaging resource models for use with IBM TivoliMonitoring products. Samples of the Best Practice Resource Models have beenprovided for you to use within the IBM Tivoli Monitoring Workbench. The sampleresource models are intended to be used as working examples for creating newresource models.
The Tivoli Maintenance and Support Contract covers assistance with problemsrelating to the operation of the IBM Tivoli Monitoring Workbench, but does notcover assistance for new or modified resource models other than the ones that areincluded in the IBM Tivoli Monitoring Workbench.
The Resource Model Wizard guides you through the process of creating resourcemodels using IBM Tivoli Monitoring for Databases: Oracle CIM classes. Refer tothe IBM Tivoli Monitoring Workbench documentation for more information onhow to create resource models.
Required authorization roleadmin
Before you beginBefore you begin, you must perform the following steps:1. Install and configure Windows Management Instrumentation.
Additional Information: You can download Windows ManagementInstrumentation from http://msdn.microsoft.com/downloads/.
2. Install and configure IBM Tivoli Monitoring Workbench.
415
3. Load each IBM Tivoli Monitoring for Databases: Oracle CIM class you want touse.Additional Information: Load the classes by running the mofcomp commandfrom the Workbench/w32–ix86 directory in the IBM Tivoli Monitoring forDatabases: Oracle installation CD. For more information about the mofcompcommand, refer to the Windows Management Instrumentation documentation.
After you finishRefer to IBM Tivoli Monitoring Workbench documentation for instructions on howto build and deploy your new resource model. Resource models created to use theIBM Tivoli Monitoring for Databases: Oracle CIM classes need to be distributed tothe OracleInstanceManager or the OracleDatabaseManager.
Procedure1. Open the IBM Tivoli Monitoring Workbench.2. Select File to display the File drop-down menu.3. Select New from the File drop-down menu to display the New window.4. Select Java Script Resource Model.5. Click OK to display the New Resource Model Workspace window.6. Select the Resource Model Wizard radio button.7. Click OK.8. Select the CIM/WMI data source type.9. Select all of the available operating systems on which you want the resource
model to run.10. Click Next.11. Type ROOT\CIMV2 in the Connect to namespace field.
Additional Information: ROOT\CIMV2 is the destination where the IBM TivoliMonitoring for Databases: Oracle specific CIM classes are stored.
12. Optional: Type your password.13. Click OK to display the Select a Class window.
Additional Information: The Selected Class field displays all available CIMclasses for use in your custom resource models. All IBM Tivoli Monitoring forDatabases: Oracle CIM classes begin with “Oracle”.
14. Select one or more CIM classes.15. Select the CIM class properties to monitor from the Class Properties group
box.16. Click Next.17. Follow the Resource Model Wizard instructions to complete your resource
model. See the IBM Tivoli Monitoring Workbench documentation for detailedinstructions.
18. After the wizard is complete, add the CIM classes as platform-specificdependencies to the resource model by doing the following:a. Open the IBM Tivoli Monitoring Workbench dialog box containing the
decision tree for your new resource model.b. In the decision tree on the left side of the dialog box, click ″+″ to expand
the tree list for the newly created resource model.c. Click ″+″ to the left of Dependencies to expand the Dependencies tree.d. Right-click on a platform-specific dependency element to display the Add
pop-up box.e. Click Add to display the Open dialog box.
416 IBM Tivoli Monitoring for Databases: Oracle: Reference Guide

f. For the Look in: field, scroll to select the IBM Tivoli Monitoring forDatabases: Oracle installation CD.
g. Click one of the following directories for the operating system on whichthe resource models will run:v Windows: Workbench/w32–ix86.
—OR—v UNIX (including Linux-ix86, aix4–r1, HP–UX10, solaris2):
Workbench/UNIX.h. Click Open to add the classes to the Dependencies folder.i. Repeat steps 18d to 18h until all platform-specific dependencies have been
updated with the IBM Tivoli Monitoring for Databases: Oracle CIM classes.
Note: Some string properties have numeric values. These properties are markedwith a ″+″ in the CIM Class appendix. To compare these values againstnumeric thresholds, you must convert the string to an integer using theparseInt() function, then write the code manually. See theOracle_Sample_OracleSession.dmjsws workbench file for the completesource code example. The following text is an excerpt from that file://HINT: OpenCursors is defined as a String value in the CIM class, but its//value represents a numeric. If you wish to do numeric comparisons or//calculations with the OpenCursors’ value then it should be caste to an//integer using the Javascript Number object .
curOpenCursors = Number(Svc.GetStrProperty("ROOT\\CIMV2:OracleSession",idx, "OpenCursors"));
Svc.SetMapNumElement(hPropTable,"OpenCursors",curOpenCursors);
//HINT: Always verify that the number you received from the instrumentation//is a valid number.
if (!isNaN(curOpenCursors)) {var curThreshold = Svc.GetThreshold("Threshold_Oracle_Sample_OracleSession_OpenCursors");
//Compare the number of currently open cursors to the defined threshold.//If this threshold is exceeded, then an indication should be sent.
if (curOpenCursors > curThreshold) {Svc.SetMapNumElement(hPropTable, "Threshold", curThreshold);
Svc.SendEventEx( "Ev_Oracle_Sample_OracleSession_OpenCursors_exceeds",hPropTable);
}
//Log the properties for viewing in the Web Health Console
Svc.LogInstEx ("Sample","OracleSession", hPropTable);
} else {//ERROR: The instrumentation did not correctly return a//valid number for the value of OpenCursors.
Svc.Trace(0, "Sample_OracleSession: curOpenCursors is NaN");}
Appendix C. Creating custom resource models using CIM classes 417
Classes and properties to use in resource models
To create resource models, you need to use providers and their commoninformation model (CIM) classes, parameters, properties, exceptions, anddependencies. A provider is the component of a resource model that delivers thestatus of the monitored object.
Use the following providers to create resource models:v OracleArchiveDestv OracleClassPingv OracleClusterv OracleDatabasev OracleDatafilev OracleDBCacheAdvicev OracleDispatcherv OracleDispatcherProtocolv OracleDumpSpacev OracleEquityv OracleHSAgentv OracleIndexv OracleInstancev OracleJobv OracleListenerv OracleLockv OracleLogEventv OracleNetworkv OracleObjectv OracleParameterv OraclePGAStatv OraclePQSlavev OraclePQSysStatv OracleProcessv OraclePXProcessv OraclePXProcessSysStatv OraclePXSessionv OracleQueuev OracleQueueSchedulev OracleRedoLogv OracleRedoLogGroupv OracleRollbackSegmentv OracleSegmentv OracleSequencev OracleSessionv OracleSessStatv OracleSharedServerv OracleSQLPlan
418 IBM Tivoli Monitoring for Databases: Oracle: Reference Guide

v OracleStatev OracleSysStatv OracleSystemEventv OracleTablev OracleTablespacev OracleTransactionv OracleUndoStatv OracleUnixProcessv OracleUser
Appendix C. Creating custom resource models using CIM classes 419

OracleArchiveDest
DescriptionThe following tables detail the CIM class, parameters, properties, exceptions, anddependencies of this provider.
Table 13. CIM class
CIM Name ROOT\CIMV2: OracleArchiveDest
MOF File Name OracleArchiveDest.mof
Description The OracleArchiveDest class makes properties that are associatedwith an archive destination available, such as an archived redo logdestination.
Table 14. Parameters
Parameter Required TYPE Default Description
None None None None None
Table 15. Properties
Property Type Description
Binding String Returns one of the following requirements for success:MANDATORY (must succeed), or OPTIONAL (need notsucceed, depending onLOG_ARCHIVE_MIS_SUCCEED_DEST).
DestID* UInt32 The archive destination identifier.
Destination* String The archive destination text string as either a translatedprimary location, or a standby service name.
Error String The text of any last error.
FailBlock UInt32 Any block number at last error.
FailDate String The date and time of any last error.
FailSequence UInt32 Any log sequence number at last error.
FreeKBytes UInt32 Any unallocated space on the archive destination device.
InstanceName* String The name of an Oracle database instance. The instancename is identified by the INSTANCE_NAME parameterin the database initialization parameter file andcorresponds to the Oracle System Identifier (SID) of theinstance.
MountPoint String The file system directory in which data is placed thecontents of a particular drive. For example, /data.
NameSpace String One of the following: SYSTEM is a system definition.SESSION is a session definition.
Status String The current status of the archive destination as one of thefollowing:
v VALID - initialized and available
v INACTIVE - no destination information
v DEFERRED - disabled manually by the user
v ERROR - error during open or copy
v DISABLED - disabled after error
v BAD PARAM - parameter has errors
420 IBM Tivoli Monitoring for Databases: Oracle: Reference Guide
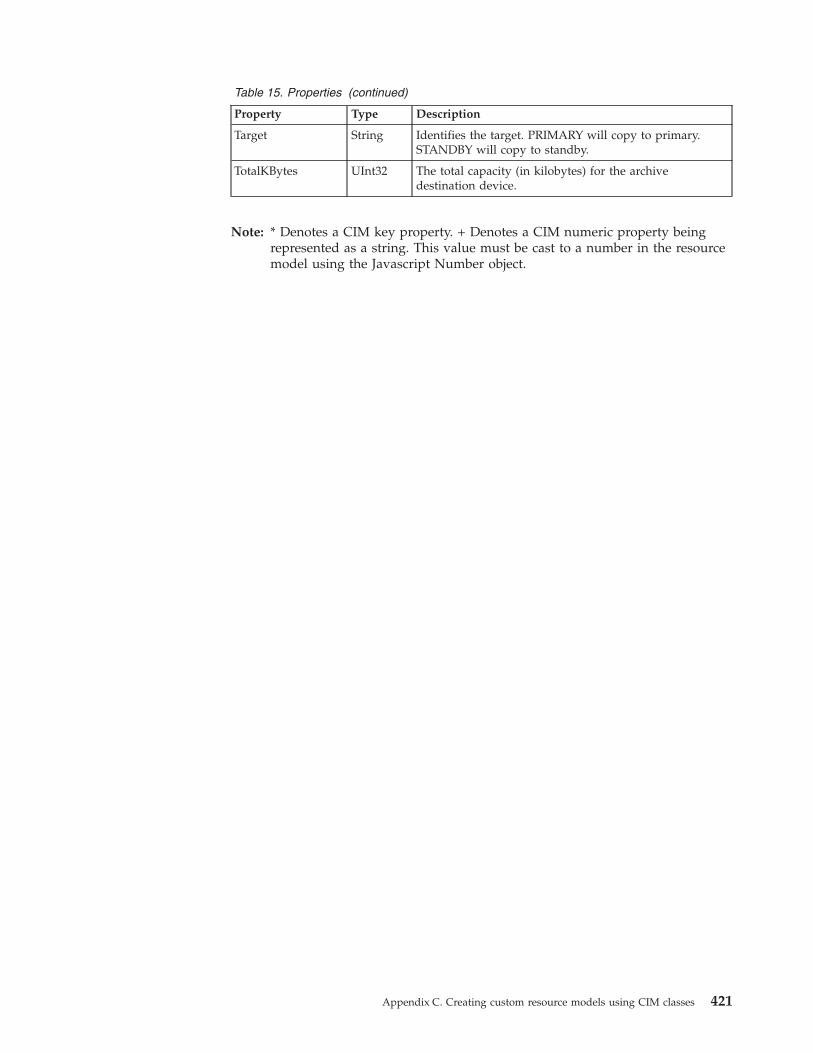
Table 15. Properties (continued)
Property Type Description
Target String Identifies the target. PRIMARY will copy to primary.STANDBY will copy to standby.
TotalKBytes UInt32 The total capacity (in kilobytes) for the archivedestination device.
Note: * Denotes a CIM key property. + Denotes a CIM numeric property beingrepresented as a string. This value must be cast to a number in the resourcemodel using the Javascript Number object.
Appendix C. Creating custom resource models using CIM classes 421

OracleClassPing
DescriptionThe following tables detail the CIM class, parameters, properties, exceptions, anddependencies of this provider.
Table 16. CIM class
CIM Name ROOT\CIMV2: OracleClassPing
MOF File Name OracleClassPing.mof
Description The OracleClassPing class makes properties that are associatedwith blocks pinged per block class available.
Table 17. Parameters
Parameter Required TYPE Default Description
None None None None None
Table 18. Properties
Property Type Description
Class* String The block class.
InstanceName* String The name of an Oracle database instance. The instancename is identified by the INSTANCE_NAMEparameter in the database initialization parameter fileand corresponds to the Oracle System Identifier (SID)of the instance.
X2NullForcedWrite+ String The number of forced writes for blocks of thespecified CLASS due to Exclusive-to-NULLconversions.
X2SforcedWrite+ String The number of forced writes for blocks of thespecified CLASS due to Exclusive-to-Sharedconversions.
Note: * Denotes a CIM key property. + Denotes a CIM numeric property beingrepresented as a string. This value must be cast to a number in the resourcemodel using the Javascript Number object.
422 IBM Tivoli Monitoring for Databases: Oracle: Reference Guide

OracleCluster
DescriptionThe following tables detail the CIM class, parameters, properties, exceptions, anddependencies of this provider.
Table 19. CIM class
CIM Name ROOT\CIMV2: OracleCluster
MOF File Name OracleCluster.mof
Description The OracleCluster class makes properties that are associated with acluster available. A cluster is a group of one or more tablesphysically stored together because they share common columnsand are often used together.
Table 20. Parameters
Parameter Required Type Default Description
None None None None None
Table 21. Properties
Property Type Description
AvgBlocksPerKey+ String The number of blocks in the table divided by thenumber of cluster keys.
BufferPool String The default buffer pool for the specified cluster.
ChainedRows+ String The number of chained rows calculated for a specifiedcluster.
ClusterName* String The name of the specified cluster.
ClusterOwner* String The username of the cluster owner.
DatabaseName* String The name of an Oracle database. The database namecontains up to 8 characters and corresponds to thename specified in the CREATE DATABASE statementand identified in the DB_NAME parameter in thedatabase initialization parameter file.
FreeLists+ String The number of process freelists allocated to thissegment.
FreelistGroups+ String The number of freelist groups allocated to thissegment.
InitialExtent+ String The byte size assigned to the first extent of a segmentat the time a segment is created. Oracle rounds extentsizes to multiples of 5 blocks if the size requested isgreater than 5 blocks.
MaxExtents+ String The maximum number of extents allowed for aspecified segment.
NextExtent+ String The byte size assigned to the next extent allocated to asegment.
TablespaceName String The name of the tablespace that contains the cluster.
Note: * Denotes a CIM key property. + Denotes a CIM numeric property beingrepresented as a string. This value must be cast to a number in the resourcemodel using the Javascript Number object.
Appendix C. Creating custom resource models using CIM classes 423

OracleDatabase
DescriptionThe following tables detail the CIM class, parameters, properties, exceptions, anddependencies of this provider.
Table 22. CIM class
CIM Name ROOT\CIMV2: OracleDatabase
MOF File Name OracleDatabase.mof
Description The OracleDatabase class makes properties that are associatedwith an Oracle database available.
Table 23. Parameters
Parameter Required Type Default Description
None None None None None
Table 24. Properties
Property Type Description
Created String The date of the database creation.
DatabaseName* String The name of an Oracle database. The databasename contains up to 8 characters and correspondsto the name specified in the CREATE DATABASEstatement and identified in the DB_NAMEparameter in the database initialization parameterfile.
FalsePings String The number of times that two or more blocks areaccessed by two nodes concurrently, where eachnode is updating a separate block.
FalsePingPercentage+ String The percentage of false pings.
LockHitPercentage+ String The percentage of data block accesses that do notrequire lock conversions. This percentage indicateshow efficiently user processes are distributedacross multiple instances.
LogMode String Specifies which archive log mode the database isrunning, either ARCHIVELOG, orNOARCHIVELOG.
MaxExtents+ String The maximum number of extents allowed for aspecified segment.
NumberOfDatafiles+ String The number of datafiles in a database. When youcreate a database, you define the maximumnumber of datafiles. If the database reaches thelimit, it will not be able to add additional datafiles.
OpenMode String The current mode of the open database. Possiblemodes include: Mounted, Read Write, and ReadOnly.
PingRate+ String The rate of pings, or forced disk writes, acrossinstances over a specified time. A high ping ratecan indicate the need to redistribute theuser-access configuration so that users who accessthe same information can do so through the sameinstances.
424 IBM Tivoli Monitoring for Databases: Oracle: Reference Guide

Note: * Denotes a CIM key property. + Denotes a CIM numeric property beingrepresented as a string. This value must be cast to a number in the resourcemodel using the Javascript Number object.
Appendix C. Creating custom resource models using CIM classes 425
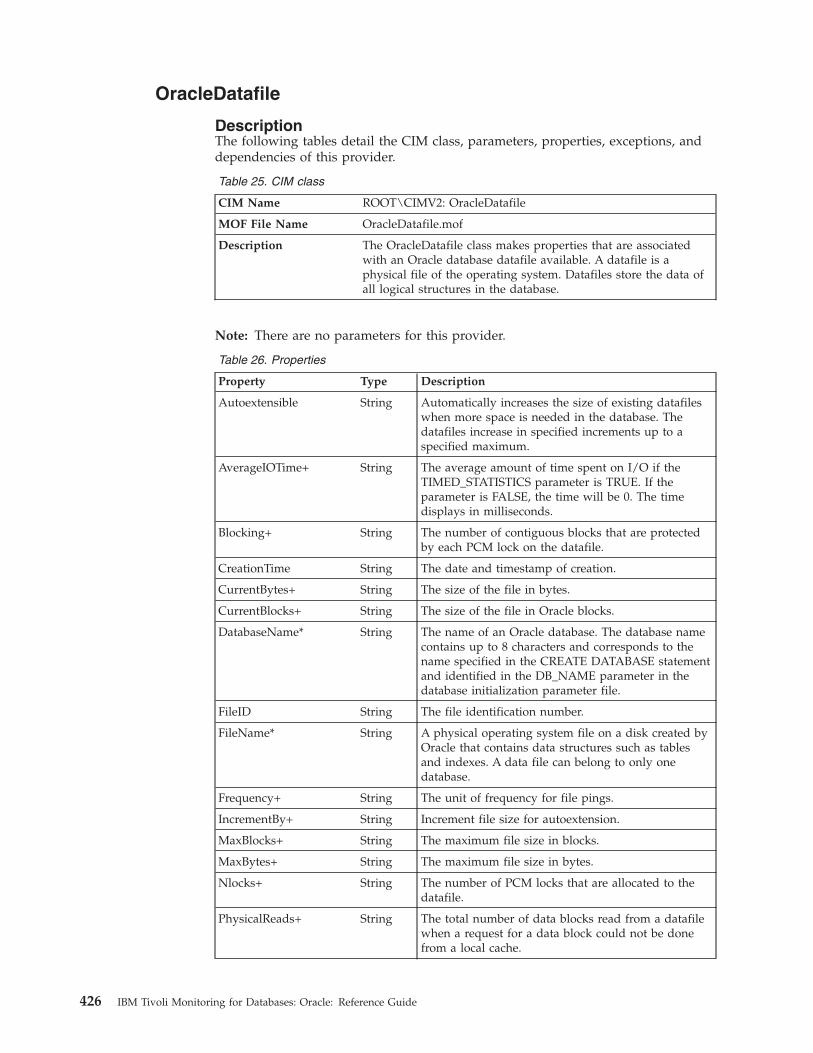
OracleDatafile
DescriptionThe following tables detail the CIM class, parameters, properties, exceptions, anddependencies of this provider.
Table 25. CIM class
CIM Name ROOT\CIMV2: OracleDatafile
MOF File Name OracleDatafile.mof
Description The OracleDatafile class makes properties that are associatedwith an Oracle database datafile available. A datafile is aphysical file of the operating system. Datafiles store the data ofall logical structures in the database.
Note: There are no parameters for this provider.
Table 26. Properties
Property Type Description
Autoextensible String Automatically increases the size of existing datafileswhen more space is needed in the database. Thedatafiles increase in specified increments up to aspecified maximum.
AverageIOTime+ String The average amount of time spent on I/O if theTIMED_STATISTICS parameter is TRUE. If theparameter is FALSE, the time will be 0. The timedisplays in milliseconds.
Blocking+ String The number of contiguous blocks that are protectedby each PCM lock on the datafile.
CreationTime String The date and timestamp of creation.
CurrentBytes+ String The size of the file in bytes.
CurrentBlocks+ String The size of the file in Oracle blocks.
DatabaseName* String The name of an Oracle database. The database namecontains up to 8 characters and corresponds to thename specified in the CREATE DATABASE statementand identified in the DB_NAME parameter in thedatabase initialization parameter file.
FileID String The file identification number.
FileName* String A physical operating system file on a disk created byOracle that contains data structures such as tablesand indexes. A data file can belong to only onedatabase.
Frequency+ String The unit of frequency for file pings.
IncrementBy+ String Increment file size for autoextension.
MaxBlocks+ String The maximum file size in blocks.
MaxBytes+ String The maximum file size in bytes.
Nlocks+ String The number of PCM locks that are allocated to thedatafile.
PhysicalReads+ String The total number of data blocks read from a datafilewhen a request for a data block could not be donefrom a local cache.
426 IBM Tivoli Monitoring for Databases: Oracle: Reference Guide

Table 26. Properties (continued)
Property Type Description
PhysicalWrites+ String The total number of data blocks written to disk.
ReadTime+ String The amount of time spent doing reads if theTIMED_STATISTICS parameter is TRUE. If theparameter is FALSE, the time will be 0. The timedisplays in milliseconds.
StartLk String The first lock corresponding to the datafile.
State String The type of file (either system or user), and its status.Values include: OFFLINE, ONLINE, SYSTEM,RECOVER, or SYSOFF (an offline file from theSYSTEM tablespace).
Status String Specifies the current file status as either AVAILABLEor INVALID. INVALID means that the file number isnot in use.
TablespaceName String The name of a tablespace in a database that uniquelyidentifies the tablespace. The tablespace name cancontain up to 8 characters.
TotalIO+ String The total number of physical reads plus the numberof times DBWR is required to write.
WriteTime+ String The amount of time spent doing writes if theTIMED_STATISTICS parameter is TRUE. If theparameter is FALSE, the time will be 0. The timedisplays in milliseconds.
X2NullForcedWrite+ String The number of forces writes that occurring for blocksof the specified file due to Exclusive-to-Nullconversions.
X2SForcedWrite+ String The number of forced writes occurring for blocks ofthe specified file due to Exclusive-to-Sharedconversions.
Note: * Denotes a CIM key property. + Denotes a CIM numeric property beingrepresented as a string. This value must be cast to a number in the resourcemodel using the Javascript Number object.
Appendix C. Creating custom resource models using CIM classes 427

OracleDBCacheAdvice
DescriptionThe following tables detail the CIM class, parameters, properties, exceptions, anddependencies of this provider.
Table 27. CIM class
CIM Name ROOT\CIMV2: OracleDBCacheAdvice
MOF File Name OracleDBCacheAdvice.mof
Description The OracleDBCacheAdvice class makes properties that areassociated with information concerning predictive data for thenumber of physical reads for the cache size corresponding to eachrow available.
Table 28. Parameters
Parameter Required Type Default Description
None None None None None
Table 29. Properties
Property Type Description
BuffersForEstimate+ String The cache size for prediction (in terms ofbuffers).
EstdPhysicalReads+ String The estimated number of physical reads forthis cache size.
EstdPhysicalReadFactor+ String The physical read factor for this cache size (theratio of the number of estimated physical readsto the number of reads in the real cache). Thevalue is null if there are no physical reads inthe real cache.
InstanceName* String The label of the object where the resourcemodel running this provider was distributed.
ID* UInt32 The buffer pool identifier (ranges from 1 to 8).
Name* String The buffer pool name.
SizeForEstimate+ String The cache size for prediction (in megabytes).
Note: * Denotes a CIM key property. + Denotes a CIM numeric property beingrepresented as a string. This value must be cast to a number in the resourcemodel using the Javascript Number object.
428 IBM Tivoli Monitoring for Databases: Oracle: Reference Guide

OracleDispatcher
DescriptionThe following tables detail the CIM class, parameters, properties, exceptions, anddependencies of this provider.
Table 30. CIM class
CIM Name ROOT\CIMV2: OracleDispatcher
MOF File Name OracleDispatcher.mof
Description The OracleDispatcher class makes properties that are associatedwith a dispatcher process available. A dispatcher process enables anumber of clients to connect to the same server without requiring adedicated server process for each client.
Table 31. Parameters
Parameter Required Type Default Description
None None None None None
Table 32. Properties
Property Type Description
AvgWaitTime+ String The average wait time (in hundredths of a second) thata response waits in the response queue for a dispatcherprocess to route it.
Breaks+ String The number of breaks that have occurred in thisconnection.
Bytes+ String The byte size of messages processed by the dispatcher.
CircuitsCreated+ String The number of circuits that were created by thisdispatcher.
DispatcherName* String The name of the dispatcher process.
InstanceName* String The name of an Oracle database instance. The instancename is identified by the INSTANCE_NAMEparameter in the database initialization parameter fileand corresponds to the Oracle System Identifier (SID)of the instance.
Messages+ String The total number of messages processed by thedispatcher.
Protocol String The protocol for which the dispatcher will generate alistening endpoint. Valid values include TCP (forTCP/IP) or TCPS (for TCP/IP with SSL).
Appendix C. Creating custom resource models using CIM classes 429

Table 32. Properties (continued)
Property Type Description
Status String Displays the current status of the dispatcher. Statusincludes:
v WAIT – dispatcher is idle
v SEND – dispatcher is sending a message
v RECEIVE – dispatcher is receiving a message
v CONNECT – dispatcher is establishing a connection
v DISCONNECT – dispatcher is handling a disconnectrequest
v BREAK – dispatcher is handling a break
v TERMINATE – dispatcher is in the process ofterminating
v ACCEPT – dispatcher is accepting connections
v REFUSE – dispatcher is rejecting connections
TotalBusyTime+ String The total busy time for the dispatcher in hundredths ofa second.
TotalIdleTime+ String The total idle time for the dispatcher in hundredths ofa second.
Note: * Denotes a CIM key property. + Denotes a CIM numeric property beingrepresented as a string. This value must be cast to a number in the resourcemodel using the Javascript Number object.
430 IBM Tivoli Monitoring for Databases: Oracle: Reference Guide
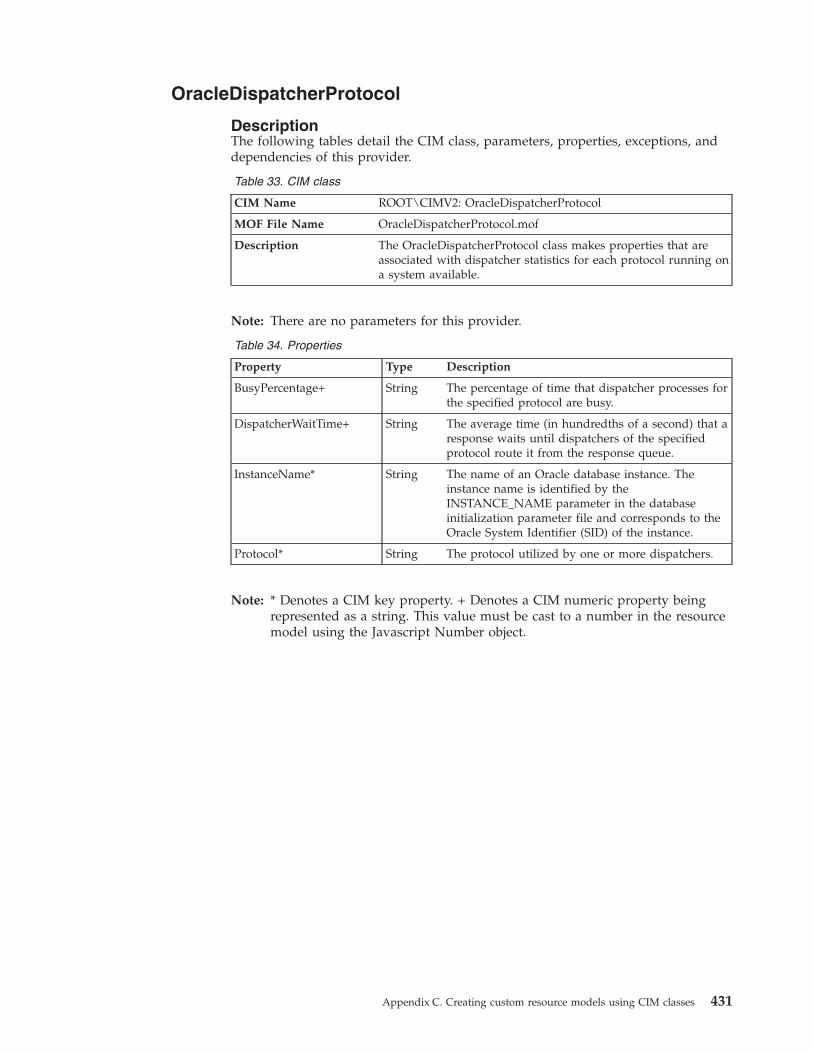
OracleDispatcherProtocol
DescriptionThe following tables detail the CIM class, parameters, properties, exceptions, anddependencies of this provider.
Table 33. CIM class
CIM Name ROOT\CIMV2: OracleDispatcherProtocol
MOF File Name OracleDispatcherProtocol.mof
Description The OracleDispatcherProtocol class makes properties that areassociated with dispatcher statistics for each protocol running ona system available.
Note: There are no parameters for this provider.
Table 34. Properties
Property Type Description
BusyPercentage+ String The percentage of time that dispatcher processes forthe specified protocol are busy.
DispatcherWaitTime+ String The average time (in hundredths of a second) that aresponse waits until dispatchers of the specifiedprotocol route it from the response queue.
InstanceName* String The name of an Oracle database instance. Theinstance name is identified by theINSTANCE_NAME parameter in the databaseinitialization parameter file and corresponds to theOracle System Identifier (SID) of the instance.
Protocol* String The protocol utilized by one or more dispatchers.
Note: * Denotes a CIM key property. + Denotes a CIM numeric property beingrepresented as a string. This value must be cast to a number in the resourcemodel using the Javascript Number object.
Appendix C. Creating custom resource models using CIM classes 431

OracleDumpSpace
DescriptionThe following tables detail the CIM class, parameters, properties, exceptions, anddependencies of this provider.
Table 35. CIM class
CIM Name ROOT\CIMV2: OracleDumpSpace
MOF File Name OracleDumpSpace.mof
Description The OracleDumpSpace class makes properties that are associatedwith background, core, and user destination directories specifiedto receive Oracle alert, trace, and core files available.
Note: There are no parameters for this provider.
Table 36. Properties
Property Type Description
Destination* String The location of dump space.
FreeKBytes+ String Unallocated space on the dump space destination.
InstanceName* String The name of an Oracle database instance. The instancename is identified by the INSTANCE_NAME parameterin the database initialization parameter file andcorresponds to the Oracle System Identifier (SID) of theinstance.
TotalKBytes+ String The total capacity (in kilobytes) for the dump spacedestination.
Type* String The type of dump space destination, as either USER,BACKGROUND, or CORE.
Note: * Denotes a CIM key property. + Denotes a CIM numeric property beingrepresented as a string. This value must be cast to a number in the resourcemodel using the Javascript Number object.
432 IBM Tivoli Monitoring for Databases: Oracle: Reference Guide
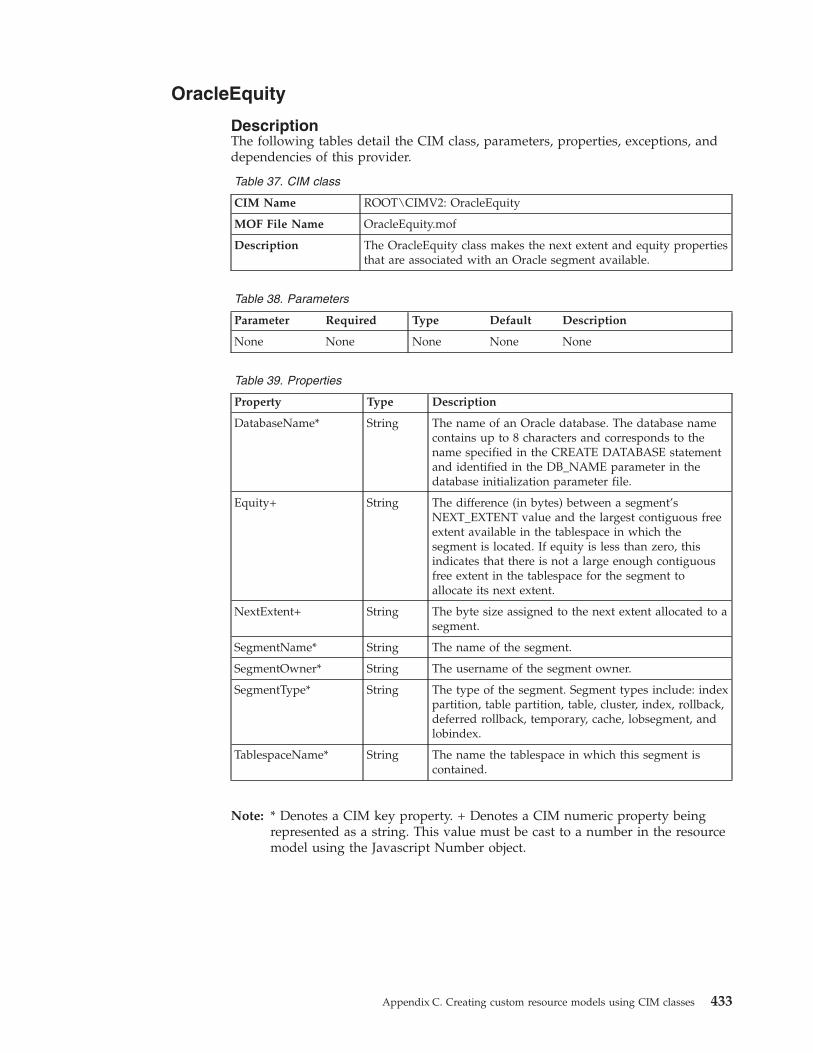
OracleEquity
DescriptionThe following tables detail the CIM class, parameters, properties, exceptions, anddependencies of this provider.
Table 37. CIM class
CIM Name ROOT\CIMV2: OracleEquity
MOF File Name OracleEquity.mof
Description The OracleEquity class makes the next extent and equity propertiesthat are associated with an Oracle segment available.
Table 38. Parameters
Parameter Required Type Default Description
None None None None None
Table 39. Properties
Property Type Description
DatabaseName* String The name of an Oracle database. The database namecontains up to 8 characters and corresponds to thename specified in the CREATE DATABASE statementand identified in the DB_NAME parameter in thedatabase initialization parameter file.
Equity+ String The difference (in bytes) between a segment’sNEXT_EXTENT value and the largest contiguous freeextent available in the tablespace in which thesegment is located. If equity is less than zero, thisindicates that there is not a large enough contiguousfree extent in the tablespace for the segment toallocate its next extent.
NextExtent+ String The byte size assigned to the next extent allocated to asegment.
SegmentName* String The name of the segment.
SegmentOwner* String The username of the segment owner.
SegmentType* String The type of the segment. Segment types include: indexpartition, table partition, table, cluster, index, rollback,deferred rollback, temporary, cache, lobsegment, andlobindex.
TablespaceName* String The name the tablespace in which this segment iscontained.
Note: * Denotes a CIM key property. + Denotes a CIM numeric property beingrepresented as a string. This value must be cast to a number in the resourcemodel using the Javascript Number object.
Appendix C. Creating custom resource models using CIM classes 433
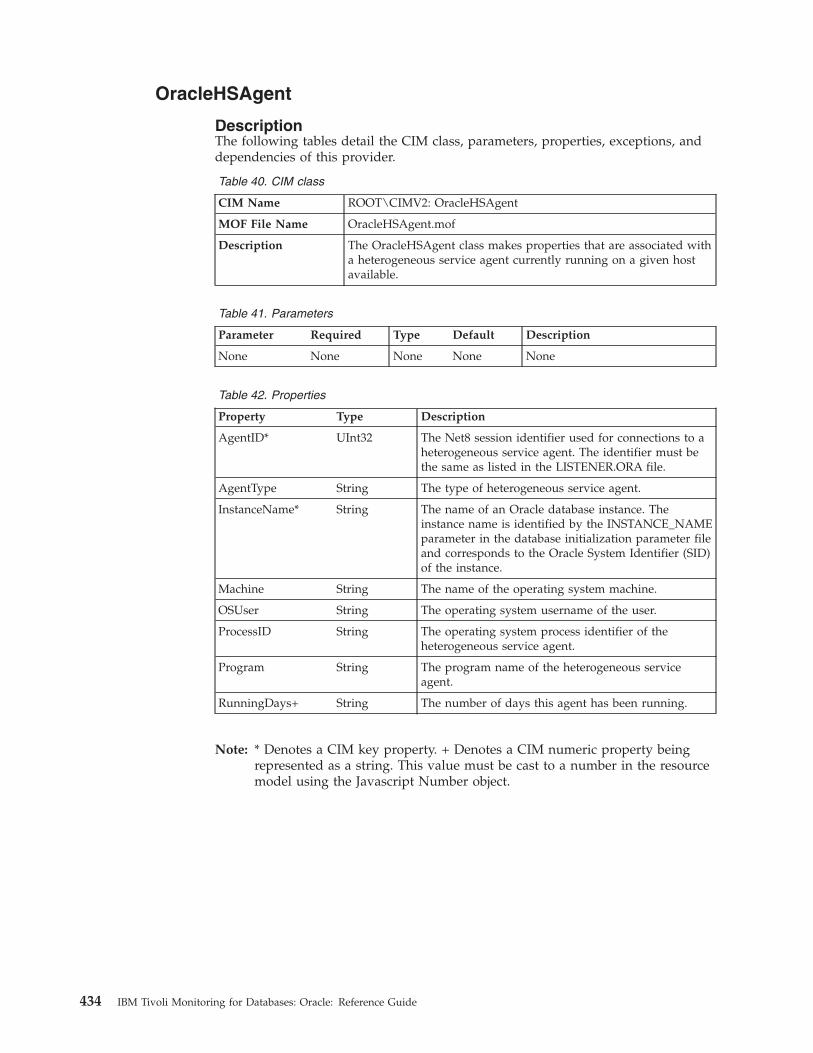
OracleHSAgent
DescriptionThe following tables detail the CIM class, parameters, properties, exceptions, anddependencies of this provider.
Table 40. CIM class
CIM Name ROOT\CIMV2: OracleHSAgent
MOF File Name OracleHSAgent.mof
Description The OracleHSAgent class makes properties that are associated witha heterogeneous service agent currently running on a given hostavailable.
Table 41. Parameters
Parameter Required Type Default Description
None None None None None
Table 42. Properties
Property Type Description
AgentID* UInt32 The Net8 session identifier used for connections to aheterogeneous service agent. The identifier must bethe same as listed in the LISTENER.ORA file.
AgentType String The type of heterogeneous service agent.
InstanceName* String The name of an Oracle database instance. Theinstance name is identified by the INSTANCE_NAMEparameter in the database initialization parameter fileand corresponds to the Oracle System Identifier (SID)of the instance.
Machine String The name of the operating system machine.
OSUser String The operating system username of the user.
ProcessID String The operating system process identifier of theheterogeneous service agent.
Program String The program name of the heterogeneous serviceagent.
RunningDays+ String The number of days this agent has been running.
Note: * Denotes a CIM key property. + Denotes a CIM numeric property beingrepresented as a string. This value must be cast to a number in the resourcemodel using the Javascript Number object.
434 IBM Tivoli Monitoring for Databases: Oracle: Reference Guide

OracleIndex
DescriptionThe following tables detail the CIM class, parameters, properties, exceptions, anddependencies of this provider.
Table 43. CIM class
CIM Name ROOT\CIMV2: OracleIndex
MOF File Name OracleIndex.mof
Description The OracleIndex class makes properties that are associated with anOracle index available.
Note: There are no parameters for this provider.
Table 44. Properties
Property Type Description
AvgLeafBlocksPerKey+ String The average number of leaf blocks for each valuein the index, rounded to the nearest integer. Forindexes enforcing UNIQUE and PRIMARY KEYconstraints, the value is 1.
BufferPool String The name of the default buffer pool used for theindex blocks.
Compression String Whether the index compression is ENABLED orDISABLED.
DatabaseName* String The name of an Oracle database. The databasename contains up to 8 characters and correspondsto the name specified in the CREATE DATABASEstatement and identified in the DB_NAMEparameter in the database initialization parameterfile.
Freelists+ String The number of process freelists allocated to thespecified segment in the index.
FreelistGroups+ String The number of freelist groups allocated to thespecified segment in the index.
IndexName* String The name of the index.
IndexOwner* String The username of the index owner.
IndexType String The type of index. Index types include:NORMAL, BITMAP, FUNCTION-BASEDNORMAL, FUNCTION-BASED BITMAP, orDOMAIN.
InitialExtent+ String The byte size assigned to the first extent of asegment at the time a segment is created. Oraclerounds extent sizes to multiples of 5 blocks if thesize requested is greater than 5 blocks.
MaxExtents+ String The maximum number of extents allowed for thespecified segment.
NextExtent+ String The byte size assigned to the additional extentsallocated to a segment.
PercentageDeleted+ String The percentage of deleted rows from theuser-specified index. Deleted rows include rowsthat have not been repopulated.
Appendix C. Creating custom resource models using CIM classes 435

Table 44. Properties (continued)
Property Type Description
Status String The status for a nonpartitioned index as VALID orUNUSABLE.
TableName String The name of the indexed object.
TableOwner String The username for the owner of the indexed object.
TableType String The type of the indexed object, such as TABLE, orCLUSTER.
TablespaceName String The name of the tablespace that contains theindex.
Uniqueness String Whether the index is UNIQUE or NONUNIQUE.Unique indexes have no two rows in a table withduplicate values in the key columns. Nonuniqueindexes do not impose this column valuesrestriction.
Note: * Denotes a CIM key property. + Denotes a CIM numeric property beingrepresented as a string. This value must be cast to a number in the resourcemodel using the Javascript Number object.
436 IBM Tivoli Monitoring for Databases: Oracle: Reference Guide

OracleInstance
DescriptionThe following tables detail the CIM class, parameters, properties, exceptions, anddependencies of this provider.
Table 45. CIM class
CIM Name ROOT\CIMV2: OracleInstance
MOF File Name OracleInstance.mof
Description The OracleInstance class makes properties that are associated withan Oracle instance constituted by a system global area (SGA) andthe Oracle background processes available.
Note: There are no parameters for this provider.
Table 46. Properties
Property Type Description
ActiveTransactionsPercentage+ String The total number of active transactionsas a percentage of theTRANSACTIONS parameter in theinit.ora file for the instance.
AvgRedoEntrySize+ String The total redo size (in bytes) dividedby the number of redo entries.
BlockChangesPerTransaction+ String The amount of DML (DataManipulation Language) work thateach transaction performs.
BlockGetRate+ String The rate at which the applicationsystem references the database.
BufferCacheCGets+ String The number of times a consistent readwas requested for a block in a specifiedlength of time.
BufferCacheDBGets+ String The number of times a CURRENTblock was requested in a specifiedlength of time.
BufferCacheHitPercentage String The percentage of the buffer cache hitsto total requests over the lifetime of aninstance. The percentage calculates howoften a requested block is found in thebuffer cache without requiring diskaccess. The buffer cache is the portionof the SGA that holds copies of Oracledata blocks. All user processes that areconnected to the instance share accessto the buffer cache.
BufferCachePhysReads+ String The total number of data blocks readfrom a disk. This number is the total ofthe physical reads direct value plus allreads into buffer cache.
BufferCachePhysReadsDir+ String Number of reads directly from disk,bypassing the buffer cache.
BufferCachePhysReadsDirLob+ String Number of lob reads directly fromdisk, bypassing the buffer cache.
Appendix C. Creating custom resource models using CIM classes 437

Table 46. Properties (continued)
Property Type Description
BufferCacheSessLogReads+ String Sum of “db block gets” plus“consistent gets”.
BufferWaitsPercentage+ String The percentage of buffer busy waits tological reads. This indicates that a userprocess attempted to acquire a bufferbut had to wait because the buffer washeld in an incompatible mode.
Calls+ String The work rate (recursive calls + usercalls) being run against the instance.Calls do any of the following: describe,parse, open, fetch, close, or execute.
CallsPerTransaction+ String The number of client requests madeper transaction.
ChangedBlockPercentage+ String The percentage of blocks that wereaccessed and updated by users. Thepercentage is the balance betweenqueries made and the DML within thedatabase application.
ClusterKeyRatio+ String The ratio of cluster key scan block getsto cluster key scans. If the ratio isgreater than one, the rows for a clusterkey are stored in multiple data blocks.
CompletedBackgroundCheckpoints+ String The number of times a database writer(DBWR) checkpoint is completed.
ConsistentChangePercentage+ String The percentage of consistent changes toconsistent gets.
ContinuedRowPercentage+ String The percentage of rows retrieved thatextend over more than one block,which is called chained rows. Thepercentage should be close to 0, exceptin applications that have long columns,or rows that are larger than one block(spanned rows), where chaining isunavoidable. The current number ofData Manipulation Language (DML)locks as a percentage of the maximumnumber of locks defined for theinstance. The instance limit is setthrough the DML_LOCKS parameter inthe init.ora file and represents themaximum number of locks that can beplaced on all tables by all users at anyone time. When the limit is reached,processing stops and an Oracle erroroccurs.
DatabaseStatus String The current status of the database.
DBWRCheckpoints+ String The number of database writer (DBWR)checkpoints requested by the server.
Deadlocks+ String The number of deadlocks detectedsince the instance was started.
438 IBM Tivoli Monitoring for Databases: Oracle: Reference Guide
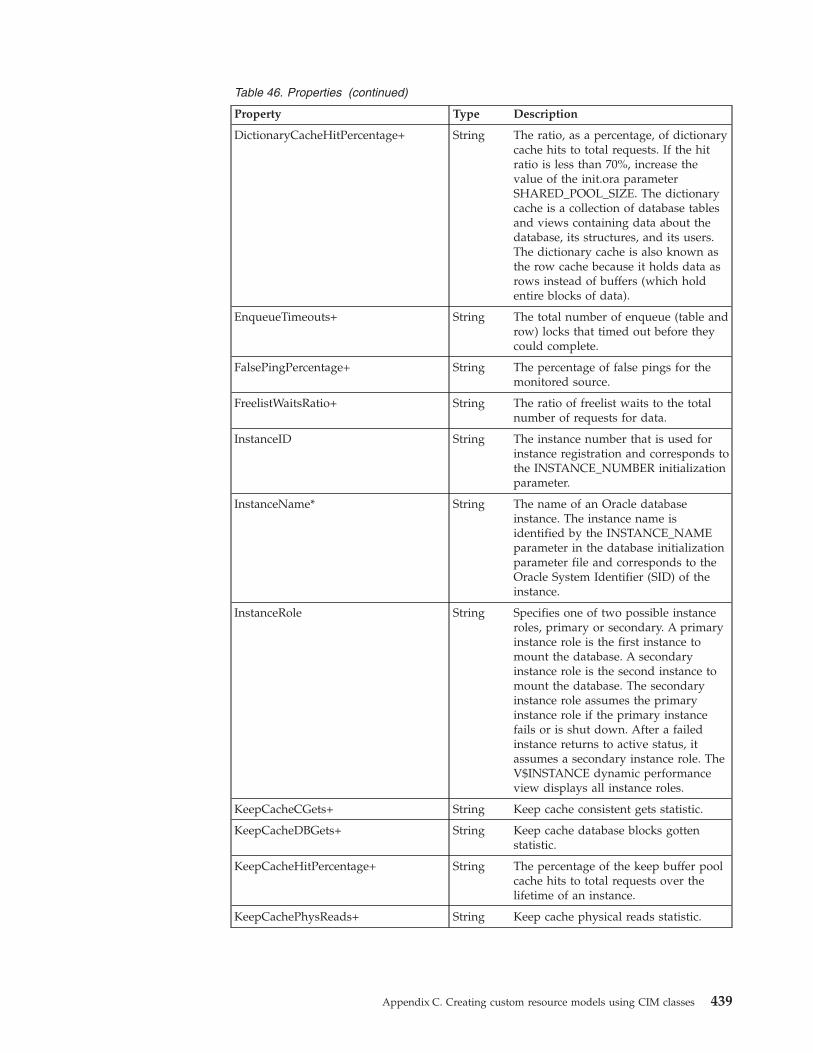
Table 46. Properties (continued)
Property Type Description
DictionaryCacheHitPercentage+ String The ratio, as a percentage, of dictionarycache hits to total requests. If the hitratio is less than 70%, increase thevalue of the init.ora parameterSHARED_POOL_SIZE. The dictionarycache is a collection of database tablesand views containing data about thedatabase, its structures, and its users.The dictionary cache is also known asthe row cache because it holds data asrows instead of buffers (which holdentire blocks of data).
EnqueueTimeouts+ String The total number of enqueue (table androw) locks that timed out before theycould complete.
FalsePingPercentage+ String The percentage of false pings for themonitored source.
FreelistWaitsRatio+ String The ratio of freelist waits to the totalnumber of requests for data.
InstanceID String The instance number that is used forinstance registration and corresponds tothe INSTANCE_NUMBER initializationparameter.
InstanceName* String The name of an Oracle databaseinstance. The instance name isidentified by the INSTANCE_NAMEparameter in the database initializationparameter file and corresponds to theOracle System Identifier (SID) of theinstance.
InstanceRole String Specifies one of two possible instanceroles, primary or secondary. A primaryinstance role is the first instance tomount the database. A secondaryinstance role is the second instance tomount the database. The secondaryinstance role assumes the primaryinstance role if the primary instancefails or is shut down. After a failedinstance returns to active status, itassumes a secondary instance role. TheV$INSTANCE dynamic performanceview displays all instance roles.
KeepCacheCGets+ String Keep cache consistent gets statistic.
KeepCacheDBGets+ String Keep cache database blocks gottenstatistic.
KeepCacheHitPercentage+ String The percentage of the keep buffer poolcache hits to total requests over thelifetime of an instance.
KeepCachePhysReads+ String Keep cache physical reads statistic.
Appendix C. Creating custom resource models using CIM classes 439
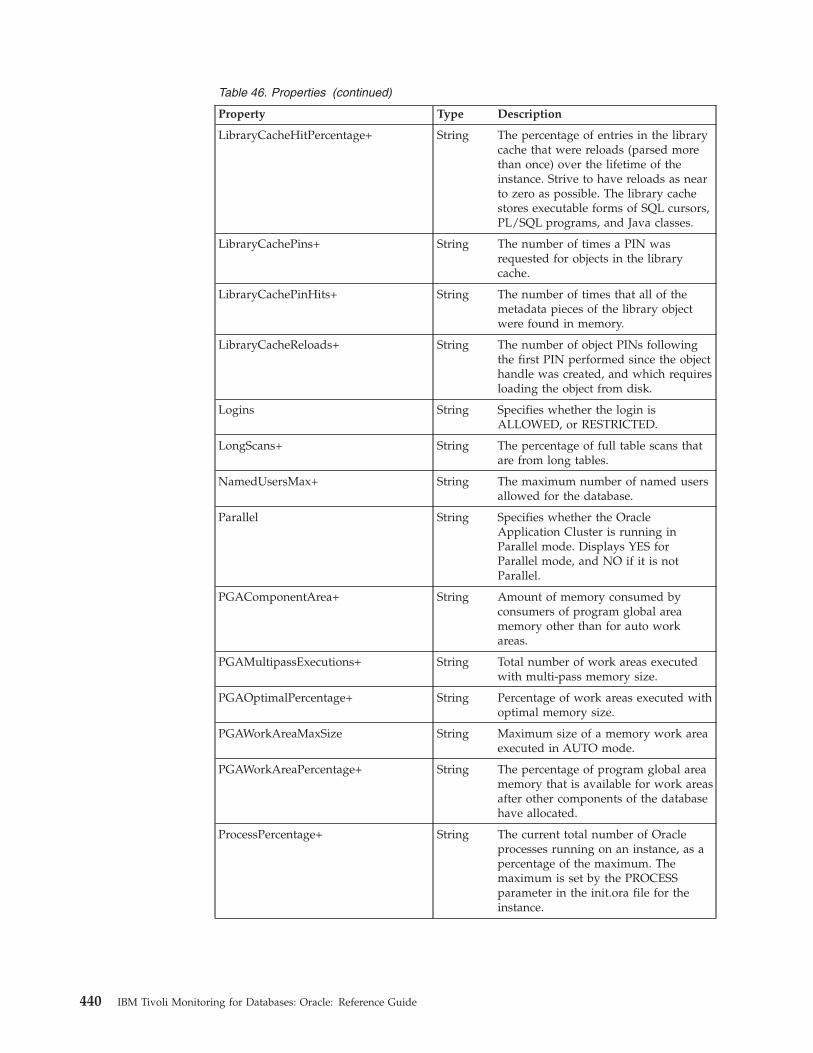
Table 46. Properties (continued)
Property Type Description
LibraryCacheHitPercentage+ String The percentage of entries in the librarycache that were reloads (parsed morethan once) over the lifetime of theinstance. Strive to have reloads as nearto zero as possible. The library cachestores executable forms of SQL cursors,PL/SQL programs, and Java classes.
LibraryCachePins+ String The number of times a PIN wasrequested for objects in the librarycache.
LibraryCachePinHits+ String The number of times that all of themetadata pieces of the library objectwere found in memory.
LibraryCacheReloads+ String The number of object PINs followingthe first PIN performed since the objecthandle was created, and which requiresloading the object from disk.
Logins String Specifies whether the login isALLOWED, or RESTRICTED.
LongScans+ String The percentage of full table scans thatare from long tables.
NamedUsersMax+ String The maximum number of named usersallowed for the database.
Parallel String Specifies whether the OracleApplication Cluster is running inParallel mode. Displays YES forParallel mode, and NO if it is notParallel.
PGAComponentArea+ String Amount of memory consumed byconsumers of program global areamemory other than for auto workareas.
PGAMultipassExecutions+ String Total number of work areas executedwith multi-pass memory size.
PGAOptimalPercentage+ String Percentage of work areas executed withoptimal memory size.
PGAWorkAreaMaxSize String Maximum size of a memory work areaexecuted in AUTO mode.
PGAWorkAreaPercentage+ String The percentage of program global areamemory that is available for work areasafter other components of the databasehave allocated.
ProcessPercentage+ String The current total number of Oracleprocesses running on an instance, as apercentage of the maximum. Themaximum is set by the PROCESSparameter in the init.ora file for theinstance.
440 IBM Tivoli Monitoring for Databases: Oracle: Reference Guide
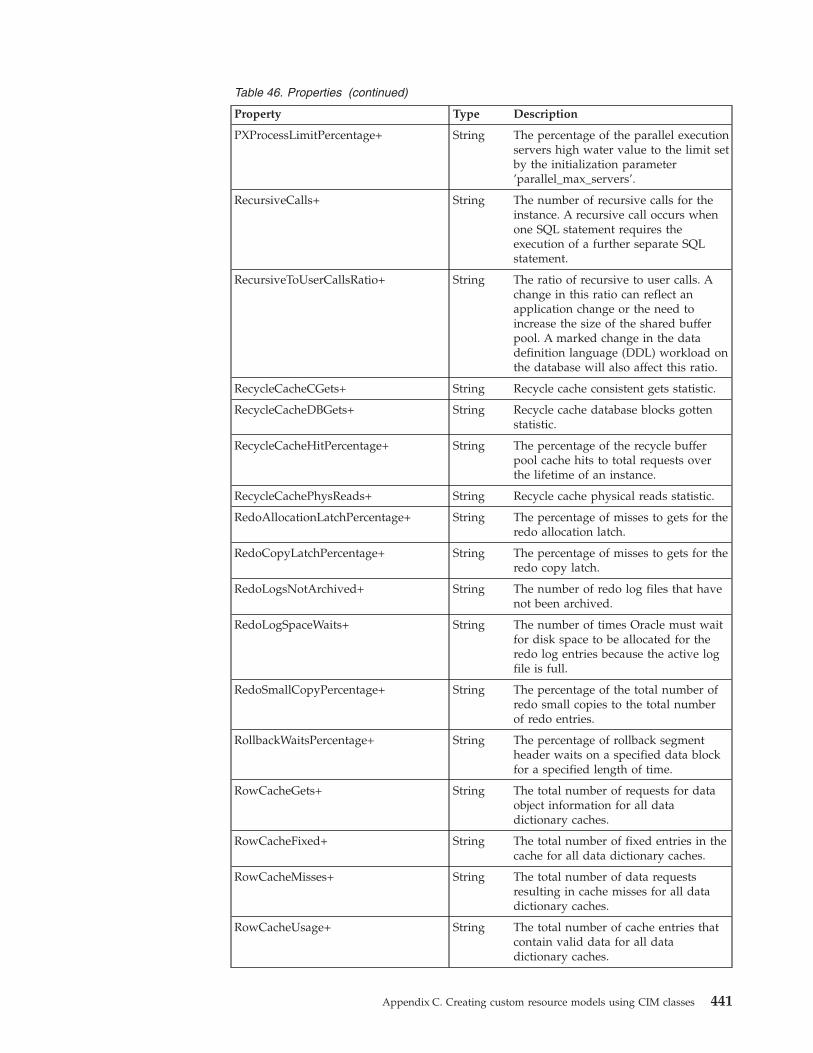
Table 46. Properties (continued)
Property Type Description
PXProcessLimitPercentage+ String The percentage of the parallel executionservers high water value to the limit setby the initialization parameter’parallel_max_servers’.
RecursiveCalls+ String The number of recursive calls for theinstance. A recursive call occurs whenone SQL statement requires theexecution of a further separate SQLstatement.
RecursiveToUserCallsRatio+ String The ratio of recursive to user calls. Achange in this ratio can reflect anapplication change or the need toincrease the size of the shared bufferpool. A marked change in the datadefinition language (DDL) workload onthe database will also affect this ratio.
RecycleCacheCGets+ String Recycle cache consistent gets statistic.
RecycleCacheDBGets+ String Recycle cache database blocks gottenstatistic.
RecycleCacheHitPercentage+ String The percentage of the recycle bufferpool cache hits to total requests overthe lifetime of an instance.
RecycleCachePhysReads+ String Recycle cache physical reads statistic.
RedoAllocationLatchPercentage+ String The percentage of misses to gets for theredo allocation latch.
RedoCopyLatchPercentage+ String The percentage of misses to gets for theredo copy latch.
RedoLogsNotArchived+ String The number of redo log files that havenot been archived.
RedoLogSpaceWaits+ String The number of times Oracle must waitfor disk space to be allocated for theredo log entries because the active logfile is full.
RedoSmallCopyPercentage+ String The percentage of the total number ofredo small copies to the total numberof redo entries.
RollbackWaitsPercentage+ String The percentage of rollback segmentheader waits on a specified data blockfor a specified length of time.
RowCacheGets+ String The total number of requests for dataobject information for all datadictionary caches.
RowCacheFixed+ String The total number of fixed entries in thecache for all data dictionary caches.
RowCacheMisses+ String The total number of data requestsresulting in cache misses for all datadictionary caches.
RowCacheUsage+ String The total number of cache entries thatcontain valid data for all datadictionary caches.
Appendix C. Creating custom resource models using CIM classes 441

Table 46. Properties (continued)
Property Type Description
RowSourcePercentage+ String The percentage of total rows retrievedfrom a full-table scan.
SessionPercentage+ String The percentage of current sessions tothe maximum allowed number ofsessions.
SessionsCurrent+ String The current number of concurrent usersessions.
SessionsHighwater+ String The highest number of concurrent usersessions since the instance started.
SessionsMax+ String The maximum number of concurrentuser sessions allowed for the instance.
SessionsWarning+ String The warning limit for concurrent usersessions for the instance.
ShortScans+ String The percentage of full table scans thatare from short tables.
ShutdownPending String Specifies whether the database is in aShutdown Pending state. Displays YESfor Shutdown Pending, and NO if it isnot in Shutdown Pending state.
SortOverflowPercentage+ String The percentage of sorts that are usingtemporary segments.
StartupTime String The time that the instance started.
Status String The current status of the instance aseither STARTED, MOUNTED, orOPEN.
v STARTED after startup, but nomount
v MOUNTED after startup, mount oralter database close
v OPEN after startup or after databaseopen
UserCalls+ String Identifies logins, parses, or executerequests being posed by the client sideapplications running under theinstance.
UserRollbackPercentage+ String A percentage of the number of timesusers manually issue the ROLLBACKstatement or an error occurs when auser attempts a transaction.
Version String The version number for RDBMS.
Note: * Denotes a CIM key property. + Denotes a CIM numeric property beingrepresented as a string. This value must be cast to a number in the resourcemodel using the Javascript Number object.
442 IBM Tivoli Monitoring for Databases: Oracle: Reference Guide
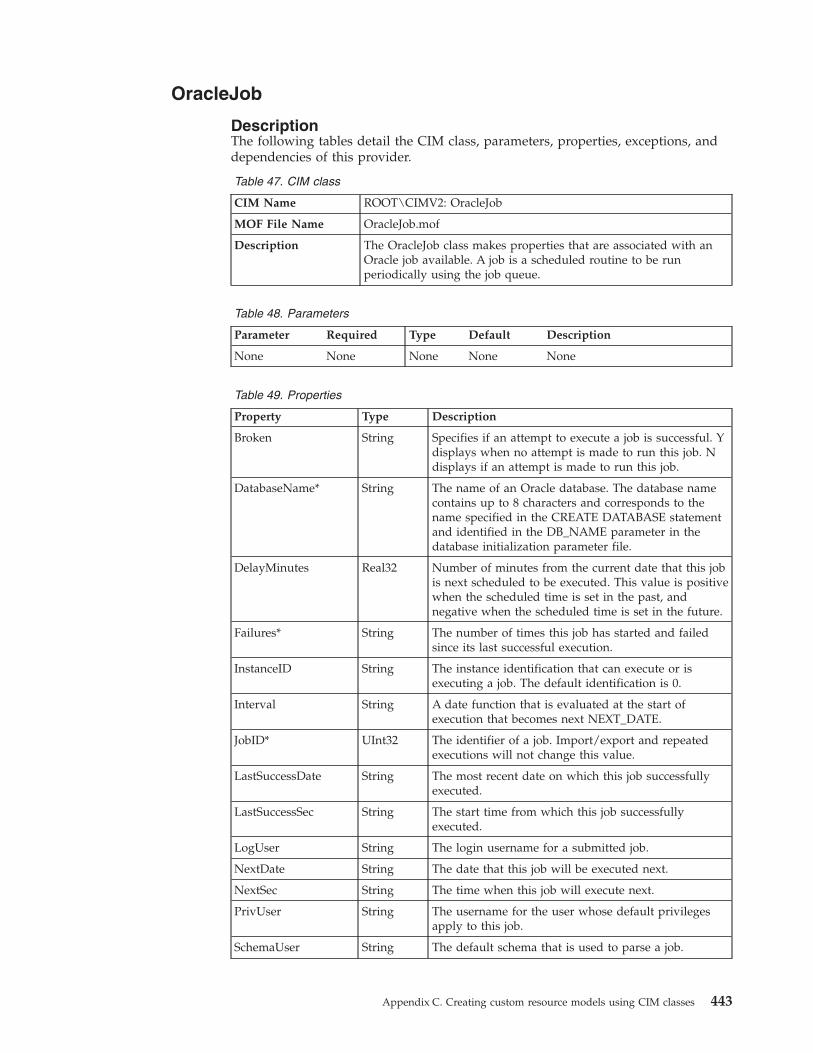
OracleJob
DescriptionThe following tables detail the CIM class, parameters, properties, exceptions, anddependencies of this provider.
Table 47. CIM class
CIM Name ROOT\CIMV2: OracleJob
MOF File Name OracleJob.mof
Description The OracleJob class makes properties that are associated with anOracle job available. A job is a scheduled routine to be runperiodically using the job queue.
Table 48. Parameters
Parameter Required Type Default Description
None None None None None
Table 49. Properties
Property Type Description
Broken String Specifies if an attempt to execute a job is successful. Ydisplays when no attempt is made to run this job. Ndisplays if an attempt is made to run this job.
DatabaseName* String The name of an Oracle database. The database namecontains up to 8 characters and corresponds to thename specified in the CREATE DATABASE statementand identified in the DB_NAME parameter in thedatabase initialization parameter file.
DelayMinutes Real32 Number of minutes from the current date that this jobis next scheduled to be executed. This value is positivewhen the scheduled time is set in the past, andnegative when the scheduled time is set in the future.
Failures* String The number of times this job has started and failedsince its last successful execution.
InstanceID String The instance identification that can execute or isexecuting a job. The default identification is 0.
Interval String A date function that is evaluated at the start ofexecution that becomes next NEXT_DATE.
JobID* UInt32 The identifier of a job. Import/export and repeatedexecutions will not change this value.
LastSuccessDate String The most recent date on which this job successfullyexecuted.
LastSuccessSec String The start time from which this job successfullyexecuted.
LogUser String The login username for a submitted job.
NextDate String The date that this job will be executed next.
NextSec String The time when this job will execute next.
PrivUser String The username for the user whose default privilegesapply to this job.
SchemaUser String The default schema that is used to parse a job.
Appendix C. Creating custom resource models using CIM classes 443

Table 49. Properties (continued)
Property Type Description
ThisDate String The date on which this job started executing. Displaysnull if the job is not executing.
ThisSec String The start time from which the most recent jobsuccessfully executed.
TotalTime+ String The total time, in seconds, the system spent executingthis job.
Note: * Denotes a CIM key property. + Denotes a CIM numeric property beingrepresented as a string. This value must be cast to a number in the resourcemodel using the Javascript Number object.
444 IBM Tivoli Monitoring for Databases: Oracle: Reference Guide

OracleListener
DescriptionThe following tables detail the CIM class, parameters, properties, exceptions, anddependencies of this provider.
Note: Resource models created referencing this CIM class must only be pushed toOracleInstanceManagers.
Table 50. CIM class
CIM Name ROOT\CIMV2: OracleListener
MOF File Name OracleListener.mof
Description The OracleListener class makes properties that are associated withone or more listener processes available. The listener is a processon the Oracle server that listens for and accepts connectionrequests from clients.
Note: There are no parameters for this provider.
Table 51. Properties
Property Type Description
ListenerName* String The label of the object where the resource modelrunning this provider was distributed.
ListenerState String The current state of the listener process: Available,Unavailable, Unknown, Becomes Available,Becomes Unavailable, or Becomes Unknown
Note: * Denotes a CIM key property. + Denotes a CIM numeric property beingrepresented as a string. This value must be cast to a number in the resourcemodel using the Javascript Number object.
Appendix C. Creating custom resource models using CIM classes 445

OracleLock
DescriptionThe following tables detail the CIM class, parameters, properties, exceptions, anddependencies of this provider.
Table 52. CIM class
CIM Name ROOT\CIMV2: OracleLock
MOF File Name OracleLock.mof
Description The OracleLock class makes properties that are associated with alock available. A lock is a mechanism used to control concurrentaccess to data and to ensure consistency and integrity.
Note: There are no parameters for this provider.
Table 53. Properties
Property Type Description
InstanceName* String The name of an Oracle database instance. Theinstance name is identified by theINSTANCE_NAME parameter in the databaseinitialization parameter file and corresponds to theOracle System Identifier (SID) of the instance.
LockCount+ String The number of LockType locks currently held.
LockType* String The type of user or system lock. Locks controlconcurrent access to data. Any process that isblocking other processes is likely holding one ofthese locks. User locks are obtained by userapplications. User type locks include: TM (DMLlock), TX (Row Transaction lock), ST (SpaceTransaction lock), UL (User defined lock). Systemtype locks can be found in the Oracledocumentation.
Note: * Denotes a CIM key property. + Denotes a CIM numeric property beingrepresented as a string. This value must be cast to a number in the resourcemodel using the Javascript Number object.
446 IBM Tivoli Monitoring for Databases: Oracle: Reference Guide

OracleLogEvent
DescriptionThe following tables detail the CIM class, parameters, properties, exceptions, anddependencies of this provider.
Table 54. CIM class
CIM Name ROOT\CIMV2: OracleLogEvent
MOF File Name OracleLogEvent.mof
Description The OracleLogEvent class makes properties that are associatedwith errors logged in the alert log available.
Table 55. Parameters
Parameter Required Type Default Description
CYCLE_TIME No NUMERIC_LIST None Should be set in theinit() method to theactual cycle time ofthe resource model.This value is used tooptimize cachebehavior within theclass.
MONITOR_ID No NUMERIC_LIST None Should be set in theinit() method of theresource model to asemi-random numberor millisecondtimestamp, e.g. usingthe Date.getTime()method. This value isused to distinguishbetween multipleinstances of the sameresource modelwhich access thesame Oracle log file.Properly setting thisvalue will ensurethat each of theseresource modelsreceives all relevantentries in the log file.If this value is notset, only one of theseresource models willreceive any givenentry in the log file.
Table 56. Properties
Property Type Description
FileName* String The name of the file to which the Oracle database islogging.
Appendix C. Creating custom resource models using CIM classes 447

Table 56. Properties (continued)
Property Type Description
InstanceName* String The name of an Oracle database instance. The instancename is identified by the INSTANCE_NAME parameter inthe database initialization parameter file and correspondsto the Oracle System Identifier (SID) of the instance.
Offset* UInt32 The offset (in bytes) from the beginning of the log filewhere the log event starts.
Severity Uint32 The severity (as an integer) of the log event. The severitynumber is determined by the number assigned to thepattern it matches in the regular expression file.
Text String The text of the log event.
Note: * Denotes a CIM key property. + Denotes a CIM numeric property beingrepresented as a string. This value must be cast to a number in the resourcemodel using the Javascript Number object.
448 IBM Tivoli Monitoring for Databases: Oracle: Reference Guide

OracleNetwork
DescriptionThe following tables detail the CIM class, parameters, properties, exceptions, anddependencies of this provider.
Table 57. CIM class
CIM Name ROOT\CIMV2: OracleNetwork
MOF File Name OracleNetwork.mof
Description The OracleNetwork class makes properties that are associatedwith an Oracle instance available.
Note: There are no parameters for this provider.
Table 58. Properties
Property Type Description
InstanceName* String The name of an Oracle databaseinstance. The instance name isidentified by the INSTANCE_NAMEparameter in the database initializationparameter file and corresponds to theOracle System Identifier (SID) of theinstance.
SharedServerMaxConnections+ String The largest number of virtual circuits inuse at one time since the instancestarted. Raise the value of CIRCUITS ifthis number reaches the value set forthe CIRCUITS initialization parameter.
SharedServerMaxSessions+ String The largest number of shared serversessions in use at one time since theinstance started. Raise the value ofSHARED_SERVER_SESSIONS if thisnumber reaches the value set for theSHARED_SERVER_SESSIONSinitialization parameter.
SharedServerProcessPercentage+ String The current number of shared-serverprocesses as a percentage of theinstance limit.
SharedServersHighwater+ String The highest number of servers runningat the same time since the instancestarted. Raise the value ofSHARED_SERVERS if this numberreaches the value set for theMAX_SHARED_SERVERS initializationparameter.
SharedServersStarted+ String The total number of shared serversstarted since the instance started. Thisnumber does not include the sharedservers started during startup.
SharedServersTerminated+ String The total number of shared servers thatOracle stopped since the instancestarted.
Appendix C. Creating custom resource models using CIM classes 449
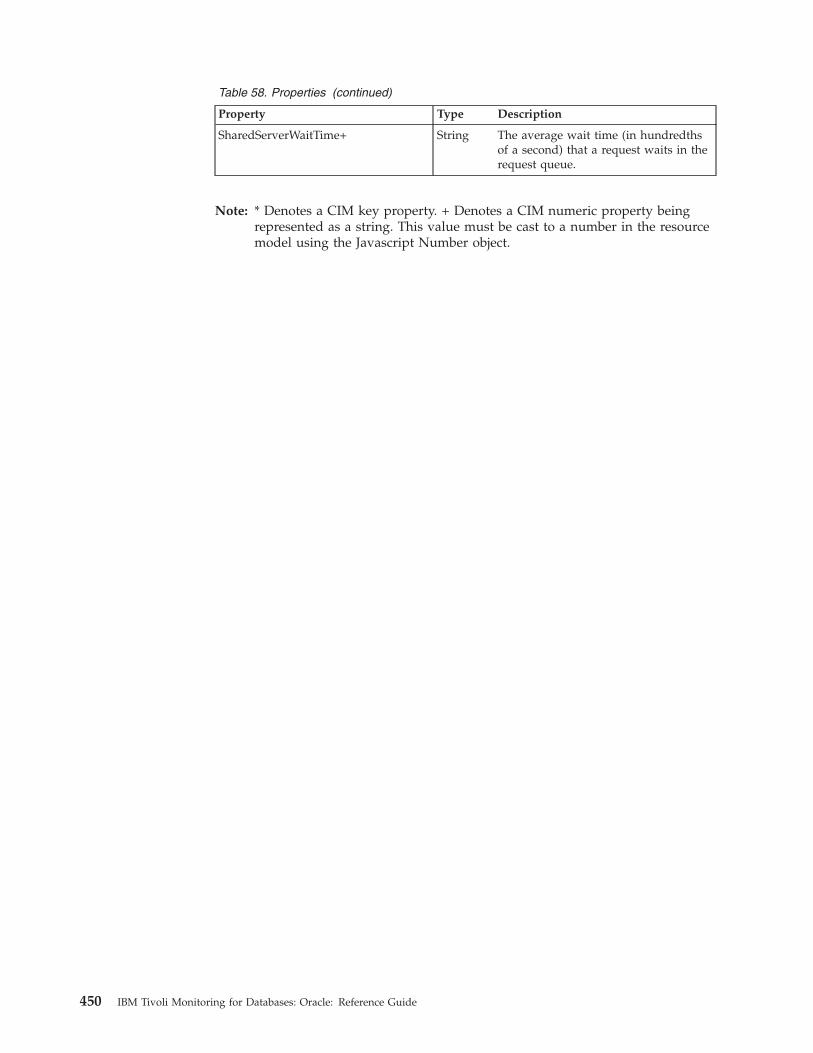
Table 58. Properties (continued)
Property Type Description
SharedServerWaitTime+ String The average wait time (in hundredthsof a second) that a request waits in therequest queue.
Note: * Denotes a CIM key property. + Denotes a CIM numeric property beingrepresented as a string. This value must be cast to a number in the resourcemodel using the Javascript Number object.
450 IBM Tivoli Monitoring for Databases: Oracle: Reference Guide

OracleObject
DescriptionThe following tables detail the CIM class, parameters, properties, exceptions, anddependencies of this provider.
Table 59. CIM class
CIM Name ROOT\CIMV2: OracleObject
MOF File Name OracleObject.mof
Description The OracleObject class makes properties that are associated withan object in the database available.
Note: There are no parameters for this provider.
Table 60. Properties
Property Type Description
Created String The timestamp that the object was created.
DatabaseName* String The name of an Oracle database. The database namecontains up to 8 characters and corresponds to the namespecified in the CREATE DATABASE statement andidentified in the DB_NAME parameter in the databaseinitialization parameter file.
LastDDLTime String The timestamp for the last modification of the object as aresult from a DDL command (which includes grants andrevokes).
ObjectID String The dictionary object number for the object.
ObjectName* String The name of the object.
ObjectOwner* String The username of the object owner.
ObjectType* String The type of the object, such as TABLE, or INDEX.
Status String The current status of the object, such as VALID,INVALID, or N/A.
Note: * Denotes a CIM key property. + Denotes a CIM numeric property beingrepresented as a string. This value must be cast to a number in the resourcemodel using the Javascript Number object.
Appendix C. Creating custom resource models using CIM classes 451

OracleParameter
DescriptionThe following tables detail the CIM class, parameters, properties, exceptions, anddependencies of this provider.
Table 61. CIM class
CIM Name ROOT\CIMV2: OracleParameter
MOF File Name OracleParameter.mof
Description The OracleParameter class makes properties that are associatedwith an initialization parameter available. Initialization parametersare value and configuration settings to be used on databasestartup.
Note: There are no parameters for this provider.
Table 62. Properties
Property Type Description
Description String A descriptive text comment about the parameter.
InstanceName* String The name of an Oracle database instance. The instancename is identified by the INSTANCE_NAME parameterin the database initialization parameter file andcorresponds to the Oracle System Identifier (SID) of theinstance.
IsDefault String Specifies whether the user specifies the parameter as aninitialization, or default, parameter.
ParameterName* String The name of the parameter. Upper or lower cases infilenames is significant only if case is significant on thehost operating system.
Value String The current value for a parameter modified within thesession, otherwise, is the instance-wide parameter value.
Note: * Denotes a CIM key property. + Denotes a CIM numeric property beingrepresented as a string. This value must be cast to a number in the resourcemodel using the Javascript Number object.
452 IBM Tivoli Monitoring for Databases: Oracle: Reference Guide
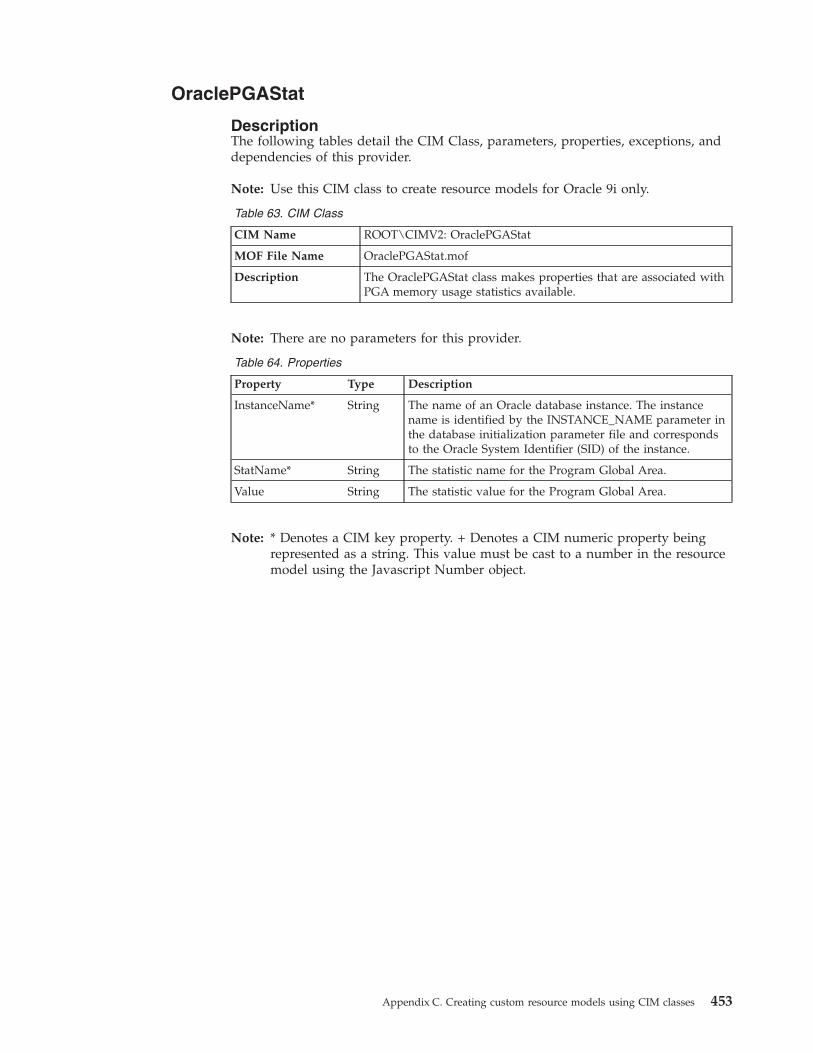
OraclePGAStat
DescriptionThe following tables detail the CIM Class, parameters, properties, exceptions, anddependencies of this provider.
Note: Use this CIM class to create resource models for Oracle 9i only.
Table 63. CIM Class
CIM Name ROOT\CIMV2: OraclePGAStat
MOF File Name OraclePGAStat.mof
Description The OraclePGAStat class makes properties that are associated withPGA memory usage statistics available.
Note: There are no parameters for this provider.
Table 64. Properties
Property Type Description
InstanceName* String The name of an Oracle database instance. The instancename is identified by the INSTANCE_NAME parameter inthe database initialization parameter file and correspondsto the Oracle System Identifier (SID) of the instance.
StatName* String The statistic name for the Program Global Area.
Value String The statistic value for the Program Global Area.
Note: * Denotes a CIM key property. + Denotes a CIM numeric property beingrepresented as a string. This value must be cast to a number in the resourcemodel using the Javascript Number object.
Appendix C. Creating custom resource models using CIM classes 453

OraclePQSlave
DescriptionThe following tables detail the CIM class, parameters, properties, exceptions, anddependencies of this provider.
Table 65. CIM class
CIM Name ROOT\CIMV2: OraclePQSlave
MOF File Name OraclePQSlave.mof
Description The OraclePQSlave class makes properties that are associated withsystem statistics for parallel query slave processes available.
Note: There are no parameters for this provider.
Table 66. Properties
Property Type Description
BusyTimeTotal+ String The total amount of time spent busy whileprocessing statements in the current session.
CPUSecsTotal+ String The total amount of CPU time spent on the currentsession.
IdleTimeTotal+ String The total amount of time spent idle while processingstatements in the current session.
InstanceName* String The name of an Oracle database instance. Theinstance name is identified by theINSTANCE_NAME parameter in the databaseinitialization parameter file and corresponds to theOracle System Identifier (SID) of the instance.
Sessions+ String The number of sessions that have used this parallelexecution server.
SlaveName* String The name of the parallel execution server.
Status String The current status of the parallel execution server.Status is either BUSY or IDLE.
Note: * Denotes a CIM key property. + Denotes a CIM numeric property beingrepresented as a string. This value must be cast to a number in the resourcemodel using the Javascript Number object.
454 IBM Tivoli Monitoring for Databases: Oracle: Reference Guide

OraclePQSysStat
DescriptionThe following tables detail the CIM class, parameters, properties, exceptions, anddependencies of this provider.
Table 67. CIM class
CIM Name ROOT\CIMV2: OraclePQSysStat
MOF File Name OraclePQSysStat.mof
Description The OraclePQSysStat class makes properties that are associatedwith parallel query system statistics available.
Note: There are no parameters for this provider.
Table 68. Properties
Property Type Description
InstanceName* String The name of an Oracle database instance. The instancename is identified by the INSTANCE_NAME parameter inthe database initialization parameter file and corresponds tothe Oracle System Identifier (SID) of the instance.
StatName* String Identifies the name of the statistic. Statistic names for aninstance include:
v Servers Busy - number of servers that are currently busy
v Servers Idle - number of servers that are currently idle
v Servers Highwater - number of active servers that havepartaken in more than or at least one operation
v Server Sessions - number of operations executed on allservers
v Servers Started - number of servers started
v Servers Shutdown - number of servers shutdown
v Servers Cleaned Up - number of servers cleaned up dueto process death
v Queries Initiated – number of parallel queries initiated
v DML Initiated - number of parallel DML operations thatwere initiated
v DFO Trees - number of DFO trees executed
v Local Msgs Sent - number of local (intra-instance)messages sent
v Distr Msgs Sent - number of remote (inter-instance)messages sent
v Local Msgs Recv’d - number of remote (inter-instance)messages received
v Distr Msgs Recv’d - number of remote (inter-instance)messages received
Value String The current value of the statistic.
Note: * Denotes a CIM key property. + Denotes a CIM numeric property beingrepresented as a string. This value must be cast to a number in the resourcemodel using the Javascript Number object.
Appendix C. Creating custom resource models using CIM classes 455

OracleProcess
DescriptionThe following tables detail the CIM class, parameters, properties, exceptions, anddependencies of this provider.
Table 69. CIM class
CIM Name ROOT\CIMV2: OracleProcess
MOF File Name OracleProcess.mof
Description The OracleProcess class makes properties that are associated withan Oracle process, including server and background processes,available.
Note: There are no parameters for this provider.
Table 70. Properties
Property Type Description
Address String The location of the process state object.
Background String One of the following process types: 1 for a backgroundprocess, or NULL for a normal process.
Description String A description of the process.
InstanceName* String The name of an Oracle database instance. The instancename is identified by the INSTANCE_NAME parameter inthe database initialization parameter file and correspondsto the Oracle System Identifier (SID) of the instance.
ProcessID* String The Oracle process identifier.
ProcessName String The name of a process.
Program String The current program in progress.
OSProcessID String The unique integer used by the operating system kernel toidentify a process.
Username String The name of the user as recognized by the Oracle serverand other users so that the user can connect to and accessobjects in a database. Each user name is associated with apassword that also must be entered to connect to an Oracledatabase.
Note: * Denotes a CIM key property. + Denotes a CIM numeric property beingrepresented as a string. This value must be cast to a number in the resourcemodel using the Javascript Number object.
456 IBM Tivoli Monitoring for Databases: Oracle: Reference Guide
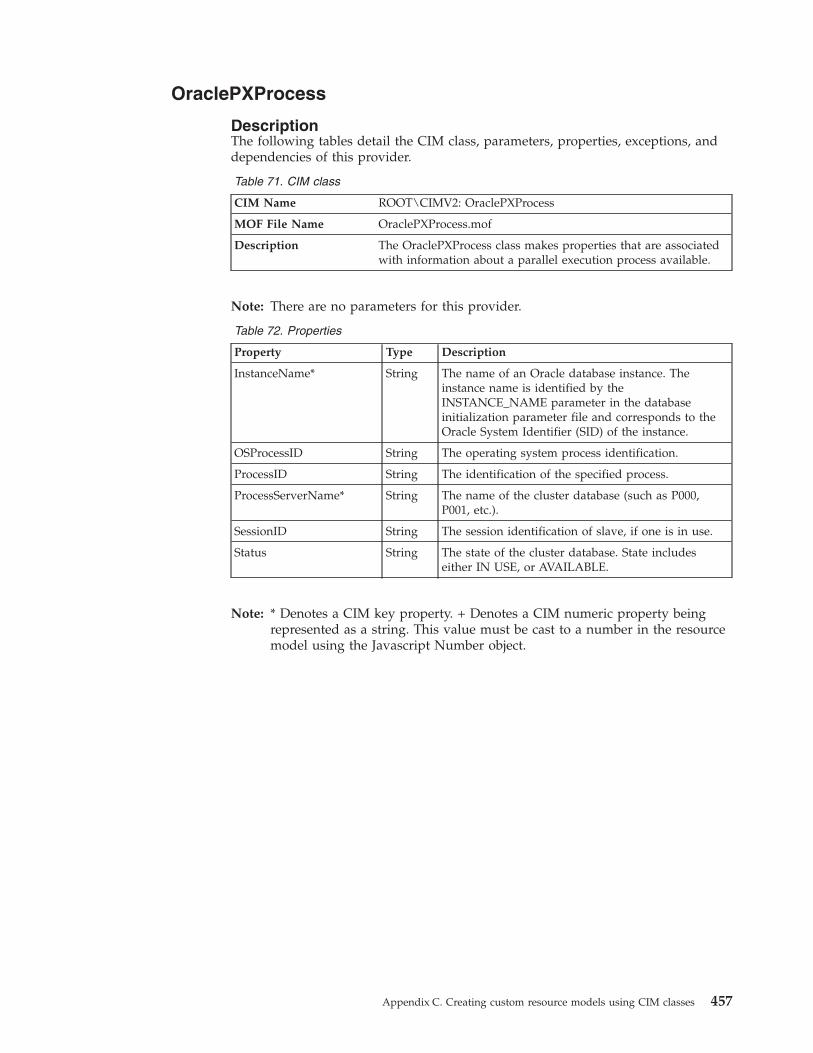
OraclePXProcess
DescriptionThe following tables detail the CIM class, parameters, properties, exceptions, anddependencies of this provider.
Table 71. CIM class
CIM Name ROOT\CIMV2: OraclePXProcess
MOF File Name OraclePXProcess.mof
Description The OraclePXProcess class makes properties that are associatedwith information about a parallel execution process available.
Note: There are no parameters for this provider.
Table 72. Properties
Property Type Description
InstanceName* String The name of an Oracle database instance. Theinstance name is identified by theINSTANCE_NAME parameter in the databaseinitialization parameter file and corresponds to theOracle System Identifier (SID) of the instance.
OSProcessID String The operating system process identification.
ProcessID String The identification of the specified process.
ProcessServerName* String The name of the cluster database (such as P000,P001, etc.).
SessionID String The session identification of slave, if one is in use.
Status String The state of the cluster database. State includeseither IN USE, or AVAILABLE.
Note: * Denotes a CIM key property. + Denotes a CIM numeric property beingrepresented as a string. This value must be cast to a number in the resourcemodel using the Javascript Number object.
Appendix C. Creating custom resource models using CIM classes 457

OraclePXProcessSysStat
DescriptionThe following tables detail the CIM class, parameters, properties, exceptions, anddependencies of this provider.
Table 73. CIM class
CIM Name ROOT\CIMV2: OraclePXProcessSysStat
MOF File Name OraclePXProcessSysStat.mof
Description The OraclePXProcessSysStat class makes properties that areassociated with system statistics related to parallel executionprocesses available.
Note: There are no parameters for this provider.
Table 74. Properties
Property Type Description
InstanceName* String The name of an Oracle database instance. The instancename is identified by the INSTANCE_NAME parameterin the database initialization parameter file andcorresponds to the Oracle System Identifier (SID) of theinstance.
458 IBM Tivoli Monitoring for Databases: Oracle: Reference Guide

Table 74. Properties (continued)
Property Type Description
StatName* String Identifies the name of the specified statistic. Statisticnames include:
v Servers In Use - the number of PX servers that arecurrently performing parallel operations
v Servers Available - the number of PX servers that areavailable to perform parallel operations
v Servers Started - the number of times the system hascreated a PX server process
v Server Shutdown - The number of times a PX serverprocess shutdown. PX server processes shutdown if notused recently. The length of time it remains “Available”is set by the initialization parameterPARALLEL_SERVER_IDLE_TIME. Consider increasingthis parameter, if needed to improve performance byavoiding the latency of PX server process creation.
v Servers HWM - the maximum number of concurrentPX server processes. Consider increasing thePARALLEL_MAX_SERVERS if this number equals theinitialization parameter value. This allows an increasein throughput, especially for systems under-utilizedwith a large “Parallel operations downgraded to serial”V$SYSSTAT statistic.
v Servers Cleaned Up - the number of times PMONcleaned up a PX server. Should only occur duringabnormal termination of a parallel operation.
v Sessions - the number of sessions created by PX servers
v Memory Chunks Allocs - the number of large memorychunks assigned by PX servers
v Memory Chunks Freed - the number of large memorychunks that are free
v Memory Chunks Current - the number of largememory chunks that are being used
v Memory Chunks HWM - the maximum number ofconcurrently allocated memory chunks
v Buffers allocated - the number of times a messagebuffer is allocated
v Buffers freed - the number of times a message buffer isfreed
v Buffers Current - the current number of messagebuffers being used
v Buffers HWM - the maximum number of concurrentlyallocated message buffers
Value String The value of the specified statistic.
Note: * Denotes a CIM key property. + Denotes a CIM numeric property beingrepresented as a string. This value must be cast to a number in the resourcemodel using the Javascript Number object.
Appendix C. Creating custom resource models using CIM classes 459

OraclePXSession
DescriptionThe following tables detail the CIM class, parameters, properties, exceptions, anddependencies of this provider.
Table 75. CIM class
CIM Name ROOT\CIMV2: OraclePXSession
MOF File Name OraclePXSession.mof
Description The OraclePXSession class makes properties that are associatedwith information about a session running parallel executionavailable.
Note: There are no parameters for this provider.
Table 76. Properties
Property Type Description
Degree+ String The degree of parallelism used by the server set.
InstanceName* String The name of an Oracle database instance. The instancename is identified by the INSTANCE_NAME parameterin the database initialization parameter file andcorresponds to the Oracle System Identifier (SID) of theinstance.
QCSessionID+ String The session identifier for the parallel coordinator.
QCInstanceID+ String The instance number on which the parallel coordinatorruns.
RequiredDegree+ String The degree of parallelism requested by a user when astatement was issued. This value is prior to anyresource, multi-user, or load balancing reductions.
ServerGroup+ String The logical group of servers to which the clusterdatabase process belongs.
ServerNumber+ String The logical number of the cluster database process thatis within a server set.
ServerSet+ String The logical set of servers to which the cluster databaseprocess belongs. Single server groups have two serversets at the most.
SessionID*+ String The session identifier.
Note: * Denotes a CIM key property. + Denotes a CIM numeric property beingrepresented as a string. This value must be cast to a number in the resourcemodel using the Javascript Number object.
460 IBM Tivoli Monitoring for Databases: Oracle: Reference Guide

OracleQueue
DescriptionThe following tables detail the CIM class, parameters, properties, exceptions, anddependencies of this provider.
Table 77. CIM class
CIM Name ROOT\CIMV2: OracleQueue
MOF File Name OracleQueue.mof
Description The OracleQueue class makes properties that are associated with adatabase queue available.
Note: There are no parameters for this provider.
Table 78. Properties
Property Type Description
AvgReadyWait+ String The average wait time of all READY messages in thequeue.
DatabaseName* String The name of an Oracle database. The database namecontains up to 8 characters and corresponds to thename specified in the CREATE DATABASEstatement and identified in the DB_NAMEparameter in the database initialization parameterfile.
Expired+ String The number of queue messages in the EXPIREDstate.
QueueName* String The name of the specified queue.
QueueOwner* String The username of the queue owner.
QueueType String The type of the queue.
Ready+ String The number of queue messages in the READY state.
TotalReadyWait+ String The total wait time for all READY messages in thequeue.
Waiting+ String The number of queue messages in the stateWAITING state.
Note: * Denotes a CIM key property. + Denotes a CIM numeric property beingrepresented as a string. This value must be cast to a number in the resourcemodel using the Javascript Number object.
Appendix C. Creating custom resource models using CIM classes 461

OracleQueueSchedule
DescriptionThe following tables detail the CIM class, parameters, properties, exceptions, anddependencies of this provider.
Table 79. CIM class
CIM Name ROOT\CIMV2: OracleQueueSchedule
MOF File Name OracleQueueSchedule.mof
Description The OracleQueueSchedule class makes properties that areassociated with a database queue schedule available.
Note: There are no parameters for this provider.
Table 80. Properties
Property Type Description
DatabaseName* String The name of an Oracle database. The database namecontains up to 8 characters and corresponds to the namespecified in the CREATE DATABASE statement andidentified in the DB_NAME parameter in the databaseinitialization parameter file.
Destination* String The destination name for the queue. This name iscurrently limited to be a DBLINK name.
Failures+ String The number of times the execution failed. If this numberis 16, the schedule will be disabled.
LastErrorDate String The date of the most recent unsuccessful execution.
LastErrorMsg String The error number and error message text for the mostrecent unsuccessful execution.
LastErrorTime String The time of the most recent unsuccessful execution.
LastRunDate String The date on the last successful execution.
LastRunTime String The time of the last successful execution. Time displaysin an HH:MI:SS format.
NextRunDate String The date when the next schedule will start.
NextRunTime String The time of day when the next schedule will start. Timedisplays in an HH:MI:SS format.
PropagationRate+ String The propagation rate for the specified schedule. Thepropagation rate is the total number of bytes propagatedin this schedule divided by the total time, in seconds,spent by the system in executing this schedule.
QueueName* String The name of the specified queue.
QueueOwner* String The username of the queue owner.
ScheduleDisabled String Specifies if queue scheduling is enabled or disabled. Nappears if scheduling is enabled, and Y if disabled.Disabled scheduling will not be executed.
StartDate String The date to start propagation. Date displays in thedefault date format.
StartTime String The time of day to start propagation. Time displays in anHH:MI:SS format.
462 IBM Tivoli Monitoring for Databases: Oracle: Reference Guide

Note: * Denotes a CIM key property. + Denotes a CIM numeric property beingrepresented as a string. This value must be cast to a number in the resourcemodel using the Javascript Number object.
Appendix C. Creating custom resource models using CIM classes 463

OracleRedoLog
DescriptionThe following tables detail the CIM class, parameters, properties, exceptions, anddependencies of this provider.
Table 81. CIM class
CIM Name ROOT\CIMV2: OracleRedoLog
MOF File Name OracleRedoLog.mof
Description The OracleRedoLog class makes properties that are associated withan online redo log available. An online redo log is a file thatprotects altered database data in memory that has not been writtento the datafiles.
Note: There are no parameters for this provider.
Table 82. Properties
Property Type Description
InstanceName* String The name of an Oracle database instance. The instancename is identified by the INSTANCE_NAME parameterin the database initialization parameter file andcorresponds to the Oracle System Identifier (SID) of theinstance.
GroupID* UInt32 The redo log group identifier number.
Member* String The name of the redo log member.
Status String The status of this log member. Status includes: INVALID(inaccessible file), STALE (incomplete file contents),DELETED (file is no longer used), or blank (file is in use).
Note: * Denotes a CIM key property. + Denotes a CIM numeric property beingrepresented as a string. This value must be cast to a number in the resourcemodel using the Javascript Number object.
464 IBM Tivoli Monitoring for Databases: Oracle: Reference Guide

OracleRedoLogGroup
DescriptionThe following tables detail the CIM class, parameters, properties, exceptions, anddependencies of this provider.
Table 83. CIM class
CIM Name ROOT\CIMV2: OracleRedoLogGroup
MOF File Name OracleRedoLogGroup.mof
Description The OracleRedoLogGroup class makes properties that areassociated with a redo log group available. A redo log group is agrouping of redo logs for the purpose of multiplexing redo logsand safeguarding against corruption of one or more logs.
Note: There are no parameters for this provider.
Table 84. Properties
Property Type Description
Archived String The archive status as one of the following: YES ifarchiving is enabled, NO if archiving is disabled.
Bytes Uint32 The byte size of the log.
FirstChangeID+ String The lowest system change number in the log. Everycommitted transaction is assigned a unique systemchange number.
FirstTime String The time of the first system change number in thelog. Every committed transaction is assigned aunique system change number.
GroupID*+ String The Log group number.
InstanceName* String The name of an Oracle database instance. Theinstance name is identified by theINSTANCE_NAME parameter in the databaseinitialization parameter file and corresponds to theOracle System Identifier (SID) of the instance.
Members+ String The number of members in the selected log group.
Status String The current status for the monitored source. LogGroup status includes Unused, Current, Active,Clearing, Clearing_Current, and Inactive.
ThreadID*+ String The Log thread number.
Note: * Denotes a CIM key property. + Denotes a CIM numeric property beingrepresented as a string. This value must be cast to a number in the resourcemodel using the Javascript Number object.
Appendix C. Creating custom resource models using CIM classes 465

OracleRollbackSegment
DescriptionThe following tables detail the CIM class, parameters, properties, exceptions, anddependencies of this provider.
Table 85. CIM class
CIM Name ROOT\CIMV2: OracleRollbackSegment
MOF File Name OracleRollbackSegment.mof
Description The OracleRollbackSegment class makes properties that areassociated with a rollback segment available. A rollback segment isan Oracle database structure that stores undo information fortransactions.
Note: There are no parameters for this provider.
Table 86. Properties
Property Type Description
AverageActive+ String The average number of bytes in active extents in therollback segment, averaged over time.
AverageShrink+ String The average number of bytes that are freed during ashrink for a rollback segment.
DatabaseName* UInt32 The name of an Oracle database instance. The instancename is identified by the INSTANCE_NAMEparameter in the database initialization parameter fileand corresponds to the Oracle System Identifier (SID)of the instance.
Extends+ String The number of times that a rollback segment size isextended.
Extents+ String The number of extents in the rollback segment.
Gets+ String The number of header requests in a rollback segment.
InitialExtent+ String The byte size assigned to the first extent of a segmentat the time a segment is created. Oracle rounds extentsizes to multiples of 5 blocks if the size requested isgreater than 5 blocks.
InstanceID String The identification of the rollback segment owning theOracle Real Application Cluster instance number.
MaxExtents+ String The maximum number of extents allowed for thespecified segment.
NextExtent+ String The byte size assigned to the next extent allocated to asegment.
SegmentID+ String The identification number of the rollback segment.
SegmentName* String The name of the rollback segment.
SegmentOwner* String The username of the segment owner.
Shrinks+ String The number of times the size of a rollback segmentdecreases in order to stay at the optimal size.
Status String One of the following status options for the rollbacksegment: Online, Offline, Partly Available, Invalid, orPending Offline
466 IBM Tivoli Monitoring for Databases: Oracle: Reference Guide
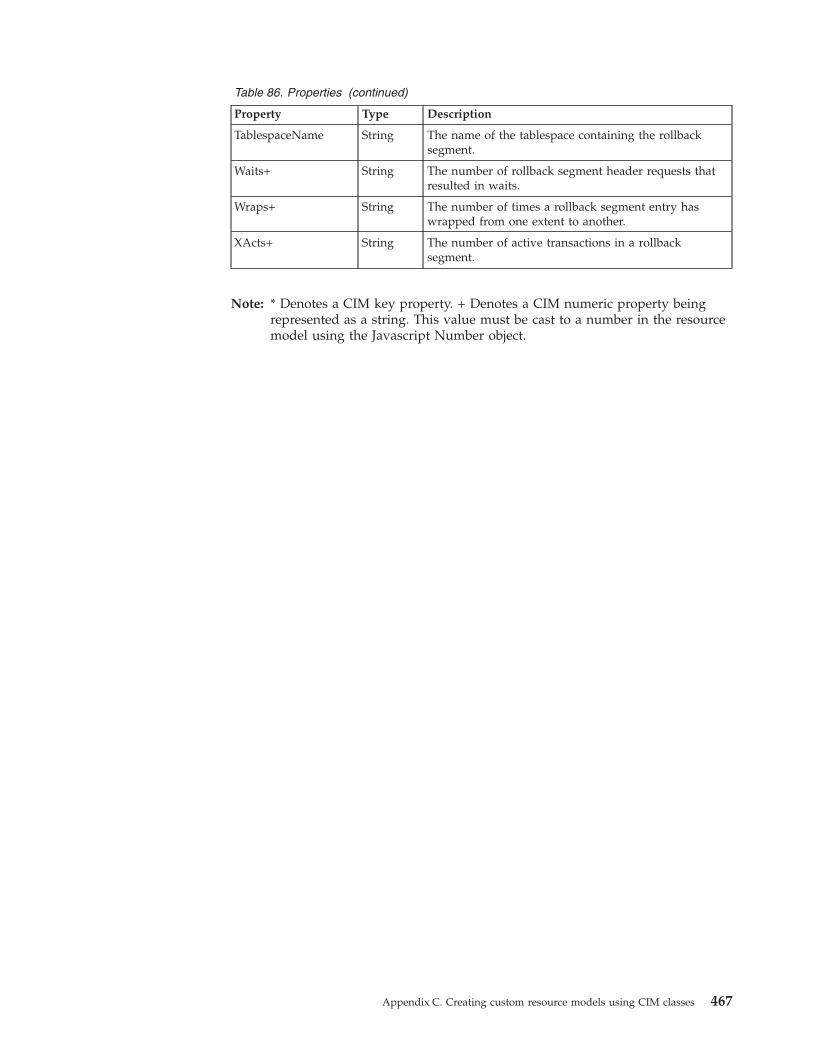
Table 86. Properties (continued)
Property Type Description
TablespaceName String The name of the tablespace containing the rollbacksegment.
Waits+ String The number of rollback segment header requests thatresulted in waits.
Wraps+ String The number of times a rollback segment entry haswrapped from one extent to another.
XActs+ String The number of active transactions in a rollbacksegment.
Note: * Denotes a CIM key property. + Denotes a CIM numeric property beingrepresented as a string. This value must be cast to a number in the resourcemodel using the Javascript Number object.
Appendix C. Creating custom resource models using CIM classes 467

OracleSegment
DescriptionThe following tables detail the CIM class, parameters, properties, exceptions, anddependencies of this provider.
Table 87. CIM class
CIM Name ROOT\CIMV2: OracleSegment
MOF File Name OracleSegment.mof
Description The OracleSegment class makes properties that are associated witha segment available. A segment is a set of extents that are allocatedfor a specific data structure and stored in the same Tablespace.
Note: There are no parameters for this provider.
Table 88. Properties
Property Type Description
CurrentBlocks+ String The number of blocks currently allocated to thespecified segment.
CurrentBytes+ String The number of bytes currently allocated to thespecified segment.
CurrentExtents+ String The number of extents currently allocated to thespecified segment.
DatabaseName* String The name of an Oracle database. The database namecontains up to 8 characters and corresponds to thename specified in the CREATE DATABASE statementand identified in the DB_NAME parameter in thedatabase initialization parameter file.
DatafileName String The name of the database file.
MaxExtents+ String The maximum number of extents allowed for thespecified segment.
NextExtent+ String The byte size assigned to the next extent allocated to asegment.
SegmentName* String The name of the segment.
SegmentOwner* String The username of the segment owner.
SegmentType* String The type of the segment. Segment types include: indexpartition, table partition, table, cluster, index, rollback,deferred rollback, temporary, cache, lobsegment, andlobindex.
TablespaceName* String The name the tablespace in which this segment iscontained. The name of the redo log member.
Note: * Denotes a CIM key property. + Denotes a CIM numeric property beingrepresented as a string. This value must be cast to a number in the resourcemodel using the Javascript Number object.
468 IBM Tivoli Monitoring for Databases: Oracle: Reference Guide

OracleSequence
DescriptionThe following tables detail the CIM class, parameters, properties, exceptions, anddependencies of this provider.
Table 89. CIM class
CIM Name ROOT\CIMV2: OracleSequence
MOF File Name OracleSequence.mof
Description The OracleSequence class makes properties that are associated witha sequence available. A sequence is a mechanism to generate aserial list of unique numbers for numeric columns of a database’stables.
Note: There are no parameters for this provider.
Table 90. Properties
Property Type Description
CacheSize+ String The amount of sequence numbers to cache.
DatabaseName* String The name of an Oracle database. The database namecontains up to 8 characters and corresponds to the namespecified in the CREATE DATABASE statement andidentified in the DB_NAME parameter in the databaseinitialization parameter file.
IncrementBy+ String The incremental value by which sequence is increased.
LastNumber+ String The last sequence number written to a disk. If asequence is caching, the number written is the lastnumber placed in the sequence cache. This number istypically greater than the last sequence number that wasused.
MaxValue+ String The maximum value for the specified sequence.
MinValue+ String The minimum value for the specified sequence.
SequenceName* String The name of the specified sequence.
SequenceOwner* String The username of the sequence owner.
Note: * Denotes a CIM key property. + Denotes a CIM numeric property beingrepresented as a string. This value must be cast to a number in the resourcemodel using the Javascript Number object.
Appendix C. Creating custom resource models using CIM classes 469

OracleSession
DescriptionThe following tables detail the CIM class, parameters, properties, exceptions, anddependencies of this provider.
Table 91. CIM class
CIM Name ROOT\CIMV2: OracleSession
MOF File Name OracleSession.mof
Description The OracleSession class makes properties that are associated with asession available. A session is a user connection to an Oracleinstance through a user process. A session begins when the userconnects and ends when the user disconnects or exits the databaseapplication.
Note: There are no parameters for this provider.
Table 92. Properties
Property Type Description
AccessObject String The name of the object currently locked by this session.
AccessOwner String The owner of the object currently locked by this session.
GroupID* UInt32 The redo log group identifier number.
InstanceName* String The name of an Oracle database instance. The instancename is identified by the INSTANCE_NAME parameterin the database initialization parameter file andcorresponds to the Oracle System Identifier (SID) of theinstance.
LockWait String The address of lock waiting for, or NULL if there is none.
LockWaitTime+ String The time (in seconds) since current mode was granted.
LogonTime String The time of logon for the specified session.
Machine String The name of the machine where the client process isexecuting.
Member* String The name of the redo log member.
OpenCursors+ String The number of cursors currently open by this session.
OSUser String The operating system user name.
Process String The process identifier of the client process.
Program String The name of the client program being executed by theclient process.
Server String The server type as one of the following: dedicated,shared, pseudo, or none.
Status String The current status of the session:
v ACTIVE – session is currently executing SQL
v INACTIVE or KILLED – session is marked to be killed
v CACHED – session is temporarily cached for use byOracle*XA
v SNIPED - session inactive or waiting on the client
SQLAddress String The address of the SQL statement used withSQL_HASH_VALUE to identify the SQL statement that iscurrently being executed.
470 IBM Tivoli Monitoring for Databases: Oracle: Reference Guide

Table 92. Properties (continued)
Property Type Description
SQLHashValue String The hash value of the SQL statement used withSQL_ADDRESS to identify the SQL statement that iscurrently being executed.
SQLText String The text piece of a SQL statement.
Type String The session type.
Note: * Denotes a CIM key property. + Denotes a CIM numeric property beingrepresented as a string. This value must be cast to a number in the resourcemodel using the Javascript Number object.
Appendix C. Creating custom resource models using CIM classes 471

OracleSessStat
DescriptionThe following tables detail the CIM class, parameters, properties, exceptions, anddependencies of this provider.
Table 93. CIM class
CIM Name ROOT\CIMV2: OracleSessStat
MOF File Name OracleSessStat.mof
Description The OracleSessStat class makes properties that are associated withuser session statistics available.
Note: There are no parameters for this provider.
Table 94. Properties
Property Type Description
InstanceName* String The name of an Oracle database instance. The instancename is identified by the INSTANCE_NAME parameterin the database initialization parameter file andcorresponds to the Oracle System Identifier (SID) of theinstance.
ClassName String The class name for the specified session.
SessionID* UInt32 The session identifier.
StatName* String The statistic name for the specified session.
Value String The statistic value for the specified session.
Note: * Denotes a CIM key property. + Denotes a CIM numeric property beingrepresented as a string. This value must be cast to a number in the resourcemodel using the Javascript Number object.
472 IBM Tivoli Monitoring for Databases: Oracle: Reference Guide

OracleSharedServer
DescriptionThe following tables detail the CIM class, parameters, properties, exceptions, anddependencies of this provider.
Table 95. CIM class
CIM Name ROOT\CIMV2: OracleSharedServer
MOF File Name OracleSharedServer.mof
Description The OracleSharedServer class makes properties that are associatedwith a shared server process available.
Note: There are no parameters for this provider.
Table 96. Properties
Property Type Description
Breaks+ String The total number of breaks.
Bytes+ String The total number of bytes for all messages.
InstanceName* String The name of an Oracle database instance. Theinstance name is identified by theINSTANCE_NAME parameter in the databaseinitialization parameter file and corresponds tothe Oracle System Identifier (SID) of the instance.
Messages+ String The number of messages processed by a sharedserver.
ProcessAddress String The process address for a shared server.
SharedServerName* String The name of the shared server.
Status String Specifies the status of the shared server. Sharedserver status includes:
v EXEC – currently executing SQL
v WAIT (ENQ) - waiting for a lock
v WAIT (SEND) - waiting to send data to a user
v WAIT (COMMON) – idle and waiting for auser request
v WAIT (RESET) - waiting for a circuit to resetfollowing a break
v QUIT – terminating the server
TotalBusyTime+ String The total busy time in hundredths of a second.
TotalIdleTime+ String The total idle time as hundredths of a second.
TotalRequestsTaken+ String The total number of requests taken from thecommon queue throughout the lifetime of theserver.
Note: * Denotes a CIM key property. + Denotes a CIM numeric property beingrepresented as a string. This value must be cast to a number in the resourcemodel using the Javascript Number object.
Appendix C. Creating custom resource models using CIM classes 473

OracleSQLPlan
DescriptionThe following tables detail the CIM class, parameters, properties, exceptions, anddependencies of this provider.
Table 97. CIM class
CIM Name ROOT\CIMV2: OracleSQLPlan
MOF File Name OracleSQLPlan.mof
Description The OracleSQLPlan class makes properties that are associated withthe execution plan information for each child cursor loaded in thelibrary cache available.
Note: There are no parameters for this provider.
Table 98. Properties
Property Type Description
Address* String The handle to the parent address for the specified cursor.The ADDRESS and HASH_VALUE columns can be joinedwith V$SQLAREA to add cursor-specific information.
HashValue* UInt32 The hash value of a specified parent statement in thelibrary cache. The ADDRESS and HASH_VALUE columnscan be joined with V$SQLAREA to add cursor-specificinformation.
InstanceName* String The name of an Oracle database instance. The instancename is identified by the INSTANCE_NAME parameterin the database initialization parameter file andcorresponds to the Oracle System Identifier (SID) of theinstance.
ObjectName String The table name or index name.
ObjectOwner String The username of the user who owns the schema thatcontains the table or index.
Operation String The name of the internal operation that is performed inthis step (for example, TABLE ACCESS).
Options String A variation on the operation listed in the OPERATIONcolumn (for example, FULL).
SQLText String A column that contains one piece of the SQL text.
Note: * Denotes a CIM key property. + Denotes a CIM numeric property beingrepresented as a string. This value must be cast to a number in the resourcemodel using the Javascript Number object.
474 IBM Tivoli Monitoring for Databases: Oracle: Reference Guide

OracleState
DescriptionThe following tables detail the CIM class, parameters, properties, exceptions, anddependencies of this provider.
Table 99. CIM class
CIM Name ROOT\CIMV2: OracleState
MOF File Name OracleState.mof
Description The OracleState class makes properties that are associated with thestate of an instance available.
Note: There are no parameters for this provider.
Table 100. Properties
Property Type Description
InstanceName* String The name of an Oracle database instance. The instancename is identified by the INSTANCE_NAME parameter inthe database initialization parameter file and correspondsto the Oracle System Identifier (SID) of the instance.
State String Displays the current state of the instance. Possible statesinclude: Available, Unavailable, Shutdown, Suspect,Unknown.
Note: * Denotes a CIM key property. + Denotes a CIM numeric property beingrepresented as a string. This value must be cast to a number in the resourcemodel using the Javascript Number object.
Appendix C. Creating custom resource models using CIM classes 475

OracleSysStat
DescriptionThe following tables detail the CIM class, parameters, properties, exceptions, anddependencies of this provider.
Table 101. CIM class
CIM Name ROOT\CIMV2: OracleSysStat
MOF File Name OracleSysStat.mof
Description The OracleSysStat class makes properties that are associated withsystem statistics available.
Note: There are no parameters for this provider.
Table 102. Properties
Property Type Description
Class UInt32 The number that represents a statistics class. The classnumbers represent the following: 1 User, 2 Redo, 4Enqueue, 8 Cache, 16 OS, 32 Oracle Real ApplicationCluster, 64 SQL, 128 Debug.
InstanceName* String The name of an Oracle database instance. The instancename is identified by the INSTANCE_NAME parameterin the database initialization parameter file andcorresponds to the Oracle System Identifier (SID) of theinstance.
StatName* String The name of the statistic.
Value UInt32 The system statistic value.
Note: * Denotes a CIM key property. + Denotes a CIM numeric property beingrepresented as a string. This value must be cast to a number in the resourcemodel using the Javascript Number object.
476 IBM Tivoli Monitoring for Databases: Oracle: Reference Guide

OracleSystemEvent
DescriptionThe following tables detail the CIM class, parameters, properties, exceptions, anddependencies of this provider.
Table 103. CIM class
CIM Name ROOT\CIMV2: OracleSystemEvent
MOF File Name OracleSystemEvent.mof
Description The OracleSystemEvent class makes properties that are associatedwith information on total waits for an event available.
Note: There are no parameters for this provider.
Table 104. Properties
Property Type Description
AverageWait+ String The average amount of time waited for this event, inhundredths of a second.
Event* String The name of the wait event.
InstanceName* String The name of an Oracle database instance. Theinstance name is identified by theINSTANCE_NAME parameter in the databaseinitialization parameter file and corresponds to theOracle System Identifier (SID) of the instance.
TotalTimeouts+ String The total number of timeouts for this event.
TimeWaited+ String The total amount of time waited for this event, inhundredths of a second.
TotalWaits+ String The total number of waits for this event.
Note: * Denotes a CIM key property. + Denotes a CIM numeric property beingrepresented as a string. This value must be cast to a number in the resourcemodel using the Javascript Number object.
Appendix C. Creating custom resource models using CIM classes 477
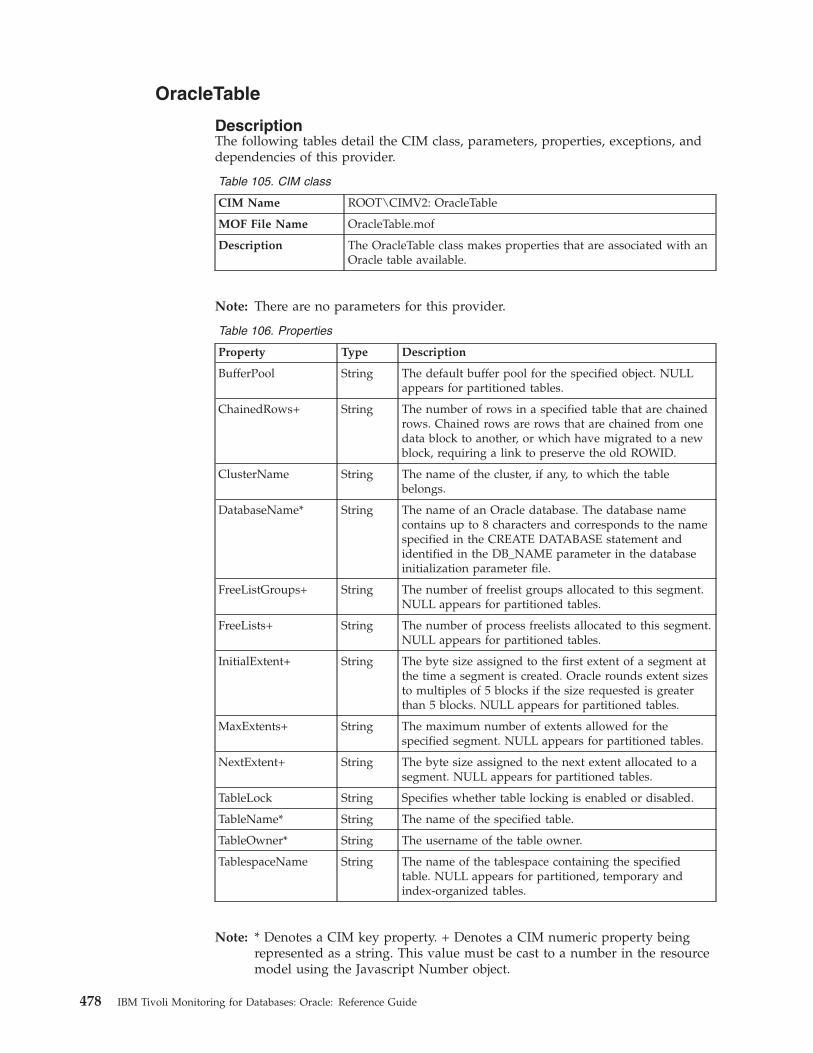
OracleTable
DescriptionThe following tables detail the CIM class, parameters, properties, exceptions, anddependencies of this provider.
Table 105. CIM class
CIM Name ROOT\CIMV2: OracleTable
MOF File Name OracleTable.mof
Description The OracleTable class makes properties that are associated with anOracle table available.
Note: There are no parameters for this provider.
Table 106. Properties
Property Type Description
BufferPool String The default buffer pool for the specified object. NULLappears for partitioned tables.
ChainedRows+ String The number of rows in a specified table that are chainedrows. Chained rows are rows that are chained from onedata block to another, or which have migrated to a newblock, requiring a link to preserve the old ROWID.
ClusterName String The name of the cluster, if any, to which the tablebelongs.
DatabaseName* String The name of an Oracle database. The database namecontains up to 8 characters and corresponds to the namespecified in the CREATE DATABASE statement andidentified in the DB_NAME parameter in the databaseinitialization parameter file.
FreeListGroups+ String The number of freelist groups allocated to this segment.NULL appears for partitioned tables.
FreeLists+ String The number of process freelists allocated to this segment.NULL appears for partitioned tables.
InitialExtent+ String The byte size assigned to the first extent of a segment atthe time a segment is created. Oracle rounds extent sizesto multiples of 5 blocks if the size requested is greaterthan 5 blocks. NULL appears for partitioned tables.
MaxExtents+ String The maximum number of extents allowed for thespecified segment. NULL appears for partitioned tables.
NextExtent+ String The byte size assigned to the next extent allocated to asegment. NULL appears for partitioned tables.
TableLock String Specifies whether table locking is enabled or disabled.
TableName* String The name of the specified table.
TableOwner* String The username of the table owner.
TablespaceName String The name of the tablespace containing the specifiedtable. NULL appears for partitioned, temporary andindex-organized tables.
Note: * Denotes a CIM key property. + Denotes a CIM numeric property beingrepresented as a string. This value must be cast to a number in the resourcemodel using the Javascript Number object.
478 IBM Tivoli Monitoring for Databases: Oracle: Reference Guide

OracleTablespace
DescriptionThe following tables detail the CIM class, parameters, properties, exceptions, anddependencies of this provider.
Table 107. CIM class
CIM Name ROOT\CIMV2: OracleTablespace
MOF File Name OracleTablespace.mof
Description The OracleTablespace class makes properties that are associatedwith a tablespace available. A Tablespace is a logical unit of storagein an Oracle database.
Note: There are no parameters for this provider.
Table 108. Properties
Property Type Description
AllocatedBytes+ String The total number of bytes dedicated for use by thistablespace. This value is the total sum of the datafilesincluded in the tablespace.
AllocationType String The type of extent allocation used for the tablespace.
Contents String The tablespace contents as PERMANENT orTEMPORARY.
DatabaseName* String The name of an Oracle database. The database namecontains up to 8 characters and corresponds to thename specified in the CREATE DATABASE statementand identified in the DB_NAME parameter in thedatabase initialization parameter file.
ExtentManagement String One of two ways to enable tablespaces to allocate spacein extents, either by the data dictionary fordictionary-managed tablespaces, or by the tablespacefor locally managed tablespaces. The method of extentmanagement is selected when the tablespace is created.This method cannot be altered.
FreeBytes+ String The number of unallocated bytes within this tablespace.
FSFI+ String The Free Space Fragmentation Index. This indexcalculates the size of the largest extent as a percentageof the total free space without considering the numberof extents in a tablespace.
InitialExtent+ String The default byte size assigned to the first extent of asegment created within this tablespace. Oracle roundsextent sizes to multiples of 5 blocks if the sizerequested is greater than 5 blocks.
Logging String The default logging attribute.
MaxExtents+ String The default maximum number of extents allowed for asegment created within this tablespace.
NextExtent+ String The default byte size assigned to the next extentallocated to a segment created within this tablespace.
PctIncrease+ String The default percent by which the size of the nextallocated extent of a segment created within thistablespace is increased.
Appendix C. Creating custom resource models using CIM classes 479

Table 108. Properties (continued)
Property Type Description
Status String Specifies the current tablespace status as eitherONLINE, OFFLINE, or READ ONLY.
TablespaceID String The tablespace identifier.
TablespaceName* String The name of the tablespace. The tablespace name cancontain up to 8 characters.
Note: * Denotes a CIM key property. + Denotes a CIM numeric property beingrepresented as a string. This value must be cast to a number in the resourcemodel using the Javascript Number object.
480 IBM Tivoli Monitoring for Databases: Oracle: Reference Guide

OracleTransaction
DescriptionThe following tables detail the CIM class, parameters, properties, exceptions, anddependencies of this provider.
Table 109. CIM class
CIM Name ROOT\CIMV2: OracleTransaction
MOF File Name OracleTransaction.mof
Description The OracleTransaction class makes properties that are associatedwith a transaction available. A transaction is a logical unit of workcontaining one or more SQL statements.
Note: There are no parameters for this provider.
Table 110. Properties
Property Type Description
Address* String The location of the transaction state object.
InstanceName* String The name of an Oracle database instance. Theinstance name is identified by theINSTANCE_NAME parameter in the databaseinitialization parameter file and corresponds to theOracle System Identifier (SID) of the instance.
SessionID+ String The session identifier for the specified transaction.
SQLText String The text piece of a SQL statement.
StartTime String The start time for the specified transaction.
TimeRunningSeconds+ String The number of seconds the transaction has beenrunning.
Username String The name of the user as recognized by the Oracleserver and other users so that the user can connectto and access objects in a database. Each user nameis associated with a password that also must beentered to connect to an Oracle database.
Note: * Denotes a CIM key property. + Denotes a CIM numeric property beingrepresented as a string. This value must be cast to a number in the resourcemodel using the Javascript Number object.
Appendix C. Creating custom resource models using CIM classes 481

OracleUndoStat
DescriptionThe following tables detail the CIM class, parameters, properties, exceptions, anddependencies of this provider.
Note: Use this CIM class to create resource models for Oracle 9i only.
Table 111. CIM class
CIM Name ROOT\CIMV2: OracleUndoStat
MOF File Name OracleUndoStat.mof
Description The OracleUndoStat class makes properties that are associated withundo statistical data available.
Note: There are no parameters for this provider.
Table 112. Properties
Property Type Description
BeginTime* String The start of the specified instance time interval.
EndTime String The end of the specified instance time interval.
InstanceName* String The name of an Oracle database instance. The instancename is identified by the INSTANCE_NAME parameterin the database initialization parameter file andcorresponds to the Oracle System Identifier (SID) of theinstance.
NoSpaceErrCnt+ String Identifies the number of times space was requested inthe undo tablespace, but no free space was available.That is, all of the space in the undo tablespace was inuse by active transactions. To correct this, add morespace to the undo tablespace.
SSOldErrCnt+ String Snapshot Too Old error count.
UndoBlks+ String The total number of consumed undo blocks. Use thiscolumn to obtain the consumption rate of undo blocks,and estimate the size of the undo tablespace required toaccommodate your system workload.
Note: * Denotes a CIM key property. + Denotes a CIM numeric property beingrepresented as a string. This value must be cast to a number in the resourcemodel using the Javascript Number object.
482 IBM Tivoli Monitoring for Databases: Oracle: Reference Guide

OracleUnixProcess
DescriptionThe following tables detail the CIM class, parameters, properties, exceptions, anddependencies of this provider.
Table 113. CIM class
CIM Name ROOT\CIMV2: OracleUnixProcess
MOF File Name OracleUnixProcess.mof
Description The OracleUnixProcess class makes properties that are associatedwith a Unix process running by way of Oracle available.
Note: There are no parameters for this provider.
Table 114. Properties
Property Type Description
InstanceName* String The name of an Oracle database instance. The instancename is identified by the INSTANCE_NAME parameterin the database initialization parameter file andcorresponds to the Oracle System Identifier (SID) of theinstance.
OSProcessID String A unique integer used by the operating system kernel toidentify a process.
ProcessName* String The name of a process used to uniquely identify thatprocess.
Username String The name of the user as recognized by the Oracle serverand other users so that the user can connect to and accessobjects in a database. Each user name is associated with apassword that also must be entered to connect to anOracle database.
Note: * Denotes a CIM key property. + Denotes a CIM numeric property beingrepresented as a string. This value must be cast to a number in the resourcemodel using the Javascript Number object.
Appendix C. Creating custom resource models using CIM classes 483
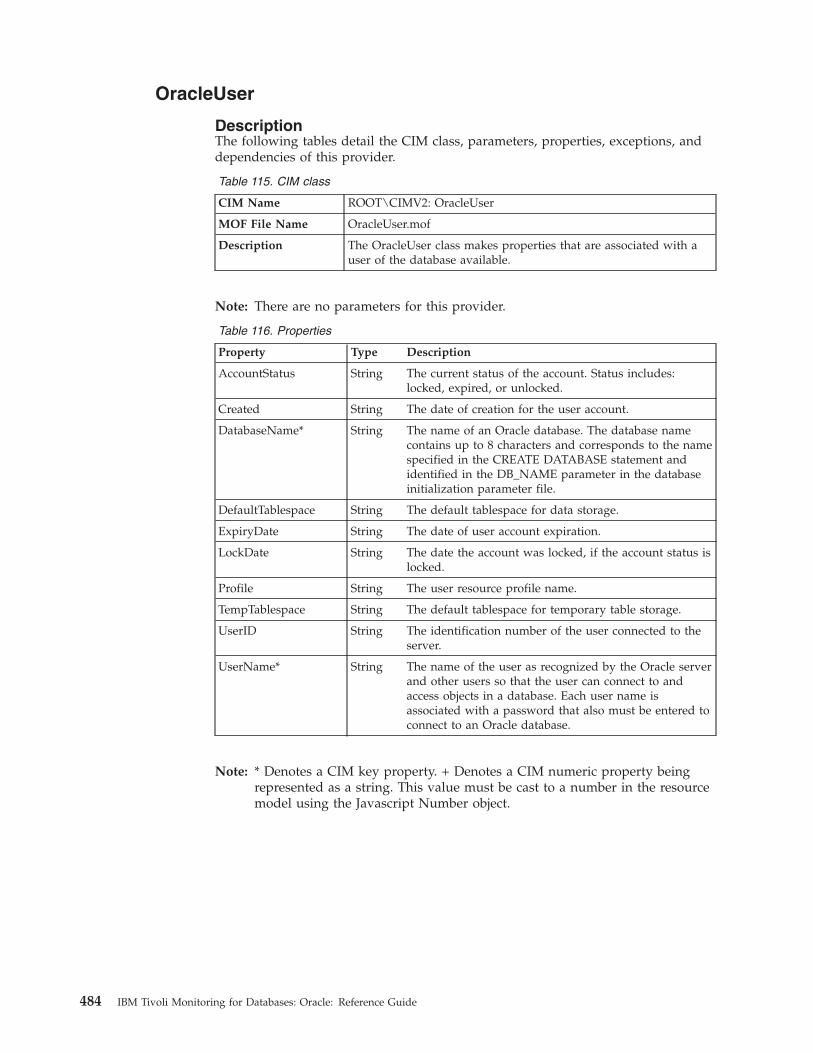
OracleUser
DescriptionThe following tables detail the CIM class, parameters, properties, exceptions, anddependencies of this provider.
Table 115. CIM class
CIM Name ROOT\CIMV2: OracleUser
MOF File Name OracleUser.mof
Description The OracleUser class makes properties that are associated with auser of the database available.
Note: There are no parameters for this provider.
Table 116. Properties
Property Type Description
AccountStatus String The current status of the account. Status includes:locked, expired, or unlocked.
Created String The date of creation for the user account.
DatabaseName* String The name of an Oracle database. The database namecontains up to 8 characters and corresponds to the namespecified in the CREATE DATABASE statement andidentified in the DB_NAME parameter in the databaseinitialization parameter file.
DefaultTablespace String The default tablespace for data storage.
ExpiryDate String The date of user account expiration.
LockDate String The date the account was locked, if the account status islocked.
Profile String The user resource profile name.
TempTablespace String The default tablespace for temporary table storage.
UserID String The identification number of the user connected to theserver.
UserName* String The name of the user as recognized by the Oracle serverand other users so that the user can connect to andaccess objects in a database. Each user name isassociated with a password that also must be entered toconnect to an Oracle database.
Note: * Denotes a CIM key property. + Denotes a CIM numeric property beingrepresented as a string. This value must be cast to a number in the resourcemodel using the Javascript Number object.
484 IBM Tivoli Monitoring for Databases: Oracle: Reference Guide

Appendix D. Tivoli Enterprise Console classes
This appendix contains the Tivoli Enterprise Console classes delivered with IBMTivoli Monitoring for Databases: Oracle. The classes contain the new slot values forthe event.
Slots are the fields in a Tivoli event. All Tivoli events have a base set of slots asdescribed in the Tivoli Enterprise Console User’s Guide. In addition to these slots,IBM Tivoli Monitoring for Databases: Oracle adds slots for additional information.You can reference these classes and slots to assist you in writing your ownbusiness rules.
TasksCollectively, the task files implement the following class hierarchy:Event
ESMTaskOracleTask_SucceededOracleTask_FailedOracleTask_Abend
ESMTask.baroc:TEC_CLASS:
ESMTask ISA EVENTDEFINES {
taskname: STRING;tasklib: STRING;collection: STRING;source: default=ESMTASK;endpoint: STRING;exit_code: INTEGER;
};END
OracleTask.baroc:TEC_CLASS :
OracleTask_Succeeded ISA ESMTaskDEFINES {severity: default=HARMLESS;};
END
TEC_CLASS :OracleTask_Failed ISA ESMTaskDEFINES {severity: default=WARNING;};
END
TEC_CLASS :OracleTask_Abend ISA ESMTaskDEFINES {severity: default=CRITICAL;};
END
485

Resource modelsCollectively, the resource model files implement the following class hierarchy:TMW_Event
ITMSystem_BaseITMDatabase_Base
ITMOracle_BaseOracle_Database
individual database resource model classesOracle_Instance
individual instance resource model classes
ITMApplications.baroc:TEC_CLASS :
ITMSystem_Base ISA TMW_Event;END
TEC_CLASS :ITMDatabase_Base ISA TMW_Event;
END
ITMOracle.baroc:TEC_CLASS :
ITMOracle_Base ISA ITMDatabase_BaseDEFINES {
interp : STRING;context : STRING;oracle_home : STRING;oracle_sid : STRING;application_oid : STRING;application_version : STRING;application_class : STRING;application_label : STRING;
};END
TEC_CLASS :Oracle_Database ISA ITMOracle_Base;
END
TEC_CLASS :Oracle_Instance ISA ITMOracle_Base;
END
ITMOracleResourceModels.baroc:
OracleAdvancedQueue resource modelOracle_High_AverageReadyMessageWaitingTimeInDays
TEC_CLASS :Oracle_High_AverageReadyMessageWaitingTimeInDays ISA Oracle_InstanceDEFINES {databasename : STRING;queuename : STRING;queueowner : STRING;threshold : REAL;averagereadywait : REAL;
severity: default = CRITICAL;};END
Oracle_High_AverageReadyMessageWaitingTimeInHours
486 IBM Tivoli Monitoring for Databases: Oracle: Reference Guide

TEC_CLASS :Oracle_High_AverageReadyMessageWaitingTimeInHours ISA Oracle_InstanceDEFINES {databasename : STRING;queuename : STRING;queueowner : STRING;threshold : REAL;averagereadywait : REAL;
severity: default = CRITICAL;};END
Oracle_High_AverageReadyMessageWaitingTimeInMinutesTEC_CLASS :Oracle_High_AverageReadyMessageWaitingTimeInMinutes ISA Oracle_InstanceDEFINES {databasename : STRING;queuename : STRING;queueowner : STRING;threshold : REAL;averagereadywait : REAL;
severity: default = CRITICAL;};END
Oracle_High_AverageReadyMessageWaitingTimeInSecondsTEC_CLASS :Oracle_High_AverageReadyMessageWaitingTimeInSeconds ISA Oracle_InstanceDEFINES {databasename : STRING;queuename : STRING;queueowner : STRING;averagereadywait : REAL;threshold : REAL;
severity: default = CRITICAL;};END
Oracle_High_MessagePropagationErrorCountTEC_CLASS :Oracle_High_MessagePropagationErrorCount ISA Oracle_InstanceDEFINES {databasename : STRING;queuename : STRING;queueowner : STRING;destination : STRING;lasterrordate : STRING;lasterrortime : STRING;lasterrormsg : STRING;threshold : REAL;failures : REAL;
severity: default = CRITICAL;};END
Oracle_High_NumberOfMessagesTEC_CLASS :Oracle_High_NumberOfMessages ISA Oracle_InstanceDEFINES {messagestatus : STRING;queueowner : STRING;queuename : STRING;databasename : STRING;
Appendix D. Tivoli Enterprise Console classes 487

threshold : REAL;numberofmessages : REAL;
severity: default = CRITICAL;};END
Oracle_High_TotalReadyMessageWaitingTimeInDaysTEC_CLASS :Oracle_High_TotalReadyMessageWaitingTimeInDays ISA Oracle_InstanceDEFINES {databasename : STRING;queuename : STRING;queueowner : STRING;threshold : REAL;totalreadywait : REAL;
severity: default = CRITICAL;};END
Oracle_High_TotalReadyMessageWaitingTimeInHoursTEC_CLASS :Oracle_High_TotalReadyMessageWaitingTimeInHours ISA Oracle_InstanceDEFINES {databasename : STRING;queuename : STRING;queueowner : STRING;threshold : REAL;totalreadywait : REAL;
severity: default = CRITICAL;};END
Oracle_High_TotalReadyMessageWaitingTimeInMinutesTEC_CLASS :Oracle_High_TotalReadyMessageWaitingTimeInMinutes ISA Oracle_InstanceDEFINES {databasename : STRING;queuename : STRING;queueowner : STRING;threshold : REAL;totalreadywait : REAL;
severity: default = CRITICAL;};END
Oracle_High_TotalReadyMessageWaitingTimeInSecondsTEC_CLASS :Oracle_High_TotalReadyMessageWaitingTimeInSeconds ISA Oracle_InstanceDEFINES {databasename : STRING;queuename : STRING;queueowner : STRING;threshold : REAL;totalreadywait : REAL;
severity: default = CRITICAL;};END
Oracle_Low_AverageMessagePropagationRateTEC_CLASS :Oracle_Low_AverageMessagePropagationRate ISA Oracle_InstanceDEFINES {
488 IBM Tivoli Monitoring for Databases: Oracle: Reference Guide

databasename : STRING;queuename : STRING;queueowner : STRING;threshold : REAL;averagemessagepropagationrate : REAL;
severity: default = CRITICAL;};END
OracleArchiveDest resource modelOracle_High_UsedKB
TEC_CLASS :Oracle_High_UsedKB ISA Oracle_DatabaseDEFINES {instancename : STRING;destination : STRING;binding : STRING;faildate : STRING;mountpoint : STRING;namespace : STRING;target : STRING;error : STRING;archivingstatus : STRING;threshold : REAL;failsequence : REAL;failblock : REAL;freekbytes : REAL;totalkbytes : REAL;freespacepercentage : REAL;usedkbytes : REAL;destid : REAL;
severity: default = CRITICAL;};END
Oracle_Invalid_ArchiveDestinationTEC_CLASS :Oracle_Invalid_ArchiveDestination ISA Oracle_DatabaseDEFINES {destination : STRING;binding : STRING;faildate : STRING;error : STRING;mountpoint : STRING;namespace : STRING;target : STRING;instancename : STRING;archivingstatus : STRING;failsequence : REAL;failblock : REAL;destid : REAL;totalkbytes : REAL;freekbytes : REAL;freespacepercentage : REAL;
severity: default = CRITICAL;};END
Oracle_Low_FreeKBTEC_CLASS :Oracle_Low_FreeKB ISA Oracle_DatabaseDEFINES {destination : STRING;
Appendix D. Tivoli Enterprise Console classes 489

binding : STRING;faildate : STRING;error : STRING;mountpoint : STRING;namespace : STRING;target : STRING;instancename : STRING;archivingstatus : STRING;threshold : REAL;failsequence : REAL;failblock : REAL;freekbytes : REAL;totalkbytes : REAL;freespacepercentage : REAL;usedkbytes : REAL;destid : REAL;
severity: default = CRITICAL;};END
Oracle_Low_FreeSpacePercentageTEC_CLASS :Oracle_Low_FreeSpacePercentage ISA Oracle_DatabaseDEFINES {destination : STRING;binding : STRING;faildate : STRING;error : STRING;mountpoint : STRING;namespace : STRING;target : STRING;instancename : STRING;archivingstatus : STRING;failsequence : REAL;failblock : REAL;freekbytes : REAL;totalkbytes : REAL;usedkbytes : REAL;destid : REAL;freespacepercentage : REAL;threshold : REAL;
severity: default = CRITICAL;};END
Oracle_Low_NumberRedoLogsTEC_CLASS :Oracle_Low_NumberRedoLogs ISA Oracle_DatabaseDEFINES {instancename : STRING;destination : STRING;binding : STRING;namespace : STRING;target : STRING;faildate : STRING;error : STRING;mountpoint : STRING;archivingstatus : STRING;destid : REAL;failsequence : REAL;failblock : REAL;totalkbytes : REAL;freekbytes : REAL;threshold : REAL;freespacepercentage : REAL;
490 IBM Tivoli Monitoring for Databases: Oracle: Reference Guide

usedkbytes : REAL;numberredologs : REAL;
severity: default = CRITICAL;};END
Oracle_NotArchiving_LogModeTEC_CLASS :Oracle_NotArchiving_LogMode ISA Oracle_DatabaseDEFINES {logmode : STRING;databasename : STRING;
severity: default = CRITICAL;};END
OracleCheckpoints resource modelOracle_High_DBWRCheckpoints
TEC_CLASS :Oracle_High_DBWRCheckpoints ISA Oracle_InstanceDEFINES {databasename : STRING;instancename : STRING;dbwrcheckpoints : REAL;threshold : REAL;
severity: default = CRITICAL;};END
Oracle_Low_CompletedBackgroundCheckpointsTEC_CLASS :Oracle_Low_CompletedBackgroundCheckpoints ISA Oracle_InstanceDEFINES {databasename : STRING;instancename : STRING;completedbackgroundcheckpoints : REAL;threshold : REAL;
severity: default = CRITICAL;};END
OracleDumpSpace resource modelOracle_High_Used_Dump_Space_Percentage
TEC_CLASS :Oracle_High_Used_Dump_Space_Percentage ISA Oracle_DatabaseDEFINES {instancename : STRING;type : STRING;destination : STRING;threshold : REAL;usedpercentage : REAL;freekbytes : REAL;totalkbytes : REAL;
severity: default = CRITICAL;};END
OracleExtents resource modelOracle_High_CurrentExtents
Appendix D. Tivoli Enterprise Console classes 491
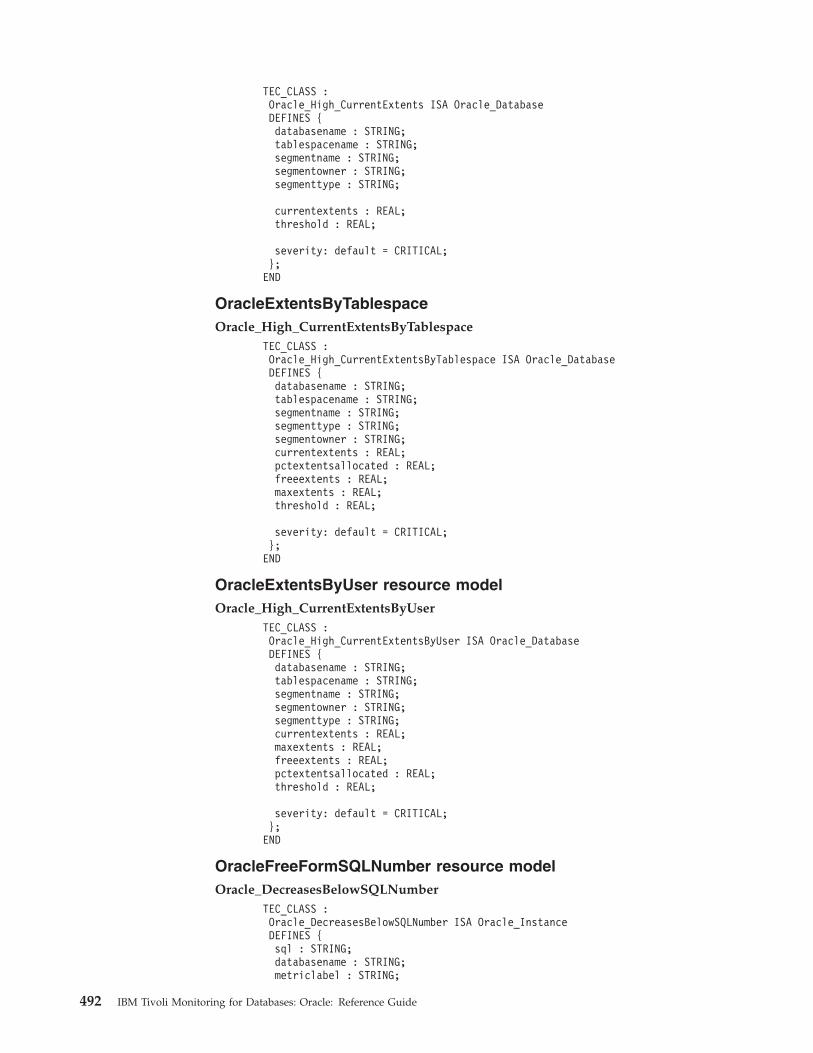
TEC_CLASS :Oracle_High_CurrentExtents ISA Oracle_DatabaseDEFINES {databasename : STRING;tablespacename : STRING;segmentname : STRING;segmentowner : STRING;segmenttype : STRING;
currentextents : REAL;threshold : REAL;
severity: default = CRITICAL;};END
OracleExtentsByTablespaceOracle_High_CurrentExtentsByTablespace
TEC_CLASS :Oracle_High_CurrentExtentsByTablespace ISA Oracle_DatabaseDEFINES {databasename : STRING;tablespacename : STRING;segmentname : STRING;segmenttype : STRING;segmentowner : STRING;currentextents : REAL;pctextentsallocated : REAL;freeextents : REAL;maxextents : REAL;threshold : REAL;
severity: default = CRITICAL;};END
OracleExtentsByUser resource modelOracle_High_CurrentExtentsByUser
TEC_CLASS :Oracle_High_CurrentExtentsByUser ISA Oracle_DatabaseDEFINES {databasename : STRING;tablespacename : STRING;segmentname : STRING;segmentowner : STRING;segmenttype : STRING;currentextents : REAL;maxextents : REAL;freeextents : REAL;pctextentsallocated : REAL;threshold : REAL;
severity: default = CRITICAL;};END
OracleFreeFormSQLNumber resource modelOracle_DecreasesBelowSQLNumber
TEC_CLASS :Oracle_DecreasesBelowSQLNumber ISA Oracle_InstanceDEFINES {sql : STRING;databasename : STRING;metriclabel : STRING;
492 IBM Tivoli Monitoring for Databases: Oracle: Reference Guide
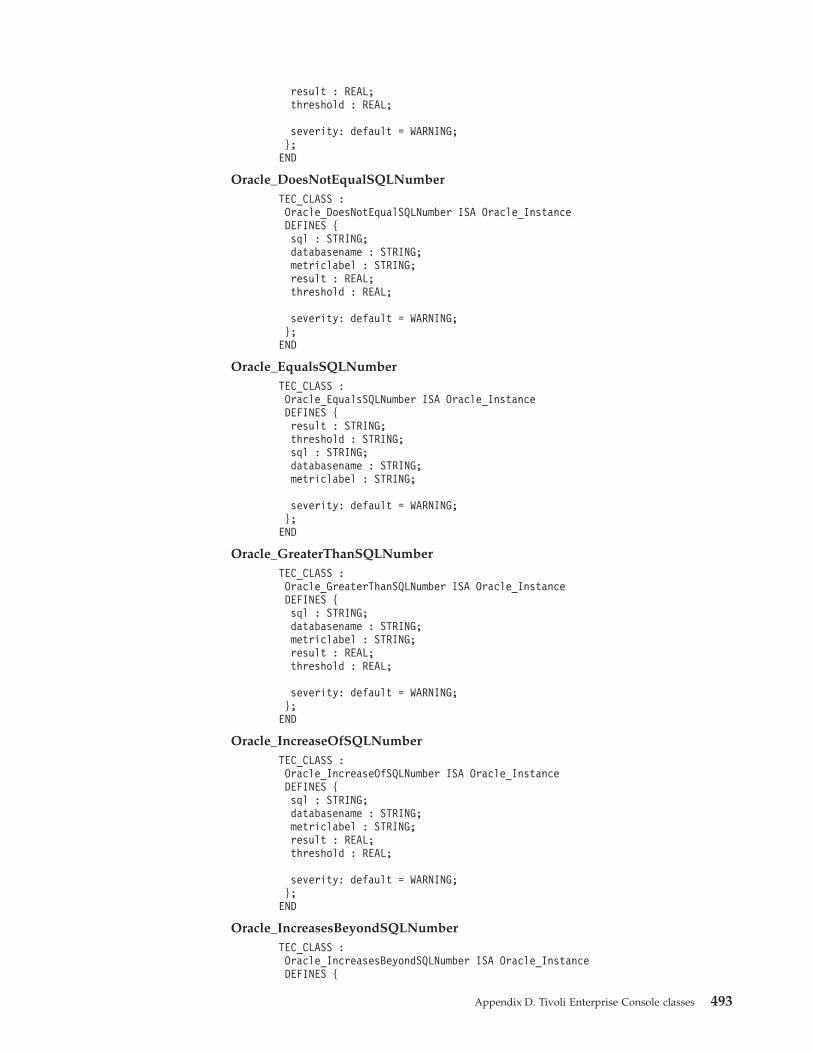
result : REAL;threshold : REAL;
severity: default = WARNING;};END
Oracle_DoesNotEqualSQLNumberTEC_CLASS :Oracle_DoesNotEqualSQLNumber ISA Oracle_InstanceDEFINES {sql : STRING;databasename : STRING;metriclabel : STRING;result : REAL;threshold : REAL;
severity: default = WARNING;};END
Oracle_EqualsSQLNumberTEC_CLASS :Oracle_EqualsSQLNumber ISA Oracle_InstanceDEFINES {result : STRING;threshold : STRING;sql : STRING;databasename : STRING;metriclabel : STRING;
severity: default = WARNING;};END
Oracle_GreaterThanSQLNumberTEC_CLASS :Oracle_GreaterThanSQLNumber ISA Oracle_InstanceDEFINES {sql : STRING;databasename : STRING;metriclabel : STRING;result : REAL;threshold : REAL;
severity: default = WARNING;};END
Oracle_IncreaseOfSQLNumberTEC_CLASS :Oracle_IncreaseOfSQLNumber ISA Oracle_InstanceDEFINES {sql : STRING;databasename : STRING;metriclabel : STRING;result : REAL;threshold : REAL;
severity: default = WARNING;};END
Oracle_IncreasesBeyondSQLNumberTEC_CLASS :Oracle_IncreasesBeyondSQLNumber ISA Oracle_InstanceDEFINES {
Appendix D. Tivoli Enterprise Console classes 493

sql : STRING;databasename : STRING;metriclabel : STRING;result : REAL;threshold : REAL;
severity: default = WARNING;};END
Oracle_LessThanSQLNumberTEC_CLASS :Oracle_LessThanSQLNumber ISA Oracle_InstanceDEFINES {sql : STRING;databasename : STRING;metriclabel : STRING;result : REAL;threshold : REAL;
severity: default = WARNING;};END
Oracle_PctIncreaseOfSQLNumberTEC_CLASS :Oracle_PctIncreaseOfSQLNumber ISA Oracle_InstanceDEFINES {sql : STRING;databasename : STRING;metriclabel : STRING;result : REAL;threshold : REAL;
severity: default = WARNING;};END
OracleFreeFormSQLString resource modelOracle_ChangesFromSQLString
TEC_CLASS :Oracle_ChangesFromSQLString ISA Oracle_InstanceDEFINES {result : STRING;threshold : STRING;sql : STRING;databasename : STRING;metriclabel : STRING;
severity: default = WARNING;};END
Oracle_ChangesToSQLStringTEC_CLASS :Oracle_ChangesToSQLString ISA Oracle_InstanceDEFINES {result : STRING;threshold : STRING;sql : STRING;databasename : STRING;metriclabel : STRING;
severity: default = WARNING;};END
494 IBM Tivoli Monitoring for Databases: Oracle: Reference Guide

Oracle_MatchesSQLStringTEC_CLASS :Oracle_MatchesSQLString ISA Oracle_InstanceDEFINES {result : STRING;threshold : STRING;sql : STRING;databasename : STRING;metriclabel : STRING;
severity: default = WARNING;};END
Oracle_MismatchesSQLStringTEC_CLASS :Oracle_MismatchesSQLString ISA Oracle_InstanceDEFINES {result : STRING;threshold : STRING;sql : STRING;databasename : STRING;metriclabel : STRING;
severity: default = WARNING;};END
OracleFreeSpaceDeficit resource modelOracle_Low_Equity
TEC_CLASS :Oracle_Low_Equity ISA Oracle_DatabaseDEFINES {databasename : STRING;tablespacename : STRING;segmentname : STRING;segmentowner : STRING;segmenttype : STRING;equity : REAL;nextextent : REAL;threshold : REAL;
severity: default = CRITICAL;};END
OracleFreeSpaceDeficitByTablespace resource modelOracle_Low_EquityByTablespace
TEC_CLASS :Oracle_Low_EquityByTablespace ISA Oracle_DatabaseDEFINES {segmentname : STRING;segmenttype : STRING;tablespacename : STRING;segmentowner : STRING;databasename : STRING;equity : REAL;nextextent : REAL;threshold : REAL;
severity: default = CRITICAL;};END
Appendix D. Tivoli Enterprise Console classes 495
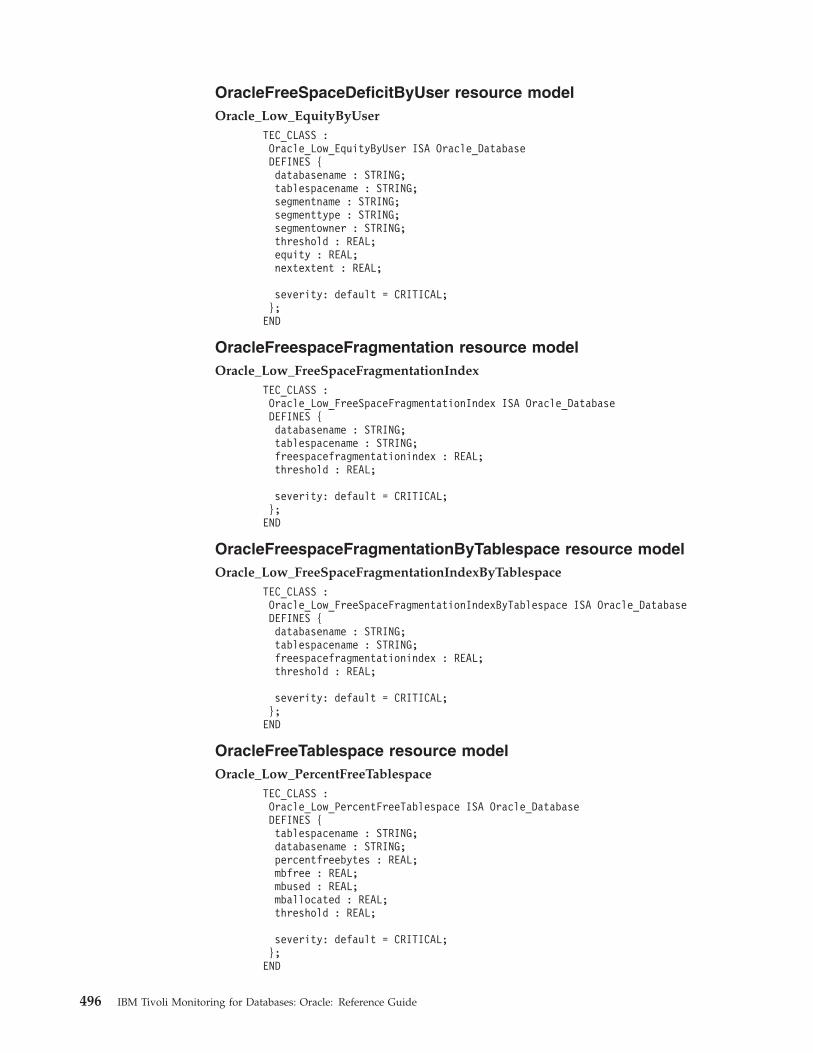
OracleFreeSpaceDeficitByUser resource modelOracle_Low_EquityByUser
TEC_CLASS :Oracle_Low_EquityByUser ISA Oracle_DatabaseDEFINES {databasename : STRING;tablespacename : STRING;segmentname : STRING;segmenttype : STRING;segmentowner : STRING;threshold : REAL;equity : REAL;nextextent : REAL;
severity: default = CRITICAL;};END
OracleFreespaceFragmentation resource modelOracle_Low_FreeSpaceFragmentationIndex
TEC_CLASS :Oracle_Low_FreeSpaceFragmentationIndex ISA Oracle_DatabaseDEFINES {databasename : STRING;tablespacename : STRING;freespacefragmentationindex : REAL;threshold : REAL;
severity: default = CRITICAL;};END
OracleFreespaceFragmentationByTablespace resource modelOracle_Low_FreeSpaceFragmentationIndexByTablespace
TEC_CLASS :Oracle_Low_FreeSpaceFragmentationIndexByTablespace ISA Oracle_DatabaseDEFINES {databasename : STRING;tablespacename : STRING;freespacefragmentationindex : REAL;threshold : REAL;
severity: default = CRITICAL;};END
OracleFreeTablespace resource modelOracle_Low_PercentFreeTablespace
TEC_CLASS :Oracle_Low_PercentFreeTablespace ISA Oracle_DatabaseDEFINES {tablespacename : STRING;databasename : STRING;percentfreebytes : REAL;mbfree : REAL;mbused : REAL;mballocated : REAL;threshold : REAL;
severity: default = CRITICAL;};END
496 IBM Tivoli Monitoring for Databases: Oracle: Reference Guide

OracleFreeTablespaceByTablespace resource modelOracle_Low_PercentFreeTablespaceByTablespace
TEC_CLASS :Oracle_Low_PercentFreeTablespaceByTablespace ISA Oracle_DatabaseDEFINES {tablespacename : STRING;databasename : STRING;percentfreebytes : REAL;mballocated : REAL;mbfree : REAL;mbused : REAL;threshold : REAL;
severity: default = CRITICAL;};END
OracleFullTableScan resource modelOracle_High_LongTableFullTableScans
TEC_CLASS :Oracle_High_LongTableFullTableScans ISA Oracle_DatabaseDEFINES {databasename : STRING;instancename : STRING;intervallongtablefulltablescans : REAL;threshold : REAL;
severity: default = CRITICAL;};END
Oracle_High_RowSourcePercentageTEC_CLASS :Oracle_High_RowSourcePercentage ISA Oracle_DatabaseDEFINES {databasename : STRING;instancename : STRING;rowsourcepercentage : REAL;threshold : REAL;
severity: default = CRITICAL;};END
OracleIO resource modelOracle_High_PhysicalReads
TEC_CLASS :Oracle_High_PhysicalReads ISA Oracle_InstanceDEFINES {databasename : STRING;tablespacename : STRING;filename : STRING;physicalreads : REAL;threshold : REAL;
severity: default = CRITICAL;};END
Oracle_High_PhysicalWritesTEC_CLASS :Oracle_High_PhysicalWrites ISA Oracle_InstanceDEFINES {
Appendix D. Tivoli Enterprise Console classes 497
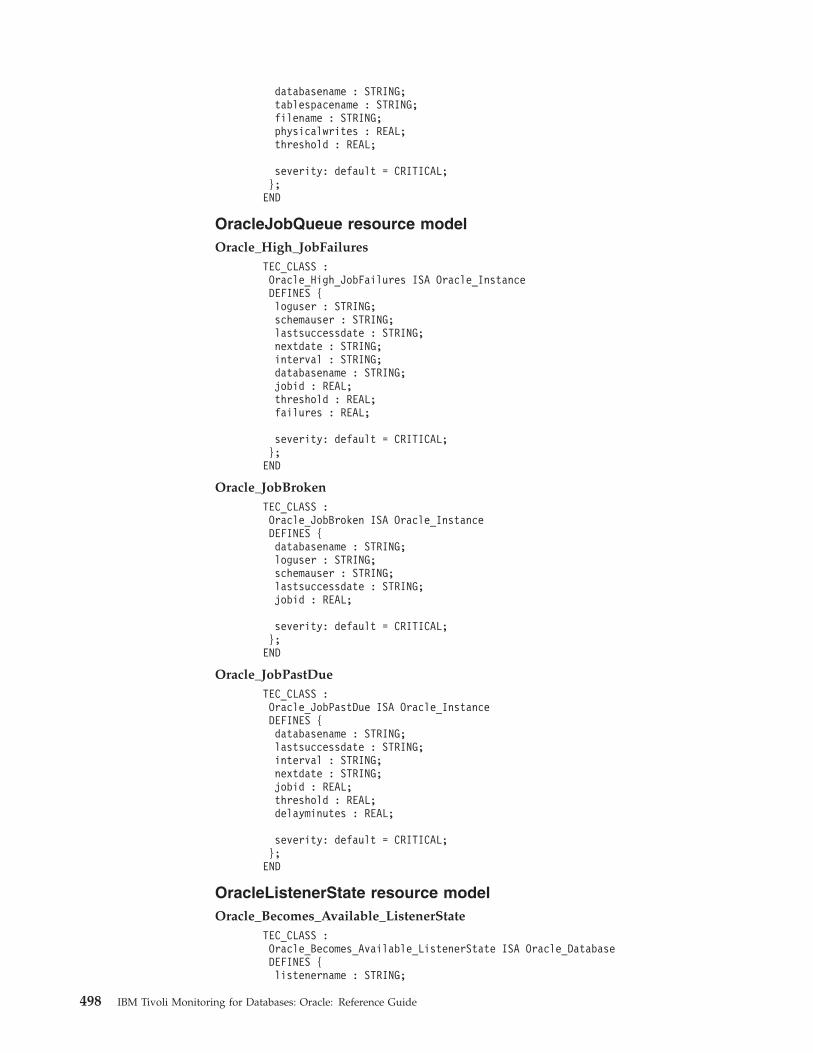
databasename : STRING;tablespacename : STRING;filename : STRING;physicalwrites : REAL;threshold : REAL;
severity: default = CRITICAL;};END
OracleJobQueue resource modelOracle_High_JobFailures
TEC_CLASS :Oracle_High_JobFailures ISA Oracle_InstanceDEFINES {loguser : STRING;schemauser : STRING;lastsuccessdate : STRING;nextdate : STRING;interval : STRING;databasename : STRING;jobid : REAL;threshold : REAL;failures : REAL;
severity: default = CRITICAL;};END
Oracle_JobBrokenTEC_CLASS :Oracle_JobBroken ISA Oracle_InstanceDEFINES {databasename : STRING;loguser : STRING;schemauser : STRING;lastsuccessdate : STRING;jobid : REAL;
severity: default = CRITICAL;};END
Oracle_JobPastDueTEC_CLASS :Oracle_JobPastDue ISA Oracle_InstanceDEFINES {databasename : STRING;lastsuccessdate : STRING;interval : STRING;nextdate : STRING;jobid : REAL;threshold : REAL;delayminutes : REAL;
severity: default = CRITICAL;};END
OracleListenerState resource modelOracle_Becomes_Available_ListenerState
TEC_CLASS :Oracle_Becomes_Available_ListenerState ISA Oracle_DatabaseDEFINES {listenername : STRING;
498 IBM Tivoli Monitoring for Databases: Oracle: Reference Guide

listenerstate : STRING;
severity: default = HARMLESS;};END
Oracle_Becomes_Unavailable_ListenerStateTEC_CLASS :Oracle_Becomes_Unavailable_ListenerState ISA Oracle_DatabaseDEFINES {listenername : STRING;listenerstate : STRING;
severity: default = CRITICAL;};END
Oracle_Becomes_Unknown_ListenerStateTEC_CLASS :Oracle_Becomes_Unknown_ListenerState ISA Oracle_DatabaseDEFINES {listenername : STRING;listenerstate : STRING;
severity: default = CRITICAL;};END
Oracle_Unavailable_ListenerStateTEC_CLASS :Oracle_Unavailable_ListenerState ISA Oracle_DatabaseDEFINES {listenername : STRING;listenerstate : STRING;
severity: default = CRITICAL;};END
Oracle_Unknown_ListenerStateTEC_CLASS :Oracle_Unknown_ListenerState ISA Oracle_DatabaseDEFINES {listenername : STRING;listenerstate : STRING;errormsg : STRING;
severity: default = CRITICAL;};END
OracleLock resource modelOracle_High_Deadlocks
TEC_CLASS :Oracle_High_Deadlocks ISA Oracle_InstanceDEFINES {
instancename : STRING;threshold : REAL;deadlocks : REAL;
severity: default = CRITICAL;};END
Oracle_High_DMLLocksPercentage
Appendix D. Tivoli Enterprise Console classes 499

TEC_CLASS :Oracle_High_DMLLocksPercentage ISA Oracle_InstanceDEFINES {
instancename : STRING;threshold : REAL;dmllockspercentage : REAL;
severity: default = CRITICAL;};END
Oracle_High_EnqueueTimeoutsTEC_CLASS :Oracle_High_EnqueueTimeouts ISA Oracle_InstanceDEFINES {
instancename : STRING;threshold : REAL;enqueuetimeouts : REAL;
severity: default = CRITICAL;};END
Oracle_High_LockCountTEC_CLASS :Oracle_High_LockCount ISA Oracle_InstanceDEFINES {
instancename : STRING;type : STRING;threshold : REAL;lockcount : REAL;
severity: default = CRITICAL;};END
OracleLogEvent resource modelOracle_Log_Event_Category_Zero
TEC_CLASS :Oracle_Log_Event_Category_Zero ISA Oracle_InstanceDEFINES {data1: INTEGER;data2: STRING;instancename : STRING;filename : STRING;text : STRING;offset : REAL;logeventseverity : REAL;
severity: default = FATAL;};END
Oracle_Log_Event_Category_OneTEC_CLASS :Oracle_Log_Event_Category_One ISA Oracle_InstanceDEFINES {data1: INTEGER;data2: STRING;instancename : STRING;filename : STRING;text : STRING;offset : REAL;logeventseverity : REAL;
500 IBM Tivoli Monitoring for Databases: Oracle: Reference Guide

severity: default = CRITICAL;};END
Oracle_Log_Event_Category_TwoTEC_CLASS :Oracle_Log_Event_Category_Two ISA Oracle_InstanceDEFINES {data1: INTEGER;data2: STRING;instancename : STRING;filename : STRING;text : STRING;offset : REAL;logeventseverity : REAL;
severity: default = MINOR;};END
Oracle_Log_Event_Category_ThreeTEC_CLASS :Oracle_Log_Event_Category_Three ISA Oracle_InstanceDEFINES {data1: INTEGER;data2: STRING;instancename : STRING;filename : STRING;text : STRING;offset : REAL;logeventseverity : REAL;
severity: default = WARNING;};END
Oracle_Log_Event_Category_FourTEC_CLASS :Oracle_Log_Event_Category_Four ISA Oracle_InstanceDEFINES {data1: INTEGER;data2: STRING;instancename : STRING;filename : STRING;text : STRING;offset : REAL;logeventseverity : REAL;
severity: default = HARMLESS;};END
OracleMaximumExtents resource modelOracle_Low_FreeExtents
TEC_CLASS :Oracle_Low_FreeExtents ISA Oracle_DatabaseDEFINES {tablespacename : STRING;databasename : STRING;segmentname : STRING;segmentowner : STRING;segmenttype : STRING;freeextents : REAL;maxextents : REAL;currentextents : REAL;
Appendix D. Tivoli Enterprise Console classes 501

threshold : REAL;
severity: default = CRITICAL;};END
OracleMaximumExtentsByTablespace resource modelOracle_Low_FreeExtentsByTablespace
TEC_CLASS :Oracle_Low_FreeExtentsByTablespace ISA Oracle_DatabaseDEFINES {tablespacename : STRING;segmentowner : STRING;segmenttype : STRING;segmentname : STRING;databasename : STRING;freeextents : REAL;currentextents : REAL;maxextents : REAL;pctextentsallocated : REAL;threshold : REAL;
severity: default = CRITICAL;};END
OracleMaximumExtentsByUser resource modelOracle_Low_FreeExtentsByUser
TEC_CLASS :Oracle_Low_FreeExtentsByUser ISA Oracle_DatabaseDEFINES {segmentname : STRING;segmenttype : STRING;tablespacename : STRING;segmentowner : STRING;databasename : STRING;freeextents : REAL;currentextents : REAL;maxextents : REAL;pctextentsallocated : REAL;threshold : REAL;
severity: default = CRITICAL;};END
OracleMTS resource modelOracle_High_DispatcherBusyPercentage
TEC_CLASS :Oracle_High_DispatcherBusyPercentage ISA Oracle_InstanceDEFINES {protocol : STRING;busypercentage : REAL;threshold : REAL;
severity: default = CRITICAL;};END
Oracle_High_DispatcherWaitTimeTEC_CLASS :Oracle_High_DispatcherWaitTime ISA Oracle_InstanceDEFINES {
502 IBM Tivoli Monitoring for Databases: Oracle: Reference Guide

protocol : STRING;dispatcherwaittime : REAL;threshold : REAL;
severity: default = CRITICAL;};END
Oracle_High_SharedServerProcessHWMPercentageTEC_CLASS :Oracle_High_SharedServerProcessHWMPercentage ISA Oracle_InstanceDEFINES {instancename : STRING;threshold : REAL;sharedserverprocesshwmpercentage : REAL;
severity: default = CRITICAL;};END
Oracle_High_SharedServerProcessPercentageTEC_CLASS :Oracle_High_SharedServerProcessPercentage ISA Oracle_InstanceDEFINES {instancename : STRING;sharedserverprocesspercentage : REAL;threshold : REAL;
severity: default = CRITICAL;};END
Oracle_High_SharedServerRequestQueueWaitTimeTEC_CLASS :Oracle_High_SharedServerRequestQueueWaitTime ISA Oracle_InstanceDEFINES {instancename : STRING;threshold : REAL;sharedserverwaittime : REAL;
severity: default = CRITICAL;};END
OracleOtherPerformance resource modelOracle_High_ChangedBlockPercentage
TEC_CLASS :Oracle_High_ChangedBlockPercentage ISA Oracle_InstanceDEFINES {instancename : STRING;threshold : REAL;changedblockpercentage : REAL;
severity: default = CRITICAL;};END
Oracle_High_FreelistWaitsRatioTEC_CLASS :Oracle_High_FreelistWaitsRatio ISA Oracle_InstanceDEFINES {instancename : STRING;threshold : REAL;freelistwaitsratio : REAL;
Appendix D. Tivoli Enterprise Console classes 503

severity: default = CRITICAL;};END
Oracle_High_OpenCursorsTEC_CLASS :Oracle_High_OpenCursors ISA Oracle_InstanceDEFINES {username : STRING;server : STRING;logontime : STRING;process : STRING;lockwaittime : STRING;processaddress : STRING;program : STRING;lockwait : STRING;accessobject : STRING;type : STRING;accessowner : STRING;osuser : STRING;machine : STRING;sqlhashvalue : STRING;sqltext : STRING;sqladdress : STRING;instancename : STRING;sessionstatus : STRING;sessionid : REAL;threshold : REAL;opencursors : REAL;opencursorspercentage : REAL;
severity: default = CRITICAL;};END
Oracle_High_ProcessPercentageTEC_CLASS :Oracle_High_ProcessPercentage ISA Oracle_InstanceDEFINES {instancename : STRING;threshold : REAL;processpercentage : REAL;
severity: default = CRITICAL;};END
Oracle_High_SessionPercentageTEC_CLASS :Oracle_High_SessionPercentage ISA Oracle_InstanceDEFINES {instancename : STRING;threshold : REAL;sessionpercentage : REAL;
severity: default = CRITICAL;};END
Oracle_High_SortOverflowPercentageTEC_CLASS :Oracle_High_SortOverflowPercentage ISA Oracle_InstanceDEFINES {instancename : STRING;threshold : REAL;sortoverflowpercentage : REAL;
504 IBM Tivoli Monitoring for Databases: Oracle: Reference Guide

severity: default = CRITICAL;};END
Oracle_High_SysStatTEC_CLASS :Oracle_High_SysStat ISA Oracle_InstanceDEFINES {instancename : STRING;statname : STRING;threshold : REAL;value : REAL;classnumber : REAL;
severity: default = CRITICAL;};END
Oracle_Low_BlockGetRateTEC_CLASS :Oracle_Low_BlockGetRate ISA Oracle_InstanceDEFINES {instancename : STRING;threshold : REAL;blockgetrate : REAL;
severity: default = CRITICAL;};END
Oracle_Low_SysStatTEC_CLASS :Oracle_Low_SysStat ISA Oracle_InstanceDEFINES {instancename : STRING;statname : STRING;threshold : REAL;classnumber : REAL;value : REAL;
severity: default = CRITICAL;};END
Oracle_Unavailable_HeterogeneousAgentTEC_CLASS :Oracle_Unavailable_HeterogeneousAgent ISA Oracle_InstanceDEFINES {instancename : STRING;agenttype : STRING;program : STRING;machine : STRING;osuser : STRING;processid : STRING;agentid : REAL;runningdays : REAL;
severity: default = CRITICAL;};END
OracleOtherStorage resource modelOracle_High_ClusterChainedRows
Appendix D. Tivoli Enterprise Console classes 505
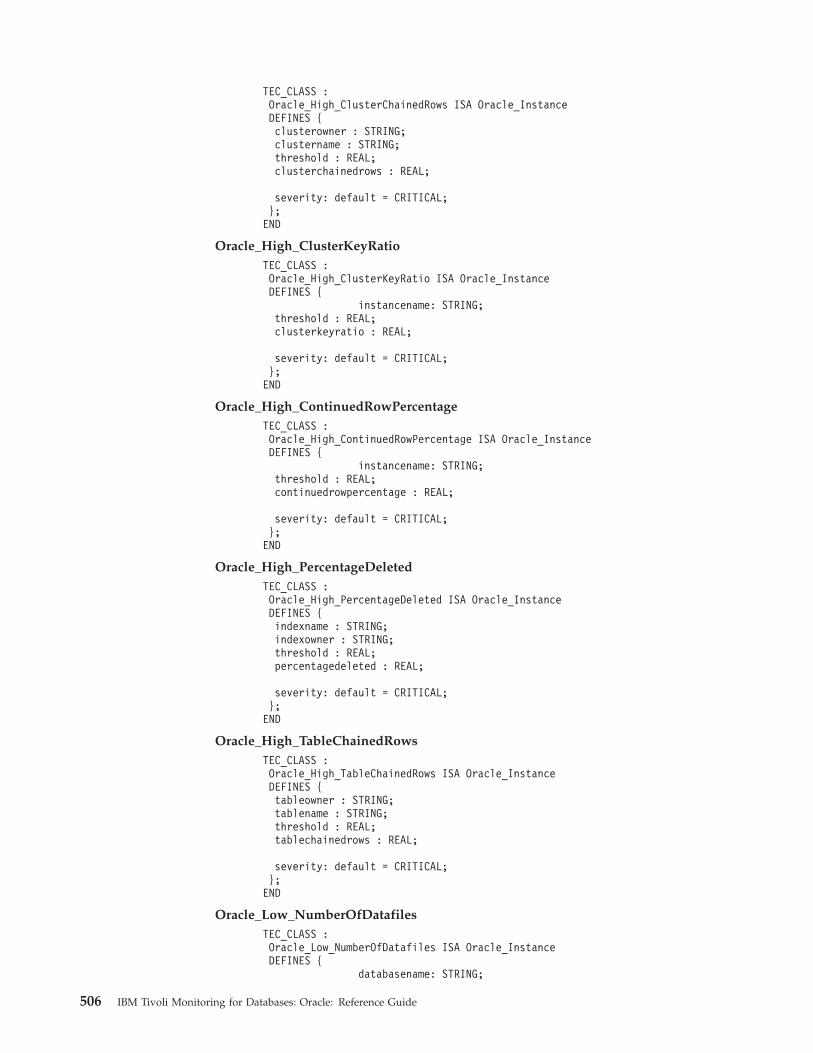
TEC_CLASS :Oracle_High_ClusterChainedRows ISA Oracle_InstanceDEFINES {clusterowner : STRING;clustername : STRING;threshold : REAL;clusterchainedrows : REAL;
severity: default = CRITICAL;};END
Oracle_High_ClusterKeyRatioTEC_CLASS :Oracle_High_ClusterKeyRatio ISA Oracle_InstanceDEFINES {
instancename: STRING;threshold : REAL;clusterkeyratio : REAL;
severity: default = CRITICAL;};END
Oracle_High_ContinuedRowPercentageTEC_CLASS :Oracle_High_ContinuedRowPercentage ISA Oracle_InstanceDEFINES {
instancename: STRING;threshold : REAL;continuedrowpercentage : REAL;
severity: default = CRITICAL;};END
Oracle_High_PercentageDeletedTEC_CLASS :Oracle_High_PercentageDeleted ISA Oracle_InstanceDEFINES {indexname : STRING;indexowner : STRING;threshold : REAL;percentagedeleted : REAL;
severity: default = CRITICAL;};END
Oracle_High_TableChainedRowsTEC_CLASS :Oracle_High_TableChainedRows ISA Oracle_InstanceDEFINES {tableowner : STRING;tablename : STRING;threshold : REAL;tablechainedrows : REAL;
severity: default = CRITICAL;};END
Oracle_Low_NumberOfDatafilesTEC_CLASS :Oracle_Low_NumberOfDatafiles ISA Oracle_InstanceDEFINES {
databasename: STRING;
506 IBM Tivoli Monitoring for Databases: Oracle: Reference Guide

numberofdatafiles : REAL;threshold : REAL;
severity: default = CRITICAL;};END
OraclePGA resource modelOracle_High_PGAMultipassExecutions
TEC_CLASS :Oracle_High_PGAMultipassExecutions ISA Oracle_InstanceDEFINES {databasename : STRING;instancename : STRING;pgamultipassexecutions : REAL;threshold : REAL;
severity: default = CRITICAL;};END
Oracle_High_PGAOptimalPercentageTEC_CLASS :Oracle_High_PGAOptimalPercentage ISA Oracle_InstanceDEFINES {databasename : STRING;instancename : STRING;pgaoptimalpercentage : REAL;threshold : REAL;
severity: default = CRITICAL;};END
Oracle_Low_PGAComponentAreaTEC_CLASS :Oracle_Low_PGAComponentArea ISA Oracle_InstanceDEFINES {databasename : STRING;instancename : STRING;pgacomponentarea : REAL;threshold : REAL;
severity: default = CRITICAL;};END
Oracle_Low_PGAWorkAreaMaxSizeTEC_CLASS :Oracle_Low_PGAWorkAreaMaxSize ISA Oracle_InstanceDEFINES {databasename : STRING;instancename : STRING;pgaworkareamaxsize : REAL;threshold : REAL;
severity: default = CRITICAL;};END
Oracle_Low_PGAWorkAreaPercentageTEC_CLASS :Oracle_Low_PGAWorkAreaPercentage ISA Oracle_InstanceDEFINES {databasename : STRING;instancename : STRING;
Appendix D. Tivoli Enterprise Console classes 507

pgaworkareapercentage : REAL;threshold : REAL;
severity: default = CRITICAL;};END
OracleProcessState resource modelOracle_Low_Processes
TEC_CLASS :Oracle_Low_Processes ISA Oracle_InstanceDEFINES {instancename : STRING;processname : STRING;threshold : REAL;numrunning : REAL;
severity: default = WARNING;};END
Oracle_Unavailable_ProcessTEC_CLASS :Oracle_Unavailable_Process ISA Oracle_InstanceDEFINES {instancename : STRING;processname : STRING;
severity: default = CRITICAL;};END
OracleRDBMSState resource modelOracle_Becomes_Available_RDBMSState
TEC_CLASS :Oracle_Becomes_Available_RDBMSState ISA Oracle_InstanceDEFINES {instancename : STRING;state : STRING;previousstate : STRING;
severity: default = HARMLESS;};END
Oracle_Becomes_Shutdown_RDBMSStateTEC_CLASS :Oracle_Becomes_Shutdown_RDBMSState ISA Oracle_InstanceDEFINES {instancename : STRING;state : STRING;previousstate : STRING;
severity: default = CRITICAL;};END
Oracle_Becomes_Suspect_RDBMSStateTEC_CLASS :Oracle_Becomes_Suspect_RDBMSState ISA Oracle_InstanceDEFINES {instancename : STRING;state : STRING;previousstate : STRING;
508 IBM Tivoli Monitoring for Databases: Oracle: Reference Guide
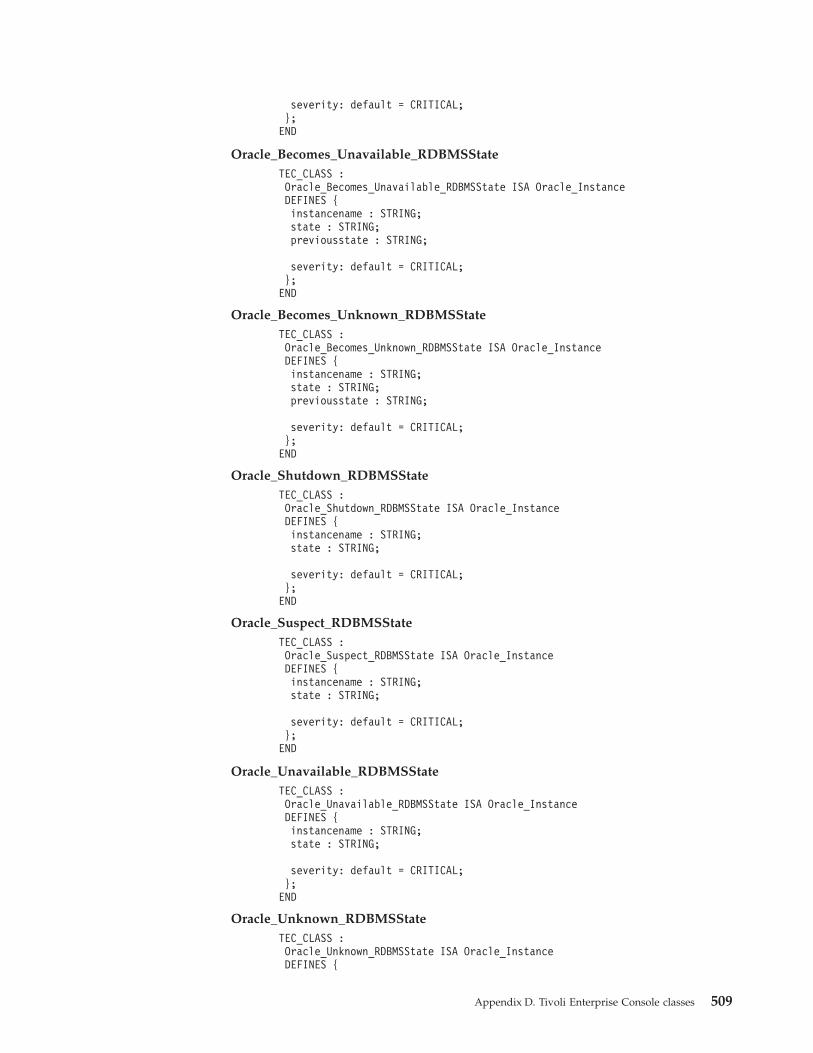
severity: default = CRITICAL;};END
Oracle_Becomes_Unavailable_RDBMSStateTEC_CLASS :Oracle_Becomes_Unavailable_RDBMSState ISA Oracle_InstanceDEFINES {instancename : STRING;state : STRING;previousstate : STRING;
severity: default = CRITICAL;};END
Oracle_Becomes_Unknown_RDBMSStateTEC_CLASS :Oracle_Becomes_Unknown_RDBMSState ISA Oracle_InstanceDEFINES {instancename : STRING;state : STRING;previousstate : STRING;
severity: default = CRITICAL;};END
Oracle_Shutdown_RDBMSStateTEC_CLASS :Oracle_Shutdown_RDBMSState ISA Oracle_InstanceDEFINES {instancename : STRING;state : STRING;
severity: default = CRITICAL;};END
Oracle_Suspect_RDBMSStateTEC_CLASS :Oracle_Suspect_RDBMSState ISA Oracle_InstanceDEFINES {instancename : STRING;state : STRING;
severity: default = CRITICAL;};END
Oracle_Unavailable_RDBMSStateTEC_CLASS :Oracle_Unavailable_RDBMSState ISA Oracle_InstanceDEFINES {instancename : STRING;state : STRING;
severity: default = CRITICAL;};END
Oracle_Unknown_RDBMSStateTEC_CLASS :Oracle_Unknown_RDBMSState ISA Oracle_InstanceDEFINES {
Appendix D. Tivoli Enterprise Console classes 509

instancename : STRING;state : STRING;
severity: default = CRITICAL;};END
OracleRecursiveCalls resource modelOracle_High_IntervalRecursiveCallPercentage
TEC_CLASS :Oracle_High_IntervalRecursiveCallPercentage ISA Oracle_InstanceDEFINES {instancename : STRING;
threshold : STRING;intervalrecursivecallpercentage : REAL;
severity: default = CRITICAL;};END
Oracle_High_RecursiveCallPercentageTEC_CLASS :Oracle_High_RecursiveCallPercentage ISA Oracle_InstanceDEFINES {instancename : STRING;
threshold : STRING;recursivecallpercentage : REAL;
severity: default = CRITICAL;};END
Oracle_High_RecursiveCallRateTEC_CLASS :Oracle_High_RecursiveCallRate ISA Oracle_InstanceDEFINES {instancename : STRING;
threshold : STRING;recursivecallrate : REAL;
severity: default = CRITICAL;};END
Oracle_High_RecursiveToUserCallsRatioTEC_CLASS :Oracle_High_RecursiveToUserCallsRatio ISA Oracle_InstanceDEFINES {instancename : STRING;
threshold : STRING;recursivetousercallsratio : REAL;
severity: default = CRITICAL;};END
OracleRedoLog resource modelOracle_High_AvgRedoEntrySize
TEC_CLASS :Oracle_High_AvgRedoEntrySize ISA Oracle_InstanceDEFINES {databasename : STRING;instancename : STRING;avgredoentrysize : REAL;
510 IBM Tivoli Monitoring for Databases: Oracle: Reference Guide

threshold : REAL;
severity: default = CRITICAL;};END
Oracle_High_IntervalRedoLogSpaceWaitsTEC_CLASS :Oracle_High_IntervalRedoLogSpaceWaits ISA Oracle_InstanceDEFINES {databasename : STRING;instancename : STRING;intervalredologspacewaits : REAL;threshold : REAL;
severity: default = CRITICAL;};END
Oracle_High_RedoAllocationLatchPercentageTEC_CLASS :Oracle_High_RedoAllocationLatchPercentage ISA Oracle_InstanceDEFINES {databasename : STRING;instancename : STRING;redoallocationlatchpercentage : REAL;threshold : REAL;
severity: default = CRITICAL;};END
Oracle_High_RedoCopyLatchPercentageTEC_CLASS :Oracle_High_RedoCopyLatchPercentage ISA Oracle_InstanceDEFINES {databasename : STRING;instancename : STRING;redocopylatchpercentage : REAL;threshold : REAL;
severity: default = CRITICAL;};END
Oracle_High_RedoCopyLatchPercentageIncreaseTEC_CLASS :Oracle_High_RedoCopyLatchPercentageIncrease ISA Oracle_InstanceDEFINES {databasename : STRING;instancename : STRING;redocopylatchpercentageincrease : REAL;threshold : REAL;
severity: default = CRITICAL;};END
Oracle_High_RedoLogsNotArchivedTEC_CLASS :Oracle_High_RedoLogsNotArchived ISA Oracle_InstanceDEFINES {databasename : STRING;instancename : STRING;redologsnotarchived : REAL;threshold : REAL;
Appendix D. Tivoli Enterprise Console classes 511

severity: default = CRITICAL;};END
Oracle_High_RedoSmallCopyPercentageTEC_CLASS :Oracle_High_RedoSmallCopyPercentage ISA Oracle_InstanceDEFINES {databasename : STRING;instancename : STRING;redosmallcopypercentage : REAL;threshold : REAL;
severity: default = CRITICAL;};END
OracleRollbackSegment resource modelOracle_High_ConsistentChangePercentage
TEC_CLASS :Oracle_High_ConsistentChangePercentage ISA Oracle_InstanceDEFINES {databasename : STRING;instancename : STRING;consistentchangepercentage : REAL;threshold : REAL;
severity: default = CRITICAL;};END
Oracle_High_RollbackWaitsPercentageTEC_CLASS :Oracle_High_RollbackWaitsPercentage ISA Oracle_InstanceDEFINES {databasename : STRING;instancename : STRING;rollbackwaitspercentage : REAL;threshold : REAL;
severity: default = WARNING;};END
Oracle_High_UserRollbackPercentageTEC_CLASS :Oracle_High_UserRollbackPercentage ISA Oracle_InstanceDEFINES {databasename : STRING;userrollbackpercentage : REAL;threshold : REAL;
severity: default = CRITICAL;};END
OracleSGA resource modelOracle_High_BufferCacheHitPercentage
TEC_CLASS :Oracle_High_BufferCacheHitPercentage ISA Oracle_InstanceDEFINES {databasename : STRING;instancename : STRING;
512 IBM Tivoli Monitoring for Databases: Oracle: Reference Guide

buffercachehitpercentage : REAL;threshold : REAL;
severity: default = CRITICAL;};END
Oracle_High_BufferWaitsPercentageTEC_CLASS :Oracle_High_BufferWaitsPercentage ISA Oracle_InstanceDEFINES {databasename : STRING;instancename : STRING;bufferwaitspercentage : REAL;threshold : REAL;
severity: default = CRITICAL;};END
Oracle_High_DictionaryCacheHitPercentageTEC_CLASS :Oracle_High_DictionaryCacheHitPercentage ISA Oracle_InstanceDEFINES {databasename : STRING;instancename : STRING;dictionarycachehitpercentage : REAL;threshold : REAL;
severity: default = CRITICAL;};END
Oracle_High_IntervalBufferCacheHitPercentageTEC_CLASS :Oracle_High_IntervalBufferCacheHitPercentage ISA Oracle_InstanceDEFINES {databasename : STRING;instancename : STRING;intervalbuffercachehitpercentage : REAL;threshold : REAL;
severity: default = CRITICAL;};END
Oracle_High_IntervalDictionaryCacheHitPercentageTEC_CLASS :Oracle_High_IntervalDictionaryCacheHitPercentage ISA Oracle_InstanceDEFINES {databasename : STRING;instancename : STRING;intervaldictionarycachehitpercentage : REAL;threshold : REAL;
severity: default = CRITICAL;};END
Oracle_Low_BufferCacheHitPercentageTEC_CLASS :Oracle_Low_BufferCacheHitPercentage ISA Oracle_InstanceDEFINES {databasename : STRING;instancename : STRING;buffercachehitpercentage : REAL;threshold : REAL;
Appendix D. Tivoli Enterprise Console classes 513

severity: default = WARNING;};END
Oracle_Low_KeepCacheHitPercentageTEC_CLASS :Oracle_Low_KeepCacheHitPercentage ISA Oracle_InstanceDEFINES {databasename : STRING;instancename : STRING;keepcachehitpercentage : REAL;threshold : REAL;
severity: default = CRITICAL;};END
Oracle_Low_DictionaryCacheHitPercentageTEC_CLASS :Oracle_Low_DictionaryCacheHitPercentage ISA Oracle_InstanceDEFINES {databasename : STRING;instancename : STRING;dictionarycachehitpercentage : REAL;threshold : REAL;
severity: default = CRITICAL;};END
Oracle_Low_IntervalBufferCacheHitPercentageTEC_CLASS :Oracle_Low_IntervalBufferCacheHitPercentage ISA Oracle_InstanceDEFINES {databasename : STRING;instancename : STRING;intervalbuffercachehitpercentage : REAL;threshold : REAL;
severity: default = CRITICAL;};END
Oracle_Low_IntervalDictionaryCacheHitPercentageTEC_CLASS :Oracle_Low_IntervalDictionaryCacheHitPercentage ISA Oracle_InstanceDEFINES {databasename : STRING;instancename : STRING;intervaldictionarycachehitpercentage : REAL;threshold : REAL;
severity: default = CRITICAL;};END
Oracle_Low_IntervalKeepCacheHitPercentageTEC_CLASS :Oracle_Low_IntervalKeepCacheHitPercentage ISA Oracle_InstanceDEFINES {databasename : STRING;instancename : STRING;keepcachehitpercentage : REAL;threshold : REAL;
514 IBM Tivoli Monitoring for Databases: Oracle: Reference Guide

severity: default = CRITICAL;};END
Oracle_Low_IntervalLibraryCacheHitPercentageTEC_CLASS :Oracle_Low_IntervalLibraryCacheHitPercentage ISA Oracle_InstanceDEFINES {databasename : STRING;instancename : STRING;intervallibrarycachehitpercentage : REAL;threshold : REAL;
severity: default = CRITICAL;};END
Oracle_Low_IntervalRecycleCacheHitPercentageTEC_CLASS :Oracle_Low_IntervalRecycleCacheHitPercentage ISA Oracle_InstanceDEFINES {databasename : STRING;instancename : STRING;intervalrecyclecachehitpercentage : REAL;threshold : REAL;
severity: default = CRITICAL;};END
Oracle_Low_LibraryCacheHitPercentageTEC_CLASS :Oracle_Low_LibraryCacheHitPercentage ISA Oracle_InstanceDEFINES {databasename : STRING;instancename : STRING;librarycachehitpercentage : REAL;threshold : REAL;
severity: default = CRITICAL;};END
Oracle_Low_RecycleCacheHitPercentageTEC_CLASS :Oracle_Low_RecycleCacheHitPercentage ISA Oracle_InstanceDEFINES {databasename : STRING;instancename : STRING;recyclecachehitpercentage : REAL;threshold : REAL;
severity: default = CRITICAL;};END
OracleTemporaryExtents resource modelOracle_Low_FreeTempExtents
TEC_CLASS :Oracle_Low_FreeTempExtents ISA Oracle_DatabaseDEFINES {segmentname : STRING;segmenttype : STRING;segmentowner : STRING;tablespacename : STRING;
Appendix D. Tivoli Enterprise Console classes 515
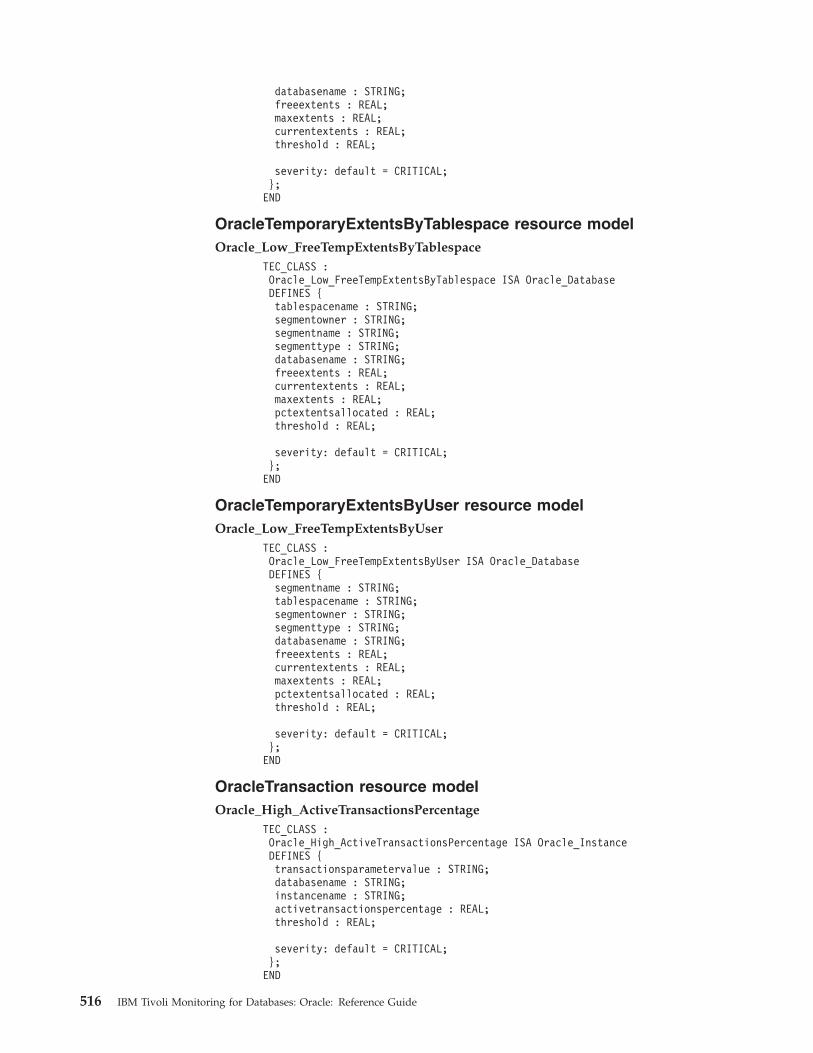
databasename : STRING;freeextents : REAL;maxextents : REAL;currentextents : REAL;threshold : REAL;
severity: default = CRITICAL;};END
OracleTemporaryExtentsByTablespace resource modelOracle_Low_FreeTempExtentsByTablespace
TEC_CLASS :Oracle_Low_FreeTempExtentsByTablespace ISA Oracle_DatabaseDEFINES {tablespacename : STRING;segmentowner : STRING;segmentname : STRING;segmenttype : STRING;databasename : STRING;freeextents : REAL;currentextents : REAL;maxextents : REAL;pctextentsallocated : REAL;threshold : REAL;
severity: default = CRITICAL;};END
OracleTemporaryExtentsByUser resource modelOracle_Low_FreeTempExtentsByUser
TEC_CLASS :Oracle_Low_FreeTempExtentsByUser ISA Oracle_DatabaseDEFINES {segmentname : STRING;tablespacename : STRING;segmentowner : STRING;segmenttype : STRING;databasename : STRING;freeextents : REAL;currentextents : REAL;maxextents : REAL;pctextentsallocated : REAL;threshold : REAL;
severity: default = CRITICAL;};END
OracleTransaction resource modelOracle_High_ActiveTransactionsPercentage
TEC_CLASS :Oracle_High_ActiveTransactionsPercentage ISA Oracle_InstanceDEFINES {transactionsparametervalue : STRING;databasename : STRING;instancename : STRING;activetransactionspercentage : REAL;threshold : REAL;
severity: default = CRITICAL;};END
516 IBM Tivoli Monitoring for Databases: Oracle: Reference Guide

Oracle_High_BlockChangesPerTransactionTEC_CLASS :Oracle_High_BlockChangesPerTransaction ISA Oracle_InstanceDEFINES {databasename : STRING;instancename : STRING;blockchangespertransaction : REAL;threshold : REAL;
severity: default = CRITICAL;};END
Oracle_High_CallRateTEC_CLASS :Oracle_High_CallRate ISA Oracle_InstanceDEFINES {databasename : STRING;instancename : STRING;callrate : REAL;threshold : REAL;
severity: default = CRITICAL;};END
Oracle_High_CallsPerTransactionTEC_CLASS :Oracle_High_CallsPerTransaction ISA Oracle_InstanceDEFINES {databasename : STRING;instancename : STRING;callspertransaction : REAL;threshold : REAL;
severity: default = CRITICAL;};END
Oracle_High_LockWaitTimeTEC_CLASS :Oracle_High_LockWaitTime ISA Oracle_InstanceDEFINES {sessionid : STRING;username : STRING;object : STRING;objectowner : STRING;lockid : STRING;sqltext : STRING;databasename : STRING;instancename : STRING;lockwaittime : REAL;threshold : REAL;
severity: default = CRITICAL;};END
Oracle_High_LongRunningTransactionsTEC_CLASS :Oracle_High_LongRunningTransactions ISA Oracle_InstanceDEFINES {sessionid : STRING;username : STRING;sqltext : STRING;databasename : STRING;
Appendix D. Tivoli Enterprise Console classes 517

instancename : STRING;timerunningseconds : REAL;starttime : REAL;threshold : REAL;
severity: default = CRITICAL;};END
OracleUndoSpace resource modelOracle_High_IntervalNoSpaceErrCnt
TEC_CLASS :Oracle_High_IntervalNoSpaceErrCnt ISA Oracle_InstanceDEFINES {databasename : STRING;instancename : STRING;begintime : STRING;endtime : STRING;intervalnospaceerrcnt : REAL;threshold : REAL;
severity: default = CRITICAL;};END
Oracle_High_IntervalSSOldErrCntTEC_CLASS :Oracle_High_IntervalSSOldErrCnt ISA Oracle_InstanceDEFINES {databasename : STRING;instancename : STRING;begintime : STRING;endtime : STRING;intervalssolderrcnt : REAL;threshold : REAL;
severity: default = CRITICAL;};END
518 IBM Tivoli Monitoring for Databases: Oracle: Reference Guide

Appendix E. Using tokens to customize resource modelparameters
You can customize certain resource models to monitor PeopleSoft and SAP tables,or specific tables and users that you define. This functionality uses tokens to searchfor specific tables or users and is available on all ″By Tablespace″ and ″By User″resource models.
Table 117. Guidelines for using tokens
Goal Refer to
Understand what tokens are and how to usethem
“Understanding tokens” on page 519
View the resource models that use tokens “Determining which resource models usetokens” on page 519
Learn how to create your own token “Creating your own tokens” on page 520
View predefined PeopleSoft and SAP tokens “Viewing tokens for PeopleSoft and SAPtables” on page 521
Understanding tokensTokens are keywords that represent tables or users as specified in the external file,oracle.tokens. IBM Tivoli Monitoring for Databases: Oracle provides a predefinedset of tokens to search for PeopleSoft and SAP tablespaces. See “Viewing tokens forPeopleSoft and SAP tables” on page 521 to view the PeopleSoft and SAP tokens.
You can also create your own token in the oracle.tokens file to monitor a set oftablespaces or users. See “Creating your own tokens” on page 520 for instructionson how to create a token. You can create tokens for any of the ″By Tablespace″ or″By User″ resource models.
For example, if you were to edit the file and add the following token and itscontents:EastCoast = Jones, Garcia, Johnson, Parker, Hansen
then you have created a token representing a set of users. You can input the token″EastCoast″ in the ″User Name″ parameter in any ″By User″ resource model, and itwould expand the monitoring capability to include the users defined in the″EastCoast″ token.
Determining which resource models use tokensThe following resource models enable you to use tokens to search for specifiedtablespaces or users:v Extents by Tablespacev Extents by Userv Free Space Deficit by Tablespacev Free Space Deficit by Userv Free Space Fragmentation by Tablespacev Free Tablespace by Tablespace
519

v Maximum Extents by Tablespacev Maximum Extents by Userv Temporary Extents by Tablespacev Temporary Extents by User
These resource models have a parameter called either ″Tablespace Names″ or ″UserName″ in which you can input a token to be monitored.
Creating your own tokensDo the following to create your own token:1. Open the oracle.tokens file.
Additional Information: There are two locations for the oracle.tokens file:v On each gateway:
$BINDIR/../lcf_bundle.40/generic/ITM/PACS/ORACLE/oracle.tokens.Editing this file updates all endpoints.—OR—
v On each endpoint where the databases have been discovered:$LCF_DATDIR/LCFNEW/ITM/PACS/Oracle/oracle.tokens. Editing this fileupdates only the endpoint on which you edit the file.
2. Edit the file by doing the following.a. Type the token, or keyword name that will represent a set of tables or users.b. Type ″=″ following the token name.c. Type any table or user names to be monitored, separated by commas.
Additional Information: Do not use the ″/,″ or ″#″ symbols in the contents ofthe token.
3. Optional: If the oracle.tokens file was edited on a gateway, push the file out tothe endpoint by doing one of the following:v Run OracleDiscovery on the endpoint.
—OR—v Run
idlcall <OID of the OracleInstanceManager object> InitializeEndpoint
Additional Information: You can determine the object identifier (OID) with thefollowing command:wlookup –ar OracleInstanceManager
4. Optional: If IBM Tivoli Monitoring is currently running on the endpoint, youmust restart the IBM Tivoli Monitoring engine for the new tokens to take effect.Additional Information: Restart the engine on a Unix or Windows operatingsystem with one of the following commands:v Unix:
wdmcmd -stop -e <endpoint>wdmcmd -restart -e <endpoint>
—OR—v Windows:
wdmcmd -stop -e <endpoint>net stop winmgmtwdmcmd -restart -e <endpoint>
520 IBM Tivoli Monitoring for Databases: Oracle: Reference Guide

5. Insert the token in the appropriate ″By Tablespace″ or ″By User″ resource modelin the ″Tablespace Name″ or ″User Name″ parameter to begin monitoring thecontents of the token.
Viewing tokens for PeopleSoft and SAP tablesThe tokens predefined in the oracle.tokens file specify sets of PeopleSoft or SAPtables. You can use these tokens in any of the “By Tablespace” resource models. Ifyou specify the token in the ″Tablespace Name″ parameter, it expands to includemonitoring of all of the associated tables.
PeopleSoft tables with predefined tokens include:v All PeopleSoft tablesv PeopleSoft Payroll tablesv PeopleSoft Human resource tablesv PeopleSoft Base benefits tables
SAP tables with predefined tokens include:v Largest SAP tablesv SAP Sales and distribution tablesv Default SAP tablespaces
All PeopleSoft tablesToken PeopleSoftAllTables
Tables PS_EMPLOYEES, PS_EMPLOYEES_LNG, PS_EMPLOYMENT,PS_EMPLOYMENT_LNG, PS_EMPLOYMENT_LNG1,PS_EMPLOYMENT_LNG2, PS_EMPLOYMENT_LNG3,PS_HS_EMPLOYMENT, PS_HS_EMPL_REL_CAN,PS_HS_EMPL_REL_LNG, PS_HS_EMPL_SUB_CAN,PS_HS_EMPL_SUB_LNG, PS_INJ_CLMADDR_CAN, PS_JOB,PS_PERSONAL_DATA, PS_PERSONL_DTA_LNG, PS_PERS_DATA_AET,PS_PERS_DATA_EFFDT, PS_PERS_DTAEFF_LNG, PS_PERS_NID,PS_JOB_EARNS_DIST, PS_JOB_APPROVALS, PS_STATE_TAX_DATA,PS_GENL_DEDUCTION, PS_BAL_ADJ_UI_CAN, PS_CAN_CHECK_YTD,PS_CAN_DED_BALANCE, PS_CAN_ERN_BALANCE,PS_CAN_TAX_BALANCE, PS_CAN_TAX_DATA, PS_CHECK_YTD,PS_DEDUCTION_BAL, PS_EARNINGS_BAL, PS_FED_TAX_DATA,PS_TAX_BALANCE, PS_LOCAL_TAX_DATA, PS_BAL_ADJ_ARR,PS_BAL_ADJ_CHK, PS_BAL_ADJ_CN_CHK, PS_BAL_ADJ_CN_DED,PS_BAL_ADJ_CN_ERN, PS_BAL_ADJ_CN_TAX, PS_BAL_ADJ_DED,PS_BAL_ADJ_ERN, PS_BAL_ADJ_GRN, PS_BAL_ADJ_TAX,PS_DED_ARREARS, PS_GARN_RULE, PS_GARN_SCHED,PS_GARN_SPEC, PS_GENL_DED_CD, PS_BAS_PARTIC,PS_BAS_PARTIC_COST, PS_BAS_PARTIC_DPND, PS_BAS_PARTIC_INVT,PS_BAS_PARTIC_OPTN, PS_BAS_PARTIC_PLAN, PS_BENEF_COMMENT,PS_BEN_PROG_PARTIC, PS_DEPENDENT_BENEF, PS_DISABILITY_BEN,PS_FSA_BENEFIT, PS_FSA_PAYMENT, PS_HEALTH_BENEFIT,PS_HEALTH_DEPENDNT, PS_LEAVE_ACCRUAL, PS_LEAVE_PLAN,PS_LIFE_ADD_BEN, PS_LIFE_ADD_BENEFC, PS_PENSION_BENEFC,PS_PENSION_PLAN, PS_RTRMNT_PLAN, PS_SAVINGS_BENEFIC,PS_SAVINGS_INVEST, PS_SAVINGS_PLAN, PS_VACATION_BEN
Appendix E. Using tokens to customize resource model parameters 521
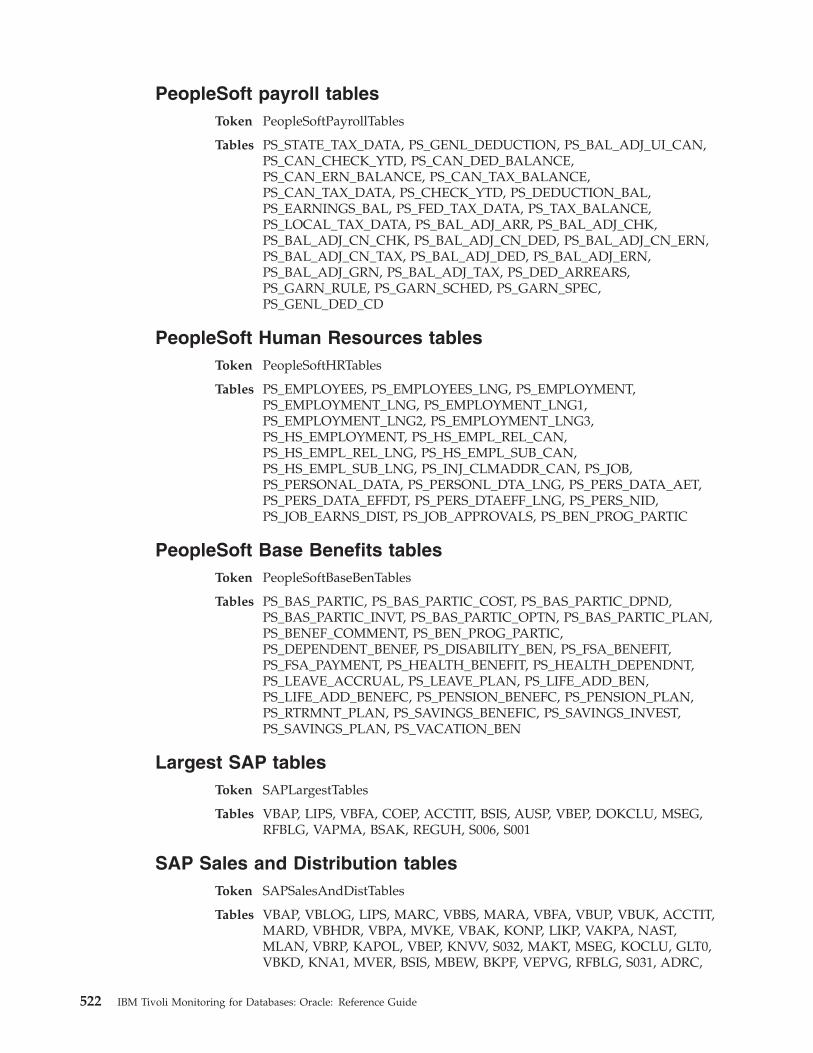
PeopleSoft payroll tablesToken PeopleSoftPayrollTables
Tables PS_STATE_TAX_DATA, PS_GENL_DEDUCTION, PS_BAL_ADJ_UI_CAN,PS_CAN_CHECK_YTD, PS_CAN_DED_BALANCE,PS_CAN_ERN_BALANCE, PS_CAN_TAX_BALANCE,PS_CAN_TAX_DATA, PS_CHECK_YTD, PS_DEDUCTION_BAL,PS_EARNINGS_BAL, PS_FED_TAX_DATA, PS_TAX_BALANCE,PS_LOCAL_TAX_DATA, PS_BAL_ADJ_ARR, PS_BAL_ADJ_CHK,PS_BAL_ADJ_CN_CHK, PS_BAL_ADJ_CN_DED, PS_BAL_ADJ_CN_ERN,PS_BAL_ADJ_CN_TAX, PS_BAL_ADJ_DED, PS_BAL_ADJ_ERN,PS_BAL_ADJ_GRN, PS_BAL_ADJ_TAX, PS_DED_ARREARS,PS_GARN_RULE, PS_GARN_SCHED, PS_GARN_SPEC,PS_GENL_DED_CD
PeopleSoft Human Resources tablesToken PeopleSoftHRTables
Tables PS_EMPLOYEES, PS_EMPLOYEES_LNG, PS_EMPLOYMENT,PS_EMPLOYMENT_LNG, PS_EMPLOYMENT_LNG1,PS_EMPLOYMENT_LNG2, PS_EMPLOYMENT_LNG3,PS_HS_EMPLOYMENT, PS_HS_EMPL_REL_CAN,PS_HS_EMPL_REL_LNG, PS_HS_EMPL_SUB_CAN,PS_HS_EMPL_SUB_LNG, PS_INJ_CLMADDR_CAN, PS_JOB,PS_PERSONAL_DATA, PS_PERSONL_DTA_LNG, PS_PERS_DATA_AET,PS_PERS_DATA_EFFDT, PS_PERS_DTAEFF_LNG, PS_PERS_NID,PS_JOB_EARNS_DIST, PS_JOB_APPROVALS, PS_BEN_PROG_PARTIC
PeopleSoft Base Benefits tablesToken PeopleSoftBaseBenTables
Tables PS_BAS_PARTIC, PS_BAS_PARTIC_COST, PS_BAS_PARTIC_DPND,PS_BAS_PARTIC_INVT, PS_BAS_PARTIC_OPTN, PS_BAS_PARTIC_PLAN,PS_BENEF_COMMENT, PS_BEN_PROG_PARTIC,PS_DEPENDENT_BENEF, PS_DISABILITY_BEN, PS_FSA_BENEFIT,PS_FSA_PAYMENT, PS_HEALTH_BENEFIT, PS_HEALTH_DEPENDNT,PS_LEAVE_ACCRUAL, PS_LEAVE_PLAN, PS_LIFE_ADD_BEN,PS_LIFE_ADD_BENEFC, PS_PENSION_BENEFC, PS_PENSION_PLAN,PS_RTRMNT_PLAN, PS_SAVINGS_BENEFIC, PS_SAVINGS_INVEST,PS_SAVINGS_PLAN, PS_VACATION_BEN
Largest SAP tablesToken SAPLargestTables
Tables VBAP, LIPS, VBFA, COEP, ACCTIT, BSIS, AUSP, VBEP, DOKCLU, MSEG,RFBLG, VAPMA, BSAK, REGUH, S006, S001
SAP Sales and Distribution tablesToken SAPSalesAndDistTables
Tables VBAP, VBLOG, LIPS, MARC, VBBS, MARA, VBFA, VBUP, VBUK, ACCTIT,MARD, VBHDR, VBPA, MVKE, VBAK, KONP, LIKP, VAKPA, NAST,MLAN, VBRP, KAPOL, VBEP, KNVV, S032, MAKT, MSEG, KOCLU, GLT0,VBKD, KNA1, MVER, BSIS, MBEW, BKPF, VEPVG, RFBLG, S031, ADRC,
522 IBM Tivoli Monitoring for Databases: Oracle: Reference Guide

KNVD, TMC4, NRIV_LOKAL, BSIM, T683S, NRIV, TFDIR, ADRV, T160M,ADRCT, ADRG, KNVP, BSID, ACCTCR, CDCLS, KNVI, VBRK, M_VMVL,CKMI1, VEDA, EUDB, VBUV, KNEX, RF048, RSMPTEXTS, VF_DEBI,VKDFS, KNB1, MKPF, CDHDR, ACCTHD, J_1AINFMET, VLKPA, SADR,VRKPA, WRF3, LIPSDG, VBEX, INDX, KNC1, M_VMCF
Default SAP TablespacesToken SAPDefaultTablespaces
Tables PSAPBTABD, PSAPDICTD, PSAPDOCUD, PSAPSTABD, PSAPLOADD,PSAPPOOLD, PSAPVB0101D, PSAPVB0102D, PSAPPROTD, PSAPCLUD,PSAPUSERID, PSAPSOURCED, PSAPVB0201D, PSAPVB0202D
Appendix E. Using tokens to customize resource model parameters 523

524 IBM Tivoli Monitoring for Databases: Oracle: Reference Guide

Appendix F. Notices
This information was developed for products and services offered in the U.S.A.IBM may not offer the products, services, or features discussed in this document inother countries. Consult your local IBM representative for information on theproducts and services currently available in your area. Any reference to an IBMproduct, program, or service is not intended to state or imply that only that IBMproduct, program, or service may be used. Any functionally equivalent product,program, or service that does not infringe any IBM intellectual property right maybe used instead. However, it is the user’s responsibility to evaluate and verify theoperation of any non-IBM product, program, or service.
IBM may have patents or pending patent applications covering subject matterdescribed in this document. The furnishing of this document does not give youany license to these patents.You can send license inquiries, in writing, to:
IBM Director of Licensing
IBM Corporation
North Castle Drive
Armonk, NY 10504-1785 U.S.A.
For license inquiries regarding double-byte (DBCS) information, contact the IBMIntellectual Property Department in your country or send inquiries, in writing, to:
IBM World Trade Asia Corporation
Licensing
2-31 Roppongi 3-chome, Minato-ku
Tokyo 106, Japan
The following paragraph does not apply to the United Kingdom or any othercountry where such provisions are inconsistent with local law:
INTERNATIONAL BUSINESS MACHINES CORPORATION PROVIDES THISPUBLICATION ″AS IS″ WITHOUT WARRANTY OF ANY KIND, EITHEREXPRESS OR IMPLIED, INCLUDING, BUT NOT LIMITED TO, THE IMPLIEDWARRANTIES OF NON-INFRINGEMENT, MERCHANTABILITY OR FITNESSFOR A PARTICULAR PURPOSE.
Some states do not allow disclaimer of express or implied warranties in certaintransactions, therefore, this statement might not apply to you.
This information could include technical inaccuracies or typographical errors.Changes are periodically made to the information herein; these changes will beincorporated in new editions of the publication. IBM may make improvementsand/or changes in the product(s) and/or the program(s) described in thispublication at any time without notice.
525

Any references in this information to non-IBM Web sites are provided forconvenience only and do not in any manner serve as an endorsement of those Websites. The materials at those Web sites are not part of the materials for this IBMproduct and use of those Web sites is at your own risk.
IBM may use or distribute any of the information you supply in any way itbelieves appropriate without incurring any obligation to you.
Licensees of this program who wish to have information about it for the purposeof enabling: (i) the exchange of information between independently createdprograms and other programs (including this one) and (ii) the mutual use of theinformation which has been exchanged, should contact:
IBM Corporation
2Z4A/101
11400 Burnet Road
Austin, TX 78758 U.S.A.
Such information may be available, subject to appropriate terms and conditions,including in some cases payment of a fee.
The licensed program described in this document and all licensed materialavailable for it are provided by IBM under terms of the IBM Customer Agreement,IBM International Program License Agreement or any equivalent agreementbetween us.
Any performance data contained herein was determined in a controlledenvironment. Therefore, the results obtained in other operating environments mayvary significantly. Some measurements may have been made on development-levelsystems and there is no guarantee that these measurements will be the same ongenerally available systems. Furthermore, some measurement may have beenestimated through extrapolation. Actual results may vary. Users of this documentshould verify the applicable data for their specific environment.
Information concerning non-IBM products was obtained from the suppliers ofthose products, their published announcements or other publicly available sources.IBM has not tested those products and cannot confirm the accuracy ofperformance, compatibility or any other claims related to non-IBM products.Questions on the capabilities of non-IBM products should be addressed to thesuppliers of those products.
All statements regarding IBM’s future direction or intent are subject to change orwithdrawal without notice, and represent goals and objectives only.
This information contains examples of data and reports used in daily businessoperations. To illustrate them as completely as possible, the examples include thenames of individuals, companies, brands, and products. All of these names arefictitious and any similarity to the names and addresses used by an actual businessenterprise is entirely coincidental.
COPYRIGHT LICENSE:
526 IBM Tivoli Monitoring for Databases: Oracle: Reference Guide

This information contains sample application programs in source language, whichillustrate programming techniques on various operating platforms. You may copy,modify, and distribute these sample programs in any form without payment toIBM, for the purposes of developing, using, marketing or distributing applicationprograms conforming to the application programming interface for the operatingplatform for which the sample programs are written. These examples have notbeen thoroughly tested under all conditions. IBM, therefore, cannot guarantee orimply reliability, serviceability, or function of these programs. You may copy,modify, and distribute these sample programs in any form without payment toIBM for the purposes of developing, using, marketing, or distributing applicationprograms conforming to IBM‘s application programming interfaces.
Each copy or any portion of these sample programs or any derivative work, mustinclude a copyright notice as follows:
© (your company name) (year). Portions of this code are derived from IBM Corp.Sample Programs. © Copyright IBM Corp. _enter the year or years_. All rightsreserved.
If you are viewing this information in softcopy form, the photographs and colorillustrations might not appear.
TrademarksThe following terms are trademarks of International Business MachinesCorporation in the United States, other countries, or both:
IBM, the IBM logo, Tivoli, the Tivoli logo, Tivoli Enterprise Console, and TivoliManager for Domino are trademarks or registered trademarks of InternationalBusiness Machines Corporation or Tivoli Systems Inc. in the United States, othercountries, or both.
Lotus and Lotus Notes are trademarks of International Business MachinesCorporation and Lotus Development Corporation in the United States, othercountries, or both.
Microsoft and Windows NT are registered trademarks of Microsoft Corporation inthe United States, other countries, or both.
Java and all Java-based trademarks and logos are trademarks or registeredtrademarks of Sun Microsystems, Inc. in the United States, other countries, or both.
UNIX is a registered trademark of The Open Group in the United States and othercountries.
Oracle is a registered trademark of Oracle Corporation.
Other company, product, and service names may be trademarks or service marksof others.
Appendix F. Notices 527

528 IBM Tivoli Monitoring for Databases: Oracle: Reference Guide

Index
AAdvanced Queue
about 15AdvancedNetworkOption
about 338task 336
alert filecycle time 147
ALERT logabout 147
application_class 4application_label 4application_oid 4application_version 4Archive Destinations
about 35archive log destination
creating free space 36state 38
archive logs 35ARCHIVELOG mode 35attribute
application_class 4application_label 4application_oid 4application_version 4ENDPOINT_OID 4HOST 4INTERP 4ORACLE_HOME 4ORACLE_SID 4
BBACKGROUND_DUMP_DEST 61baroc files
Tivoli Enterprise Console 485bash shell 1, 2block changes 314block get rate 179, 190books
feedback viiionline viiiordering viii
Bourne shell 2BUFFER_POOL_KEEP 272
CC shell 2calls per transaction 314chained rows 196CHAINED_ROWS 196checkpoint
defined 50resolving incomplete 50
Checkpointsabout 50
CIM classcreating resource models with 418
CIM class (continued)OracleArchiveDest 420OracleClassPing 422OracleCluster 423OracleDatabase 424OracleDatafile 426OracleDBCacheAdvice 428OracleDispatcher 429OracleDispatcherProtocol 431OracleDumpSpace 432OracleEquity 433OracleHSAgent 434OracleIndex 435OracleInstance 437OracleJob 443OracleListener 445OracleLock 446OracleLogEvent 447OracleNetwork 449OracleObject 451OracleParameter 452OraclePGAStat 453OraclePQSlave 454OraclePQSysStat 455OracleProcess 456OraclePXProcess 457OraclePXProcessSysStat 458OraclePXSession 460OracleQueue 461OracleQueueSchedule 462OracleRedoLog 464OracleRedoLogGroup 465OracleRollbackSegment 466OracleSegment 468OracleSequence 469OracleSession 470OracleSessStat 472OracleSharedServer 473OracleSQLPlan 474OracleState 475OracleSysStat 476OracleSystemEvent 477OracleTable 478OracleTablespace 479OracleTransaction 481OracleUndoStat 482OracleUnixProcess 483OracleUser 484resource model 411using 415
classesTivoli Enterprise Console 485
CLI commandsrunning 1
cluster key ratio 199coalescing
defined 94command
wdmlseng 7command summary 355
commandsrunning 1running on UNIX 2running on Windows 2000 2running on Windows NT 2summary 356wochregdb 358wocpresource 359wocprole 360wocpuser 361wocrtresource 362wocrtrole 364wocrtuser 366wodelresource 369wodelrole 370wodeluser 371wogetresource 372wogetrole 374wogetuser 376wolsresources 378wolsroles 379wolsusers 380womvresource 381womvrole 382womvuser 383wopopresources 384wopoproles 385wopopusers 386woregdb 387wosetresource 389wosetresources 391wosetrole 393wosetroles 395wosetuser 397wosetusers 399woshutdown 402wostartup 403wtemp 334
ConfigureTECOracletask 339
consistent change percentage 253continued row percentage 200CORE_DUMP_DEST 61current extents
defined 65CurrentRunningSQL
task 344Customer Support xcycle time
about default 5
DData Manipulation Language
(DML) 314Data Warehouse Collector
about 55database
monitoring status of 223database buffer cache
defined 259
529

database writer process 50datafile
automatic extension 102low number of 203
DB_BLOCK_BUFFERS 262, 268DB_CACHE_ADVICE 268DB_CACHE_SIZE 262, 268DB_FILES 203DBWR checkpoint 50deadlock
defined 137default cycle time 5dictionary cache
defined 259dictionary cache hit percentage 270directory names, notation xiDisableResourceModels
task 346dispatcher process 170, 171distributing
custom resource model 415DML_LOCKS 134dump destination
background 61core 61user 61
Dump Spaceabout 61
dynamic extension 65
Ee-mail contact xEnableResourceModels
task 349encrypting data
using AdvancedNetworkOptiontask 338
endpointsetting up the Tivoli environment
on 3ENDPOINT_OID 4enqueue
defined 138timeout 138
ENQUEUE_RESOURCES 138environment variables, notation xiequity
defined 79low 80
errorchecking ALERT log 147no space error 326snapshot too old 326
errorsin alert log 147
eventsabout 5
extentmaximum
defined 156extents
defined 65free 300managing 65
Extentsabout 65
Extents by Tablespaceabout 69using tokens with 69
Extents by Userabout 74using tokens with 74
Ffeedback about publications xfiles
specifying report file for tasks 334Free Space Deficit
about 79Free Space Deficit By Tablespace
about 84using tokens with 84
Free Space Deficit By Userabout 89
Free Space Fragmentationabout 94
Free Space Fragmentation by Tablespaceabout 98using tokens with 98
Free Tablespaceabout 102
Free Tablespace by Tablespaceabout 106using tokens with 106
FREELIST 183, 264freelist waits ratio 183FSFI 94full table scan
defined 110Full Table Scan
about 110
Hheterogeneous services 179holes
about 6host
specifying for task output 334HOST 4
II/O
about 115IBM Tivoli Monitoring Workbench 415
creating resource model with 415index
deleted rows 201indication
Becomes Available 225Becomes Available Listener State 127Becomes Shutdown 226Becomes Suspect 227Becomes Unavailable 227Becomes Unavailable Listener
State 128Becomes Unknown 228Becomes Unknown Listener
State 129Category 0 Oracle Log Event 149
indication (continued)Category 1 Oracle Log Event 150Category 2 Oracle Log Event 151Category 3 Oracle Log Event 152Category 4 Oracle Log Event 153Changes from SQL String 295Changes to SQL String 296Decreases Below SQL Number 285Does not equal SQL Number 286Equals SQL Number 287Greater than SQL Number 288High Active Transactions
Percentage 315High Any V$SYSSTAT 181High Average Ready Message Waiting
Time In Days 18High Average Ready Message Waiting
Time In Hours 19High Average Ready Message Waiting
Time In Minutes 20High Average Ready Message Waiting
Time In Seconds 21High Average Redo Entry Size 244High Block Changes Per
Transaction 316High Buffer Cache Hit
Percentage 262High Buffer Cache Hit Percentage
(Interval) 263High Buffer Waits Percentage 264High Call Rate 317High Calls Per Transaction 318High Changed Block Percentage 182High Cluster Chained Rows 198High Cluster Key Ratio 199High Consistent Change
Percentage 254High Continued Row Percentage 200High Current Extents 66, 70, 75High DBWR Checkpoints 51High Dictionary Cache Hit
Percentage 265High Dictionary Cache Hit Percentage
(Interval) 266High Dispatcher Busy
Percentage 171High Dispatcher Wait Time 172High DML Locks Percentage 134High Error Count 22High Freelist Waits Ratio 183High Interval Recursive Call
Percentage 235High Lock Count 135High Lock Wait Time 319High Long Running Transactions 320High Long Table Full Table
Scans 111High No Space Error Count
(Interval) 327High Number of Deadlocks 136High Number of Enqueue
Timeouts 137High Number of Messages 23High Open Cursors Percentage 184High Oracle Job Failures 121High Percentage Deleted 201High PGA Multipass Executions 211
530 IBM Tivoli Monitoring for Databases: Oracle: Reference Guide

indication (continued)High PGA Optimal Percentage 212High Physical Reads 115High Physical Writes 117High Process Percentage 186High Recursive Call Percentage 236High Recursive Call Rate 237High Recursive to User Calls
Ratio 238High Redo Allocation Latch
Percentage 245High Redo Copy Latch
Percentage 246High Redo Copy Latch Percentage
Increase 247High Redo Log Space Waits
(Interval) 248High Redo Logs Not Archived 249High Rollback Segment Header Waits
Percentage 255High Row Source Percentage 112High Session Percentage 187High Shared Server Process
Highwater Mark Percentage 174High Shared Server Process
Percentage 173High Shared Server Request Queue
Wait Time 175High Snapshot Old Error Count
(Interval) 328High Sort Overflow Percentage 188High Table Chained Rows 202High Total Ready Message Waiting
Time In Days 24High Total Ready Message Waiting
Time In Hours 25High Total Ready Message Waiting
Time In Minutes 26High Total Ready Message Waiting
Time In Seconds 27High Used Dump Space
Percentage 62High Used KB 36High User Rollback Percentage 256Increase of SQL Number 289Increases Beyond SQL Number 289Invalid Archive Destination 38Less Than SQL Number 290Low Any V$SYSSTAT 189Low Average Message Propagation
Rate 28Low Block Get Rate 190Low Buffer Cache Hit
Percentage 268Low Buffer Cache Hit Percentage
(Interval) 269Low Completed Background
Checkpoints 52Low Dictionary Cache Hit
Percentage 270Low Dictionary Cache Hit Percentage
(Interval) 271Low Equity 80, 85, 90Low Free Extents 157, 161, 166Low Free KB 39Low Free Space Fragmentation
Index 95, 99
indication (continued)Low Free Space Percentage 41, 102,
107Low Free Temporary Extents 301,
305, 310Low Keep Buffer Cache Hit
Percentage 272Low Keep Buffer Cache Hit
Percentage (Interval) 273Low Library Cache Hit
Percentage 274Low Library Cache Hit Percentage
(Interval) 275Low Number of Datafiles 203Low Number of Redo Logs 43Low PGA Component Area 213Low PGA Work Area Max Size 214Low PGA Work Area Percentage 215Low Processes 219Low Recycle Buffer Cache Hit
Percentage 276Low Recycle Buffer Cache Hit
Percentage (Interval) 277Mismatches SQL String 296No Archive Log Mode 45Oracle Job is broken 122Oracle Job Past Due 123Percent increase of 291Shutdown 229SQL String Matches 297Suspect 230Unavailable 220, 231Unavailable Heterogeneous
Agent 191Unavailable Listener State 130Unknown 231Unknown Listener State 131
indicationsabout 5
instance statebecomes available 223becomes shutdown 223becomes suspect 223becomes unavailable 223becomes unknown 223shutdown 223suspect 223unavailable 223unknown 223
INTERP 4
Jjob
brokendefined 120
defined 120failed
defined 120past due
defined 120job queue
defined 120Job Queue
about 120
Kkeep buffer cache hit percentage 272keep buffer cache hit percentage
(interval) 273Korn shell 2
Llatches
defined 242library cache
defined 259library cache hit percentage 274listener
defined 126state 126
Listenerabout 352endpoints 352starting or stopping 351task 351
Listener Stateabout 126
lockactive 133DDL (dictionary lock) 133defined 133distributed 133DML (data lock) 133Internal and latches 133Parallel cache management
(PCM) 133type descriptions 139
Lockabout 133
Log Eventabout 147
log file 147LOG_ARCHIVE_DEST
directory 35LOG_ARCHIVE_DEST_n 40, 42, 43LOG_CHECKPOINT_INTERVAL 50LOG_CHECKPOINT_TIMEOUT 50logging
about 7lsnrctl 126, 352
Mmanuals
feedback viiionline viiiordering viii
MAX_DISPATCHERS 172MAX_SERVERS 173, 175MAXEXTENTS 79, 156Maximum Extents
about 156Maximum Extents by Tablespace
about 160using tokens with 160
Maximum Extents by Userabout 165using tokens with 165
messages in queue 15
Index 531
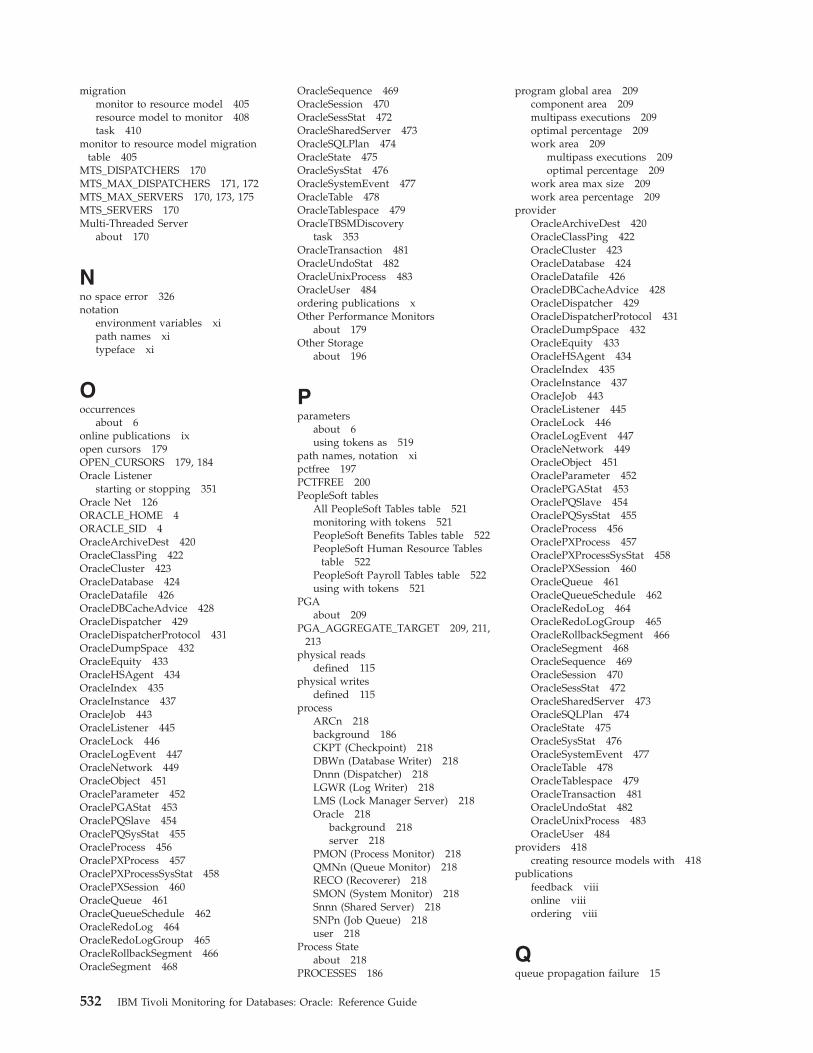
migrationmonitor to resource model 405resource model to monitor 408task 410
monitor to resource model migrationtable 405
MTS_DISPATCHERS 170MTS_MAX_DISPATCHERS 171, 172MTS_MAX_SERVERS 170, 173, 175MTS_SERVERS 170Multi-Threaded Server
about 170
Nno space error 326notation
environment variables xipath names xitypeface xi
Ooccurrences
about 6online publications ixopen cursors 179OPEN_CURSORS 179, 184Oracle Listener
starting or stopping 351Oracle Net 126ORACLE_HOME 4ORACLE_SID 4OracleArchiveDest 420OracleClassPing 422OracleCluster 423OracleDatabase 424OracleDatafile 426OracleDBCacheAdvice 428OracleDispatcher 429OracleDispatcherProtocol 431OracleDumpSpace 432OracleEquity 433OracleHSAgent 434OracleIndex 435OracleInstance 437OracleJob 443OracleListener 445OracleLock 446OracleLogEvent 447OracleNetwork 449OracleObject 451OracleParameter 452OraclePGAStat 453OraclePQSlave 454OraclePQSysStat 455OracleProcess 456OraclePXProcess 457OraclePXProcessSysStat 458OraclePXSession 460OracleQueue 461OracleQueueSchedule 462OracleRedoLog 464OracleRedoLogGroup 465OracleRollbackSegment 466OracleSegment 468
OracleSequence 469OracleSession 470OracleSessStat 472OracleSharedServer 473OracleSQLPlan 474OracleState 475OracleSysStat 476OracleSystemEvent 477OracleTable 478OracleTablespace 479OracleTBSMDiscovery
task 353OracleTransaction 481OracleUndoStat 482OracleUnixProcess 483OracleUser 484ordering publications xOther Performance Monitors
about 179Other Storage
about 196
Pparameters
about 6using tokens as 519
path names, notation xipctfree 197PCTFREE 200PeopleSoft tables
All PeopleSoft Tables table 521monitoring with tokens 521PeopleSoft Benefits Tables table 522PeopleSoft Human Resource Tables
table 522PeopleSoft Payroll Tables table 522using with tokens 521
PGAabout 209
PGA_AGGREGATE_TARGET 209, 211,213
physical readsdefined 115
physical writesdefined 115
processARCn 218background 186CKPT (Checkpoint) 218DBWn (Database Writer) 218Dnnn (Dispatcher) 218LGWR (Log Writer) 218LMS (Lock Manager Server) 218Oracle 218
background 218server 218
PMON (Process Monitor) 218QMNn (Queue Monitor) 218RECO (Recoverer) 218SMON (System Monitor) 218Snnn (Shared Server) 218SNPn (Job Queue) 218user 218
Process Stateabout 218
PROCESSES 186
program global area 209component area 209multipass executions 209optimal percentage 209work area 209
multipass executions 209optimal percentage 209
work area max size 209work area percentage 209
providerOracleArchiveDest 420OracleClassPing 422OracleCluster 423OracleDatabase 424OracleDatafile 426OracleDBCacheAdvice 428OracleDispatcher 429OracleDispatcherProtocol 431OracleDumpSpace 432OracleEquity 433OracleHSAgent 434OracleIndex 435OracleInstance 437OracleJob 443OracleListener 445OracleLock 446OracleLogEvent 447OracleNetwork 449OracleObject 451OracleParameter 452OraclePGAStat 453OraclePQSlave 454OraclePQSysStat 455OracleProcess 456OraclePXProcess 457OraclePXProcessSysStat 458OraclePXSession 460OracleQueue 461OracleQueueSchedule 462OracleRedoLog 464OracleRedoLogGroup 465OracleRollbackSegment 466OracleSegment 468OracleSequence 469OracleSession 470OracleSessStat 472OracleSharedServer 473OracleSQLPlan 474OracleState 475OracleSysStat 476OracleSystemEvent 477OracleTable 478OracleTablespace 479OracleTransaction 481OracleUndoStat 482OracleUnixProcess 483OracleUser 484
providers 418creating resource models with 418
publicationsfeedback viiionline viiiordering viii
Qqueue propagation failure 15
532 IBM Tivoli Monitoring for Databases: Oracle: Reference Guide

RRDBMS State
about 223recursive call
defined 234Recursive Calls
about 234recycle buffer cache hit percentage 277redo allocation latches
defined 242redo copy latch
defined 242redo log
defined 242Redo Log
about 242Regular Expressions file 147report file, specifying for tasks 334resource model
Advanced Queue 15Archive Destinations 35Checkpoints 50CIM class 411creating 415customizing with tokens 519Data Warehouse Collector 55disabling 346distribution 415Dump Space 61enabling 349Extents 65Extents by Tablespace 69Extents by User 74Free Space Deficit 79Free Space Deficit By Tablespace 84Free Space Deficit by User 89Free Space Fragmentation 94Free Space Fragmentation by
Tablespace 98Free Tablespace 102Free Tablespace by Tablespace 106Full Table Scan 110I/O 115Job Queue 120Listener State 126Lock 133Log Event 147Maximum Extents 156Maximum Extents by Tablespace 160Maximum Extents by User 165Multi-Threaded Server 170Other Performance Monitors 179Other Storage 196PGA 209Process State 218RDBMS State 223Recursive Calls 234Redo Log 242return codes 7Rollback Segment 253SGA 259SQL Number 284SQL String 294Temporary Extents 300Temporary Extents by
Tablespace 304Temporary Extents by User 309
resource model (continued)Transaction 313Undo Space 326
resource model to monitor migrationtable 408
resource models 5about 5baroc files 486
return codes 7about 7
Rollback Segmentabout 253
rollback waits percentage 253row source percentage 110
SSAP tables
Default SAP Tablespaces table 523Largest SAP Tables table 522monitoring with tokens 521SAP Sales and Distribution Tables
table 522using with tokens 521
schema namecommand syntax 367
segmentallocation 79defined 79
serverdedicated 184multi-threaded 184
SESSIONS 186setup scripts 3SGA
about 259SHARED_POOL_SIZE 267, 270, 274shared–server process 170shell
about 2bash 1establishing the Tivoli environment
in 3shells
bash 2Bourne 2C 2Korn shell 2UNIX 2
snapshot too old error 326sort overflow percentage 179sort overflow ratio 188SORT_AREA_SIZE 188SQL Number
about 284SQL statements
analyzing 345SQL String
about 294SQL*Net
using with AdvancedNetworkOptiontask 336
Statuscommon attribute 4
syntaxTivoli command 355
SYS.DUAL table 179
System Global Area (SGA)defined 259
Ttable chained rows 202tablespace
space allocation 102task
about 331AdvancedNetworkOption 336baroc files 485CLI names 333CLI syntax 331command line 333ConfigureTECOracle 339CurrentRunningSQL 344DisableResourceModels 346EnableResourceModels 349GUI names 333host for task output 334Listener 351OracleTBSMDiscovery 353send status to Tivoli Enterprise
Console 335target endpoint 331
task migration table 410temporary extents
defined 300Temporary Extents
about 300Temporary Extents by Tablespace
about 304using tokens with 304
Temporary Extents by Userabout 309using tokens with 309
temporary segmentsdefined 300
thresholdsabout 6
Tivoli Business Systems Managertask 353
Tivoli command syntax 355Tivoli Customer Support xTivoli Enterprise Console
baroc files 485class
resource model hierarchy 486task hierarchy 485
classes 485task 335
Tivoli Enterprise Data Warehouseintegrating with 55
Tivoli environmentestablishing in a shell 3establishing on an endpoint 3establishing on UNIX 3establishing on Windows NT 3
tnslsnr 126tokens
about 519creating your own 520customizing resource models 519PeopleSoft tables 521, 522SAP tables 521, 522, 523
Index 533

Transactionabout 313
transactionsactive 313blocked 313defined 313long-running 313recursive 314
TRANSACTIONS 313
Uundo 326undo space
managing 326Undo Space
about 326UNIX
running commands on 2setting up the Tivoli environment 3shell 2
user calldefined 234
user rollback percentage 253USER_DUMP_DEST 61
VV$SYSSTAT 137, 179v$waitstat 264variables, notation for xi
Wwdmlseng 7Windows 2000
running commands on 2Windows NT
running commands on 2setting up the Tivoli environment 3
wochregdb command 358wocpresource command 359wocprole command 360wocpuser command 361wocrtresource command 362wocrtrole command 364wocrtuser command 366wodelresource command 369wodelrole command 370wodeluser command 371wogetresource command 372wogetrole command 374wogetuser command 376wolsresources command 378wolsroles command 379wolsusers command 380womvresource command 381womvrole command 382womvuser command 383wopopresources command 384wopoproles command 385wopopusers command 386woregdb command 387work area 209WORKAREA_SIZE_POLICY 209wosetresource command 389
wosetresources command 391wosetrole command 393wosetroles command 395wosetuser command 397wosetusers command 399woshutdown command 402wostartup command 403wtemp 334
Xx$kcbrbh 268
534 IBM Tivoli Monitoring for Databases: Oracle: Reference Guide


����
Printed in U.S.A.
SC23-4724-00