Embed Size (px)
Citation preview

2 About this Industry2 Industry Definition
2 Main Activities
2 Similar Industries
2 Additional Resources
3 Industry at a Glance
4 Industry Performance4 Executive Summary
4 Key External Drivers
5 Current Performance
7 Industry Outlook
10 Industry Life Cycle
12 Products & Markets12 Supply Chain
12 Products & Services
13 Demand Determinants
14 Major Markets
15 International Trade
16 Business Locations
18 Competitive Landscape18 Market Share Concentration
18 Key Success Factors
18 Cost Structure Benchmarks
19 Basis of Competition
20 Barriers to Entry
20 Industry Globalisation
21 Major Companies
24 Operating Conditions24 Capital Intensity
25 Technology & Systems
25 Revenue Volatility
26 Regulation & Policy
27 Industry Assistance
28 Key Statistics28 Industry Data
28 Annual Change
28 Key Ratios
29 Jargon & Glossary
IBISWorld Industry Report H5740Clubs in AustraliaFebruary 2012 Craig Shulman
Losing battle: Clubs are struggling against increased regulations and competition
www.ibisworld.com.au | (03) 9655 3881 | [email protected]

www.IbISwOrLd.COM.Au Clubs in Australia February 2012 2
This report relates to clubs or associations in the sporting (e.g. lawn bowls, golf, surf lifesaving, rugby, football and soccer), social (such as RSL clubs) or recreational
areas that are licensed to sell alcoholic beverages. It also covers unlicensed clubs, which do not have a liquor licence, and clubs that have gambling licences.
The primary activities of this industry are
Operating clubs with gambling facilities
Operating clubs without gambling facilities
Industry definition
Main Activities
Similar Industries
Additional resources
IBISWorld writes over 500 Australian industry reports, which are updated up to four times a year. To see all reports, go to www.ibisworld.com.au
The major products and services in this industry are
Gambling income
Liquor and other beverages
Meals and food
Membership and competition fees
Sponsorship and fundraising
Ticket sales
About this Industry
P9312 Gyms, Sports Grounds, and Other Facilities in AustraliaEstablishments in this industry operate sports grounds and facilities.
For additional information on this industry
www.abs.gov.au Australian Bureau of Statistics
www.clubsnsw.com.au Clubs NSW
www.clubsvic.org Clubs Victoria
www.theshout.com.au The Shout

www.IbISwOrLd.COM.Au Clubs in Australia February 2012 3
Market ShareThere are no major players in this industry
Key External driversGambling expenditure per capitareal household disposable incomeCompetition from casinosCompetition from pubs, taverns and barsTotal time available for leisure and recreation
Key Statistics Snapshot
Industry at a GlanceClubs in 2011-12
revenue
$9.9bnProfit
$1.9bnwages
$2.3bnbusinesses
1,686
Annual Growth 12-17
-4.1%Annual Growth 07-12
-0.5%
Industry Structure Life Cycle Stage Decline
Revenue Volatility Low
Capital Intensity Medium
Industry Assistance Low
Concentration Level Low
Regulation Level Heavy
Technology Change Medium
Barriers to Entry Medium
Industry Globalisation Low
Competition Level High
FOR ADDITIONAL STATISTICS AND TIME SERIES SEE THE APPENDIx ON PAGE 28
$
1500
900
1000
1100
1200
1300
1400
1602 04 06 08 10 12 14Year
Gambling expenditure per capita
SOURCE: WWW.IBISWORLD.COM.AU
% c
hang
e
10
−30
−20
−10
0
1804 06 08 10 12 14 16Year
Revenue Employment
Revenue vs. employment growth
Licensed clubs
49.4%NSW
2.3%TAS
22.4%QLD
2%NT
1.7%ACT
13.5%VIC
4.9%WA
3.8%SA
SOURCE: WWW.IBISWORLD.COM.AU
p. 21
p. 4
SOURCE: WWW.IBISWORLD.COM.AU

www.IbISwOrLd.COM.Au Clubs in Australia February 2012 4
Key External drivers Gambling expenditure per capitaThe industry is affected by decisions made by households on the proportion of their discretionary expenditures that they will devote to gaming. During harsh economic periods, consumers generally have a tendency to reduce discretionary item expenditure and increase savings. This has an adverse effect on industry operators.
Real household disposable incomeThe industry is affected by movements in real household disposable income (which is affected by the rate of change in employment – or unemployment – and from tax and interest rate changes) as it is out of disposable incomes that gaming, liquor, food and entertainment expenditure is financed.
Competition from casinosClubs are feeling the effects of competition from casinos with large banks of gaming machines and linked jackpots and casinos being able to trade 24 hours, while restrictions on the operating hours of clubs and hotels are progressively being introduced in each state.
Competition from pubs, taverns and barsMajor competitors to clubs in some states are hotels/pubs that are also able to operate gaming machines.
Total time available for leisure and recreationAvailable leisure time for consumers to allocate to gaming, food and drink
Executive Summary
The Clubs industry has been going through some turbulent times. Before 2006, a steady increase in gaming machine numbers, along with lax smoking laws, brought prosperity to the industry. However, many state governments have since introduced caps on the total number of gaming machines allowed in each club, in addition to other
operational restrictions. Restrictions on gaming machines initiated by state governments will significantly affect the performance of the industry over the medium term. Furthermore, strict smoking bans that have came into force in some states since 2006 have forced the industry to adjust its operations and to rely further on gaming machine revenue.
In addition, the industry faces intense competition from other licensed venues, particularly hotels, pubs and casinos, which also offer gaming facilities. Competition from pubs and casinos with gaming machines has increased significantly over the past five years and
this is expected to continue into the longer term. As a result of these factors, industry revenue is estimated to decline at an annualised 0.5% over the past five years, with 2011-12 specifically showing 2.0% growth from the previous year, as a result of forecast solid economic growth and lower unemployment. During 2011-12 the industry is expected to generate $9.91 billion in revenue.
Over the five years through 2016-17, the industry is expected to continue to be affected by tightening restrictions and regulations. New restrictions and changes to the industry’s operating environment will vary from state to state. For example, a significant change to the ownership and allocation of gaming machines is expected to apply in Victoria from 2012. In many ways, the state is moving towards the system that already applies in New South Wales and Queensland, although with a far lower number of gaming machines available. The likely prospect of the Federal Government’s plan to introduce a mandatory precommitment scheme for gaming machines has also caused significant concern for the industry. Revenue for the Clubs industry is expected to decrease over the next five years at an annualised 4.1% to a total $8.05 billion.
Industry PerformanceExecutive Summary | Key External drivers | Current Performance Industry Outlook | Life Cycle Stage
Tighter regulations on gaming machines are contributing to weaker industry growth

www.IbISwOrLd.COM.Au Clubs in Australia February 2012 5
Industry Performance
Indoor smoking bans From 2006 through 2010, Australia’s states and territories phased in bans of indoor smoking, which has severely affected the Clubs industry. In New South Wales, after the introduction of an indoor smoking ban in July 2007, overall club income for 2007-08 fell by 11% and 25 clubs either closed or amalgamated during the same period, according to Clubs NSW.
In South Australia, net gambling revenue from gaming machines dropped from $793 million in 2006-07 to $729 million in 2009-10, due to lower patronage from total smoking bans and the global financial crisis lowering household disposable income. At this stage, clubs attracted a higher proportion of smokers at their venues. However, gambling
Current Performance
The Clubs industry will generate an estimated $9.91 billion in revenue during 2011-12, which represents real growth of 2.0% from the previous year. Economic activity is forecast to accelerate, as a cyclical upturn gains momentum and unemployment continues to trend downwards. Clubs have been recovering from the effects of indoor smoking bans throughout the country since 2009, having to adjust their business models significantly as a result of the newly introduced regulation. Some state governments are also reducing their gaming machine numbers, and most have placed a cap of total numbers
available for licensing. There is also increasing competition from pubs and casinos with gambling facilities. Combined with government regulation and the effects of the global financial crisis, these factors have led many players to consolidate or shut down.
Over the five years through 2011-12, industry revenue is expected to decline at an annualised 0.5%, due to subdued economic growth in recent years and increasing regulation. Industry revenue growth during 2011-12 should follow a rise as discretionary income stays healthy, despite uncertainty about the direction of the economy.
Key External driverscontinued
and entertainment at clubs is also a factor that directly affects the industry. For some older retired people and pensioners that play with
gaming machines, this may not be a significant concern, but limits on their personal income able to be spent on gaming may apply.
% c
hang
e
10
0
2
4
6
8
1604 06 08 10 12 14Year
Real household disposable income
SOURCE: WWW.IBISWORLD.COM.AU
$
1500
900
1000
1100
1200
1300
1400
1602 04 06 08 10 12 14Year
Gambling expenditure per capita

www.IbISwOrLd.COM.Au Clubs in Australia February 2012 6
Industry Performance
Indoor smoking banscontinued
expenditure has recovered after 12 to 18 months of each ban being instituted. Government assistance to help clubs adjust was also provided, like the NSW Government introducing a tax deferral scheme for clubs in 2008 if gaming machine revenue dropped more than 15%
within a year of the smoking ban.Smoking bans have sparked a strong
rise in club membership by providing a more family-friendly atmosphere. However, this rise in membership has not replaced the revenue streams that smoking provided.
Financial crisis and consolidation
A major economic factor that determines growth in gaming revenue is growth in household disposable income, which is affected by factors such as employment, and changes to income tax and interest rates. Prior to 2010-11, despite significant income tax reductions and economic stimulus payments to households by the Federal Government, growth in household disposable income was pressured by the sluggish decline in unemployment and rise in interest rates. However, as Australia continues to go relatively unaffected, and in fact increases its spending power via a strengthening exchange rate, Australians are subconsciously moving towards higher spending patterns. This has been geared towards more value-related purchases, which clubs in Australia are able to provide through their subsidised food and liquor.
Over the past few years, profit margins for many small and medium-size clubs have been placed under pressure from a combination of increased state taxes on gaming machines, and growing competition for patrons from pubs, taverns and casinos that also have gaming machines linked with jackpots. This competition has further increased during
a recent downturn in table gaming. These factors have encouraged industry consolidation, particularly mergers occurring in New South Wales. However, the enforcement of caps on the number of gaming machines allowed in venues had a greater effect on industry performance.
Over the five years through 2011-12, industry employment is expected to decline by an annualised 0.3% to about 62,000 people. Continued industry consolidation will contribute to this fall, as clubs with gambling facilities strive to grow in size. In addition, clubs without gambling facilities are expected to continue closing down. Increased state taxes on gaming machines and clubs are also affecting the industry’s employment levels. Operationally, there has been an increasing shift to using casual and permanent part-time staff to meet customer needs during peak trading periods. IBISWorld expects only a marginal increase in profit margins among clubs with gambling facilities as industry revenue rises, assisted by continued operator consolidation. This will occur through merger and acquisition activity among clubs.
Government regulations
By its nature, the industry constantly has to navigate around heavy regulation in regard to either smoking or gambling. These regulatory effects have continued to make their presence felt, with constant changes occurring across each state and territory.
In Victoria, for instance, a campaign was launched in late 2006 named Taking Action on Problem Gambling, which extended regional caps on gaming
machine numbers from five to 19 regions, where gaming machine expenditure is well above the average, and where there are lower socio-economic areas. In the same year, the Victorian Government budget increased the gaming machine levy to raise an additional $45 million, raising a total of $91 million. In July 2007, the Victorian Government announced that gaming machine winnings above $1,000 would

www.IbISwOrLd.COM.Au Clubs in Australia February 2012 7
Industry Performance
Consolidation and competition
IBISWorld forecasts further significant economic growth, and this will influence a quick recovery in industry profit. However, it is expected that consolidation will continue to occur, with industry employment to fall at an annualised 9.0% to total 38,855 people over the next five years. While major consolidated players will enjoy increasing margins, smaller and
medium-size players are expected to display lower profit margins as competition from within and outside the industry continues to escalate. The industry will be dominated by several large players operating across many sites. Significantly greater competition is also expected from pubs and casinos as they fight for their share of household gambling expenditure.
Industry Outlook
Over the next five years, the industry is at first expected to continue to enjoy the benefits from the forecast solid upturn in economic activity, combined with higher employment growth. This growth in demand determinants will cause the proportion of household income devoted to gambling and entertainment to decrease slightly. The industry will be less affected by a rise in interest rates as the economy begins to heat up again. This will result in healthy general employment growth, which will boost household disposable income, but may be offset by higher interest rates.
However, state and federal government regulatory and operational restrictions on clubs will also significantly affect overall industry performance soon enough, particularly due to MP Andrew Wilkie’s push for a mandatory precommitment scheme to be introduced nationwide by 2014. The decline in the industry’s performance will be further influenced by increasing competition from other venues
(i.e. pubs and casinos), some setbacks from tighter restrictions on alcohol sales to young adults, and little general growth in the overall proportion of household disposable income allocated to all forms of gambling. Thus, over the five years through 2016-17, real industry revenue is expected to decrease at an annualised 4.1% to $8.05 billion.
Government regulationscontinued
have to be paid by cheque instead of cash. The payout threshold would be reduced from $2,000 in a move designed to make the player remove themselves from the machine, and to prevent gamblers from playing their winnings immediately.
In May 2010, the Victorian Government auctioned 27,500 gaming machines to pubs and clubs, with 10-year licences from 2012. This action is similar
to current systems in New South Wales and Queensland. Total proceeds of $981 million were gained by the government. A progressive tax scale is to apply on gaming machines, depending on total net revenue from this activity. IBISWorld estimates that the system may initially operate to the advantage of the larger and financially stronger clubs, but to the detriment of smaller clubs. This is likely to lead to consolidation of operators.
% c
hang
e
5
−15
−10
−5
0
1804 06 08 10 12 14 16Year
Industry revenue
SOURCE: WWW.IBISWORLD.COM.AU

www.IbISwOrLd.COM.Au Clubs in Australia February 2012 8
Industry Performance
Consolidation and competitioncontinued
Overall, the industry faces an extremely challenging operating environment in the near term. Industry profit is generally forecast to follow much
the same trend as estimated growth in real revenue, but at a lower rate. Employment will continue to be on a part-time and casual basis.
barriers to growth Regulation will be a major barrier to future industry growth. This will limit the operational flexibility of licensed clubs in many aspects, such as operating hours and caps on gaming machine numbers. Some states and territories currently do not have many big club venues capable of providing a large number of gaming and entertainment facilities, but this is expected to change over time. Competition for the gambling dollar is now fierce. Most forms of gambling are now available in nearly every state and territory, and increasingly from casinos with gaming machines. However, Western Australia does not permit gaming machines outside of its casino. Competition will increase in the future, as overall gambling by households
approaches saturation point in most states and territories.
The deregulation process of hospitality and liquor licensing that occurred in many states and territories is seen as initiating a strong challenge for licensed clubs members. Challenges to the industry therefore relate to providing more than just sporting or social facilities to retain their members. Clubs must develop their food and beverage offerings and general entertainment facilities in order to maintain member loyalty and expenditure. The more innovative clubs, which recognise an increasingly competitive environment by adjusting their operations and improving their facilities accordingly, are expected to perform above industry averages.
Gambling reform Independent Member of Parliament Andrew Wilkie’s inquiry into gambling reform continues to make progress towards the member’s agenda: to limit problem gambling via a mandatory precommitment scheme. Either gaming machines will have automatic limit ranges imposed or use a card-based system, which will relate to precommitment. The smart cards will be issued to problem gamblers who can then set a limit on the amount of money they wish to spend on a gaming machine. Clubs have become particularly nervous about the idea. As gambling revenue for larger clubs accounts for over 63% of their revenue, and problem gamblers account for 40% of gambling revenue, capping gambling expenditure presents a great risk to club revenue streams. While large clubs depend heavily on gambling revenue, smaller clubs derive their income mostly from liquor and food
sales, and thus this initiative is expected to hurt larger players the most.
Comparing this scenario with the recent smoking bans, these proposed reforms are likely to alienate the industry’s base clientele even further. Other gambling alternatives, online gambling for instance, are on offer and clientele are likely at first to be swayed to invest more of their time towards these alternatives instead of gambling at clubs.
Beyond this, capping gambling expenditure will mean larger clubs will have to reassess their business models to find a way to provide a broad, cheap, and family-friendly food, liquor and entertainment service without subsidising from gambling revenue as heavily to maintain their target demographic. The installation of these regulatory measures is currently unknown; estimates vary from $170 million to $5.0 billion.

www.IbISwOrLd.COM.Au Clubs in Australia February 2012 9
Industry Performance
Gambling reformcontinued
Since Wilkie’s alignment with the current government is predicated on achieving these reforms, the only true opposition to such reforms taking place is the state governments that, where possible, rely on gambling receipts for about 10% of their revenue. However, during the COAG meeting in May 2011, the state governments were unable to sway the Federal Government’s
mandate. Furthermore, in July 2011 the Australian National University found that 74% of Australians agree with the initiative in principle. As a result, states are starting to draw money out of their own coffers to help support the industry’s survival. The NSW Government, for instance, has decided to give registered clubs tax cuts worth up to $300 million.

www.IbISwOrLd.COM.Au Clubs in Australia February 2012 10
Industry PerformanceRegulatory changes relating to gaming machines have affected industry performance
The introduction of a smoking ban is affecting patron numbers
Anti-gaming machine sentiment is leading to government action
Competition is increasing from other venues with gaming machines, including hotels, pubs and casinos
Life Cycle Stage
SOURCE: WWW.IBISWORLD.COM.AU
30
25
20
15
10
5
0
–5
–10–10 100 20–5 155 25 30
% G
row
th o
f pro
fi t/G
dP
% Growth of establishments
declineCrash or Grow?
Potential Hidden GemsFuture Industries
Quality GrowthHigh growth in economic importance; weaker companies close down; developed technology and markets
Time wastersHobby Industries
MaturityCompany consolidation;level of economic importance stable
Shake-out
Shake-out
Quantity GrowthMany new companies; minor growth in economic importance; substantial technology change
Key Features of a decline Industry
Revenue grows slower than economyFalling company numbers; large fi rms dominateLittle technology & process changeDeclining per capita consumption of goodStable & clearly segmented products & brands
Gyms, Sports Grounds, and Other FacilitiesClubs

www.IbISwOrLd.COM.Au Clubs in Australia February 2012 11
Industry Performance
Industry Life Cycle IBISWorld estimates the industry overall is in decline.
The industry has been, until recently, in a growth cycle since the mid-1990s due to the introduction of gaming machines into clubs in Victoria, Queensland, South Australia and Tasmania. However, recent regulatory restrictions on trading hours and the number of gaming machines allowed has been introduced in most states and territories. Increasing state taxation of gaming machines recently may also have an impact on the future growth of the industry – mainly through reduced profitability. Indoor smoking bans at clubs in 2007 have also had an
impact on industry revenue.Also, competition among all forms of
gambling now available throughout Australia means that the saturation point for the proportion of household disposable income that they will devote to gambling has been reached. Therefore, the obtaining of further high revenue growth for the industry is expected to now become more difficult to achieve. Competition is also continuing to increase from hotels/pubs and casinos with gaming machines.
Mergers between clubs, particularly in New South Wales, are continuing due to increasing competition, higher costs and lower growth in industry revenue.
This industry is declining

www.IbISwOrLd.COM.Au Clubs in Australia February 2012 12
Products & Services Clubs are most well known for either their formation purpose or as a venue for providing a regular meeting place that offers good value food and beverages. However, the income sources for clubs may vary significantly from their perceived primary activities.
Notably, the largest source of income for Clubs in Australia is gambling income. Gambling income makes up nearly half of the industry’s revenue, with a significant proportion of this emerging from electronic gaming machines. Unsurprisingly, then, there has been a large uproar within the industry against Andrew Wilkie’s proposed reforms to restrict use of gaming machines. When
smoking bans were introduced across the country from 2006, industry revenue dropped, as many patrons that were affected by these bans also contributed significantly to gambling income.
However, clubs still derive significant revenue from what are seen as their primary activities. The provision of food and drink accounts for just over 25% of revenue. However, this is assisted through subsidies that clubs provide in order to maintain their value proposition.
Membership and competition fees make up a core component of the operation and income of Clubs in Australia. Sports clubs in particular rely heavily on these fees, with about 20% of
KEy buyInG InduSTrIES
Z9901 Consumers in Australia Households are the main users of club facilities.
KEy SELLInG InduSTrIES
C2179 Tea, Coffee and Other Food Manufacturing in Australia The Clubs industry has links with food wholesalers for food service.
C2182 beer and Malt Manufacturing in Australia Clubs have linkages with breweries and wine and spirit producers and liquor wholesalers.
C2183 wine Manufacturing in Australia Clubs have links with wine and spirit producers for bar services.
C2868 Gaming and Vending Machines Manufacturing in Australia The Clubs industry has links with gaming machine operators and suppliers.
F4717 Liquor wholesaling in Australia Clubs require liquor from wholesalers for sale at their venues.
Products & MarketsSupply Chain | Products & Services | demand determinants Major Markets | International Trade | business Locations
Supply Chain
Products and services segmentation (2011-12)
Total $9.9bn
48.6%Gambling income
7.5%Sponsorship
and fundraising
17.7%Liquor and other beverages
2%Ticket sales
8.3%Meals and food
8.1%Other
7.8%Membership and competition fees
SOURCE: WWW.IBISWORLD.COM.AU

www.IbISwOrLd.COM.Au Clubs in Australia February 2012 13
Products & Markets
demanddeterminants
The economic situation, in terms of changes in real household disposable income, has a significant impact on the industry, especially with the proportion of total expenditure allocated to alcohol and gaming. The current slowdown in economic activity, together with the associated rise in unemployment, has adversely affected consumers’ discretionary spending, including on entertainment and gambling. This has been a factor in industry revenue falling recently.
The industry operates in a market where alcohol consumption is continuing to decline as a proportion of total household expenditure. While beer consumption is decreasing, it is increasing for full strength, premium and imported brands. Wine (particularly white wines) and spirits (especially bourbon and vodka) consumption is increasing. However, ready-to-drink or pre-mixed drinks are the fastest growth segment, and could overtake wine sales in the next two to three years. However, overall per capita alcohol consumption is declining.
Introduction of gaming machinesIBISWorld contends that until the mid-1990s, the industry was situated in a market where the trend in alcohol consumption has, over the long term, been declining as a proportion of total household expenditure, where there has been a significant change in consumer preferences in the type of alcohol consumed (i.e. from beer to wine and ready-to-drink products) and in the way it is consumed (i.e. in packaged rather than bulk form) and in an environment of increasing competition from other
licensed outlets, such as restaurants.The introduction or expansion of
gaming machines into clubs in all states/territories, apart from Western Australia, has led to significant expansion in the revenue of clubs with gaming facilities over the past decade. The industry segment that does not have gaming facilities has shrunk significantly. Competition to clubs with gaming facilities, however, has increased from both casinos and hotels/pubs/taverns that have gaming facilities. The linking of gaming machines by operators across club venues has increased the attractiveness of gaming machines to patrons with the ability to have regular and large jackpot prizes across the state.
Significant competition from the many forms of gambling now available throughout Australia possibly means that the saturation point for total gambling expenditure is close and the achievement of further strong growth for any individual form of gaming is now becoming more difficult.
Government regulationsMore significant, however, to future industry growth is the increasing government regulations, including the placing of ceilings on the total number of gaming machines in pubs and clubs in all state jurisdictions. Victoria has
Products & Servicescontinued
their income emerging from this segment. Sports clubs also rely on sponsorships and ticket sales, accounting for 20% and 9.0% of revenue respectively for these operators. As a result, sports clubs tends to rely a lot less on gambling income to sustain their activities than clubs that are focused on hospitality.
It should be noted that with greater regulation affecting gambling and smoking norms, hospitality clubs have seen a decline in their share of overall industry revenue. As a result, sports-related income sources have risen over the past few years as these clubs have gained a greater share of the industry.
Demand is driven by trends in gambling, alcohol consumption and general entertainment spending

www.IbISwOrLd.COM.Au Clubs in Australia February 2012 14
Products & Markets
Major Markets Nationally, clubs are intended to exist as community groups via a common link. As a result, people choose to join clubs for various reasons. Most clubs cater themselves towards individuals who are interested in some type of sport, totalling 67.1% of all club types. Within this segment, golf clubs and lawn bowls clubs are the most popular, capturing 10.6% and 11.3% of total club members respectively. Outside of sporting clubs, clubs exist for more communal purposes, such as RSL clubs (18.1%), and community and ethnic clubs (8.8%).
Since gaming machines account for about 60% of revenue within the industry, what attracts gamblers to clubs is of significance. Within this context, research by the Victorian Casino and Gaming Authority has indicated that in Victoria,
three-quarters of people who played gaming machines perceived it as a social outing, rather than gambling. Furthermore, the profile of people most likely to combine playing gaming machines and dining out accounted for at least 50% of players and were most likely to be people with an annual income of between $20,000 and $40,000, older couples and those in full-time employment. Other significant groups include couples with no children and occasional gamblers. It was found that about 10% of people solely played on gaming machines and did nothing else. The people least likely to play gaming machines and dine out were singles, acknowledged heavy gamblers, students, people aged between 18 and 19 years old, and single parents with dependent children.
demanddeterminantscontinued
actually reduced the number of gaming machines in certain localities. There are also now limits on trading hours for clubs with gaming machines in many states. Also the banning of smoking in clubs with pokies by Victoria had led to an initial fall in gaming revenue in clubs in that state on its introduction on 1 July 2002. Designated smoking areas and bans on smoking have
subsequently been introduced in other states and a total ban on smoking applied from late 2007. This has led to a decline in industry revenue, as studies have shown that there is a strong correlation between smokers and their above average tendencies to also gamble (and to potentially be seen as a winner). These both could be related to low self-esteem issues.
Major market segmentation (2011-12)
Total $9.9bn
45.2%Other sports club patrons
6%Other club patrons
18.1%RSL club patrons
11.3%Lawn bowls club patrons
10.6%Golf club patrons
8.8%Community and
ethnic club patrons
SOURCE: WWW.IBISWORLD.COM.AU

www.IbISwOrLd.COM.Au Clubs in Australia February 2012 15
Products & Markets
International Trade As a service industry, the Clubs industry only services the needs of end user consumers and members and, therefore, only services the local domestic market.
The industry services only the domestic market

www.IbISwOrLd.COM.Au Clubs in Australia February 2012 16
Products & Markets
SOURCE: WWW.IBISWORLD.COM.AU
TAS2.3
wA4.9
QLd22.4
VIC13.5
nSw49.4
nT2.0
SA3.8
ACT1.7
Licensed clubs (%)
Cold Zone (<10) <25 <50 Hot Zone (<100) not applicable
business Locations 2011-12

www.IbISwOrLd.COM.Au Clubs in Australia February 2012 17
Products & Markets
business Locations The industry, in terms of the number of clubs, is concentrated in New South Wales (which has 49.4% of organisations) and Queensland (with 22.4%).
In terms of share of industry revenue, this, however, is estimated by IBISWorld to be 65.9% in New South Wales, and 20.3% in Queensland. Both of these states have an extensive network of clubs with gaming machines and have evolved through their gaming and liquor licensing laws.
In New South Wales, gaming machines were initially introduced in 1954, while in Victoria’s case the machines were first introduced in the early 1990s. While Victoria also has gaming machines in clubs, many more are located in hotels and pubs. Historically, Victoria never had an extensive club network and
structure. Finally, Western Australia does not allow gaming machines outside of its casino.
Perc
enta
ge
60
0
10
20
30
40
50
WA
ACT
NSW N
T
QLD SA TA
S
VIC
Licensed clubs Population
Distribution of licensed clubs vs. population
SOURCE: WWW.IBISWORLD.COM.AU

www.IbISwOrLd.COM.Au Clubs in Australia February 2012 18
Cost Structure benchmarks
Due to the wide variety of enterprises in the industry, there is a wide divergence between the biggest players that rely on gambling revenue heavily while smaller clubs do not.
Taking this into account, profits make up about 19.3% of revenue on average for the industry. For most clubs without gaming facilities, profits are generally low, given that clubs operate for the benefit of the local community and sporting clubs, rather than being only
profit driven. Extra services, such as transport and gym facilities, and prices for food and beverages are generally subsidised for members. Clubs with gaming facilities, however, tend to make profit quite easily. Nonetheless, the profit margins of these clubs are adversely affected particularly by changes in taxes on gaming machines by state governments, which tend to be significantly higher than other industries. State gaming taxes, due to
Key Success Factors Capacity to objectively assess new investmentsIt is important for operators to periodically review each gaming machine’s performance or the cash box percentage, and undertake a cashflow analysis for each machine.
Superior financial management and debt managementClubs need to monitor and manage cashflow (including allowing for all state tax payments) effectively to avoid any financial problems.
Business expertise of operatorsClubs should employ professional managers in all areas of operation, particularly specialist areas, such as food service, liquor, gaming, members services and entertainment.
Carrying out all necessary maintenance to keep facilities in good conditionClubs need to maintain the venue and
provide new gaming machines at regular intervals. It is also important to keep records of overall maintenance and procedures.
Having a loyal customer baseIt is beneficial to have a high actual and potential membership base, and to have a high visitation rate from members.Must comply with government regulationsIt is imperative to ensure that the club always complies with state licensing laws in all areas of operation.
Level of security providedIt is important to have strict internal and external security and surveillance procedures covering machines and staff, both during and out of trading hours.
Production of premium goods and servicesClubs need to offer quality hospitality across all areas and at all times.
Market Share Concentration
IBISWorld estimates that the level of concentration for the top four operators was expected to be well under 10%. Overall, the industry has a low level of ownership concentration with ownership being in the hands of club members. Some clubs, however, operate over multiple sites. In this context, the 300 or so clubs that
employ 50 or more people, account for 60% of total industry income, and over 70% of industry profit. These clubs make up just over 15% of all enterprises. So while there has been some consolidation activity among the top operators recently, the majority of clubs are still expected to be small, and owned and managed by members.
Competitive LandscapeMarket Share Concentration | Key Success Factors | Cost Structure benchmarks basis of Competition | barriers to Entry | Industry Globalisation
Level Concentration in this industry is Low
IBISWorld identifies 250 Key Success Factors for a business. The most important for this industry are:

www.IbISwOrLd.COM.Au Clubs in Australia February 2012 19
Competitive Landscape
basis of Competition Operators in the industry face competition among other industry participants (internal competition) and with operators in other industries (external competition).
Internal competitionCompetition in general tends to be based on location (to be in an area that has high population and tourist catchments), quality of service and hospitality in all areas of operation, and total facilities offered to consumers – from meals, entertainment, bar, gaming, sporting and
other associated facilities and benefits.IBISWorld analysis also indicates that
competition for a share of patrons’ food, beverage and gaming expenditure is significant within the industry, especially as the growth in overall gaming expenditure slows along with the proportion of household disposable income allocated to all forms of gambling peaks. Prices paid for meals and drinks can, therefore, be important.
Changes in consumer alcohol, food and gaming expenditure, is important to the industry, since the operator who is
Cost Structure benchmarkscontinued
their intensity, can lead to some reduction in industry employment, as clubs adjust to any increase.
The major cost items are purchases (food and liquor mainly for sale) and wages. These items including profit account for the majority of total revenue. In terms of the performance of clubs, the important areas, therefore, are stock control and minimising of wastage, as
well as controls over labour inputs and costs – particularly the use of full-time versus part-time and casual staff to meet peaks in demand.
Depreciation accounts for about 10% of revenue, and relates to clubs ownership of buildings, rather than leasing these facilities, as well as equipment, including the ongoing replacement of gaming machines that offer patrons new games.
Sector vs. Industry Costs
■ Profi t■ wages■ Purchases■ depreciation■ utilities■ rent■ Other
Average costs of all industries in
sector (2011-12)Industry costs
(2011-12)
0
20
40
60
Perc
enta
ge o
f rev
enue
80
10010.5
18.9
7.32.54.6
32.6
23.6
19.3
23.2
6.12.2
10.0
15.6
23.6
SOURCE: WWW.IBISWORLD.COM.AU
Level & Trend Competition in this industry is High and the trend is Increasing

www.IbISwOrLd.COM.Au Clubs in Australia February 2012 20
Competitive Landscape
Industry Globalisation
According to IBISWorld estimates, the level of globalisation is low and steady. There are no global players in the Clubs industry, as it consists of a large number of small, independent operators.
barriers to Entry The main barrier to entry into the licensed clubs industry relates to the obtaining of a liquor licence. This has, however, become much easier under deregulated liquor laws, which now apply in most states and territories. For the larger clubs there is also the approval of a licence for gaming machines, as well as, obtaining the necessary capital funds for purchase or leasing of these machines plus making the necessary building extensions, once approval is given. Caps on the total number of gaming machines are now in place in New South Wales, Victoria, Queensland
and South Australia. This increases the barriers to entry for new participants who are seeking to gain access to gaming machines.
basis of Competitioncontinued
more attuned to these will continue to trade and operate successfully.
The club operator needs to understand the changing market preferences and standard of facilities demanded by their members and their guests. This particularly applies to clubs with gaming machines. Many patrons playing gaming machines perceive it to be a form of entertainment, rather than gambling.
External competitionCompetition is increasing from both the Pubs, Taverns and Bars industry and the Casinos industry, especially those with gaming machines, and from all other forms of gaming and
gambling, including sports wagering. With the total gambling market reaching maturity, in terms of share of total household expenditure, each segment of the broader gaming and wagering industries now has to contend with increasing competition to just maintain their fair share of household gambling expenditure.
Operators that understand changing market preferences will gain a competitive advantage
barriers to entry checklist Level
Competition HighConcentration LowLife cycle stage DeclineCapital intensity MediumTechnology change MediumRegulation and policy HeavyIndustry assistance Low
SOURCE: WWW.IBISWORLD.COM.AU
Level & Trend Barriers to Entry in this industry are Medium and Steady
Level & Trend Globalisation in this industry is Low and the trend is Steady
The industry services the domestic market

www.IbISwOrLd.COM.Au Clubs in Australia February 2012 21
Other Companies Mt Pritchard & District Community ClubEstimated market share: 3.7%Mt Pritchard & District Community Club was established in the 1960s. The club is located in New South Wales and services a growing population in nearby suburbs.
Club performance is generally affected by amalgamations with other clubs, investment in new facilities for members and renovation. This tends to increase member expenditure on food and beverages and other facilities. However, the ban on smoking and the ongoing increases in gaming machine taxes initiated by the NSW Government have adversely affected profit.
From 2007-08 to 2009-10, the club’s operation was adversely affected by a combination of increased taxes on gaming machines, the smoking ban, and the significant slowdown in economic activity. However, increasing membership numbers and upgrades to facilities drove moderate increases in gross revenue. During 2009-10, the club distributed $4.2 million to sporting, charitable and special interest groups in nearby communities.
In 2006-07, revenue increased as memberships grew. The club spent a total of $2.65 million on donations and grants to various local organisations. The financial result was attributed to a reduced loss in the beverage operations to $1.18 million (from $1.76 million previously), increased wages, entertainment costs and advertising and promotion.
The club’s operation was affected by payment of an additional $3.6 million in gaming machine taxes and a final tax
increase of $1.6 million from September 2007. It completed renovations at the Harbord Diggers Club and continued renovations at the Mounties premises.
The club opened its new health club in February 2006 and continued to make changes to address the new total indoor smoking ban from July 2007. During 2006, smoking was restricted to one room that was no larger than 25% of the total club area. The club constructed three outdoor terraces. During the year, it also completed negotiations to merge with the Harbord Diggers Club and the Manly Bowling Club, which was finalised in April 2006. It acquired holiday resorts at Fingal Bay, Sussex Inlet, Urunga Perisher Valley and Tweed Heads. It also achieved the Club of the Year Award and introduced Fitlinxx, an electronic linkage system for all gaming machines.
Penrith Rugby League Club LimitedEstimated market share: 1.9%Penrith Rugby League Club (also known as Panthers) began in Penrith as a single club with the purpose of promoting and supporting Rugby League. It is still a single entity, but spread over 14 club sites across New South Wales. The clubs are located in Bathurst, Cardiff, Glenbrook, Lavington, Mekong, Newcastle, North Richmond, Penrith, Port Macquarie, St John’s Park, Wallacia and West Epping. Panthers acquired these clubs as part of an amalgamation strategy that has amounted to total assets of $311 million. Each club location operates autonomously through an advisory board that elects members to the corporate board. In general, growth in revenue has related to acquisition of other
Major CompaniesThere are no major players in this industry | Other
Mt Pritchard & district Community Club Limited – fi nancial performance
yearrevenue
($ million) (% change)nPAT
($ million) (% change)
2005-06 292.0 8.7 44.1 236.62006-07 331.1 13.4 9.1 -79.42007-08 322.2 -2.7 6.2 -31.92008-09 342.9 6.4 6.2 0.02009-10 352.6 2.8 4.7 -24.2
SOURCE: ANNUAL REPORT

www.IbISwOrLd.COM.Au Clubs in Australia February 2012 22
Major Companies
Other Companiescontinued
club sites, improvement in facilities and increases in membership and members’ average expenditure.
From 2007-08 to 2009-10, the club’s operation is estimated to have been adversely affected by a combination of increased taxes on gaming machines and lingering effects from the smoking ban on patrons. Subdued economic activity and the associated fall in consumer sentiment and rise in unemployment were of particular significance. All of these factors hurt revenue across all operational activities, from gaming to food and beverage sales.
In 2006-07 revenue declined, largely due to the non-smoking legislation across all licensed premises in New South Wales. There was also some disruption to trade caused by the club’s building works. Catering and beverages revenue fell 8.8% to $32.6 million. However, gaming machine taxes rose slightly to $30.7 million.
During 2006, the club sold its motel at Penrith for a profit of $6.9 million. However, the company was affected by increased poker machine taxes. Employee salaries and benefits were reduced as restructuring continued. Reductions in depreciation and finance costs also resulted as debt was reduced.
At the end of 2005-06, operations comprised 14 clubs. For 2004-05 revenue declined, largely due to reduced revenue from catering and beverages. Revenue from gaming also fell, but only by 4.5%. The club was adversely affected by increased poker machine taxes. The club indicated that at June 2005, it was paying $100,000 a week more than 18 months
previously. The recently introduced smoking bans also affected revenue. However, the club continued to redesign and provide new facilities and to reduce overhead costs (which included an initial 100 staff redundancies). A decision was made to reduce debt to $27 million in the short term. As part of this plan, it sold three of its properties. Two properties were sold for a total of $12.5 million during the year. Reduced revenue from bar sales was caused by the closure of its nightclubs. Closures resulted from continued negative publicity related to the nightclubs driving away club members.
Twin Towns Services Club LimitedEstimated market share: 1.1%Twin Towns Services Club is one of the largest services clubs in Australia. It is located in northern New South Wales and occupies almost 5.0 square kilometres of property across four sites.
Since early 2008, the club’s operation has been hindered by a combination of increased taxes on gaming machines and lagged effects from the smoking ban on patrons. Subdued economic activity, and the associated fall in consumer sentiment and rise in unemployment were of particular significance. These factors led to lower revenue across all operational activities. The cyclical downturn relating to the global financial crisis was particularly pronounced in the Gold Coast and Tweed Heads region, due to the local economy’s focus on tourism, leisure and discretionary spending. The Twin Towns Services Club has experienced the effects of this, but has remained profitable, maintaining control of its debt levels.
Twin Towns Services Club Limited – fi nancial performance
year*revenue
($ million) (% change)nPAT
($ million) (% change)
2006 141.2 109.5 7.2 75.62007 87.7 -37.9 3.6 -50.02008 71.1 -18.9 1.1 -69.42009 70.2 -1.3 2.0 81.8
*year end decemberSOURCE: ANNUAL REPORT

www.IbISwOrLd.COM.Au Clubs in Australia February 2012 23
Major Companies
Other Companiescontinued
Professional sports clubsProfessional sports clubs, particularly those that participate in the AFL and NRL, are the most well known for-profit clubs in Australia. With the exception of the Panthers Group, however, all of these clubs each make up less than 1.0% of market share. Nevertheless, their revenue streams are still significant. Collingwood Football Club, for instance, currently draws about $75 million in revenue, and the Brisbane Broncos draw about $25 million in revenue. These organisations rely heavily on memberships, sponsorship deals, and merchandising, a lot more so than other clubs. As a result, their income streams vary according to the club’s team success and also on household discretionary income. A team’s success will help boost attendance numbers and TV viewership numbers as well, which will be reallocated towards the respective club
at the discretion of the parent body. While after the global financial crisis some of these clubs struggled to stay buoyant, several had to be bailed out by the AFL in order to maintain their activities.
Furthermore, the entertainment aspect of professional sports means that all products on offer by these organisations are of a discretionary nature, and thus rely on healthy levels of consumer sentiment and household discretionary income. Since consumer sentiment became subdued during the global financial crisis, many people chose to downgrade their memberships or attend fewer games during the period. Now that it appears that Australia has mostly recovered, prospective club fans have been increasing their levels of expenditure towards clubs, thus helping to bring revenue levels back to their previous norm.
Penrith rugby League Club Limited – fi nancial performance
year*revenue
($ million) (% change)nPAT
($ million)
2004-05 173.7 -7.6 -4.22005-06 196.8 13.3 24.12006-07 160.0 -18.7 -17.72007-08 160.0 0.0 1.62008-09 153.3 -4.2 -11.62009-10 154.0 0.5 -9.8
*year end OctoberSOURCE: ANNUAL REPORT

www.IbISwOrLd.COM.Au Clubs in Australia February 2012 24
Capital Intensity The labour intensity of the industry is determined by the ratio of labour to capital. To calculate this ratio, wage and depreciation costs (taken from the cost structure) are utilised as proxies. In general, the industry has a medium level of capital intensity, due to ownership of buildings and the capital intensive nature of gaming machines. The capital-to-labour ratio of industry is 1:3.3, meaning that for every dollar spent on the use and replacement of capital equipment, including buildings, gaming machines etc, $3.30 is spent on wages. Overall, due to the high level of member services required the industry is labour-intensive.
The industry, like all in the hospitality area, is very labour-intensive in all areas of operation from food, drinks and gaming. Many businesses have extended hours of opening, some which operate 24
hours a day, seven days a week. To contain the cost of labour, 48.5% of people are employed in the industry as casuals, and a further 18.5% as permanent, part-time employees.
Operating ConditionsCapital Intensity | Technology & Systems | Industry Volatilityregulation & Policy | Industry Assistance
Tools of the trade: Growth strategies for success
SOURCE: WWW.IBISWORLD.COM.AU
Labo
ur In
tens
ive Capital Intensive
Change in Share of the Economy
new Age Economy
recreation, Personal Services, Health and Education. Firms benefi t from personal wealth so stable macroeconomic conditions are imperative. Brand awareness and niche labour skills are key to product differentiation.
Traditional Service Economy
wholesale and retail. Reliant on labour rather than capital to sell goods. Functions cannot be outsourced therefore fi rms must use new technology or improve staff training to increase revenue growth.
Old Economy
Agriculture and Manufacturing. Traded goods can be produced using cheap labour abroad. To expand fi rms must merge or acquire others to exploit economies of scale, or specialise in niche, high-value products.
Investment Economy
Information, Communications, Mining, Finance and real Estate. To increase revenue fi rms need superior debt management, a stable macroeconomic environment and a sound investment plan.
Gyms, Sports Grounds, and Other Facilities
Tea, Coffee and Other Food Manufacturing
beer and Malt Manufacturingwine Manufacturing
Gaming and Vending Machines Manufacturing
Clubs
Capital intensity
0.5
0.0
0.1
0.2
0.3
0.4
SOURCE: WWW.IBISWORLD.COM.AUDotted line shows a high level of capital intensity
Capital units per labour unit
ClubsAccommodation, Cafes and
Restaurants
Economy
Level The level of capital intensity is Medium

www.IbISwOrLd.COM.Au Clubs in Australia February 2012 25
Operating Conditions
revenue Volatility The industry generally has a low level of revenue volatility since it provides a form of entertainment. It generates revenue from a variety of areas, including food, beverages, general entertainment, sporting and other member facilities and especially gaming machines. Even when economic conditions are uncertain, quite often people will still attend clubs,
but re-allocate their scarce expenditure between food, beverages and gaming machines.
Despite the perennial attractive nature of the services that clubs provide, government regulation on smoking, liquor and gambling, especially recently, has seen heightened revenue volatility occur in the industry.
Technology& Systems
Technology and systems outlines the latest technology or systems in use by the industry. IBISWorld analysis indicates that the industry is subject to a medium level of technological progress.
The use of technology in the industry is available in the areas of financial and inventory control and systems. Computer software is now available to assist the club operator with wages and salaries control, inventory control, cash control, menu preparation and costing and general accounting.
Gaming machines is a main area of use of computerised technology for both gaming and for the individual monitoring of machines and now for the networking of machines across venues to allow for larger jackpots. Most clubs have to renew their gaming machines and games quite frequently (every two-to-three years) in order to retain the interest of members/
players. Security and monitoring systems are also now mandatory.
Increasingly the online monitoring and linking of gaming machines across clubs within a state to provide jackpots has occurred with the major suppliers of these services being Tabcorp Ltd and Tattersalls Ltd (including its subsidiary UniTAB Ltd).
Government regulation has seen a growing use in technology to implement its regulatory measures. In New South Wales in 2010, the government introduced hourly break reminder messages linked to member loyalty cards to encourage a decrease in the length of playing time. A scheme currently before federal parliament to have gaming machine users make mandatory precommitments to their gambling expenditure intends to use a national card system that will monitor gambling expenditure per player to prevent breaching their precommitment.
Level The level of Technology Change is Medium
SOURCE: WWW.IBISWORLD.COM.AU
Volatility vs. growth
reve
nue
vola
tility
* (%
)
1000
100
10
1
0.1
Five year annualised revenue growth (%)–30 –10 10 30 50 70
Hazardous
Stagnant
rollercoaster
blue chip
* Axis is in logarithmic scale
Clubs
A higher level of revenue volatility implies greater industry risk. Volatility can negatively affect long-term strategic decisions, such as the time frame for capital investment.
When a fi rm makes poor investment decisions it may face underutilised capacity if demand suddenly falls, or capacity constraints if it rises quickly.
Level The level of Volatility is Low

www.IbISwOrLd.COM.Au Clubs in Australia February 2012 26
Operating Conditions
regulation & Policy The overall level of regulation surrounding activity by the industry is regarded as heavy and increasing. The following details the main regulations. The industry is closely regulated and licensed under the various state and territory Liquor Licensing Commissions/Authorities as well as state Casino and Gaming Commissions.
Productivity Commission ReportThe Federal Government referred a review of the gambling industry to the Productivity Commission which presented its draft report in late 2009. The final report was released in early 2010. The report recommended a combination of operational, technological and harm minimisation and counselling support to address concerns about problem gambling. In detail, it recommended that venues be required to set a bet limit on gaming machines of $120 an hour, that hours for shutdown periods in hotels and clubs be extended and commence earlier and that ATMs be relocated away from gaming areas and with lower daily withdrawal limits. It also indicated that governments should investigate the possibility of ATMs being removed altogether from gambling venues, but is dependent on the outcome of Victoria’s impending ban on ATMs. It also recommended the liberalisation of domestic online gambling, and that gaming machine technology be changed over time to allow for more effective controls over activities of problem gamblers. It was recommended also that gamblers be allowed to seek redress through the courts for egregious behaviour by venues, to attract and retain their custom. The report also recommended better gambling education, including in schools, as well as enhanced counselling training and service coordination for people with gambling problems.
Gaming machinesIn response to community concern about the extent of problem gambling, the governments of New South Wales,
Victoria, Queensland and South Australia have introduced caps on gaming machine numbers. In New South Wales, the government has capped gaming machines at maximum of 450 for new facilities and the 17 largest clubs with more than 450 machines were given until 2006 to reduce their existing numbers by 10%. New clubs will be able to buy gaming machines under a new trading scheme. Also all clubs must close for a minimum of six hours each day.
While In New South Wales the cap of 450 gaming machines per club has been abolished, restrictions apply on moving gaming machines from areas with low to high levels of gaming. If gaming machines are relocated between club premises within a local council area, no forfeiture of machines applies. But if machines are to be relocated to another council area, then a forfeiture rate of one machine in six will apply instead of the general rate of one in three. Clubs are being encouraged to establish new ventures of up to 150 machines in areas with population growth. They are also encouraged to consolidate activities in their existing area of operation. Clubs will be able to locate operations within retail shopping centres as long as general access is restricted. Overall, the total number of gaming machines in New South Wales is to be reduced from 104,000 to 99,000, but with a review of this cap every five years by the Casino, Liquor and Gaming Control Authority. Other restrictions that apply include: the prohibition of ATM and EFTPOS facilities in hotels and clubs; prize-winning cheques are only able to be cashed by approved financial institutions; gaming machines are not to be audible or visible from the street; and a maximum of 15% of gaming machines are to be multi-terminal gaming machines (MTGM).
Victoria has also reduced gaming machine numbers in certain areas of the state as well as reduced the operating hours of 24-hour gaming venues, particularly in country areas. Any application for the expansion of gaming
Level & Trend The level of Regulation is Heavy and the trend is Increasing

www.IbISwOrLd.COM.Au Clubs in Australia February 2012 27
Operating Conditions
Industry Assistance The industry receives no government protection, but benefits from various tax concessions and exemptions under the mutuality principle of the Tax Act. Under this, clubs do not pay company tax on funds generated from members, and are exempt also from land tax and capital gains tax. Clubs also receive a
rebate on their gaming duty payments of $1.00 for every $3.00 given to an approved charity.
regulation & Policycontinued
machines in any venue in Victoria has to now be accompanied by a study of the economic and social impact analysis by the applicant. Also in Victoria all venues are required to have digital clocks displayed on each machine.
In April 2008, the Queensland Government initially announced an immediate moratorium on new gaming machine licences until 2010. This was subsequently extended for a further three-year period in early 2010. The cap for club gaming machines was set at 24,705, with a maximum of 280 machines in any club. The cap for hotels is an additional 20,000 for seven years. However, clubs will be able to purchase
licences from other venues that are closing or scaling back activities, via the twice-a-year government licence-auctioning system. The government will continue to garner 33% commission on every gaming machine licence traded and 100% for all new licences released.
Gaming machines outside of the casino are banned in Western Australia.
Smoking bansFrom 2006-2010, smoking bans in licensed premises have now been introduced in each state and territory. These bans have generally applied to indoor smoking only, allowing smoking in outdoor areas under certain conditions.
Level & Trend The level of Industry Assistance is Low and the trend is Steady
Clubs are exempt from certain business taxes such as company tax
www.IbISwOrLd.COM.Au Clubs in Australia February 2012 28
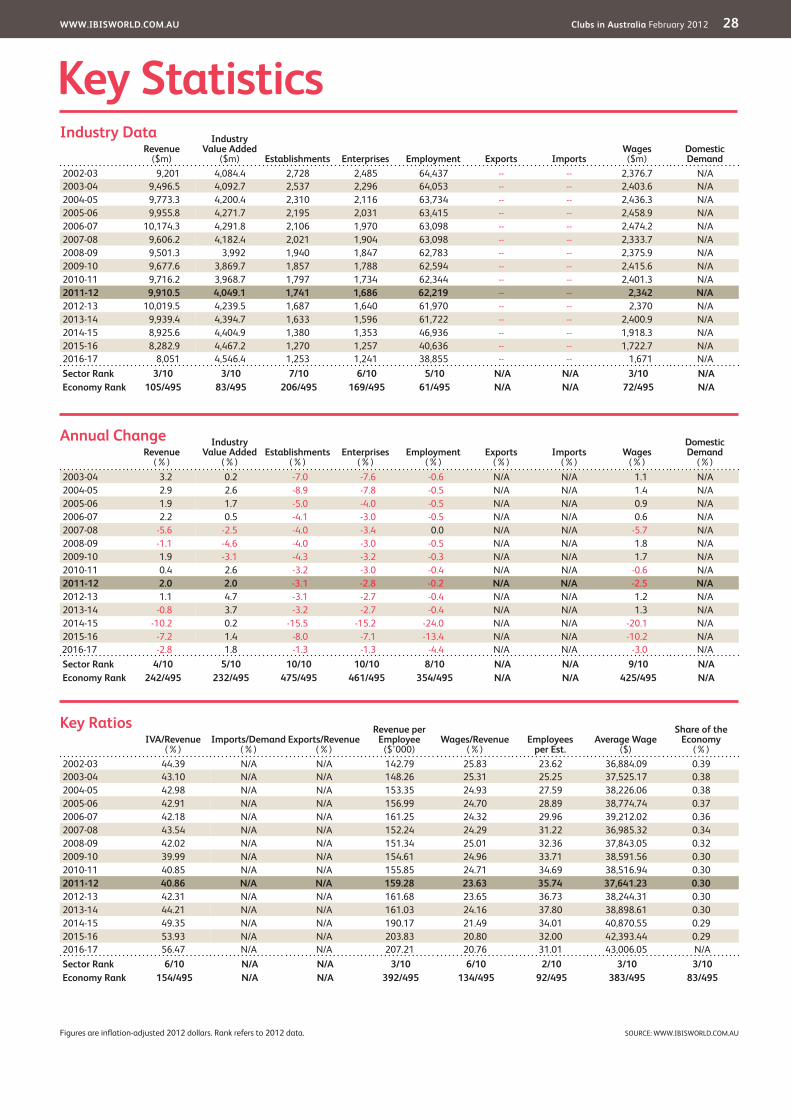
Key Statisticsrevenue
($m)
Industry Value Added
($m) Establishments Enterprises Employment Exports Importswages ($m)
domestic demand
2002-03 9,201 4,084.4 2,728 2,485 64,437 -- -- 2,376.7 N/A2003-04 9,496.5 4,092.7 2,537 2,296 64,053 -- -- 2,403.6 N/A2004-05 9,773.3 4,200.4 2,310 2,116 63,734 -- -- 2,436.3 N/A2005-06 9,955.8 4,271.7 2,195 2,031 63,415 -- -- 2,458.9 N/A2006-07 10,174.3 4,291.8 2,106 1,970 63,098 -- -- 2,474.2 N/A2007-08 9,606.2 4,182.4 2,021 1,904 63,098 -- -- 2,333.7 N/A2008-09 9,501.3 3,992 1,940 1,847 62,783 -- -- 2,375.9 N/A2009-10 9,677.6 3,869.7 1,857 1,788 62,594 -- -- 2,415.6 N/A2010-11 9,716.2 3,968.7 1,797 1,734 62,344 -- -- 2,401.3 N/A2011-12 9,910.5 4,049.1 1,741 1,686 62,219 -- -- 2,342 n/A2012-13 10,019.5 4,239.5 1,687 1,640 61,970 -- -- 2,370 N/A2013-14 9,939.4 4,394.7 1,633 1,596 61,722 -- -- 2,400.9 N/A2014-15 8,925.6 4,404.9 1,380 1,353 46,936 -- -- 1,918.3 N/A2015-16 8,282.9 4,467.2 1,270 1,257 40,636 -- -- 1,722.7 N/A2016-17 8,051 4,546.4 1,253 1,241 38,855 -- -- 1,671 N/ASector rank 3/10 3/10 7/10 6/10 5/10 n/A n/A 3/10 n/AEconomy rank 105/495 83/495 206/495 169/495 61/495 n/A n/A 72/495 n/A
IVA/revenue (%)
Imports/demand (%)
Exports/revenue (%)
revenue per Employee
($’000)wages/revenue
(%)Employees
per Est.Average wage
($)
Share of the Economy
(%)2002-03 44.39 N/A N/A 142.79 25.83 23.62 36,884.09 0.392003-04 43.10 N/A N/A 148.26 25.31 25.25 37,525.17 0.382004-05 42.98 N/A N/A 153.35 24.93 27.59 38,226.06 0.382005-06 42.91 N/A N/A 156.99 24.70 28.89 38,774.74 0.372006-07 42.18 N/A N/A 161.25 24.32 29.96 39,212.02 0.362007-08 43.54 N/A N/A 152.24 24.29 31.22 36,985.32 0.342008-09 42.02 N/A N/A 151.34 25.01 32.36 37,843.05 0.322009-10 39.99 N/A N/A 154.61 24.96 33.71 38,591.56 0.302010-11 40.85 N/A N/A 155.85 24.71 34.69 38,516.94 0.302011-12 40.86 n/A n/A 159.28 23.63 35.74 37,641.23 0.302012-13 42.31 N/A N/A 161.68 23.65 36.73 38,244.31 0.302013-14 44.21 N/A N/A 161.03 24.16 37.80 38,898.61 0.302014-15 49.35 N/A N/A 190.17 21.49 34.01 40,870.55 0.292015-16 53.93 N/A N/A 203.83 20.80 32.00 42,393.44 0.292016-17 56.47 N/A N/A 207.21 20.76 31.01 43,006.05 N/ASector rank 6/10 n/A n/A 3/10 6/10 2/10 3/10 3/10Economy rank 154/495 n/A n/A 392/495 134/495 92/495 383/495 83/495
Figures are inflation-adjusted 2012 dollars. Rank refers to 2012 data.
revenue (%)
Industry Value Added
(%)Establishments
(%)Enterprises
(%)Employment
(%)Exports
(%)Imports
(%)wages
(%)
domestic demand
(%)2003-04 3.2 0.2 -7.0 -7.6 -0.6 N/A N/A 1.1 N/A2004-05 2.9 2.6 -8.9 -7.8 -0.5 N/A N/A 1.4 N/A2005-06 1.9 1.7 -5.0 -4.0 -0.5 N/A N/A 0.9 N/A2006-07 2.2 0.5 -4.1 -3.0 -0.5 N/A N/A 0.6 N/A2007-08 -5.6 -2.5 -4.0 -3.4 0.0 N/A N/A -5.7 N/A2008-09 -1.1 -4.6 -4.0 -3.0 -0.5 N/A N/A 1.8 N/A2009-10 1.9 -3.1 -4.3 -3.2 -0.3 N/A N/A 1.7 N/A2010-11 0.4 2.6 -3.2 -3.0 -0.4 N/A N/A -0.6 N/A2011-12 2.0 2.0 -3.1 -2.8 -0.2 n/A n/A -2.5 n/A2012-13 1.1 4.7 -3.1 -2.7 -0.4 N/A N/A 1.2 N/A2013-14 -0.8 3.7 -3.2 -2.7 -0.4 N/A N/A 1.3 N/A2014-15 -10.2 0.2 -15.5 -15.2 -24.0 N/A N/A -20.1 N/A2015-16 -7.2 1.4 -8.0 -7.1 -13.4 N/A N/A -10.2 N/A2016-17 -2.8 1.8 -1.3 -1.3 -4.4 N/A N/A -3.0 N/ASector rank 4/10 5/10 10/10 10/10 8/10 n/A n/A 9/10 n/AEconomy rank 242/495 232/495 475/495 461/495 354/495 n/A n/A 425/495 n/A
Annual Change
Key ratios
Industry data
SOURCE: WWW.IBISWORLD.COM.AU

www.IbISwOrLd.COM.Au Clubs in Australia February 2012 29
Jargon & Glossary
bArrIErS TO EnTry Barriers to entry can be High, Medium or Low. High means new companies struggle to enter an industry, while Low means it is easy for a firm to enter an industry.
CAPITAL/LAbOur InTEnSITy An indicator of how much capital is used in production as opposed to labour. Level is stated as High, Medium or Low. High is a ratio of less than $3 of wage costs for every $1 of depreciation; Medium is $3-$8 of wage costs to $1 of depreciation; Low is greater than $8 of wage costs for every $1 of depreciation.
COnSTAnT PrICES The dollar figures in the Key Statistics table, including forecasts, are adjusted for inflation using 2011-12 as the base year. This removes the impact of changes in the purchasing power of the dollar, leaving only the ‘real’ growth or decline in industry metrics. The inflation adjustments in IBISWorld’s reports are made using the Australian Bureau of Statistics’ implicit GDP price deflator.
dOMESTIC dEMAnd The use of goods and services within Australia; the sum of imports and domestic production minus exports.
EArnInGS bEFOrE InTErEST And TAX (EbIT) IBISWorld uses EBIT as an indicator of a company’s profitability. It is calculated as revenue minus expenses, excluding tax and interest.
EMPLOyMEnT The number of working proprietors, partners, permanent, part-time, temporary and casual employees, and managerial and executive employees.
EnTErPrISE A division that is separately managed and keeps management accounts. The most relevant measure of the number of firms in an industry.
ESTAbLISHMEnT The smallest type of accounting unit within an Enterprise; usually consists of one or more locations in a state or territory of the country in which it operates.
EXPOrTS The total sales and transfers of goods produced by an industry that are exported.
IMPOrTS The value of goods and services imported with the amount payable to non-residents.
InduSTry COnCEnTrATIOn IBISWorld bases concentration on the top four firms. Concentration is identified as High, Medium or Low. High means the top four players account for over 70% of revenue; Medium is 40 –70% of revenue; Low is less than 40%.
InduSTry rEVEnuE The total sales revenue of the industry, including sales (exclusive of excise and sales tax) of goods and services; plus transfers to other firms of the same business; plus subsidies on production; plus all other operating income from outside the firm (such as commission income, repair and service income, and rent, leasing and hiring income); plus capital work done by rental or lease. Receipts from interest royalties, dividends and the sale of fixed tangible assets are excluded.
InduSTry VALuE AddEd The market value of goods and services produced by an industry minus the cost of goods and services used in the production process, which leaves the gross product of the industry (also called its Value Added).
InTErnATIOnAL TrAdE The level is determined by: Exports/Revenue: Low is 0-5%; Medium is 5-20%; High is over 20%. Imports/Domestic Demand: Low is 0-5%; Medium is 5-35%; and High is over 35%.
LIFE CyCLE All industries go through periods of Growth, Maturity and Decline. An average life cycle lasts 70 years. Maturity is the longest stage at 40 years with Growth and Decline at 15 years each.
nOn-EMPLOyInG ESTAbLISHMEnT Businesses with no paid employment and payroll are known as non-employing establishments. These are mostly set-up by self employed individuals.
VOLATILITy The level of volatility is determined by the percentage change in revenue over the past five years. Volatility levels: Very High is greater than ±20%; High Volatility is between ±10% and ±20%; Moderate Volatility is between ±3% and ±10%; and Low Volatility is less than ±3%.
wAGES The gross total wages and salaries of all employees of the establishment.
Industry Jargon
IbISworld Glossary
FOOd SErVICE Provision of food and beverage services to patrons.
nET rEVEnuE For gambling establishments, revenue retained by clubs after payment of all prizes and winnings. This figure equates to patrons’ gambling losses.
POKEr MACHInES A gambling machine on which certain combinations of symbols determine a win. Also termed gaming machines, slot machines and pokies.

disclaimer
This product has been supplied by IBISWorld Pty Ltd. (‘IBISWorld’) solely for use by its authorised licenses strictly in accordance with their license agreements with IBISWorld. IBISWorld makes no representation to any other person with regard to the completeness or accuracy of the data or information contained herein, and it accepts no responsibility and disclaims all liability (save for liability which cannot be lawfully disclaimed) for loss or damage whatsoever suffered or incurred by any other person resulting from
the use of, or reliance upon, the data or information contained herein. Copyright in this publication is owned by IBISWorld Pty Ltd. The publication is sold on the basis that the purchaser agrees not to copy the material contained within it for other than the purchasers own purposes. In the event that the purchaser uses or quotes from the material in this publication – in papers, reports, or opinions prepared for any other person – it is agreed that it will be sourced to: IBISWorld Pty Ltd
At IBISWorld we know that industry intelligence is more than assembling factsIt is combining data with analysis to answer the questions that successful businesses askIdentify high growth, emerging & shrinking marketsArm yourself with the latest industry intelligenceAssess competitive threats from existing & new entrantsbenchmark your performance against the competitionMake speedy market-ready, profit-maximising decisions
who is IbISworld?We are strategists, analysts, researchers, and marketers. We provide answers to information-hungry, time-poor businesses. Our goal is to provide real world answers that matter to your business in our 500 Australian industry reports. When tough strategic, budget, sales and marketing decisions need to be made, our suite of Industry and Risk intelligence products give you deeply-researched answers quickly.
IbISworld MembershipIBISWorld offers tailored membership packages to meet your needs.
Copyright 2012 IBISWorld Pty Ltd
www.ibisworld.com.au | (03) 9655 3881 | [email protected]