Embed Size (px)
Citation preview
8/6/2019 i Might Need It-s.africa
http://slidepdf.com/reader/full/i-might-need-it-safrica 1/55
Industrialand EmploymentRelationsDepartment(DIALOGUE) D
I A L O G U E
Industrial relationsand collective bargaining:Trends and developments
in South A rica
Debbie Budlender
Community Agency for Social EnquirySouth Africa
Working Paper No. 2
May 2009
8/6/2019 i Might Need It-s.africa
http://slidepdf.com/reader/full/i-might-need-it-safrica 2/55
Working Paper No. 2
Industrial relations and collective bargaining:Trends and developments in South Africa
Debbie BudlenderCommunity Agency for Social Enquiry
Social Dialogue, Labour Law andLabour Administration Branch,
International Labour Office •
GenevaMay 2009

8/6/2019 i Might Need It-s.africa
http://slidepdf.com/reader/full/i-might-need-it-safrica 3/55
Copyright © International Labour Organization 2009First published 2009
Publications of the International Labour Office enjoy copyright under Protocol 2 of the Universal Copyright
Convention. Nevertheless, short excerpts from them may be reproduced without authorization, on condition that thesource is indicated. For rights of reproduction or translation, application should be made to ILO Publications (Rightsand Permissions), International Labour Office, CH-1211 Geneva 22, Switzerland, or by email: [email protected]. TheInternational Labour Office welcomes such applications.
Libraries, institutions and other users registered with reproduction rights organizations may make copies in accordance with the licences issued to them for this purpose. Visit www.ifrro.org to find the reproduction rights organization inyour country.
ILO Cataloguing in Publication Data
Budlender, Debbie
Industrial relations and collective bargaining: Trends and developments in South Africa / Debbie Budlender ;International Labour Office, Social Dialogue, Labour Law and Labour Administration Branch. - Geneva: ILO, 2009
ca. 50 p. (Working Paper No. 2)
ISBN: 9789221223726;9789221223733 (web pdf)
International Labour Office; Social Dialogue, Labour Law and Labour Administration Branch
labour relations / collective bargaining / wage determination / South Africa R /
13.06.1
ILO publications, which are in conformity with United Nations practice, and the presentation of material therein donot imply the expression of any opinion whatsoever on the part of the International Labour Office concerning thelegal status of any country, area or territory or of its authorities, or concerning the delimitation of its frontiers.
The responsibility for opinions expressed in signed articles, studies and other contributions rests solely with theirauthors, and publication does not constitute an endorsement by the International Labour Office of the opinionsexpressed in them.
Reference to names of firms and commercial products and processes does not imply their endorsement by theInternational Labour Office, and any failure to mention a particular firm, commercial product or process is not a signof disapproval.
ILO publications and electronic products can be obtained through major booksellers or ILO local offices in many countries, or direct from ILO Publications, International Labour Office, CH-1211 Geneva 22, Switzerland. Cataloguesor lists of new publications are available free of charge from the above address, or by email: [email protected]
Visit our website: www.ilo.org/publns
Printed in Switzerland
8/6/2019 i Might Need It-s.africa
http://slidepdf.com/reader/full/i-might-need-it-safrica 4/55
iii
Foreword
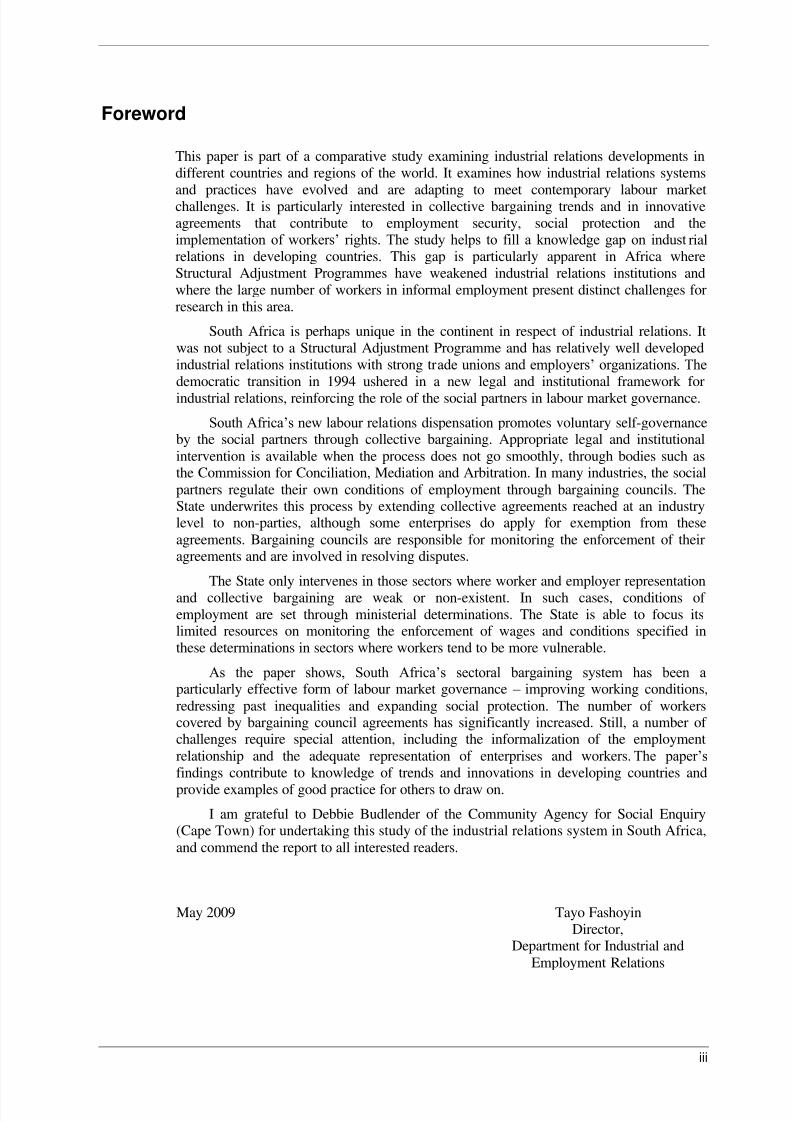
This paper is part of a comparative study examining industrial relations developments indifferent countries and regions of the world. It examines how industrial relations systems
and practices have evolved and are adapting to meet contemporary labour marketchallenges. It is particularly interested in collective bargaining trends and in innovativeagreements that contribute to employment security, social protection and theimplementation of workers‟ rights. The study helps to fill a knowledge gap on indust rialrelations in developing countries. This gap is particularly apparent in Africa whereStructural Adjustment Programmes have weakened industrial relations institutions andwhere the large number of workers in informal employment present distinct challenges forresearch in this area.
South Africa is perhaps unique in the continent in respect of industrial relations. Itwas not subject to a Structural Adjustment Programme and has relatively well developedindustrial relations institutions with strong tr ade unions and employers‟ organizations. Thedemocratic transition in 1994 ushered in a new legal and institutional framework forindustrial relations, reinforcing the role of the social partners in labour market governance.
South Africa‟s new labour rela tions dispensation promotes voluntary self-governanceby the social partners through collective bargaining. Appropriate legal and institutionalintervention is available when the process does not go smoothly, through bodies such asthe Commission for Conciliation, Mediation and Arbitration. In many industries, the socialpartners regulate their own conditions of employment through bargaining councils. TheState underwrites this process by extending collective agreements reached at an industrylevel to non-parties, although some enterprises do apply for exemption from theseagreements. Bargaining councils are responsible for monitoring the enforcement of theiragreements and are involved in resolving disputes.
The State only intervenes in those sectors where worker and employer representationand collective bargaining are weak or non-existent. In such cases, conditions of employment are set through ministerial determinations. The State is able to focus itslimited resources on monitoring the enforcement of wages and conditions specified inthese determinations in sectors where workers tend to be more vulnerable.
As the paper shows, South Africa‟s sectoral bargaining system has been aparticularly effective form of labour market governance – improving working conditions,redressing past inequalities and expanding social protection. The number of workerscovered by bargaining council agreements has significantly increased. Still, a number of challenges require special attention, including the informalization of the employmentrelationship and the adequate representation of enterprises and workers. The paper‟sfindings contribute to knowledge of trends and innovations in developing countries andprovide examples of good practice for others to draw on.
I am grateful to Debbie Budlender of the Community Agency for Social Enquiry(Cape Town) for undertaking this study of the industrial relations system in South Africa,and commend the report to all interested readers.
May 2009 Tayo FashoyinDirector,
Department for Industrial andEmployment Relations

8/6/2019 i Might Need It-s.africa
http://slidepdf.com/reader/full/i-might-need-it-safrica 5/55
8/6/2019 i Might Need It-s.africa
http://slidepdf.com/reader/full/i-might-need-it-safrica 6/55

8/6/2019 i Might Need It-s.africa
http://slidepdf.com/reader/full/i-might-need-it-safrica 7/55
8/6/2019 i Might Need It-s.africa
http://slidepdf.com/reader/full/i-might-need-it-safrica 8/55
vii
Acronyms
ANC African National Congress
ASGISA Accelerated and shared growth initiative for South Africa
BCEA Basic Conditions of Employment Act
BEE Black economic empowerment
CAESAR Consolidated Association of Employers of Southern African Region
CCMA Commission for Conciliation, Mediation and Arbitration
CMT Cut-make-and-trim
COSATU Congress of South African Trade Unions
CPIX Consumer price index excluding mortgages
DENOSA Democratic Nursing Organisation of South Africa
EPWP Expanded public works programme
ESOP Employee share ownership
FEDUSA Federation of Unions of South Africa
GEAR Growth, Employment & Redistribution
IMATU Independent Municipal & Allied Trade Union
LFS Labour force survey
LRA Labour Relations Act
MTBPS Medium-term Budget Policy Statement
NACTU National Council of Trade Unions
NEDLAC National Economic Development and Labour Council
NEHAWU National Education, Health and Welfare Union
NUM National Union of Mineworkers
OSD Occupation-specific dispensation
PSCBC Public sector central bargaining council
RDP Reconstruction and Development Programme
SACCAWU South African Commercial, Catering & Allied Workers Union
SACTWU Southern African Clothing & Textile Workers Union
SALGA South African Local Government Association
SALGBC South African Local Government Bargaining Council
SAMWU South African Municipal Workers Union
SATAWU South African Transport & Allied Workers Union
SETA Sector education and training authority
UASA United Association of South Africa

8/6/2019 i Might Need It-s.africa
http://slidepdf.com/reader/full/i-might-need-it-safrica 9/55
8/6/2019 i Might Need It-s.africa
http://slidepdf.com/reader/full/i-might-need-it-safrica 10/55
1
Introduction
This paper is part of a multi-country study initiated by the International Labour Office inGeneva. The multi-country study seeks to examine:
the role of the socio-economic and political context, the evolution of the bargaining
structure, the institutional context, the strengths or weaknesses of parties and the roleof public policy in determining the quality of labour relations; the role of collective bargaining in wage policy; and the role of collective bargaining in addressing contemporary issues such as HIV/AIDS
and in contributing to effective labour market governance.
This paper draws on a review of the literature, interviews with key informants frombusiness, labour, government and other organisations working on labour issues, and thepersonal knowledge and experience of the author. Persons interviewed for this particularpaper are listed in the Appendix.
The paper is organised into four parts, as follows:
Setting the context: a general but brief overview of the socio-economic andpolitical environment.
The legislative and institutional framework: a brief overview of key aspects of the law. This overview is supplemented by an appendix which gives more detailon the Labour Relations Act of 1995 which underpins the industrial relationssystem and collective bargaining. This section also provides facts and figures onkey labour, employer and state institutions, and describes how collectivebargaining and dialogue happen in the country.
Collective bargaining and wages: describes the trends in wages and conditionsdetermined both through collective bargaining and through the regulatory
mechanism of sectoral determinations. Addressing the challenges: a set of case studies, spanning different parts of the
economy, which highlight how a range of different issues and challenges havebeen addressed through collective bargaining.
The paper focuses on the period from the official ending of apartheid in 1994 to theinstallation of the first democratic government. However, while more than 14 years havenow passed since the momentous 1994 elections, the socio-economic and politicalsituation in South Africa still bears many elements which reflect the apartheid past. Mostsections of this paper will thus refer to this past so as to point out where current patternshave been influenced. The paper does not, however, provide a comprehensive picture of the pre-1994 period, but instead highlights only those aspects that continue to shape the
present.

8/6/2019 i Might Need It-s.africa
http://slidepdf.com/reader/full/i-might-need-it-safrica 11/55
2
1. Setting the context
The general overview of the socio-economic and political environment presented in thissection focuses on the twenty-first century, the period after the first years of transition. The
overview does, however, include references to what happened during the apartheid era pre-1994 as, although the end of apartheid constitutes a distinct rupture, there are someimportant continuities from the earlier period. In addition, the particular political history of South Africa needs to be appreciated in order to understand some of the ways in whichSouth Africa has deviated from the standard developments that occurred in many otherAfrican countries.
Of particular importance in the more recent evolution of the labour relations systemis the fact that the Congress of South African Trade Unions (COSATU), the largest tradeunion federation in the country, was one of the partners in the tripartite alliance thatconvincingly won the 1994 elections and has triumphed in elections since that date.COSATU has sometimes complained that it is not given sufficient weight within thealliance, but its presence has certainly strongly shaped the development of laws,institutions and practices from macro to micro level. This has happened against abackground of unemployment and income inequality rates that are unusually high ininternational terms and higher levels of poverty than would be expected given the overalllevel of economic development.
In terms of basic economic indicators, South Africa has performed relatively wellsince 2000. The recent Medium Term Budget Policy Statement (MTBPS) 2008 (NationalTreasury, 2008:1) notes that economic growth has averaged 5.1% annually between 2004and 2007, after a lower 3.2% average in the previous three years. In 2007, gross domesticproduct thus stood at R1,996.9 billion, with the estimate for 2008 standing at R2,303.6billion (National Treasury, 2008:8). The MTBPS notes fur ther that “[b]uoyant investmentand favourable terms of trade have contributed to rising incomes and employment”, and
estimates that approximately two million jobs were created between 2003 and 2008.However, the same document notes that the immediate future does not look as bright,citing the imminent international economic downturn as well as local pressures of severeshortages of skilled labour and ageing infrastructure. Growth is thus projected at 3.7% for2008 and 3.0% for 2009, with an upturn to 4% in 2010.
The country has a policy of inflation targeting, with the Reserve Bank attempting – primarily through interest rate control – to keep the consumer price index, after adjustmentfor mortgages (CPIX), between 3% and 6%. This target was achieved from the second half of 2003 through to early 2007. Since that time, however, inflation has pushed far beyondthe target, reaching 12.9% for historical metropolitan and other urban areas in July 2008(Statistics South Africa, statistical releases). The increases have been largely driven by
sharp increases in food and fuel prices. Economists are divided on when a decrease towithin the target can be expected. The National Treasury (2008: 13) forecasts an averageof 6.2% for 2009, 5.3% for 2010 and 4.7% for 2011. Interpreting trends over comingmonths will be complicated by the decision by Statistics South Africa to change themethod of calculating inflation, based on research that suggests, among others, that foodhas received far too high a weighting in calculations to date.
Interpreting trends in labour market statistics is similarly complicated by a recentmethodological change in conducting labour force surveys. In 2008 Statistics South Africaannounced the results of the first round of the “re -engineered” Quart erly Labour ForceSurvey. In addition to changing the periodicity of the survey from six-monthly to quarterly,Statistics South Africa now excludes non-market labour market involvement whenmeasuring employment and unemployment. While non-market activities are not nearly asextensive in South Africa as in many other African countries, they are large enough toprevent easy comparisons across the two series. Statistics South Africa has generated a
8/6/2019 i Might Need It-s.africa
http://slidepdf.com/reader/full/i-might-need-it-safrica 12/55
3
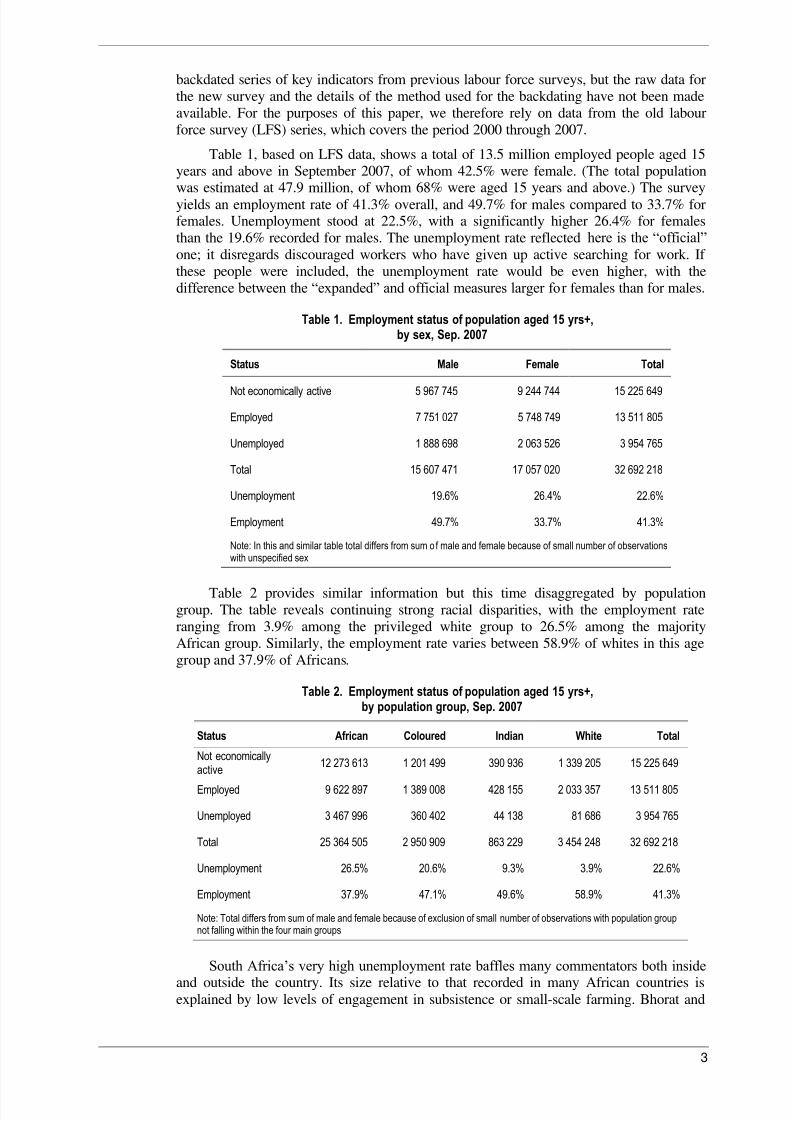
backdated series of key indicators from previous labour force surveys, but the raw data forthe new survey and the details of the method used for the backdating have not been madeavailable. For the purposes of this paper, we therefore rely on data from the old labourforce survey (LFS) series, which covers the period 2000 through 2007.
Table 1, based on LFS data, shows a total of 13.5 million employed people aged 15years and above in September 2007, of whom 42.5% were female. (The total populationwas estimated at 47.9 million, of whom 68% were aged 15 years and above.) The surveyyields an employment rate of 41.3% overall, and 49.7% for males compared to 33.7% forfemales. Unemployment stood at 22.5%, with a significantly higher 26.4% for femalesthan the 19.6% recorded for males. The unemployment rate reflected here is the “official”one; it disregards discouraged workers who have given up active searching for work. If these people were included, the unemployment rate would be even higher, with thedifference between the “expanded” and official measures larger fo r females than for males.
Table 1. Employment status of population aged 15 yrs+,by sex, Sep. 2007
Status Male Female Total
Not economically active 5 967 745 9 244 744 15 225 649
Employed 7 751 027 5 748 749 13 511 805
Unemployed 1 888 698 2 063 526 3 954 765
Total 15 607 471 17 057 020 32 692 218
Unemployment 19.6% 26.4% 22.6%
Employment 49.7% 33.7% 41.3%
Note: In this and similar table total differs from sum of male and female because of small number of observationswith unspecified sex
Table 2 provides similar information but this time disaggregated by populationgroup. The table reveals continuing strong racial disparities, with the employment rateranging from 3.9% among the privileged white group to 26.5% among the majorityAfrican group. Similarly, the employment rate varies between 58.9% of whites in this agegroup and 37.9% of Africans.
Table 2. Employment status of population aged 15 yrs+,by population group, Sep. 2007
Status African Coloured Indian White Total
Not economicallyactive 12 273 613 1 201 499 390 936 1 339 205 15 225 649
Employed 9 622 897 1 389 008 428 155 2 033 357 13 511 805
Unemployed 3 467 996 360 402 44 138 81 686 3 954 765
Total 25 364 505 2 950 909 863 229 3 454 248 32 692 218
Unemployment 26.5% 20.6% 9.3% 3.9% 22.6%
Employment 37.9% 47.1% 49.6% 58.9% 41.3%
Note: Total differs from sum of male and female because of exclusion of small number of observations with population groupnot falling within the four main groups
South Africa‟s very high unemployment rate baffles many commentators both insideand outside the country. Its size relative to that recorded in many African countries isexplained by low levels of engagement in subsistence or small-scale farming. Bhorat and
8/6/2019 i Might Need It-s.africa
http://slidepdf.com/reader/full/i-might-need-it-safrica 13/55
4
Kanbur (2007) claim that while South Africa‟s unemployment rate is very unusualcompared to those in other regions, it is not an outlier when the comparison is restricted toother countries in Southern Africa.
Unemployment is currently lower than a few years ago. Thus the LFS of five yearsbefore, in September 2002, yielded an official unemployment rate of 30.2% and anemployment rate of 37.6%. For women, unemployment stood at 34.5%, and for Africans at36.4%. The decrease over the past few years should not, however, detract from theseriousness of the unemployment question in South Africa.
Some commentators suggest that South Africa‟s extensive grant system contributesto the high unemployment rate. The system is indeed extensive. In August 2008, forexample, the grant database recorded a total of over 9 million beneficiaries, of which 2.3million were recorded for the old age grant, 4.9 million for the child support grant,1.4 million for the disability grant, and smaller numbers for the other grants. 1 (Some of these beneficiaries – in particular those receiving child grants – were receiving grants inrespect of more than one person.) The link with high unemployment can be questioned ontwo grounds. Firstly, none of the grants target able-bodied people of working age.Secondly, research (Posel, 2004) has suggested that receipt of a grant within a householdoften facilitates work-seeking by other members – particularly younger women – ratherthan discouraging it.
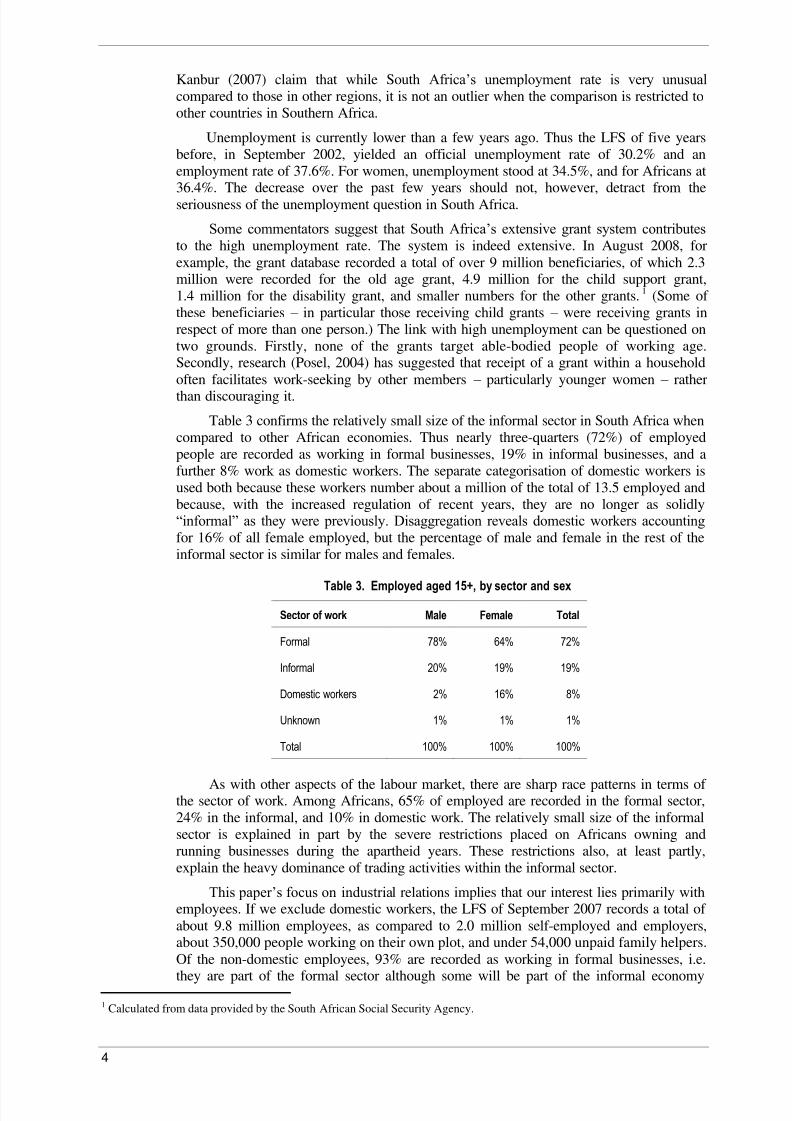
Table 3 confirms the relatively small size of the informal sector in South Africa whencompared to other African economies. Thus nearly three-quarters (72%) of employedpeople are recorded as working in formal businesses, 19% in informal businesses, and afurther 8% work as domestic workers. The separate categorisation of domestic workers isused both because these workers number about a million of the total of 13.5 employed andbecause, with the increased regulation of recent years, they are no longer as solidly“informal” as they were previously. Disaggregation reveals domestic workers accountingfor 16% of all female employed, but the percentage of male and female in the rest of theinformal sector is similar for males and females.
Table 3. Employed aged 15+, by sector and sex
Sector of work Male Female Total
Formal 78% 64% 72%
Informal 20% 19% 19%
Domestic workers 2% 16% 8%
Unknown 1% 1% 1%
Total 100% 100% 100%
As with other aspects of the labour market, there are sharp race patterns in terms of the sector of work. Among Africans, 65% of employed are recorded in the formal sector,24% in the informal, and 10% in domestic work. The relatively small size of the informalsector is explained in part by the severe restrictions placed on Africans owning andrunning businesses during the apartheid years. These restrictions also, at least partly,explain the heavy dominance of trading activities within the informal sector.
This paper‟s focus on industria l relations implies that our interest lies primarily withemployees. If we exclude domestic workers, the LFS of September 2007 records a total of about 9.8 million employees, as compared to 2.0 million self-employed and employers,about 350,000 people working on their own plot, and under 54,000 unpaid family helpers.Of the non-domestic employees, 93% are recorded as working in formal businesses, i.e.
they are part of the formal sector although some will be part of the informal economy1 Calculated from data provided by the South African Social Security Agency.
8/6/2019 i Might Need It-s.africa
http://slidepdf.com/reader/full/i-might-need-it-safrica 14/55
5
because they are employed, for example, on a casual basis. It is among these 9.1 millionworkers that one would expect to find most examples of collective bargaining. Of the9.1 million, 43% are African males, 23% African females, 10% white males and 8% whitefemales. Whites are thus over-represented among this grouping of workers, but Africansare in a very clear majority.
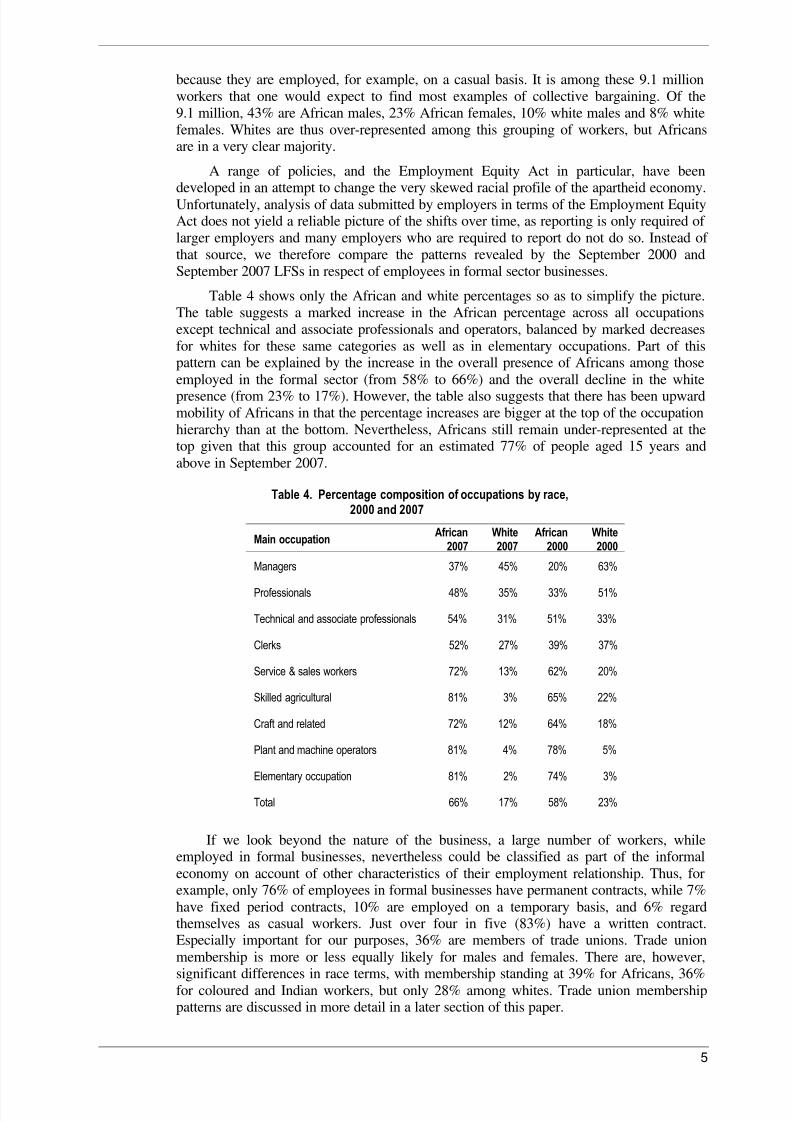
A range of policies, and the Employment Equity Act in particular, have beendeveloped in an attempt to change the very skewed racial profile of the apartheid economy.Unfortunately, analysis of data submitted by employers in terms of the Employment EquityAct does not yield a reliable picture of the shifts over time, as reporting is only required of larger employers and many employers who are required to report do not do so. Instead of that source, we therefore compare the patterns revealed by the September 2000 andSeptember 2007 LFSs in respect of employees in formal sector businesses.
Table 4 shows only the African and white percentages so as to simplify the picture.The table suggests a marked increase in the African percentage across all occupationsexcept technical and associate professionals and operators, balanced by marked decreasesfor whites for these same categories as well as in elementary occupations. Part of thispattern can be explained by the increase in the overall presence of Africans among thoseemployed in the formal sector (from 58% to 66%) and the overall decline in the whitepresence (from 23% to 17%). However, the table also suggests that there has been upwardmobility of Africans in that the percentage increases are bigger at the top of the occupationhierarchy than at the bottom. Nevertheless, Africans still remain under-represented at thetop given that this group accounted for an estimated 77% of people aged 15 years andabove in September 2007.
Table 4. Percentage composition of occupations by race,2000 and 2007
Main occupation African2007
White2007
African2000
White2000
Managers 37% 45% 20% 63%
Professionals 48% 35% 33% 51%
Technical and associate professionals 54% 31% 51% 33%
Clerks 52% 27% 39% 37%
Service & sales workers 72% 13% 62% 20%
Skilled agricultural 81% 3% 65% 22%
Craft and related 72% 12% 64% 18%
Plant and machine operators 81% 4% 78% 5%
Elementary occupation 81% 2% 74% 3%
Total 66% 17% 58% 23%
If we look beyond the nature of the business, a large number of workers, whileemployed in formal businesses, nevertheless could be classified as part of the informaleconomy on account of other characteristics of their employment relationship. Thus, forexample, only 76% of employees in formal businesses have permanent contracts, while 7%have fixed period contracts, 10% are employed on a temporary basis, and 6% regardthemselves as casual workers. Just over four in five (83%) have a written contract.Especially important for our purposes, 36% are members of trade unions. Trade unionmembership is more or less equally likely for males and females. There are, however,
significant differences in race terms, with membership standing at 39% for Africans, 36%for coloured and Indian workers, but only 28% among whites. Trade union membershippatterns are discussed in more detail in a later section of this paper.
8/6/2019 i Might Need It-s.africa
http://slidepdf.com/reader/full/i-might-need-it-safrica 15/55
6
An article by the Department of Labour (2005) suggests that the extent of atypicalwork has increased as a result of three inter-related processes, namely casualisation,externalization and informalisation (unregulated). Externalisation is defined as instanceswhere, instead of a labour contract, some form of commercial contract is entered into.Outsourcing, subcontracting, home-working and use of temporary employment serviceswould fall in this category. Informalisation is defined as cases where the business operatesinformally, disregarding regulations. The latter would be similar to the informal sector,
while the other two can occur within formal businesses. The article suggests that inSeptember 2003 atypical workers accounts for 56% of all construction workers, 30% inagriculture, 26% in wholesale and retail trade and 24% in transport.
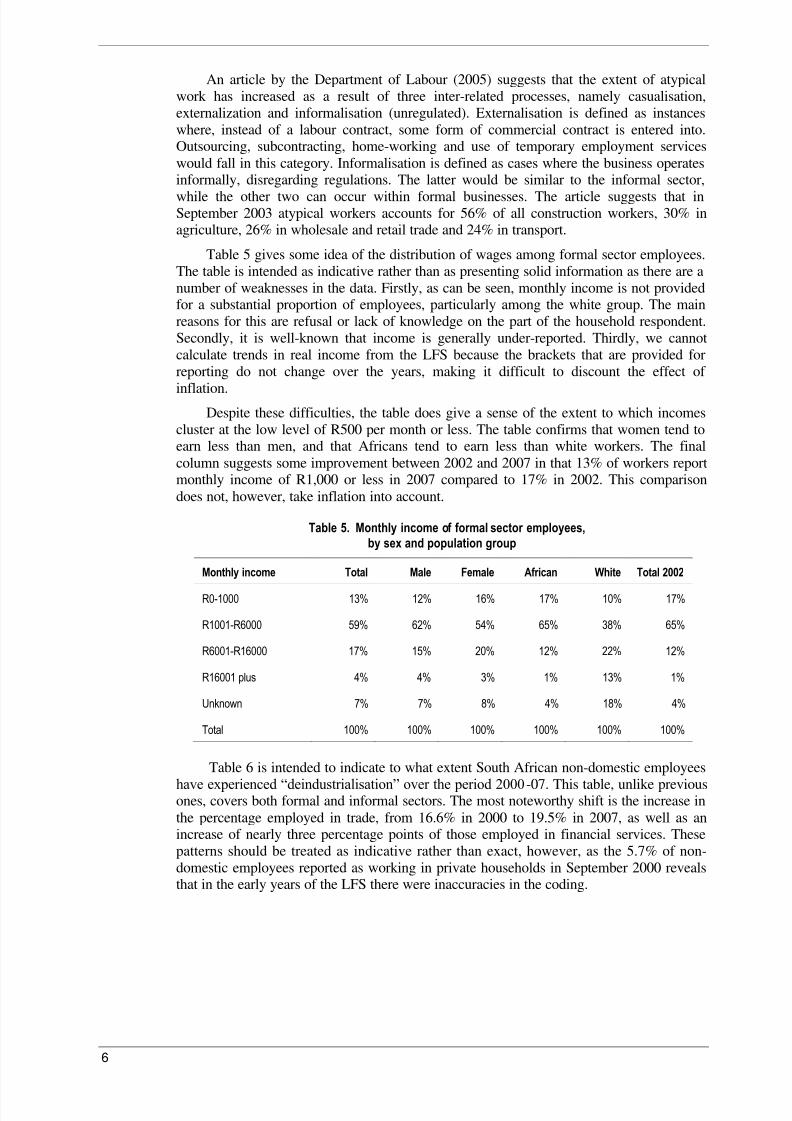
Table 5 gives some idea of the distribution of wages among formal sector employees.The table is intended as indicative rather than as presenting solid information as there are anumber of weaknesses in the data. Firstly, as can be seen, monthly income is not providedfor a substantial proportion of employees, particularly among the white group. The mainreasons for this are refusal or lack of knowledge on the part of the household respondent.Secondly, it is well-known that income is generally under-reported. Thirdly, we cannotcalculate trends in real income from the LFS because the brackets that are provided forreporting do not change over the years, making it difficult to discount the effect of
inflation.Despite these difficulties, the table does give a sense of the extent to which incomes
cluster at the low level of R500 per month or less. The table confirms that women tend toearn less than men, and that Africans tend to earn less than white workers. The finalcolumn suggests some improvement between 2002 and 2007 in that 13% of workers reportmonthly income of R1,000 or less in 2007 compared to 17% in 2002. This comparisondoes not, however, take inflation into account.
Table 5. Monthly income of formal sector employees,by sex and population group
Monthly income Total Male Female African White Total 2002
R0-1000 13% 12% 16% 17% 10% 17%
R1001-R6000 59% 62% 54% 65% 38% 65%
R6001-R16000 17% 15% 20% 12% 22% 12%
R16001 plus 4% 4% 3% 1% 13% 1%
Unknown 7% 7% 8% 4% 18% 4%
Total 100% 100% 100% 100% 100% 100%
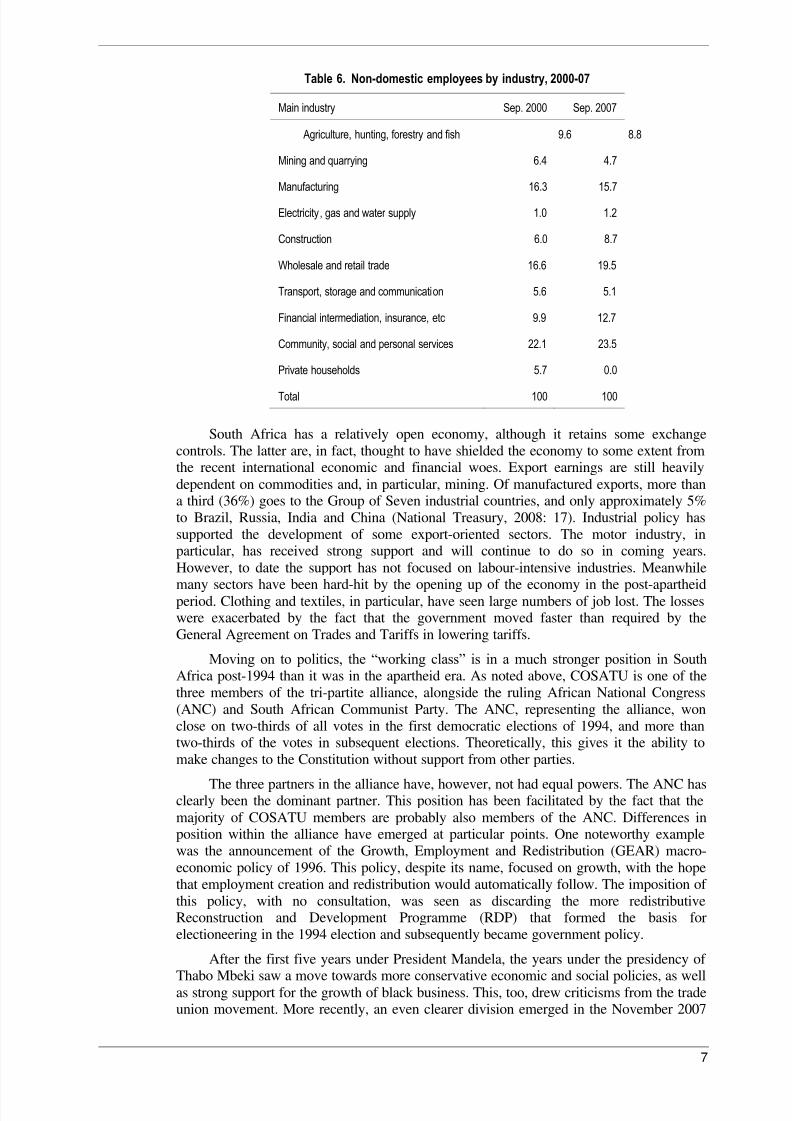
Table 6 is intended to indicate to what extent South African non-domestic employees
have experienced “deindustrialisation” over the period 2000 -07. This table, unlike previousones, covers both formal and informal sectors. The most noteworthy shift is the increase inthe percentage employed in trade, from 16.6% in 2000 to 19.5% in 2007, as well as anincrease of nearly three percentage points of those employed in financial services. Thesepatterns should be treated as indicative rather than exact, however, as the 5.7% of non-domestic employees reported as working in private households in September 2000 revealsthat in the early years of the LFS there were inaccuracies in the coding.
8/6/2019 i Might Need It-s.africa
http://slidepdf.com/reader/full/i-might-need-it-safrica 16/55

8/6/2019 i Might Need It-s.africa
http://slidepdf.com/reader/full/i-might-need-it-safrica 17/55
8
ANC Conference in Polokwane. At this conference, Jacob Zuma won the presidency of theANC against the country‟s president, Mbeki, with strong support from both COSATU andthe SACP. Mbeki was subsequently removed from office before the end of his term. At thetime of writing, the direction of a future government is uncertain as Zuma, in particular,makes contradictory statements to different audiences as to whether or not there will besignificant policy changes under the government that will be elected in 2009.
Unlike many other African countries, South Africa does have a Poverty ReductionStrategy Paper. It has not had pressure from donors to do so as donor funding is minimal – at less than 2% of the government budget. The RDP served as some sort of national plan orvision for the first few years after 1994. It was, however, quite general on many topics, andwas seldom referred to once GEAR was put in place. GEAR was a macro-economicpolicy, with a focus on deficit reduction and inflation control, rather than a national plan.The 2005 Accelerated and Shared Growth Initiative for South Africa (ASGISA), whiletouted as a “new” economic policy, again focused primarily on economic growth, althoughthe “shared” in the title was presumably intended to suggest that the benefits should bedistributed to all sectors of the population. The government itself acknowledged thatASGISA was not a comprehensive development plan, but consisted instead a collection of interventions – many of them existing before 2005 – seen as likely to stimulate growth. In
practice, it is not clear that ASGISA resulted in any significant new or strengthenedactions.
It is difficult to say with certainty what proportion of the South African population isliving in poverty as there is no agreement as yet on a national poverty line. Thus Woolard& Leibbrandt (2006: 51) show that for 2006 the level of the poverty lines ranged from R81per capita in 2000 rands for the international US$ 1 per day equivalent to R593 per capitafor the upper bound proposed by Statistics South Africa.
On inequality, the most recent Human Development Report (United NationsDevelopment Programme, 2007: 283) records South Africa as having a gini coefficient of 60.5. This places it at the upper end of inequality, lower only than Colombia, Bolivia,Botswana, Namibia, Lesotho, Haiti, the Central African Republic and Sierra Leone. This
ranking must, however, be treated with some caution. Firstly, the year used for the estimatediffers widely across countries (it is 2000 for South Africa). Secondly, many countries – including many in the Middle East – do not have any inequality estimate.
Seekings (2007), in summarising the literature, suggests that poverty levels andnumbers may well have declined over the last few years, but inequality increased. Thisfinding of worsening income inequality is found even by Van der Berg et al. (2006) whofind – contrary to some other analysts – that poverty declined over the same period. Whilethe picture in respect of income poverty is not clear, there is general agreement that therehas been progress in respect of several non-income aspects of poverty, such as access tosafe water and electricity. However, although there has been a relatively large-scalegovernment-subsidized housing problem, there has not been much success in bringing
down the number of households lacking decent housing. The improvement in the incomepoverty situation, to the extent it has occurred, is linked more to expansion of the grantsystem than to increased employment or earnings.
2. The legislative and institutionalframework
As with the previous section, this one describes the development of the legislative andinstitutional framework since the early 1990s, as it was in the mid-1990s that some of themost important changes occurred. Once again, however, the description includes some
references to the apartheid era as the new framework was built on the basis of the earlier
8/6/2019 i Might Need It-s.africa
http://slidepdf.com/reader/full/i-might-need-it-safrica 18/55
9
one, which itself drew largely on the British framework, but with overt racial dimensionswhich were peculiar to South Africa.
The legal framework
The LRA provides for registration of trade unions and employer organisations, andfederations of these two types of organisation, with the Department of Labour. There areseveral benefits to registering. In particular, registered unions are guaranteed organisationalrights if they can prove that they are “representative” and collective agreements betweenregistered trade unions and registered employers organisations are binding on members.
The relatively simple requirements for registration resulted in a large number of unions and employer organisations registering after the promulgation of the Act. The LRAstates that both types of organisation should have as their principal purpose regulatingrelations between employees and employers. It soon became clear that some organisationswere registering for other purposes. In particular, some of the organisations wereestablished by labour consultants to assist with unfair dismissals and other individualworker problems. In some of these cases, workers with complaints would only “join” and
pay fees when consulting the “organisation”. An amendment to the Act in 2002 stated thatthe Department would only register “genuine” organisations. As seen below, this resultedin the de-registration of a substantial number already registered.
The LRA does not explicitly afford a right to collective bargaining but probablyeffectively accords enough related rights to satisfy the ILO definition and convention. TheAct does not oblige employers to bargain. As Todd (2004: 42) explains, the Act thusencourages “process voluntarism”, but this is done against the background of other measures – in particular the Basic Conditions of Employment – that prescribe minimumstandards.
The LRA does not prescribe at what level bargaining should occur. However, onlyregistered unions and registered employer organisations can establish bargaining councils.The LRA allows for extension of agreements to non-members if the union/s who sign theagreement represent a majority of all employees in the workplace.
The LRA does not prescribe what issues can be covered by collective bargaining.However, Todd (2004: 55) notes that wages have tended to dominate, while other“important non -distributive matters” tend to get neglected. He attributes this in part to theimportance of wages, and in part to the adversarial relationship that is common innegotiations and that he sees as discouraging discussion of non-distributive issues.
The LRA regulates strikes and lock-outs, describing in detail the substantive and procedural requirements for these events to be “protected”. Where a strike is protected,workers are not considered to have committed a breach of contract or delict and so cannot
be dismissed simply on account of striking. However, employees in “essential services” do
not have the same rights in respect of strikes as other workers.Bargaining councils, which replace the industrial councils of the apartheid era, bring
together employers or employer organisations and unions within a particular sector. Theparties do not need to represent the majority of workers or employers within the sector toestablish a bargaining council. The council‟s constitution must, h owever, state how smalland medium enterprises are to be represented.
Bargaining councils are responsible for enforcement of their own collectiveagreements, and can request the Minister to designate agents who fulfil this responsibility.Where this is done, the agents are accorded substantial powers, including the right to entera workplace without a warrant and without giving prior notice. Godfrey et al. (2007) notethat employers falling under the bargaining councils tended to have better knowledge of
labour legislation and regulations than those outside the councils. They suggest that this is
8/6/2019 i Might Need It-s.africa
http://slidepdf.com/reader/full/i-might-need-it-safrica 19/55
10
probably due to the more frequent inspections and monitoring, as well as the fact that thecouncil can be used to answer queries.
While for most sectors it is up to the employers and unions concerned to establish abargaining council, the LRA itself established the Public Service Co-ordinating BargainingCouncil (PSCBC), and further allowed for the establishment of separate councils forsectors within the public service. At the time of writing there are four public servicesectoral councils. The PSCBC covers national and provincial government, but notmunicipal government as municipal employees are not considered to be public servants.The LRA does not explicitly provide for a separate council for local government, but sucha council has been established.
The 1995 LRA also provided for workplace forums, which were intended to providea non-adversarial workplace-based forum where employers and workers could discussnon-distributive issues. Very few of these were established. Unions, in particular, fearedthat these forums could serve to co-opt workers and reduce their willingness to opposeemployer proposals.
Both the LRA and the Basic Conditions of Employment Act (BCEA) (see below)focus on employees. In response to increasing evidence of outsourcing, sub-contracting,
home-working and other practices which do not have a simple employer-employeerelationship, both of these acts were amended in 2002 to provide protection to workers inthese “atypical” situations. In particular, there is now a presumption that a person is anemployee rather than an independent employer unless a set of characteristics can beprovide. The LRA also now makes anyone who engage workers through a labour broker oremployment agency co-responsible for contravention of bargaining council agreements,sectoral determinations or similar measures.
There are a number of other laws which do not deal as directly with industrialrelations and collective bargaining as the LRA, but which affect the context in whichunions and employer organisations operate and collective bargaining occurs. Perhaps mostimportant is the BCEA of 1997. As the name implies, the primary aim of the act is to set afloor of minimum conditions for all workers. Bargaining under the LRA then serves toimprove those conditions where workers and employers are sufficiently organised tobargain. The sectoral determinations also focus on those sectors in which there are largenumbers of less skilled workers, on the assumption that those with more skills will havegreater bargaining power. The BCEA is thus seen as providing protection to “vulnerable”workers. The BCEA covers all employees except those working under 24 hours per month.It specifies conditions of work and contracts, but does not specify minimum wages.However, it provides for the promulgation of ministerial and sectoral determinations whichgenerally specify both minimum wages and conditions. While there is some provision for“variation” of the minima specified in the BCEA, these variations should not result in asituation where the employees are worse off than they would be without variation.
In advising the Minister on sectoral determinations, the five-person EmploymentConditions Commission established by the Act is required to consider the followingcriteria (section 54(3)):
the ability of employers to carry out their business successfully
the alleviation of poverty
the cost of living
the likely impact of any proposed condition of employment or minimum wageson current employment or the creation of employment
the operation of small, medium or micro-enterprises and new enterprises
wage differentials and inequality
8/6/2019 i Might Need It-s.africa
http://slidepdf.com/reader/full/i-might-need-it-safrica 20/55
11
the possible impact of any proposed conditions of employment on the health,safety and welfare of workers in the sector concerned
Any other information made available to the Commission.
The Employment Equity Act of 1998 is important in promoting the advancement of black people, women, and people with disabilities in the workforce. The SkillsDevelopment Act of 1999 provides for the structures and processes related to the NationalSkills Development Strategy, including a set of sectoral education and training authorities(SETAs) and the system of learnerships. The Unemployment Insurance Act provides for acontributory system of insurance against unemployment and maternity. The Compensationfor Industrial Diseases Act provides for compensation for the injured or diseased person ortheir survivors in cases of work-related injury or disease. The National EconomicDevelopment and Labour Council (NEDLAC) Act of 1994 provides for the establishmentof a forum which brings together government, employer and labour representatives and – to a lesser extent – community representatives to discuss economic and developmentpolicy which extends beyond a particular sector or workplace. NEDLAC is thus SouthAfrica's foremost “social dialogue” forum for the traditional social partners.
Several observers suggest that the existence of separate laws and structures in
relation to particular labour-related issues has discouraged the inclusion of these issues incollective bargaining. Thus, Godfrey et al. (2005) argue that although the SkillsDevelopment Act provides for officials of bargaining councils to be invited onto the boardsof the SETAS, this seems to have seldom occurred, while training is now seldom includedin general collective bargaining. They contrast this with the situation in the industrialcouncils which were the predecessors of the bargaining councils prior to the LRA, and notethat some of these councils had training schemes or industrial training boards. Elsley‟s(2007) observation that skills development is almost never mentioned in the agreementsthat make up the large Labour Research Service collection provides support for this view.
Godfrey et al. note further that while the LRA provides for bargaining councils tomake submissions to NEDLAC, for example on industrial policy, they know of no
examples of where this has occurred. Similarly, Harisch et al. (2005) point out thatalthough the Employment Equity Act specifies that employers must consult “designatedgroups” (i.e. black people, women and people with disabilities) through their representatives or union, employment equity has seldom become part of collectivebargaining. In some cases employers create separate bodies for consulting on this issue, butthese are often used for information sharing rather than involving workers in drawing upthe plans. Nevertheless, the authors found some examples of unions using the fact that theemployer needed their signature on the employment equity plan to extract someconcessions.
A further problem with the Employment Equity Act is the way it allocatesresponsibilities. Thus the Act gives many of the tasks of monitoring progress to aspecialised agency, the Commission on Employment Equity. However, it gives theresponsibility of monitoring wage differentials to the Employment ConditionsCommission. The latter is established in terms of the BCEA and has, as mainresponsibility, advising the Minister of Labour on minimum wages and conditions for“vulnerable” workers, and in particular on sectoral and ministerial determinations. Thisdivision of responsibilities, combined with resistance from some employers to providinginformation on wages, has resulted in serious neglect of monitoring of wage differentials.This is unfortunate as, with the Commission on Employment Equity having focusedprimarily on advancement into the top levels of the hierarchy, it means that the Act is of less relevance to other workers.
Beyond regular employment, Government sees the Expanded Public WorksProgramme (EPWP), introduced in 2002 as a five-year programme, as one of the key
initiatives for addressing poverty and unemployment. The EPWP is relevant for ourpurposes to the extent that it allows for a form of employment that is not governed by the
8/6/2019 i Might Need It-s.africa
http://slidepdf.com/reader/full/i-might-need-it-safrica 21/55
12
usual labour laws. The programme was, at its introduction, discussed in NEDLAC. Thesocial partners agreed to the introduction of EPWP if a set of conditions were met,including that the employment would be short-term. The conditions were specified in aCode of Good Practice and Ministerial Determination for Special Public WorksProgrammes. However, there is evidence that those responsible for implementing EPWPare often aware of these measures, and – where they are aware – often do not comply withthem. It seems further that the claim that the initiative has created one million jobs shouldnot be interpreted as a huge success. Firstly, many of the “jobs” have been very short term.Secondly, it seems that the definition of “job” has been very loose, to include variousforms of training.
South Africa thus has a set of policies and legislation that can appear impressivewhen each piece is viewed on its own. However, problems can arise in how they interact – or do not interact – with each other. The fact that a large number of policies have beenintroduced or reviewed over a relatively short period has contributed to the likelihood of lack of coordination. In particular, the plethora of institutions and bodies that have beencreated to take forward the policies and legislation can result in un-coordinated policy as itis very difficult for any individual actor or institution to know what all the other relevantactors are doing. The difficulties are increased when there is need for coordination across
sectors. Further difficulties are caused when there are actual or potential conflicts betweenthe objectives of different policies. Of especial importance for our purposes is the policyaround black economic empowerment, which is often associated with promotion andincentives for small (black) businesses, and protection of the workers whom thesebusinesses might employ.
In some circles it has become accepted wisdom that South Africa‟s growth has beenhampered by excessive labour regulation, which is also seen as a cause of the highunemployment rate. However, Godfrey et al. (2007) found that virtually all employerrespondents to their investigation reported other factors as posing more of a threat to theirbusiness than labour regulations. Some explicitly acknowledged that labour regulationshad certain benefits. Benefits included limiting competition on labour costs and thusdiscouraging labour unrest. In addition, all respondents agreed that it was necessary tohave a floor of rights and standards.
Key actors
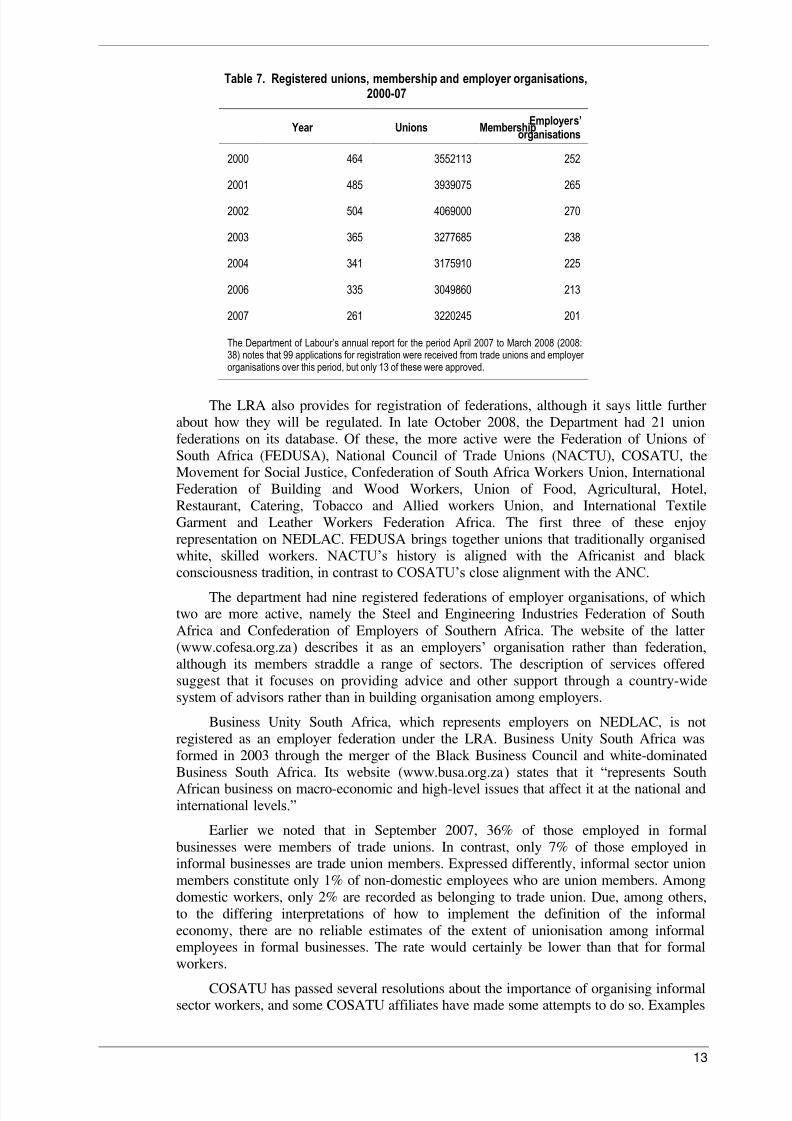
Table 7 gives the number of unions and employer organisations registered with theDepartment of Labour, as well as the reported membership of the registered unions(Personal communication, Department of Labour). There are no figures for 2005 as theDepartment did not collate the information in that year. The Department also does not asyet count the number of employers who are members of the employer organisations. Thefigures all show an upward trend up until 2002, followed by a sharp drop in 2003. Thenumber of unions and employer organisations tends to decrease further in subsequentyears, but the trend in the number of union members is less clear. In particular, while 2007has by far the smallest number of unions, the number of members is similar to that for2003. Simple division gives an average union size of 12,338 members in 2007, comparedto less than 10,000 for each of the previous years. The sharp decrease in 2003 is explainedby the Regist rar‟s deregistering about 150 unions after the 2002 amendment to the LRAintroduced the criteria that unions and employer organisations must be “genuine”. The 3.2million members of registered unions recorded for 2007 is not too different from the figureof 3.3 million union members recorded in the LFS.
8/6/2019 i Might Need It-s.africa
http://slidepdf.com/reader/full/i-might-need-it-safrica 22/55
13
Table 7. Registered unions, membership and employer organisations,2000-07
Year Unions MembershipEmployer s’ organisations
2000 464 3552113 252
2001 485 3939075 265
2002 504 4069000 270
2003 365 3277685 238
2004 341 3175910 225
2006 335 3049860 213
2007 261 3220245 201
The Department of Labour’s annual report for the period April 2007 to March 2008 (2008:38) notes that 99 applications for registration were received from trade unions and employer organisations over this period, but only 13 of these were approved.
The LRA also provides for registration of federations, although it says little furtherabout how they will be regulated. In late October 2008, the Department had 21 unionfederations on its database. Of these, the more active were the Federation of Unions of South Africa (FEDUSA), National Council of Trade Unions (NACTU), COSATU, theMovement for Social Justice, Confederation of South Africa Workers Union, InternationalFederation of Building and Wood Workers, Union of Food, Agricultural, Hotel,Restaurant, Catering, Tobacco and Allied workers Union, and International TextileGarment and Leather Workers Federation Africa. The first three of these enjoyrepresentation on NEDLAC. FEDUSA brings together unions that traditionally organisedwhite, skilled workers. NACTU‟s history is aligned with the Africanist and black consciousness tradition, in contrast to COSATU‟s close alignment with the ANC.
The department had nine registered federations of employer organisations, of whichtwo are more active, namely the Steel and Engineering Industries Federation of SouthAfrica and Confederation of Employers of Southern Africa. The website of the latter(www.cofesa.org.za ) describes it as an employers‟ organisation rather than federation,although its members straddle a range of sectors. The description of services offeredsuggest that it focuses on providing advice and other support through a country-widesystem of advisors rather than in building organisation among employers.
Business Unity South Africa, which represents employers on NEDLAC, is notregistered as an employer federation under the LRA. Business Unity South Africa wasformed in 2003 through the merger of the Black Business Council and white-dominatedBusiness South Africa. Its website (www.busa.org.za ) states that it “represents SouthAfrican business on macro-economic and high-level issues that affect it at the national andinternational levels.”
Earlier we noted that in September 2007, 36% of those employed in formalbusinesses were members of trade unions. In contrast, only 7% of those employed ininformal businesses are trade union members. Expressed differently, informal sector unionmembers constitute only 1% of non-domestic employees who are union members. Amongdomestic workers, only 2% are recorded as belonging to trade union. Due, among others,to the differing interpretations of how to implement the definition of the informaleconomy, there are no reliable estimates of the extent of unionisation among informalemployees in formal businesses. The rate would certainly be lower than that for formalworkers.
COSATU has passed several resolutions about the importance of organising informalsector workers, and some COSATU affiliates have made some attempts to do so. Examples
8/6/2019 i Might Need It-s.africa
http://slidepdf.com/reader/full/i-might-need-it-safrica 23/55
14
of this include the efforts of the South African Transport & Allied Workers Union(SATAWU) in respect of taxi drivers and those of the South African Clothing & TextileWorkers Union (SACTWU) in respect of home-based workers. Moving beyond informalsector to informal employees, who might be in formal workplaces, Masondo (2008)describes how the South African Commercial, Catering and Allied W orkers‟ Union(SACCAWU) has attempted to organise casual workers and won some benefits for them,including maternity and sick paid leave, provision of free workplace uniforms and ten
years service awards. For some years, the Self-Employed Workers Union existed as aunion that focused specifically on the informal sector, although many of its members wereself-employed rather than employees. This Union no longer exists, and thus informalsector workers are now organised primarily – but scantily – from within mainstreamunions.
We therefore, as before, focus below on the patterns within the formal sector which iswhere collective bargaining is most likely to occur, again relying on the LFS of September2007. The discussion that follows is intended to give a picture both of the distribution of these workers by type of enterprise, industry and occupation, and the levels of trade unionmembership within each.
In terms of type of establishment, 74% of those employed in formal businesses reportthat they work for a private business, while 11% report working for provincial government,4% each for local and national (central) government, and 3% for a government enterprise.Trade union membership is highest among provincial government employees, at 76%,followed by 63% in local government, 56% in national government, 43% in privateenterprises, and 28% in private businesses. This is a very different pattern than would havebeen found during the apartheid years, when trade union membership was concentrated inthe private sector. Despite the higher membership rates in government, because of thedominance of the private sector, 57% of union members are found in the latter sector.
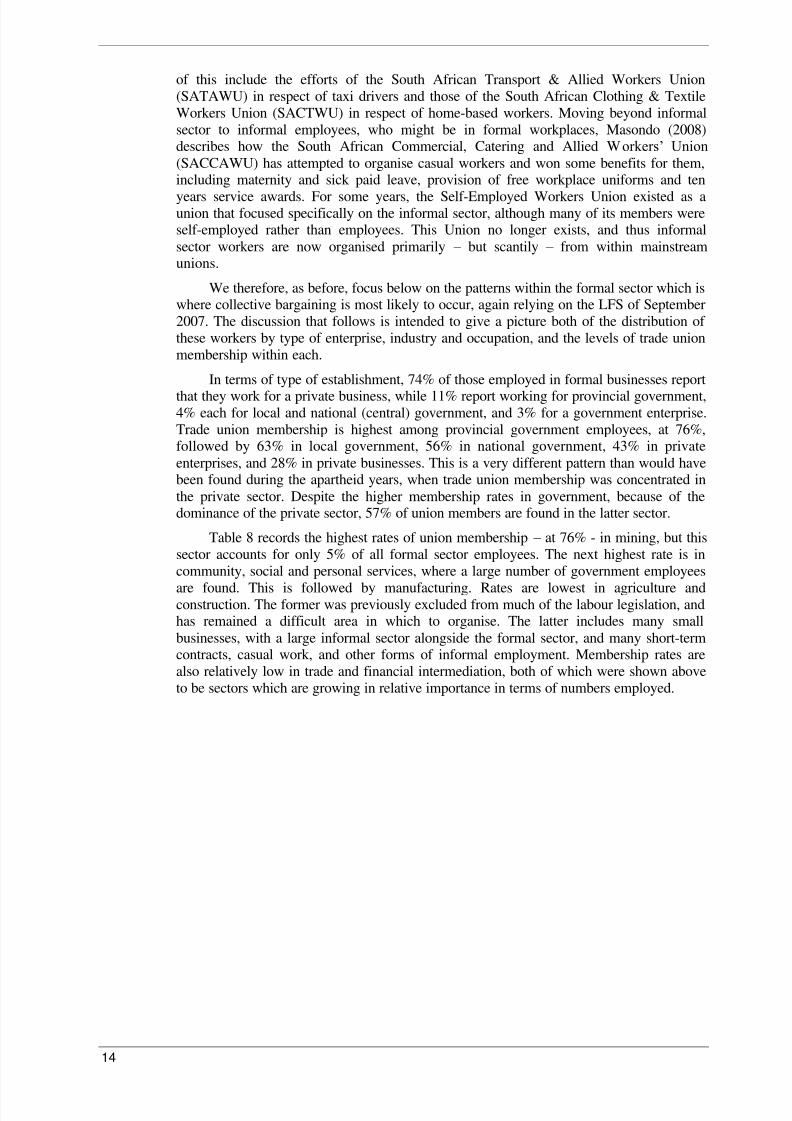
Table 8 records the highest rates of union membership – at 76% - in mining, but thissector accounts for only 5% of all formal sector employees. The next highest rate is incommunity, social and personal services, where a large number of government employees
are found. This is followed by manufacturing. Rates are lowest in agriculture andconstruction. The former was previously excluded from much of the labour legislation, andhas remained a difficult area in which to organise. The latter includes many smallbusinesses, with a large informal sector alongside the formal sector, and many short-termcontracts, casual work, and other forms of informal employment. Membership rates arealso relatively low in trade and financial intermediation, both of which were shown aboveto be sectors which are growing in relative importance in terms of numbers employed.
8/6/2019 i Might Need It-s.africa
http://slidepdf.com/reader/full/i-might-need-it-safrica 24/55
15
Table 8. Formal sector employees by industry and union membership
Main industry Distribution % members
Agriculture, hunting, etc 8% 11%
Mining and quarrying 5% 76%
Manufacturing 16% 38%
Electricity, gas, etc 1% 36%
Construction 7% 12%
Wholesale and retail trade 20% 24%
Transport, storage, etc 5% 36%
Financial intermediation 13% 27%
Community, social , personal services 24% 58%
Total 100% 36%
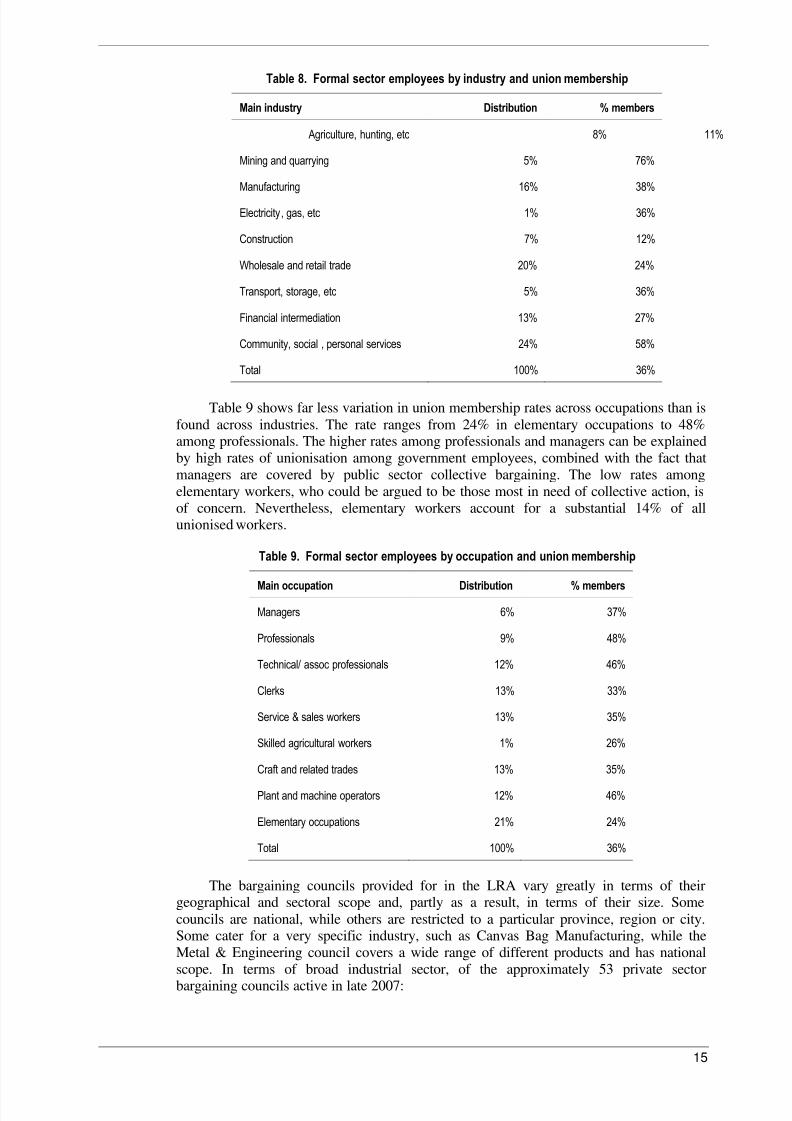
Table 9 shows far less variation in union membership rates across occupations than isfound across industries. The rate ranges from 24% in elementary occupations to 48%among professionals. The higher rates among professionals and managers can be explainedby high rates of unionisation among government employees, combined with the fact thatmanagers are covered by public sector collective bargaining. The low rates amongelementary workers, who could be argued to be those most in need of collective action, isof concern. Nevertheless, elementary workers account for a substantial 14% of allunionised workers.
Table 9. Formal sector employees by occupation and union membership
Main occupation Distribution % members
Managers 6% 37%
Professionals 9% 48%
Technical/ assoc professionals 12% 46%
Clerks 13% 33%
Service & sales workers 13% 35%
Skilled agricultural workers 1% 26%
Craft and related trades 13% 35%
Plant and machine operators 12% 46%
Elementary occupations 21% 24%
Total 100% 36%
The bargaining councils provided for in the LRA vary greatly in terms of theirgeographical and sectoral scope and, partly as a result, in terms of their size. Somecouncils are national, while others are restricted to a particular province, region or city.Some cater for a very specific industry, such as Canvas Bag Manufacturing, while theMetal & Engineering council covers a wide range of different products and has nationalscope. In terms of broad industrial sector, of the approximately 53 private sectorbargaining councils active in late 2007:
8/6/2019 i Might Need It-s.africa
http://slidepdf.com/reader/full/i-might-need-it-safrica 25/55
16
20 were in manufacturing (motor, diamond cutting, clothing & related (4),furniture (6), sugar, canvas (2), tyre, bags, metal & engineering,
jewellery, chemical, wood & paper
15 in services (hairdressing (4), laundry (2), government (6), entertainment,contract cleaning)
6 in construction (all building industry)
5 in trade (hospitality (3), meat, commercial distributive)
4 in transport (road freight, Transnet, road passenger, motor ferry)
2 in agriculture and fishing (wheat, fishing)
1 in utilities (electrical).
In terms of coverage of total employees in each sector of the labour market, onlymanufacturing, transport and community services are relatively well covered. Goodcoverage of transport is largely the result of the council within Transnet, a parastatal.Within services, Godfrey et al. (2007) surmise that the councils for hairdressing andcontract cleaning probably survive because employers see them as a way of regulatingconditions of employment rather than as a reflection of trade union organisation. Indeed,the contract cleaning agreement specifies lower wages than the sectoral determination thatcovers contract cleaning in other parts of the country.
Godfrey et al. (2006) estimate that, of the approximately 9,5 million employeescovered by the LRA and BCEA, about 25% are covered by bargaining council agreements.This estimate includes those covered because of extension of agreements to non-parties.Bargaining council coverage increases to just under a third of employees if the calculationis restricted to employees in occupational categories 4-9, namely clerks, service and shopworkers, skilled agriculture and fishery workers, craft and related trades workers, plant andmachine operators and assemblers, and elementary (unskilled) workers. Nearly 5% of theemployees covered by councils have employers who are not members of employer
associations party to the council, but who are registered with it.Godfrey et al. (2006) estimate further that the nine sectoral determinations that came
into effect between 1997 and 2006 covered approximately 36%, or about 3,4 millionemployees i.e. a significantly larger number than the councils. The number of workerscovered by determinations would be even larger today with the addition of a determinationfor the hospitality sector.
Godfrey et al. (2006: 24) estimate that less than 5% of formal sector employeescovered by bargaining council are in this situation as a result of extension of agreements.Bhorat et al. (2008) note further that almost 80% of applications for exemption are granted.These two estimates suggest that accusations that the bargaining council unfairlydisadvantages those who do not want to be part of it are largely misplaced.
The number of bargaining councils decreased from 87 in 1995 to just over 50 in2007. Part of this decrease is explained by mergers of regional and sub-sectoral councilsinto single, larger, national councils. Despite the decrease in the number of councils, thenumber of employees covered has increased over the same period. Godfrey et al. (2007)estimate that private sector councils covered 1,282,043 employees in 2004 as compared to823,823 in 1995. If public sector workers are included, coverage in 2004 was estimated at2,358,012.
Despite the mergers, there remain some very small councils. Macun (2008) points tothe examples of hairdressing councils in three cities which between them cover about2,200 employers and just over 7,000 workers. He notes further that the employee parties tothe smaller councils tend to be independent (unaffiliated to any federation), whileCOSATU unions tend to dominate in the larger councils, often alongside other affiliatedunions and independent ones.
8/6/2019 i Might Need It-s.africa
http://slidepdf.com/reader/full/i-might-need-it-safrica 26/55
17
The LRA encourages employer and employee parties to govern themselves. Outsideintervention is provided for when the process does not go smoothly, through bodies such asthe Commission for Conciliation, Mediation and Arbitration (CCMA) and the labourcourts. In addition, as noted above, the state – through the Minister of Labour‟s issuing of sectoral and ministerial determinations – can specify minimum wages and conditions for“vulnerable” workers who are deemed unable to r epresent themselves adequately.
While bargaining councils are themselves responsible for enforcement of theircollective agreements, and the state does not monitor enforcement of other collectivebargaining agreements, it has a stronger role in enforcement of wages and conditionsspecified in the determinations. The Department bears responsibility for both monitoringand enforcement, with the general labour inspectorate, in particular, meant to play a keyrole. The inspectorate is organised on a provincial basis, and enforcement has varied acrossprovinces. The extent to which the state has publicised and enforced the determinationsalso differs widely by sector. In the domestic worker sector, for example, there was a hugepublicity campaign when it was first introduced, and provincial offices have done somemonitoring since then. In the taxi sector, in contrast, there appears to have been minimalmonitoring and enforcement. In this sector inspectors are probably (and understandably)afraid to venture onto some of the taxi ranks given the violence that recurs in this sector. In
some other sectors, such as agriculture, the employer bodies have disseminatedinformation, although this seems to have included dissemination and encouragement interms of applying for variation (relaxation of specified conditions). In this sector,inspectors‟ relative inaction could be due, among others, to employers‟ know n reluctanceto have „strangers‟ on their property . Legally, however, the employers do not have a rightto prevent inspections.
Collective bargaining andsocial dialogue in practice
This subsection describes the different ways in which collective bargaining happens; what
structures are involved; what is covered in terms of sector, type of worker, type of employer, and issues negotiated; and relative power of different actors and institutions. Thesub-section draws, among others, on the work of Godfrey et al. (2007). This veryinformative paper is based on in-depth interviews with nine bargaining councils, the threestatutory councils, the nascent “quasi -statutory” centralised bargaining forums in securityand cleaning, representatives of three more established non-statutory centralised bargainingforums, as well as actors in enterprise- or plant-level bargaining in retail trade and foodmanufacturing. The latter two were chosen as representing one example of a sector inwhich there is a sectoral determination and one example of a sector where there is no suchdetermination. The interviews were complemented by interviews with a stratified sampleof owners of small businesses.
The details in the paper by Godfrey et al. are not included here, but the overallfinding of a wide range of different contexts and forms for collective bargaining must bestressed. This diversity could be seen as an indicator of the success of the voluntaryapproach impli cit in South Africa‟s industrial legislation . It does, however, complicateanalysis and make it difficult to draw definite and firm conclusions on most trends.
The picture is further complicated by the fact that in some industries the samecompanies and unions are involved in several different levels of bargainingsimultaneously. In particular, they may be part of a sectoral council but also engage incompany- or workplace-level bargaining. Godfrey et al. (2007) suggest that in most casesthe parties will agree not to bargain beyond operational issues at the level of theworkplace. They give the example of the Metal and Engineering Bargaining Council as anexample of this approach. It is not clear, however, that one can generalise from a few cases
of relatively strong sectoral forums to what happens in the country as a whole. Even in thisparticular case, the unions only agreed to this restriction when employers agreed that wage
8/6/2019 i Might Need It-s.africa
http://slidepdf.com/reader/full/i-might-need-it-safrica 27/55
18
increases would be added to the actual wage, rather than calculated on a minimum. Thisensured that employees in companies being paid above the minimum continued to benefitfrom a premium. Similarly, while the agreement in the motor industry also restricts wagebargaining to central level, the agreement allows for workplace-based negotiation of incentive schemes, which could result in higher pay for workers. The motor industryagreement also provides for payment of workers according to skills gained rather thanthose actually being used in the current jobs, thus encouraging and rewarding involvement
in skills programmes.The COSATU unions which engaged in centralised bargaining acknowledge that this
form of bargaining has both advantages and disadvantages. On the plus side, having oneset of negotiations that covers the whole industry clearly requires far fewer time, staff,money and other resources than engaging in separate negotiations at each workplace. Onthe negative side, centralised bargaining can result in loss of contact with individualmembers. The latter is something that COSATU unions, with their strong shopfloortradition, have traditionally emphasised. Unions have devised a range of ways of trying tominimise the disadvantages. These include holding bargaining conferences prior tonegotiations, requesting inputs from members in other ways, leaving some things to benegotiated at lower levels, and allocating the responsibility for monitoring of
implementation to branch level. These strategies have had varying success.It might seem that multi-year agreements represent another way of cutting down on
the time and other resources spent on bargaining over wages and conditions. Employersseem to have promoted this approach more than unions. Unions are wary, in particular, of negotiating wages for several years in a situation of relatively volatile inflation. One wayin which this problem has been dealt with is by specifying that, if the inflation rateincreases above a specified rate, the increases for future years will be renegotiated oradjusted according to a specified formula.
Moving beyond collective bargaining agreements, since the promulgation of theBCEA in 1997, ministerial and sectoral determinations have been issued in respect of agriculture, children in the performing arts, civil engineering, contract cleaning, domestic
workers, forestry, hospitality, learnerships, private security, small business, minibus taxisand the wholesale & retail sector.
As noted above, sectoral determinations are intended for sectors in which workers arevulnerable and unable to protect themselves. The Commission tries to encourageemployers and employees to organise so that their representatives can engage in collectivebargaining to set wages and conditions themselves.
While employers are also sometimes not well organised, the employee side isgenerally markedly weaker in terms of the percentage of employees covered as well as theexistence of a large number of unions as against one or two employer organisations. Incivil engineering, for example, the single employers‟ association registered for the sectorrepresents 60% of employers, while the two largest unions between them represent anestimated 20% of workers employed by the association‟s members . In contract cleaningthere was one employer association but seventeen trade unions at the time when theCommission was reviewing the determination for the sector in 2004. In private security, 19unions participated in the 2006 bargaining process, with SATAWU being the only onewith members from all part of the country. Godfrey et al. (2007) note that in security therewere also significant divisions among employers. In 2006, for example, there were sevenemployers‟ associations involved in the negotiations, with two of these representing themajority of organised employees.
Despite these low levels of organisation, several of the sectors covered bydeterminations have established bargaining forums in which they (attempt to) negotiateagreements. The Department and Commission encourage them to submit these agreements
as input to the Commission‟s delibe rations. Unfortunately, the negotiations are oftendelayed, causing problems for the Commission which needs to ensure that its
8/6/2019 i Might Need It-s.africa
http://slidepdf.com/reader/full/i-might-need-it-safrica 28/55
19
recommendations reach the Minister in time for a new determination to be publishedbefore the lapse of the period covered by the existing determination. Where the nascentforums provide the Commission with their agreement, the Commission tries to stay in linewith what has been agreed. There have, however, been a few occasions in which theCommission, after discussion, has made a recommendation different from that in the
parties‟ agreement . It has justified this action on the basis that the employees in particular,being poorly organised, are not always able to get fair and reasonable provisions in an
agreement bargained with a much stronger employer party.The above discussion describes where bargaining is happening, and how the state
steps in when it is not. Here we add a short discussion of cases where the relationshipbreaks down, at least temporarily, between organised workers and employers. We use thetrends in strikes and lockouts as an indicator of such breakdowns.
Strikes and lockouts should be reported to the Department of Labour. While somesmaller incidents are undoubtedly not reported, the reported incidents are likely to includeall the bigger incidents, whether in terms of duration or number of workers. TheDepartment does not, in its own reporting, distinguish between strikes and lockouts on thegrounds that it is often not clear which party is responsible for a stoppage.
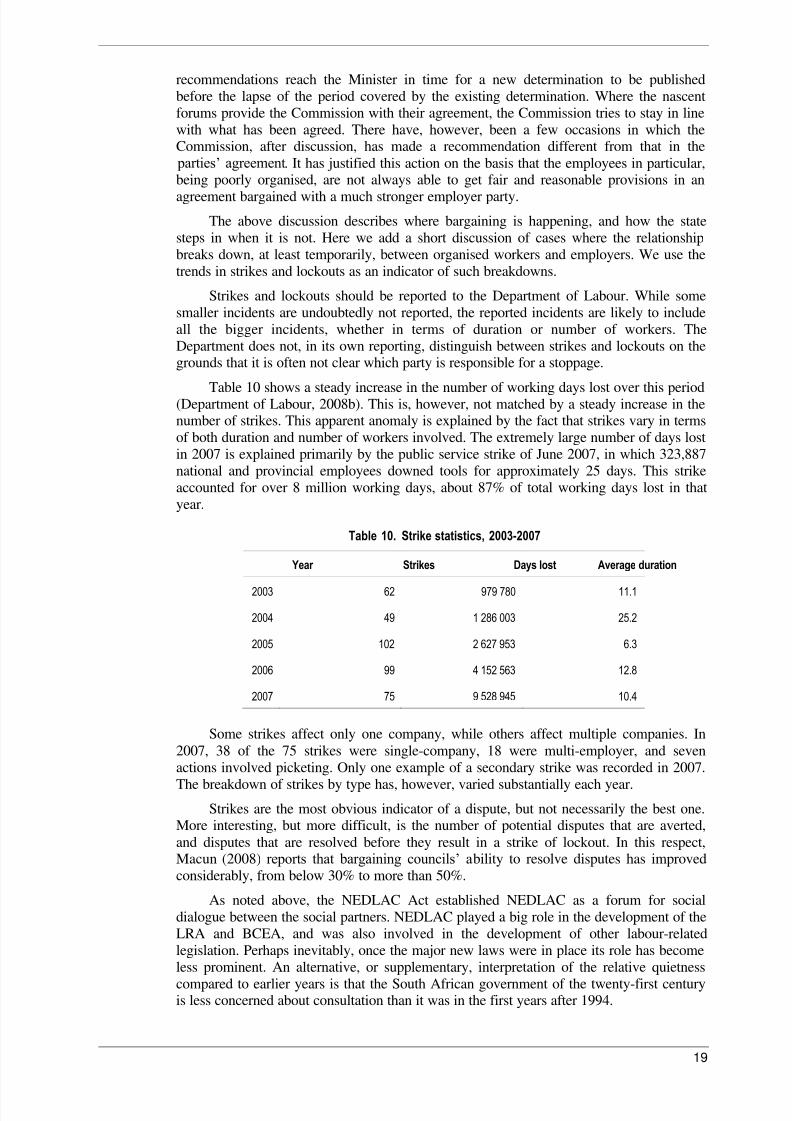
Table 10 shows a steady increase in the number of working days lost over this period(Department of Labour, 2008b). This is, however, not matched by a steady increase in thenumber of strikes. This apparent anomaly is explained by the fact that strikes vary in termsof both duration and number of workers involved. The extremely large number of days lostin 2007 is explained primarily by the public service strike of June 2007, in which 323,887national and provincial employees downed tools for approximately 25 days. This strikeaccounted for over 8 million working days, about 87% of total working days lost in thatyear.
Table 10. Strike statistics, 2003-2007
Year Strikes Days lost Average duration
2003 62 979 780 11.1
2004 49 1 286 003 25.2
2005 102 2 627 953 6.3
2006 99 4 152 563 12.8
2007 75 9 528 945 10.4
Some strikes affect only one company, while others affect multiple companies. In2007, 38 of the 75 strikes were single-company, 18 were multi-employer, and sevenactions involved picketing. Only one example of a secondary strike was recorded in 2007.
The breakdown of strikes by type has, however, varied substantially each year.Strikes are the most obvious indicator of a dispute, but not necessarily the best one.
More interesting, but more difficult, is the number of potential disputes that are averted,and disputes that are resolved before they result in a strike of lockout. In this respect,Macun (2008) reports that bargaining councils‟ a bility to resolve disputes has improvedconsiderably, from below 30% to more than 50%.
As noted above, the NEDLAC Act established NEDLAC as a forum for socialdialogue between the social partners. NEDLAC played a big role in the development of theLRA and BCEA, and was also involved in the development of other labour-relatedlegislation. Perhaps inevitably, once the major new laws were in place its role has becomeless prominent. An alternative, or supplementary, interpretation of the relative quietnesscompared to earlier years is that the South African government of the twenty-first centuryis less concerned about consultation than it was in the first years after 1994.

8/6/2019 i Might Need It-s.africa
http://slidepdf.com/reader/full/i-might-need-it-safrica 29/55
20
3. Collective bargaining and wages
This section draws on existing research and databases in relation to collective bargainingthrough bargaining councils and at firm level to describe the extent of coverage, the profileof workers covered, and the level of settlements. The section tries to go beyond wages todiscuss to what extent collective bargaining covers issues such as pension and provident
funds, medical funds, leave, etc. The section also describes the extent to which wages andconditions are set through the alternative mechanism of the Employment ConditionsCommission. The section includes a brief discussion of trends in executive earnings sincethis is sometimes raised as an issue in collective bargaining and discussions around wages.The discussion is especially important in light of the overall high levels of a range of different forms of inequality in South Africa.
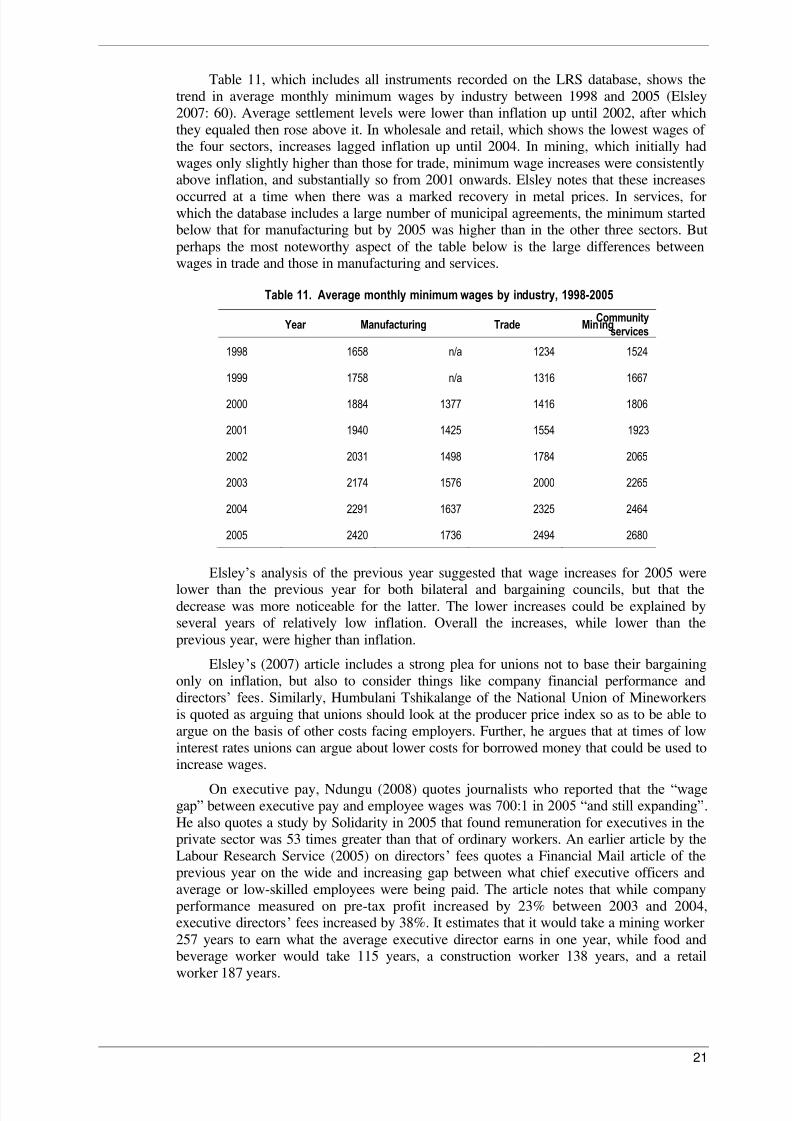
The Labour Research Service‟s AWARD database is the most comprehensive oneavailable of wages set through public and private bargaining council agreements, othercollective bargaining agreements and sectoral determinations. Unfortunately, as at the timeof writing the database was being re-developed. It therefore had not been fully updated for2007 and beyond, making trend analysis unreliable. We therefore draw instead on Elsley‟sanalysis as presented over the years in the South African Labour Bulletin. (Trenton Elsleyworks for Labour Research Service and is responsible for AWARD.) Even for the years forwhich fuller data are available, the trends should be taken as indicative as the addition of new bargaining units to the database means that the comparisons across years are notalways comparing the same workplaces.
Elsley (2007) reports that in 2006 the median wage for the lowest paying occupationsin collective bargaining was just under R2,400 per month. He notes that this was less than80% of the monthly expenditure required by average household of five to maintain amodest low level standard of living, as calculated by the University of South Africa.Average settlement levels for minimum wages in 2006 were about two percentage pointshigher than CPIX but more or less equal to food price inflation, given that food inflationoutstripped overall inflation by a significant margin over this period. Wages set throughsectoral determinations had increased slightly faster than those set through other means.This could reflect a wider trend for increases to be better at the lower end. However,although such a trend could be expected to close wage gaps between lower- and higher-paid workers over time, this happens very slowly and a higher percentage increase forlower paid workers sometimes translates into a lower increase than for better paid workersin terms of actual rands.
For 2007, Macun (2008) reports that increases within bargaining council agreementsaveraged 7.2% for the unskilled, 6.9% for semi-skilled, and 6.4% for skilled, confirmingother evidence of higher increases at the lower end. He notes, however, that the moreskilled workers are more likely to receive premia above the prescribed minima. Macunnotes more generally that, despite increases that are generally above inflation, productivity
growth has been higher than wage growth for some years i.e. output has increased fasterthan wages.
In addition to differences between occupations within a particular workplace, anddifferences across bargaining councils, sectoral determinations and company-basedagreements, there are further disparities between industries. Thus the Labour ResearchService noted in 2005 (Labour Bulletin, 2005) that the average minimum weekly wage forprivate sector bargaining councils was R380 per week, while for semi-skilled and skilledworkers the average minima were R652 per week. The lowest minimum wage forunskilled workers in bargaining councils was R185 per week in electrical, while thehighest, for metal and engineering, was R647. Finally, the average minimum across thesectoral determinations was R250 per week, substantially lower than the average minimum
for private sector bargaining councils.
8/6/2019 i Might Need It-s.africa
http://slidepdf.com/reader/full/i-might-need-it-safrica 30/55
21
Table 11, which includes all instruments recorded on the LRS database, shows thetrend in average monthly minimum wages by industry between 1998 and 2005 (Elsley2007: 60). Average settlement levels were lower than inflation up until 2002, after whichthey equaled then rose above it. In wholesale and retail, which shows the lowest wages of the four sectors, increases lagged inflation up until 2004. In mining, which initially hadwages only slightly higher than those for trade, minimum wage increases were consistentlyabove inflation, and substantially so from 2001 onwards. Elsley notes that these increases
occurred at a time when there was a marked recovery in metal prices. In services, forwhich the database includes a large number of municipal agreements, the minimum startedbelow that for manufacturing but by 2005 was higher than in the other three sectors. Butperhaps the most noteworthy aspect of the table below is the large differences betweenwages in trade and those in manufacturing and services.
Table 11. Average monthly minimum wages by industry, 1998-2005
Year Manufacturing Trade MiningCommunityservices
1998 1658 n/a 1234 1524
1999 1758 n/a 1316 1667
2000 1884 1377 1416 1806
2001 1940 1425 1554 1923 2002 2031 1498 1784 2065
2003 2174 1576 2000 2265
2004 2291 1637 2325 2464
2005 2420 1736 2494 2680
Elsley‟s analysis of the previous year suggested that wage increases for 2005 werelower than the previous year for both bilateral and bargaining councils, but that thedecrease was more noticeable for the latter. The lower increases could be explained byseveral years of relatively low inflation. Overall the increases, while lower than theprevious year, were higher than inflation.
Elsley ‟s (2007) article includes a strong plea for unions not to base their bargainingonly on inflation, but also to consider things like company financial performance anddirectors‟ fees . Similarly, Humbulani Tshikalange of the National Union of Mineworkersis quoted as arguing that unions should look at the producer price index so as to be able toargue on the basis of other costs facing employers. Further, he argues that at times of lowinterest rates unions can argue about lower costs for borrowed money that could be used toincrease wages.
On executive pay, Ndungu (2008) quotes journalists who reported that the “wagegap” between executive pay and employee wages was 700:1 in 2005 “and still expanding” .He also quotes a study by Solidarity in 2005 that found remuneration for executives in theprivate sector was 53 times greater than that of ordinary workers. An earlier article by theLabour Research Service (2005) on directors ‟ fees quotes a Financial Mail article of theprevious year on the wide and increasing gap between what chief executive officers andaverage or low-skilled employees were being paid. The article notes that while companyperformance measured on pre-tax profit increased by 23% between 2003 and 2004,executive directors ‟ fees increased by 38%. It estimates that it would take a mining worker257 years to earn what the average executive director earns in one year, while food andbeverage worker would take 115 years, a construction worker 138 years, and a retailworker 187 years.
8/6/2019 i Might Need It-s.africa
http://slidepdf.com/reader/full/i-might-need-it-safrica 31/55
22
Ndungu (2008) also looks at wage gaps between the lowest and highest paid workers.His focus is on the public sector, where many managers are covered by the bargaining unit.He suggests that the manager: worker gap has, in fact, increased substantially in the post-apartheid era, from 16:1 in 1995, to 20:1 in 1999 and to 30:1 in 2006. This could be, atleast in part, a result of the establishment of a senior management service, as discussed inthe public sector case study below.
Narrowing our analysis to bargaining councils, in 2007, the Community Agency forSocial Enquiry developed a basic database for the Department of Labour to recordminimum wages prescribed in the bargaining council agreements. Comparisons arecomplicated as some agreements specify wages per hour, while others do so by week or bymonth. In addition, some agreements specify different minima for different areas or fordifferent parts of the industry or sector covered.
The database reveals that in 2007 some agreements still specified a minimum wagefor the unskilled that was less than R1,000 per month. These included Restaurant, Catering& Allied and Hairdressing & Cosmetology in Pretoria and semi-national. At the other endof the spectrum, the highest minimum for the lowest-paid unskilled workers was found inthe agreement for Furniture KwaZulu-Natal, where the minimum was R2,791 per month.
The analysis by Bhorat et al. (2008) illustrates how the very large increase in publicsector membership of bargaining councils over the last decade skews trend analysis of bothwages and membership. In their introduction, the authors note that several previous studieshave found that union membership tends to be associated with higher earnings, but do notinvestigate the impact of falling under a bargaining council. They point to a single previousstudy, but Butcher and Rouse in 2001, which found that in 1995 African workers coveredby an industrial council agreement but who were not union members earned about 10%more than those not covered. If they were also union members, they earned 30% more thanthose not covered by a council.
Bhorat et al. develop their analysis by trying to match occupation and industry codesin the 1995 October household survey and 2005 LFS to those covered by bargainingcouncils. After correcting for the geographical areas covered by the council agreements,they then compare earnings across the two years, between those covered and not covered,and by public and private, occupation and industry, and level. A repeated finding is that thepatterns that result can, at least in part, be explained by the coverage of the public sector in2005, but not in 1995, and the occupational composition of the public sector, with its largenumber of professionals.
The coded and matched databases suggest that in 1995, 15% of formal sectoremployees (almost 1.2 million workers) were covered by bargaining council agreements,while by 2005 this had more than doubled in more percentage and absolute terms, to 32%(2.5 million workers). However, more than half of those covered by bargaining councilagreements in 2005 were employed in national, provincial and local governmentdepartments. If these workers are included, coverage stood at 13% in 2005, or a little over1 million workers. The number of professionals estimated to be covered by bargainingcouncils meanwhile increased from about 20,000 to more than 750,000, of whom 94%were in the public sector.
In terms of earnings, in the aggregate membership of a bargaining council was notassociated with higher mean earnings. For African workers, however, there did seem to bean earnings premium associated with membership. Similarly, when disaggregated byindustry, there is generally no statistical difference in earnings between those covered andthose not covered. However, in 2005, workers falling under the public sector bargainingcouncils earned more than those in the private sector as well as formal sector employeesfalling outside of any bargaining council. This again probably reflects the large number of professionals as well as coverage of managers in the public sector.
Looking beyond wages, section 28 of the LRA gives bargaining councils the power“to establish and administer pension, provident, medical aid, sick pay, holiday,
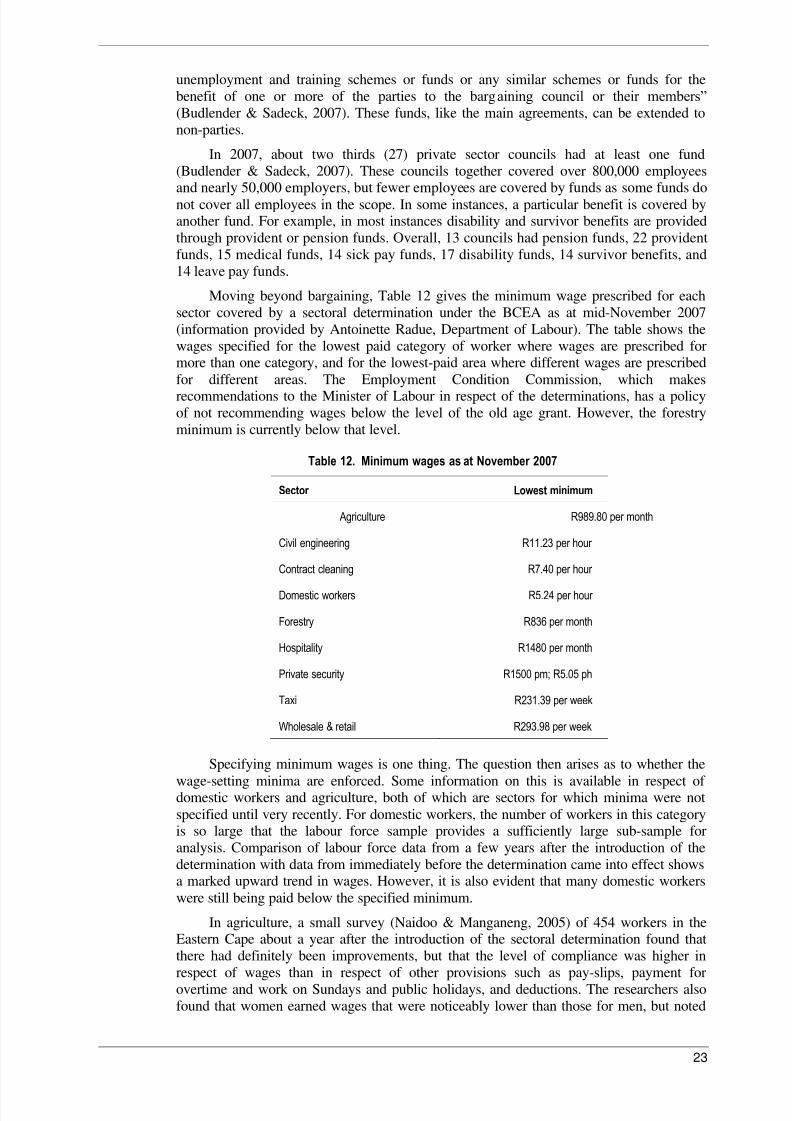
8/6/2019 i Might Need It-s.africa
http://slidepdf.com/reader/full/i-might-need-it-safrica 32/55
23
unemployment and training schemes or funds or any similar schemes or funds for thebenefit of one or more of the parties to the barg aining council or their members”(Budlender & Sadeck, 2007). These funds, like the main agreements, can be extended tonon-parties.
In 2007, about two thirds (27) private sector councils had at least one fund(Budlender & Sadeck, 2007). These councils together covered over 800,000 employeesand nearly 50,000 employers, but fewer employees are covered by funds as some funds donot cover all employees in the scope. In some instances, a particular benefit is covered byanother fund. For example, in most instances disability and survivor benefits are providedthrough provident or pension funds. Overall, 13 councils had pension funds, 22 providentfunds, 15 medical funds, 14 sick pay funds, 17 disability funds, 14 survivor benefits, and14 leave pay funds.
Moving beyond bargaining, Table 12 gives the minimum wage prescribed for eachsector covered by a sectoral determination under the BCEA as at mid-November 2007(information provided by Antoinette Radue, Department of Labour). The table shows thewages specified for the lowest paid category of worker where wages are prescribed formore than one category, and for the lowest-paid area where different wages are prescribedfor different areas. The Employment Condition Commission, which makesrecommendations to the Minister of Labour in respect of the determinations, has a policyof not recommending wages below the level of the old age grant. However, the forestryminimum is currently below that level.
Table 12. Minimum wages as at November 2007
Sector Lowest minimum
Agriculture R989.80 per month
Civil engineering R11.23 per hour
Contract cleaning R7.40 per hour
Domestic workers R5.24 per hour
Forestry R836 per month
Hospitality R1480 per month
Private security R1500 pm; R5.05 ph
Taxi R231.39 per week
Wholesale & retail R293.98 per week
Specifying minimum wages is one thing. The question then arises as to whether the
wage-setting minima are enforced. Some information on this is available in respect of domestic workers and agriculture, both of which are sectors for which minima were notspecified until very recently. For domestic workers, the number of workers in this categoryis so large that the labour force sample provides a sufficiently large sub-sample foranalysis. Comparison of labour force data from a few years after the introduction of thedetermination with data from immediately before the determination came into effect showsa marked upward trend in wages. However, it is also evident that many domestic workerswere still being paid below the specified minimum.
In agriculture, a small survey (Naidoo & Manganeng, 2005) of 454 workers in theEastern Cape about a year after the introduction of the sectoral determination found thatthere had definitely been improvements, but that the level of compliance was higher inrespect of wages than in respect of other provisions such as pay-slips, payment forovertime and work on Sundays and public holidays, and deductions. The researchers alsofound that women earned wages that were noticeably lower than those for men, but noted
8/6/2019 i Might Need It-s.africa
http://slidepdf.com/reader/full/i-might-need-it-safrica 33/55
24
that this was at least in part related to the types of jobs that they did. In particular, 42% of the women did domestic work on the farms.
There is evidence that agricultural employers are increasingly using labour brokerseither to avoid having to deal with the bureaucracy themselves, or as a way of circumventing the law. In theory these strategies should not allow for non-compliance, asthe law extends to labour brokers. However, detecting non-compliance and enforcingcompliance could become more difficult.
Wage-setting instruments do not stipulate different wages for male and femaleworkers in the same job, as was sometimes the case in wage determinations and industrialcouncil agreements in the 1980s. Indeed, stipulation of different wages would today beunconstitutional. The absence of explicit discrimination does not, however, mean thatwomen and men have equivalent earnings. In 2001, for example, mean hourly earnings of employed women in South Africa stood at R8.40 for African women and R9.73 forAfrican men compared to R28.17 for white women and R39.92 for white men (Budlender,47). Analysis of more recent data is likely to show a similar ranking. As in other countries,these differences are in part due to women and men tending to have different occupationsand be employed in different industries, with the female-dominated occupations andindustries tending to be remunerated at a lower rate relative to qualifications. Theintroduction of occupation-specific dispensations for nurses, teachers and social workers inpublic service will go some way in breaking this pattern for the workers concerned.
4. Addressing the challenges
This section presents a series of case studies of collective bargaining. The case studiesfocus on examples of collective bargaining that address a range of issues that arise in theSouth African context. Some of these are specific to South Africa, while others will befound in other countries. The examples are not meant to be representative of all collectivebargaining. Indeed, an attempt has been made to include examples of unions and employerorganisations that have extended the boundaries of bargaining. The studies are also notintended to be comprehensive, but rather highlight aspects of each case that are especiallyinteresting for our purposes. Information for the case studies is drawn from interviews withand documents supplied by key informants as well as from existing literature. In particular,the South African Labour Bulletin provided the basis for a number of the cases.
Bargaining in the public sector 2
Any set of South African case studies would be incomplete without one on public sectorbargaining, given both the size of the workforce that it covers, the fact that this part of thelabour force has significantly increased its contribution to union membership in the
country, and the often turbulent relationship between unions and government over recentyears. The sector is also especially interesting because prior to 1994 there was virtually nocollective bargaining in the public service. Post-1994, the bargaining process has pitted asingle employer against large unions, from different federations, and with differingpositions even within the same federation. The forum in which they bargain is also still arelatively new institution.
Hassen provides a history which explains the context in which negotiations in thepublic sector have taken place. He notes that the RDP document was ambiguous as to whatwould happen with the public service. It stated simply that the government would need toassess whether the service needed to be expanded or contracted. The White Paper onTransformation of the Public Service that followed provided for the minimum wage within
2 This case study draws on Labour Bulletin , June 2004; Labour Bulletin , Aug. 2004; Labour Bulletin , Mar. 2005; Hassen,Mar. 2005; Aroun & Essa, 2007; Hassen 2007.
8/6/2019 i Might Need It-s.africa
http://slidepdf.com/reader/full/i-might-need-it-safrica 34/55
25
the public service to be increased to R1 500 by 1997, for the reduction of wagedifferentials, for development of career paths, and for improvement of conditions forwomen and people with disabilities.
The multi-year agreement that was signed in 1996 introduced voluntary severance packages that were intended to “right -size” (i.e . contract) the public service, with thesavings obtained meant to allow for large salary increases over the three-year period. Theright-sizing was, to some extent, needed because of the way the post-1994 government hadhad to accommodate employees from the 17 administrations that made up the balkanizedapartheid South Africa. The desire to right-size must also, however, be seen in the contextof a government moving towards adoption of the more conservative macro-economicpolicy of GEAR. For the following years, negotiations thus focused on both the size andshape of the public sector and the level of salaries. An underlying question in respect of size and shape was the extent to which employees should have a say in decision-makingaround these issues.
The 1996 multi-year agreement did not last more than a year as government said thatthe required savings had not been realized. Unions agreed to a reduction in planned wages,on the basis that there would be a joint government-union process of auditing skills,service delivery and personnel.
1999/2000 saw the first national public sector strike, which lasted for two days. Thestrike focused mainly on wages. Members of all 12 public service unions participated,including the traditionally white and more conservative unions. After the strike, thegovernment unilaterally implemented wages. It also introduced the Senior ManagementService, a flexible pay structure for managers and performance contracts, and withdrewfrom the audit processes claiming that these limited managerial autonomy. In response,unions demanded in the 2000/1 wage negotiations that there be a Public Service JobsSummit. This duly took place in January 2001. The summit was interpreted as giving back to the unions some say over the planned restructuring. The negotiations of the next yearsaw government agreeing to create an additional 20,000 jobs.
In 2001, the parties entered into another multi-year wage agreement, with wageincreases set at inflation plus agreed percentages. In terms of restructuring, however, theagreement gave management powers to reduce the workforce in relation to those “inexcess of establishment” , the majority of whom were less skilled workers. Hassen notesthat the overall size of the public sector had already decreased 11.4% between 1996 and2001.
This three-year agreement ran its course, necessitating new wage negotiations in2004. In July 2004, after four months of negotiation, government declared a dispute after afailed conciliation process. Government had initially tabled an offer of 5.4%, which itsubsequently increased marginally to 5.5% by shifting money from housing to wages.Unions had meanwhile dropped their demand far more substantially, from 10-12% to8.5%. On 16 August the COSATU unions announced that they would embark on aprogramme of action in protest. Early the next year, Edwin Molahlehi, chairperson of thePSCBC, commented that the eventual signing of the multi-year agreement had been animportant milestone, but “was not an easy task to achieve”.
In contrast to 2004, 2007 saw a major month-long strike that involved employeesfrom across all 17 public sector unions and that resulted in an increase substantially higherthan had been planned by government.
The 2004 agreement was due to lapse in July 2007. By October 2006 the unions hadconsolidated and submitted their demands. Government was meant to place its offer on thetable in January 2008, but came with its first offer, which lacked detail, in February 2007.Government said that one reason for their delay was that they wanted to address the issueof recruiting and retaining professionals – an issue dealt with in the case study on theoccupation-specific dispensation (OSD) for nurses. The unions, frustrated by the ongoing
8/6/2019 i Might Need It-s.africa
http://slidepdf.com/reader/full/i-might-need-it-safrica 35/55
26
delays, declared a dispute in the hope that this would force the employers to provide moreinformation more speedily.
The strike was successful to the extent that the state moved from its offer of 4% to a7.5% basic increase outside of other benefits. The parties also entered in an agreementabout the return to work, how pay would be docked, and developed a framework toconclude a minimum service level agreement. Aroun & Essa (2007) suggest that thissettlement was the result of political intervention rather than collective bargaining. Theyquote the central executive officer of the metal and engineering bargaining council‟s viewthat government contributed to the problem by issuing ultimatums. Their informant notedthat this tactic that was common during the apartheid years but was one that sectors with amore “mature” relationship tried to avoid.
Hassen (2007) observes that outsourcing has become a “strong feature” in the publicservice. He suggests that this is, at least partly, in response to relatively high entry-levelwages for less skilled workers. Hassen states that unions perceive outsourcing as adisguised form of privatization. However, it seems that this issue has not been raised in amajor way within public sector bargaining.
A problem that is to some extent peculiar to government bargaining is that the
government budget is drawn up in advance of the bargaining process. This places limits onwhat government is able to offer in terms of increases, unless increases are balanced inreductions in the size of the workforce. The problem is not, however, insurmountable, as itis possible for government to introduce supplementary budgets to make up any shortfall.
Occupation-specific dispensation for nurses 3
In 2006 government announced that it would be introducing OSDs for selected categoriesof government employees. These dispensations were intended to address the fact that thestandard salary packages negotiated in the PSCBC were not seen to be attracting andretaining sufficient workers in the targeted categories. Over the subsequent period, suchdispensations have been discussed with unions representing a range of different categories,including nurses, teachers, social workers and prosecutors. This case study focuses onnurses. The shortages in this category have been exacerbated by the HIV/AIDS epidemic.The epidemic has both increased the demand for public sector nurses and exacerbated thepressures and difficulties faced by these workers. Public sector wages also have to competewith the higher wages in both the private sector within South Africa and a range of overseas countries eager to “poach” trained nurses.
As noted above, OSDs were mooted in the 2004 negotiations. They were officiallyannounced in 2006 and it was clear from the start that nurses would be covered. However,negotiations commenced only in September 2007, as it took this time for government todevelop the framework that would be used as the basis for the negotiations.
Nurses were the first group to reach agreement with government, and implementationbegan in March 2008, six months after originally planned by government. The nurses‟agreement was followed in April 2008 by one with teachers. At the time of writing, socialworkers – who fall within the same Public Health & Welfare Sectoral Bargaining Councilas nurses – had still not reached agreement with government and the issue had thereforegone for conciliation. One on the main stumbling blocks is that social workers feel thatthey should receive higher salaries than nurses.
A representative of the Democratic Nursing Organisation of South Africa(DENOSA) identified the five most important aspects of the new dispensation as follows:
3 J. “JC” Magagula and T. Gwagwa of the Democratic Nurses Organization of South Africa are thanked for their assistancewith this case study.
8/6/2019 i Might Need It-s.africa
http://slidepdf.com/reader/full/i-might-need-it-safrica 36/55
27
Extension of monetary rewards for qualifications beyond the few “scarceskills” previously covered to a wider range of specializations
Development of a career path whereby nurses can move upwards further thanthrough the small increases associated with the 15 notches previouslyprovided for every salary level.
Recognition and rewarding of years of experience, whether in the private orpublic sector, whereas previously only years in the public sector wererecognised.
Pay progression associated with two-yearly evaluations.
Grade progression which allows a nurse to earn the salary of a higher leveleven without promotion to that level.
The introduction of the OSD resulted in a substantial increase for entry level nurses,from R86,000 per annum to R106,000. This increase was higher than initially proposed bygovernment, which envisaged the starting salary of a nurse with a four-year qualificationand one year of community service as being R90,000. 4 Government‟s proposal for theentry level for those with specialities was R153,00 and this was revised to R160,000
through bargaining.Every nurse already in employment was guaranteed some sort of increase. However,
the extent of the increases varied widely depending, for example, on prior experience aswell as specialisations. The OSD agreement, which has several long detailed tables,illustrates the complexity of the new system. The extent to which the pay progression willresult in higher wages is not yet known as the first evaluations will only take place twoyears after implementation.
There are a total of around 110,000 nurses in the public sector, of which about 53,000are members of DENOSA. About a further 40,000 work in the private sector or atmunicipal level, with a small number in the non-profit sector, giving a total of about150,000 nurses registered with the South African Nursing Council as practising.
Five unions in total represent nurses in the bargaining council. The unions, for themost part, took similar positions in the OSD negotiations. Together, they were able to wina number of improvements to the original government proposal, in addition to the increasein the basic starting salary. Other gains included recognition of experience of thoseworking in specialised areas without the necessary post-basic qualifications, rewarding of bridging courses for further qualifications, and expansion of the list of specialityqualifications from six to sixteen. The fact that the National Treasury (2008:49) had toallocate an extra R1 billion for implementation of the OSD in the middle of the financialyear gives a sense of the real financial meaning of these improvements. One demand thatthe unions were not successful in winning was that the years spent doing nursing-typework before being registered with the South African Nursing Council would be counted.
In addition to union-employer disagreements, the unions had to deal with oppositionfrom some of their members while the deal was being negotiated. In early 2008 there was,for example, a strike at Johannesburg hospital during which a DENOSA shopsteward wasattacked. Members were angry that the OSD did not cater for specialities other than post-basic training. Other members of DENOSA and other unions were confused by the factthat t he Minister of Health‟s media statement had referred to an 88% increase, withoutmaking clear that this would apply only to those individuals who had a speciality and werecurrently on the basic entry level salary. Further, both the South African DemocraticNurses Union and NEHAWU claimed, at least in the first months, that some provinceswere implementing the OSD incorrectly (Sowetan, 19 March 2008). In late October 2008,Business Day (28 October 2008) reported that some DENOSA members were still not
getting the salaries to which they were entitled under the OSD.4 www.info.gov.za/speeches/2007/07061811451001.htm, downloaded 10 Aug. 2008.
8/6/2019 i Might Need It-s.africa
http://slidepdf.com/reader/full/i-might-need-it-safrica 37/55
28
The OSD only applies to nurses in the public sector. However, once the OSDagreement was concluded in the public sector, one of the largest companies, Netcare,adjusted its own salaries in line with the OSD.
Overall, the OSD can be claimed as a success in giving greater rewards to a large,underpaid and largely female workforce that delivers a critical services. However, the OSDhas not yet solved one of the main problems it was intended to address. Thus, in lateOctober 2008, a response to a parliamentary question acknowledged that there were 16,362vacant posts for professional nurses in public hospitals, 5,752 for staff nurses, and 10,403for medical doctors (Business Day, 27 October 2008).
Collective bargaining and HIV/AIDSin the mining industry 5
The previous case study could be seen as a response to the HIV/AIDS epidemic from thepoint of view of service providers to the extent that the HIV&AIDS pandemic hasincreased the urgency of the need to address health worker shortages. This case study, of the mining industry, reflects a response from the point of view of affected workers. Whilethe mining industry is not the only one in which there have been collective bargaining andagreements in respect of HIV/AIDS, it was one of the first to have these and, in someworkplaces, to introduce anti-retrovirals for employees. And even today agreements onHIV/AIDS are not commonplace. Thus Elsley (2007) notes little evidence of workplaceresponses to HIV/AIDS in the large collection of agreements that are housed with theLabour Research Service, outside of road freight and clothing industries, and some of thelarger employers who engage in decentralised bargaining.
The mining industry, like road freight, is one which was has been even more severelyaffected by HIV/AIDS than many others, with the Chamber of Mines estimating thatanywhere between 12.5% and 25% of employees are infected. This high rate is in part dueto the industry‟s heavy reliance on an almost exclusively male and largely migrantworkforce, among whom many live and work away from their families.
While the case study has HIV/AIDS as its focus, it includes a description of thecollective bargaining set-up in the industry, as an example of centralised bargaining in anindustry that is not at present covered by a bargaining council.
Godfrey et al. (2007) describe this system of non-statutory centralised bargaining thatcovers most of the gold and cold mining operations which make up a large part of theSouth African mining industry. The Chamber of Mines is the employer party to thebargaining forum, while unions are represented by the National Union of Mine Workers(NUM)(by far the largest), United Association of South Africa (UASA), Solidarity and theSouth African Equity Workers‟ Association . NUM, with a much larger membership thanany of the others, plays the lead role on the employee side. Some smaller unions havemembers, and even recognition agreements, at specific mines, but are not represented inthe bargaining forum. Within the forum, there are three bargaining units: „category 3 to 8employee s‟, „miners and artisans‟, and „officials‟, with the first unit being far larger thanthe others.
Although there is a single forum, there is not necessarily a single agreement. A two-tier system of bargaining allows for unions and the Chamber to negotiate agreements atsectoral level, with further mine-level negotiations on operational as well as substantiveissues. Especially for wages, Godfrey et al. (2007) suggest that employer companies oftenuse the forum to assist in reaching separate agreements with unions operating at theirmines. There are also, however, some centralised agreements on issues such as job gradingand long service awards and a range of initiatives in respect of industry-wide or broader
5 This case study draws on interview with V. van Vuuren of Business Unity South Africa and F. Rander of the Chamber of Mines.
8/6/2019 i Might Need It-s.africa
http://slidepdf.com/reader/full/i-might-need-it-safrica 38/55
29
socio-economic issues. The main agreement‟s scope also extends beyond the parties to theextent that it specifies that where sub-contracting occurs, the main employer, i.e. thecontracting company, is responsible for health and safety standards. The contractingcompany must also ensure that sub-contractors, who are often small businesses, registerunder relevant laws and make related contributions.
In 2003, NUM – with support from Solidarity and UASA – tabled a demand for asingle bargaining council covering gold, coal, platinum, diamonds and base metals. Theyhoped that such a council could harmonise benefits across all these sectors. The Chamberand unions agreed that there should be a joint investigation of centralised bargaining,including the possibility of establishing a bargaining council. This was duly done, but nofirm decisions have as yet been taken. One of the biggest stumbling blocks is how to dealwith smaller mining operations.
NUM recognises that there are both advantages and disadvantages to collectivebargaining (Labour Bulletin, June 2004d). In particular, it has recognised that reachingagreement is not enough, but that this needs to be followed by careful monitoring to ensurethat the agreements are monitored. Such monitoring had originally been left to branches,but in 2004 NUM estimated that seven-tenths of issues were not implemented with thisapproach. The union therefore resolved to supplement branch monitoring with otherapproaches.
NUM‟s initiative in respect of the industry‟s addressing HIV/AIDS go back to atleast 1991, although already in 1985 a survey had been conducted to estimate prevalencelevels among mining workers. NUM‟s initiative resulted in an agreement which set outprinciples on issues such as non-discrimination, confidentiality, training and benefits andpre-employment testing. In 1992/3 and in 1995 bilateral meetings were held to discuss theissue. These, in turn, resulted in a range of initiatives, including the establishment of anHIV/AIDS Committee within the Chamber of Mines. Meanwhile individual miningcompanies supported a range of initiatives, ranging from prevalence and knowledge-attitude-practice surveys, through home-based care programmes, training of nursecounsellors and peer educators, free condom distribution, awareness and education
programmes, free treatment for sexually transmitted infections, and treatment of opportunistic infections. Companies also increasingly started making their HIV/AIDSprogrammes available to surrounding communities and making facilities available inpartnership with government. Once anti-retroviral treatment became available, somemining companies began supporting employees to access treatment.
The Chamber of Mines estimates that mining companies spend between R220 andR480 annually per employee on workplace-based HIV/AIDS programmes. There is furtherexpenditure on local community programmes as well, in some cases, as for antiretroviraltreatment. These substantial expenditures have been encouraged by estimates of the cost tocompanies of the epidemic. For example, a 2003 estimate put the average cost peremployee dying in service from HIV/AIDS at R185,000. More than half (59%) of this
amount was attributable to medical costs, 22% to lost productivity, 15% to absenteeism,3% to funeral leave, and 1% to training costs.
While many of the discussions as to what should be done occurred within the forum,the Chamber maintained from the start that health was not a bargaining issue, and thatemployers were obliged to do whatever was necessary to have a healthy workforce. Fromits side, NUM has placed health care for all and access to such care for dependents on thetable in the two-yearly wage negotiations, but has put forward its HIV/AIDS-specific
proposals in other forums and “platforms” . Nevertheless, there seems to be generalagreement that without pressure and ideas from NUM, the employer initiatives would nothave been extensive as they are. Further, clauses on HIV/AIDS are included in the mainagreements on wages and other conditions of employment. These agreements specify,among others, that there should be “clear and defined budgets” in respect of prevention,behaviour change initiatives, wellness programmes that include counselling, andawareness-raising. Both the coal and gold mining agreements also specify that joint
8/6/2019 i Might Need It-s.africa
http://slidepdf.com/reader/full/i-might-need-it-safrica 39/55
30
HIV/AIDS partnership structures should interact with housing forums in an effort toaccelerate provision of family accommodation. With this they recognise the link betweensingle-sex hostels and the spread of HIV/AIDS.
In 2001 the Department of Mineral and Energy, the Chamber and NUM formed atripartite committee on HIV/AIDS. The committee agreed that there would be two-yearlytripartite summits, with the first in 2003. At about this time, individual companies alsobegan signing HIV/AIDS agreements with unions and the Chamber entered into anagreement with the centralised recruitment agency to provide home-based care forterminally ill miners who had returned to homes in rural areas.
Bargaining in local government 6
As noted elsewhere, municipal government employees are not currently considered part of the public service. The 284 municipalities and their employees are therefore not covered bythe public service bargaining councils. This case study therefore supplements the oneabove on public sector bargaining.
The COSATU-aligned South African Municipal Workers Union (SAMWU) is the
majority union at the municipal level. It was formed in 1987 and in the early 1990s was thefastest-growing union in the country. By 1995 it had 100,000 members. Today it has closeon 122,000 members. The union initially had mainly blue collar members. As blacksmoved into higher positions and management, the union began to gain members amongthese ranks as well.
During apartheid there were two types of industrial councils at municipal levels,namely in-house arrangements in eight cities and two provincial-level councils thatcovered smaller towns (Mawbey, 2007). As the major changes in local government cameabout post-1994, SAMWU used the opportunity first to establish an informal nationalbargaining forum and subsequently, in 1997, to establish centralized bargaining throughthe South African Local Government Bargaining Council (SALGBC). SAMWU alsoattempted to influence the shape of local government in the new dispensation bynominating people to represent COSATU in the National Local Government NegotiatingForum which developed the framework for the three-stage transition to democratic localgovernment.
The Independent Municipal and Allied Trade Union (IMATU) is the second unionparty in SALGBC. It was formed through a merger of the old South African MunicipalEmployees association, two city-based white unions in Durban and Johannesburg and aunion representing black managers from black local authorities. After its formation, manycoloured and Indian workers also gravitated to it and in later years IMATU has recruitedsome more black managers, as well as some blue collar workers. The change inmembership has been accompanied by a shift in the union‟s stance . For example, whereasIMATU did not earlier participate in SAMWU‟s strikes, it has done so in more recentyears. The SALGBC‟s constitution states that agreements require a two -thirds majority.This clause gives IMATU an effective veto in any disagreement.
Over its ten-year history, SALGBC has seen collective agreements reached onwages, conditions of service, job evaluation, organisational rights, medical aid, disciplinaryand grievance procedures, an essential services framework, agency shop, levels of bargaining, levies, and rules for conducting proceedings. In 2007, most of these wereconsolidated into what became the “main” agreement, which was extended to non -partiesby the Minister of Labour. The provisions in respect of organisational rights are moregenerous than in many other sectors. In addition to the rights provided in the LRA, theSALGBC agreement provides for 15 days time-off annually for shop steward training,
6 This case study draws on an interview with J. Mawbey of SAMWU.
8/6/2019 i Might Need It-s.africa
http://slidepdf.com/reader/full/i-might-need-it-safrica 40/55
8/6/2019 i Might Need It-s.africa
http://slidepdf.com/reader/full/i-might-need-it-safrica 41/55
8/6/2019 i Might Need It-s.africa
http://slidepdf.com/reader/full/i-might-need-it-safrica 42/55
33
The ESOP that emerged involved more than 30,000 employees, most of whom werein lower job grades and had very limited savings. All those benefiting from themanagement share scheme were excluded. Because of the immediate relatively poverty-stricken situation of most workers, it was agreed that there should be tangible benefitswithin a reasonable time period. But it was also recognised that the ESOP could be a goodbasis for long-term savings for pensions. It was agreed that each worker would receivebenefits in five equal annual tranches between the end of years three and seven, and that
they would be encouraged to put the money into long-term savings.The second BEE example involves the transfer, in 2006, of 43.6% of the ownership
of bus company Putco to blacks (Barrett, 2006). The deal is particularly intriguing as Putcois the largest bus operator in the country, with its main business involving provision of public transport for the working class. In this deal, the South African Transport and AlliedWorkers Union (SATAWU), Retail and Allied Workers Union, National Union of MetalWorkers of South Africa and Solidarity were the union partners and Putco‟s bargainingunit, covering 3,376 of the total of 3,700 Putco employees, was used as the locus fornegotiations.
Putco was previously listed on the Johannesburg Stock Exchange in 2005, butdelisted in 2005 to make the black economic empowerment deal possible. When aproposed deal with the first black company, Safika, fell through, SATAWU demanded thatworkers in the bargaining unit be included. The ESOP Shop was again brought in toadvise, and agreement eventually reached that 16.8% of the company‟s shares would go toworkers within the bargaining unit. A further 14.5% was allocated to employees fromsupervisors upwards outside of the bargaining unit. The agreement included part-timeworkers, and also required that all those who were employed casually without good reasonshould immediately be made permanent. In addition to the 31.6% of shares allocated foremployee ownership, a further 12% was allocated for outside groups, including black women and black disabled investors.
Workers had to pay 1c per share, with a further R1.25 funded by a loan from theformer owners of the company. Ten days after the agreement had been signed, 90% of
employees had signed up.Before concluding the agreement, workers met four times to discuss what having an
ESOP would mean for the power of the union and in terms of the impact on wagebargaining. The final agreement alleviated concern over the latter point by stipulating that66% of annual profits would revert to the company and be available for wages, with theremaining 33% used to repay the loan from the previous owners and to pay dividends.
The third case study (Grawitzky, 2008) is more adversarial and involves attempts byemployees to gain better wages and working conditions when building stadiums for the2010 World Cup. The case is relevant from a BEE perspective because many of the sub-contracts for these stadiums have been purposefully awarded to black-owned companies.This example also highlights a potentially more negative side of BEE.
The case study described here again involves NUM, which engaged on this issueafter a series of illegal strikes. One of the issues raised by striking workers was thatemployees of sub-contracting companies often worked alongside workers of the maincontractor doing similar work but with different, inferior wages and conditions. Whenworkers raised this issue, the BEE companies argued that they should get concessionsbecause they were black. In a subsequent legal strike at Moses Mabhida Stadium ineThekwini, one of the demands was again that sub-contractors pay workers same rate asthose employed by main contractors.
The size of the wage gap was large, in that the employees of the main contractorwere represented by NUM and received wages of R11.90 per hour, as specified in the civilengineering agreement while some of the employees of sub-contractors were covered bythe sectoral determinations statutory agreements for security and cleaning. Yet others werenot covered by any measure. Their pay varied between R5.50 and R6.00 per hour i.e. only
8/6/2019 i Might Need It-s.africa
http://slidepdf.com/reader/full/i-might-need-it-safrica 43/55
34
about half of the amount received by the main contractor‟s employees . Very few of thesub-contracted workers were union members when they originally embarked on the strike.By the end of the strike, NUM had recruited 98% of the workforce.
The dispute eventually had to be referred to the CCMA. The final agreementprovided for two lump sum payments, of R2,000 and R4,000 respectively, to be paid toworkers if the contract was completed on time. The CCMA also subsequently tried toengage with those involved in World Cup projects at an early stage to try to provide arecurrence of similar situations.
Collective bargaining in the clothing industry 7
This case study describes several aspects of the bargaining strategy of the South AfricanClothing & Textile Workers Union (SACTWU). It focuses on the clothing sector, althoughSACTWU also organises workers in textiles, leather and footwear. It pays particularattention to the issue of narrowing wage gaps and productivity bargaining.
Virtually all aspects of bargaining in this sector are affected by the fact that theclothing industry has been particularly hard hit by the post-apartheid South African
government‟s swift tariff reductions . Greenburg (2005) estimates that 80,000 clothingworkers lost their jobs in the 1990s as inexpensive clothing and textiles were importedfrom East Asia. A Labour Bulletin article of 2005 (Labour Bulletin, 2005) quotes aSACTWU estimate that 30,000 jobs had been lost over the previous two years in clothing,textile, footwear and leather, and that clothing imports from China alone were four timestheir value in 2002. SACTW U‟s report to its 10 National Congress observes that it hadrecords of 38,435 clothing jobs lost and 170 factories with 21,121 workers closing downover the preceding three years. As a result of these closures, the total number of workersregistered with the bargaining council fell from 99,128 in July 2004 to 72,571 in July2007, while the number of workplaces fell from 1,119 to 1,015 (SACTWU, 2005:32).
These pressures have resulted in the union developing a bargaining strategy thatseeks to balance improved wages and conditions with protecting jobs. To support theirnon-bargaining efforts on the latter count, the union has also tabled demands forinformation on local and foreign customers of manufacturing and where made-up garmentsare sourced. This is used to str engthen the union‟s “buy local” campaign . Beyond thebargaining council, the union submitted an application to NEDLAC to hold a protestdemanding that retailers agree to source goods locally (Labour Bulletin, 2004: 17). Theunion has also worked with the Department of Trade and Industry and employers todevelop a plan for the industry. To address the outsourcing and under-cutting that has beenencouraged by the pressures on the industry, SACTWU played a key role in getting theLRA amended to cover so-called “independent contractors” and to strengthen the powersof bargaining councils in enforcing compliance with gazetted agreements. The union hasalso made efforts to organise workers in the cut-make-and-trim (CMT) operations that
constitute one form of outsourcing. Indeed, Greenburg (2005) found that in one of theCMT operations she visited, the workers were SACTWU members and enjoyed the correctwages, benefits and conditions of work.
Unlike in many other bargaining councils, where the employer side consists of farfewer parties than the employee side, in clothing the clothing agreement is betweenSACTWU, on the one hand, and six employer organisations. Of the latter, five are specificto the clothing industry, while the sixth is the Consolidated Association of Employers of Southern African Region (CAESAR). CAESAR is known for its strong support for smallbusinesses. SACTWU represents more than three-quarters of workers covered by thecouncil.
7 This case study draws, among others, on interviews with W. van der Rheede and F. Abrahams of the Southern AfricanClothing & Textile Workers Union, as well as the report to the SACTWU‟s 10 th national congress (2007).
8/6/2019 i Might Need It-s.africa
http://slidepdf.com/reader/full/i-might-need-it-safrica 44/55
35
The current single national council resulted from the amalgamation of severalregionally based councils which produced seven different agreements. The single council,while still having geographical chambers, produces a single “main” agreement . Theamalgamation reflects a more general SACTWU campaign to move to centralisedbargaining within each of the sectors in which it operates. At the time of writing, the unionbargained in three national bargaining councils, three regional bargaining councils and twonational distribution forums which together covered almost 90% of th e union‟s
membership.The 2008/09 agreement provides for a 9% increase in total labour cost for workers in
metropolitan areas, of which 0.5% is allocated for plant-level productivity incentiveschemes. In other areas, there is a higher increase. The highest increase stands at 14.24%for general workers in non-metro B area. There is no provision for productivity incentiveschemes in non-metro areas. These areas have been excluded from the incentive scheme atthis point because of the need to concentrate on closing the wage gap. It was thereforeagreed that the scheme should be piloted in the metro areas where SACTWU has more of apresence, and can later be rolled out.
The differential increases found in the 2008/09 agreement were also present inprevious agreements. The report to the 2007 congress notes that, despite the efforts to closegaps, wage settlements for metro workers over the previous three years more or less keptpace with inflation while those for other workers beat inflation, sometimes by substantialamount.
As another example of attempts to have parity among workers, the agreement statesthat all contract employees with more than 12 months employment must be converted intopermanent employees, and that all contract workers are entitled to a pro-rata share of allstatutory payments. Contract workers employed at the end of November are entitled to fullpay for public holidays over the Christmas/New Year period.
The 2007/08 agreement makes provision for the introduction of the IndustryProtection Fund where it does not already exist. Both employer and employee are requiredto pay a minimum of 10 cents to this fund each week, which is included as part of totallabour costs. The agreement also includes an annexure containing a Code of Good Practiceon Key Aspects of HIV/AIDS and Employment. This begins with a statement recognisingthat “women more vulnerable to infection in cultures and economic circumstances wherelittle control over their lives” – an important statement in a heavily female-dominatedindustry.
In respect of the productivity incentive, the agreement specifies that a bank accountmust be established into which the employer must pay the 0.5% weekly. Each workplace isgiven two months to reach agreement on how the incentive scheme will work. If this hasnot been done within two months, the money must be paid out to workers until there issuch agreement. The agreement specifies further that all workers must benefit from thescheme, and that it may not entail downward variation.
The 2005/06 agreement already included a productivity provision, and also made provision for a “twilight shift” to help with job creation . In 2007/08 there was again aproductivity provision. Alongside providing for productivity initiatives in theseagreements, the union has engaged with employers in several processes facilitated byoutsiders which have attempted to reach agreement on productivity schemes. The secondsuch process resulted in an agreement in May 2007 that the parties would initiate pilotincentive-based productivity schemes over the next few months at selected companies anduse the results to introduce, if agreed, industry-wide productivity arrangements from 2008.However, to date there have been very few examples of anything beyond simple incentivesrelated to absenteeism and coming early to work that exist in many of the larger metro-based companies.
Levi Strauss stands out as an example of a company with which SACTWU has, since2004, very successfully collaborated with the employer in developing a productive
8/6/2019 i Might Need It-s.africa
http://slidepdf.com/reader/full/i-might-need-it-safrica 45/55
36
incentive scheme. This has been a strong factor in ensuring that the Cape Town factory isone of the five remaining Levi-owned factories in the world. Indeed, the factory has movedfrom being the 13th most profitable Levi operation to third place in 2005, and experienceda 25% increase in turnover in the space of one year. Workers, meanwhile, can earn “30
percent above industry norms” 8. From the workers‟ side, there was initially some level of distrust with the computer-based system that calculated their bonus. To address this, thefactory reverted to a manual system which is easier to understand.
However, as at the time of interview, no workplaces had come forward withproposals for productivity incentive schemes in response to the provisions in the 2007/08agreement. This is a disappointment to the union, which had got a mandate from membersto include the 0.5% provision. The union had hoped that the provision would encourageemployers to abandon a “defeatist approach” to th e problems facing the industry.
SACTWU has also not had an easy ride in taking forward other initiatives to protectworkers in the industry. Some of the employer attacks have focused on weakening thebargaining council and the protection it affords. In December 2005, SACTWUcollaborated with the council and Minister of Labour in a legal battle against the non-metrobased employer associations who were trying to interdict the Minister of Labour fromgazetting and extending the 2005 clothing wage agreement to all non-party companies.This would have broken a practice that extended back to before the 1990s of the agreementbeing extended to non-members. The employers, on the advice of their attorneys, settledbefore the court proceedings started and paid part of the legal costs incurred by thebargaining council, Department of Labour and SACTWU. In 2006, the employerassociations again refused to agree to extend the gazetted main agreement. SACTWUdeclared dispute and, following arbitration in August 2006, the agreement was extended.
SACTWU has collaborated with the bargaining council to refute arguments that itrepresents only big businesses through annual analyses of the size of registered companies.In July 2006, the analysis showed that of all party employers, 17% were large, 7% micro(1-5 workers), 9% very small (6-10 workers), 37% small (11-50), and 30% medium-sized(51-200). Of non-party employers, 8% were large, 18% micro, 13% very small, 41% small
and 19% medium-sized. The number of large companies among party employers fell bythree percentage points between 2005 and 2006.
Collective bargaining in smallworkplaces in agriculture
Godfrey et al. focus on some of the more established and better known actors in their casestudies of collective bargaining, although they also refer to the simple agreements that arefound in small retail establishments. The report to congress (Sikhula Sonke, 2008) of thesecretary of Sikhula Sonke, a woman-led union that organises agricultural workers in theWestern Cape, gives some further sense of the small end of the scale. At the time the report
was compiled, the union had a total membership of 3,644 members, and represented themajority of workers on 116 farms, on 100 of which it had established farm committees.The union had 57 recognition agreements with employers, 6 of which had been signed in2005, 21 in 2007 and 30 in 2008. All these agreements entitled shop stewards to paid timeoff for union activities, and all covered health and safety in the workplace. In the twelvemonth period covered by the report, the union had entered into 20 collective bargainingagreements. All provided for collective bargaining, three-quarters stipulated that toiletsmust be provided in the vineyards, half provided for an annual bonus, half provided forpaid maternity leave, and three provided for day-care facilities for children. The workerscovered by these agreements would also have been covered by the sectoral determinationfor agriculture. However, the report notes that the local Department of Labour lackedcapacity to enforce its provisions.
8 http://www.agoa.info/?view=.&story=news&subtext=663
8/6/2019 i Might Need It-s.africa
http://slidepdf.com/reader/full/i-might-need-it-safrica 46/55
37
Wage-setting in the retail sector 9
The retail sector is interesting because of the way it combines a mix of different forms of wage-setting, including a relatively recent sectoral determination. This diversity, and thefailure to establish a single bargaining council that covers the full sector, is not surprisinggiven the extreme diversity within the sector. At the one of the spectrum are the largemulti- national supermarkets such as Pick ‟n Pay, Spar and Shoprite -Checkers. At the otherend are small, informal family businesses.
The COSATU-aligned SACCAWU is the largest union in the sector. It estimates thatits collective agreements cover about 150,000 employees in the sector. If one adds a smallfurther number for other, smaller unions, only about 20% of all workers in the sector areorganised. Again, this is not surprising given the extremely large number of smallenterprises.
In 2007, SACCAWU was involved in bargaining at 32 national groups, atapproximately 250 medium-sized firms, and at 150 small firms. Most of the large firmsengaged in national-level bargaining that covered all branches that they fully owned. Theseagreements did not, however, cover their franchise operations. The extent of franchisinghas increased over recent years. SACCAWU has risen to the challenge and managed toorganise many of the employees in franchised branches. The sectoral determination for thesector also provides some protection by its lack of distinction between franchised and otheroperations and by including merchandising.
Protection of casual workers has been an issue both within bargaining forums and inthe drawing up of the sectoral determination. The latter categorises most casual workers asflexi-timers. These workers are covered by the determination, although there is nopremium for shorter hours as found in the domestic worker determination. Within thebargaining arena, some employers have objected to casuals being included in thebargaining unit. SACCAWU has committed to organising and including flexi-timers in allbargaining units despite the difficulties in doing so. Godfrey et al. (2007) speculate that theprovision for flexi-timers in the determination encouraged some employers to agree to
their being included in the bargaining unit.Pick „n Pay is unusual in including productivity and training in the collective
bargaining agreements. Most other employers have separate committees for dealing withskills development and employment equity.
Godfrey et al. (2007) compare the scope and complexity of agreements reached withmajor retailers with those that SACCAWU entered into with smaller retailers. They findthat the latter are often very short, sometimes handwritten, and generally deal only withwages and annual bonuses. However, agreements with medium-sized empoyers are moresubstantial.
The sectoral determination does not differentiate between large and small businesses.
This contrasts with the approach taken in the later hospitality determination where a lowerwage was specified for businesses with fewer than ten employees. The danger inspecifying a single minimum is that this can become the maximum as well as theminimum. Where there is strong union organisation, this effective “downward variation”of wages in better-paying firms can be avoided. This might be the case in the larger retailfirms.
Collective bargaining on gender issues
SACCAWU also provides our example of explicit engagement on gender issues incollective bargaining. The union began making women-specific and gender-relatedcollective bargaining demands in the 1980s and has continued these efforts up to the
9 This case study draws heavily on Godfrey et al. (2007).
8/6/2019 i Might Need It-s.africa
http://slidepdf.com/reader/full/i-might-need-it-safrica 47/55
38
present. In particular, the union has attempted to include maternity leave and parentalrights in agreements for all companies in which it organises, and to improve these rights inexisting agreements. While significant progress has been made, this has at times beenhampered by the fact that male-dominated negotiating teams do not always see this as apriority issue while some employers feel that these are private issues that should not beaddressed through the workplace.
The union has gender structures that have spearheaded the work on parental rightsthrough campaigns, educational programmes and policies, and development of a parentalrights model proposal which is used as the basis for negotiations. The model proposalincludes paid maternity and paternity leave, ante and postnatal care paid leave, socialsecurity provisions as well as adoption leave, stillbirth, miscarriage and abortion leave.Many of these provisions have already been achieved at both big and small companies. Arecent strategy that has contributed to th e union‟s achievements in respect of parentalrights has been the election of company-based (female) gender co-ordinators who sit on thenational negotiating teams from where they ensure that gender demands are included in thelist of demands submitted to management.
In Ellerines, a large clothing chain, the parental rights proposal remained a secondaryissue for 13 years. Agreement was concluded with the company after women shopstewardswho had been part of the u nion‟s three -year gender empowerment programme took leadership positions on the national negotiating team. This company also has a nationalcompany-based gender co-ordinator. A further factor contributing to the success was thatthe union official responsible for the company is a gender-sensitive person who believesthat all demands are equal in status.
Parental rights are generally negotiated as a separate process, given the number of issues that need to be negotiated and the level of attention needed. On average, it takesabout a year to conclude an agreement, with three to four sittings of the negotiations team.There are both advantages and disadvantages to having a separate process. The advantageis that it is not linked to wages and other issues and trading off of parental rights is thus notan option. Separate negotiations also permit sufficient attention and time to be given to
ensure a good agreement. The disadvantage is that because of the long process involved itcan easily be neglected and forgotten.
SACCAWU has over the years demonstrated its belief that women and genderdemands are trade union demands and has committed the necessary resources to ensurethat this is taken forward. The union‟s experience demonstrates the role that gender -conscious woman can play in ensuring that these issues are addressed.
Concluding remarks
The first sections of this report describe the context in which collective bargaining andindustrial relations more generally currently occur in South Africa. The discussiondescribes the historical evolution of the system into the current relatively robust set-up.The preceding section illustrates how this system has been used in a range of differentsituations to address issues that include wages but extend quite far beyond them. Theexamples span both government and private sector, and primary, secondary and tertiarysectors. Issues directly addressed either by these examples or covered in the preceding textinclude improved wages and conditions, the size of the employed workforce, socialsecurity, and various aspects of inequality. The examples in the preceding section alsoillustrate how the wage and other negotiations address or are affected by issues such as theHIV&AIDS pandemic, black economic empowerment, international trade competition, andgender. Race is a recurring theme, which is sometimes implicit and sometimes explicit. Inparticular, the attempts across several of the case studies to minimise wage gaps betweenlower- and higher-paid within a sector is, in reality, simultaneously an attempt to diminish

8/6/2019 i Might Need It-s.africa
http://slidepdf.com/reader/full/i-might-need-it-safrica 48/55
39
racial gaps given that the lower-paid occupations are still dominated by blacks whilewhites are over-represented in the higher-paid jobs.
The earlier sections reveal that only a relatively small proportion of employees arecurrently covered by collective bargaining agreements even if, in theory, virtually all arecovered by the LRA. One of the causes of limited coverage is that the organisations onboth the employer and employee sides cover only a relatively small proportion of potentialmembers. There are also repeated references to the challenges posed to collectivebargaining by informalisation in the form of contracting out, use of labour brokers, and thelike. Some attempts have been made to address this problem, but it remains a threat todecent wages and conditions. The current economic crisis will add to existing challenges,as actors will need to ensure that the efforts to save jobs do not undermine wages andconditions. However, overall this paper suggests that the current South African systemprovides significant opportunities for actors with determination and imagination to addressmany of the issues that affect them and their members.

8/6/2019 i Might Need It-s.africa
http://slidepdf.com/reader/full/i-might-need-it-safrica 49/55
8/6/2019 i Might Need It-s.africa
http://slidepdf.com/reader/full/i-might-need-it-safrica 50/55
41
References
Aroun, W.; Essa, A. Oct/Nov 2007. “Negotiations in the public sector: What wentwrong?” , in South African Labour Bulletin 31(4), pp. 6-9.
Barrett, J. 2006. “Historic deal: Highest worker ownership in South Africa” in South African Labour Bulletin , 30(3), Aug./Sep. pp. 12-13.
Bhorat, H. ; Ravi, K. (eds.). 2007. Poverty and policy in post-apartheid South Africa (CapeTown, HSRC Press).
Bhorat, H.; van der Westhuizen, C.; Goga, S. 2007. Analysing wage formation in the South African labour market: The role of bargaining councils (Cape Town, University of Cape Town, Development Policy Research Unit).
Budlender, D. 2002. Women and men in South Africa: Five years on (Pretoria, StatisticsSouth Africa).
–––– . Sadeck, S. 2007. Bargaining council and other benefit schemes (Cape Town,Community Agency for Social Enquiry).
Department of Labour. 2008a. Annual Report 2008 (Pretoria).
–––– . 2008b. Industrial Action 2007: Annual Report (Pretoria).
–––– . 2005. “Labour‟s casualisation cancer spreads” , in South African Labour Bulletin ,29(2), Apr./May, pp. 27-31.
Devey, R.; Skinner, C.; Valodia, I. 2006. “The state of the informal economy ”, inS. Buhlungu et al. (eds.): State of the Nation 2005-6 (Pretoria, Human SciencesResearch Council), pp. 223-247.
Elsley, T. 2007. “Taste of collective bargaining trends” , in South African Labour Bulletin ,31(3), July/Aug., pp. 59-61.
–––– . 2006. “Lower increases: Collective bargaining in 2005” , in South African Labour Bulletin 29(6), Dec./Jan., pp. 28-30.
Fine, A. 2007. “Anatomy of South Africa‟s biggest Esop” , in South African Labour Bulletin , 31(1), Mar./Apr., pp. 40-43.
Godfrey, S.; Theron, J.; Visser, M. 2007. The state of collective bargaining in South Africa: An empirical and conceptual study of collective bargaining , WorkingPaper 07/130, Nov. (Cape Town, University of Cape Town, Development PolicyResearch Unit).
–––– ; Maree, J.; Theron, J. 2006. “Conditions of employment and small business:Coverage, compliance and exemptions ”, Working Paper 06/106 (Cape Town,Labour and Enterprise Project, (Cape Town, University of Cape Town,Development Policy Research Unit).
Grawitzky, R. 2008. “Striking a goal for black empowerment” , in South African Labour Bulletin , 32(1), Mar./Apr., pp. 42-44.
Greenburg, J. 2005. “Sweating it out for a hundred a week” , in South African Labour Bulletin , 29(4), Aug./Sep., pp. 39-42.
Grogan, J. 2005. Workplace Law (Cape Town, Juta).
Hassen, E.K. 2007. “Public service strike: What was finally agreed?”, in South African Labour Bulletin , 31(4), Oct./Nov., pp. 10-12.
–––– . 2005. “The power behind the desk: Democracy, collective bargaining and the publicservice in South Africa” , in South African Labour Bulletin , 29(1), Mar., pp. 10-14.
8/6/2019 i Might Need It-s.africa
http://slidepdf.com/reader/full/i-might-need-it-safrica 51/55
8/6/2019 i Might Need It-s.africa
http://slidepdf.com/reader/full/i-might-need-it-safrica 52/55
43
Woolard, I.; Leibbrandt, M. 2006. “Towards a poverty line for South Africa ” (Cape Town,University of Cape Town, Southern Africa Labour & Development Research Unit).
2008/2009 Substantive Agreement between six employer organisations and the South African Clothing & Textile Workers Union .
“SA clothing industry can be profitable – Levi Strauss ”, available athttp://www.agoa.info/?view=.&story=news&subtext=663

8/6/2019 i Might Need It-s.africa
http://slidepdf.com/reader/full/i-might-need-it-safrica 53/55
8/6/2019 i Might Need It-s.africa
http://slidepdf.com/reader/full/i-might-need-it-safrica 54/55
45
Appendix: Interviews
Fachmy Abrahams Southern African Clothing & Textile WorkersUnion
Thandeka Gwagwa Democratic Nursing Organisation of South Africa
Jabulani Magagula Democratic Nursing Organisation of South Africa
John Mawbey South African Municipal Workers Union
Patricia Nyman-Appolis South African Commercial Catering & AlliedWorkers Union
Faizel Randera Chamber of Mines
Vic van Vuuren Business Unity South Africa
Wayne van der Rheede Southern African Clothing & Textile Workers
Union
8/6/2019 i Might Need It-s.africa
http://slidepdf.com/reader/full/i-might-need-it-safrica 55/55
International Labour O fce (ILO)DIALOGUE
4, route des MorillonsCH -1211 Geneva 22
Switzerland
Tel.: (+41 22) 799 70 35Fax: (+41 22) 799 87 49E-mail: dialogue @ilo.org
Web site: http://www.ilo.org/dial