Embed Size (px)
Citation preview

Visual Literacy“Bring It”into the
Classroomby
Jodie Stoltenow
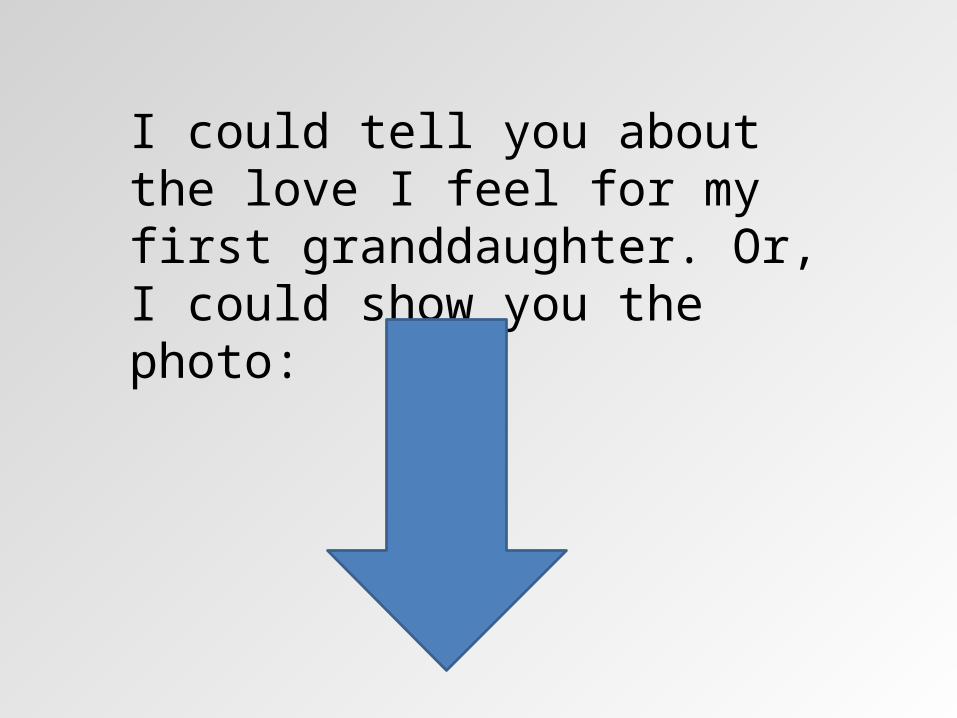
I could tell you about the love I feel for my first granddaughter. Or, I could show you the photo:
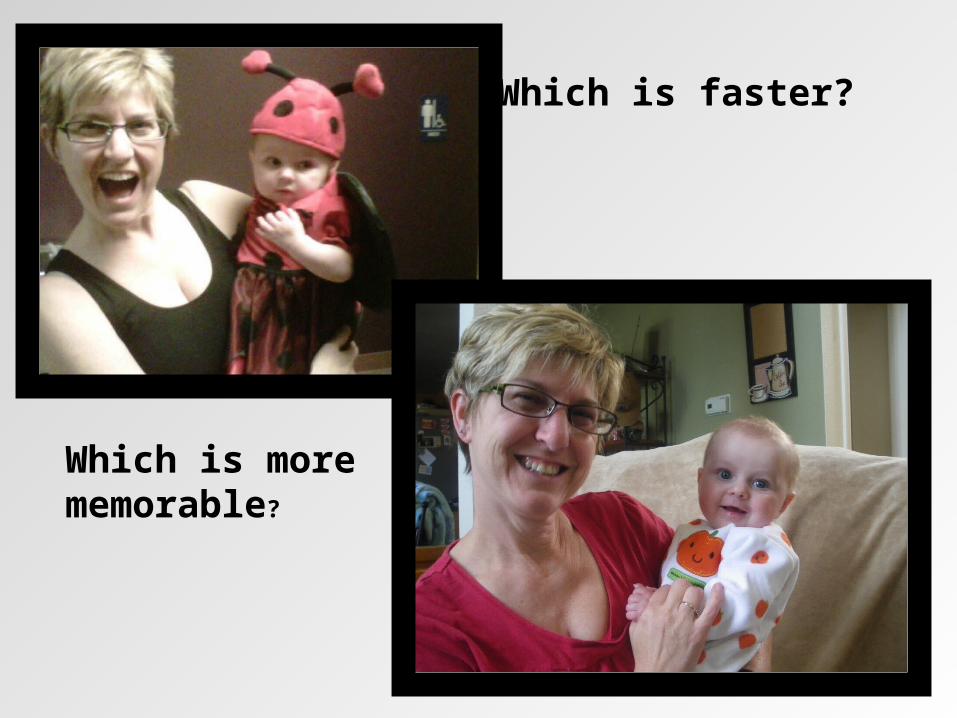
Which is faster?
Which is more memorable?
Today, clearly, we live in a visual world. Our news comes to us
through visual media: illustrated magazines newspapers, movies and television,streaming video from the Internet.
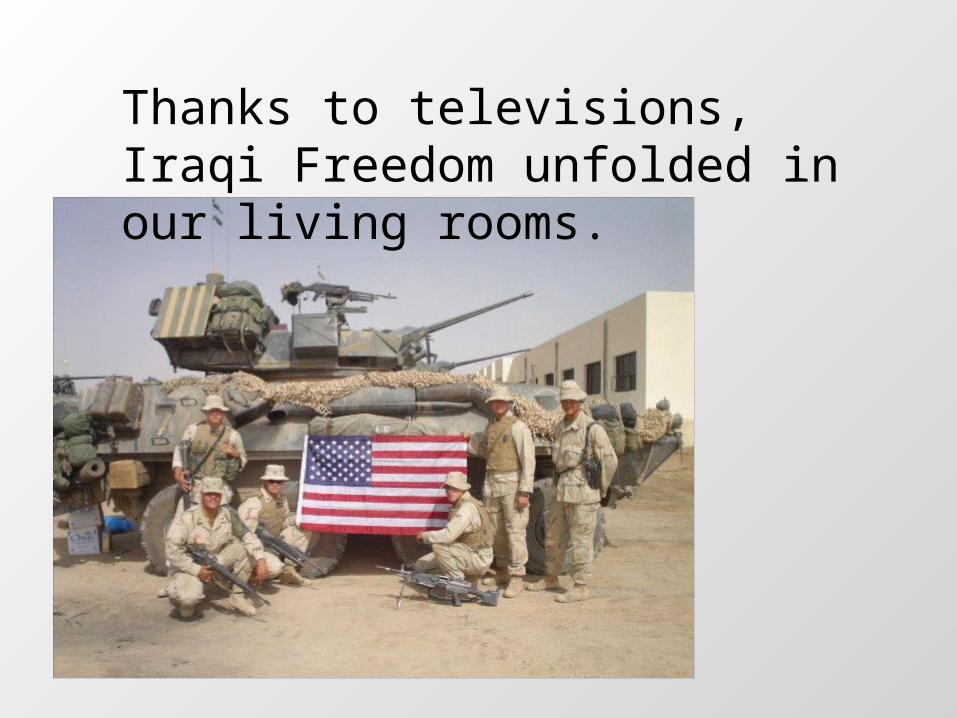
Thanks to televisions, Iraqi Freedom unfolded in our living rooms.
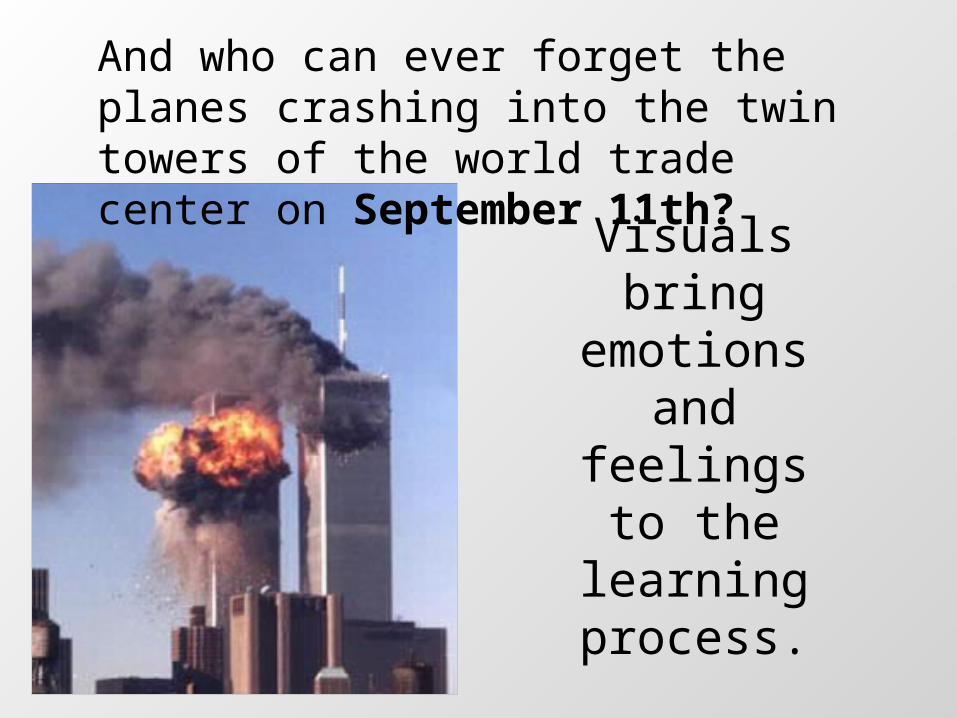
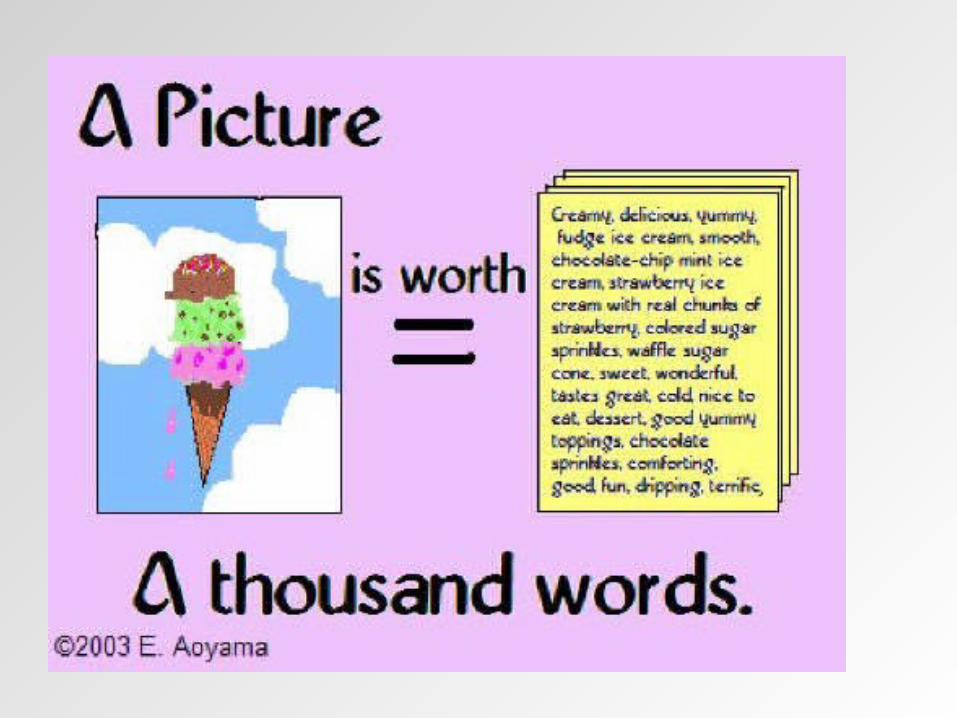
Visuals bring emotions and feelings to the
learning process.
And who can ever forget the planes crashing into the twin towers of the world trade center on September 11th?
How are Visuals Affecting our
Children?
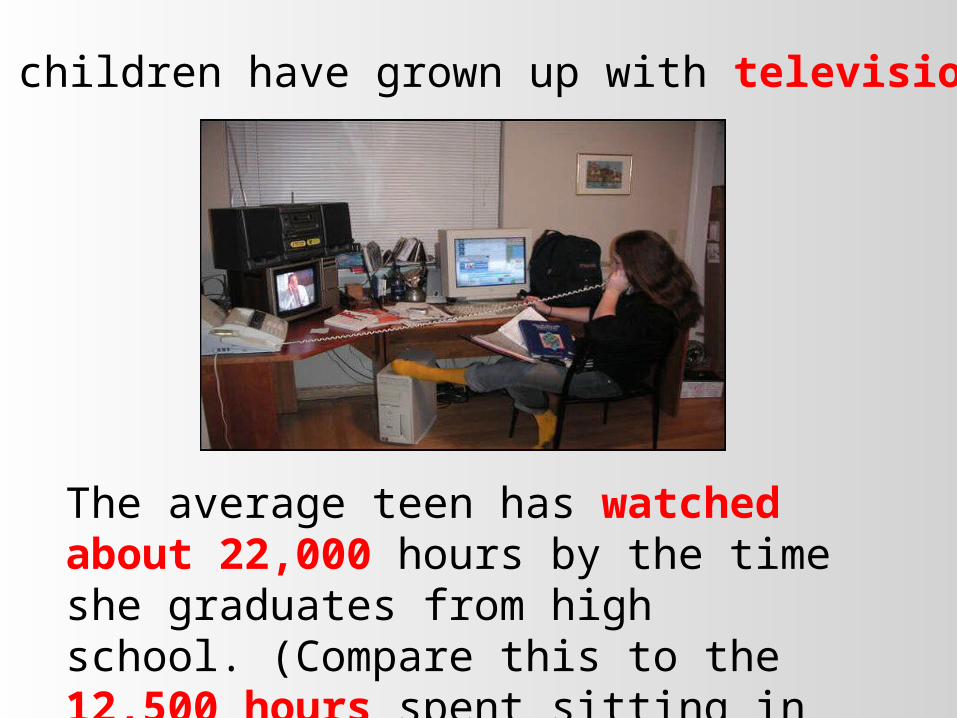
The average teen has watched about 22,000 hours by the time she graduates from high school. (Compare this to the 12,500 hours spent sitting in classrooms!)
Our children have grown up with television.
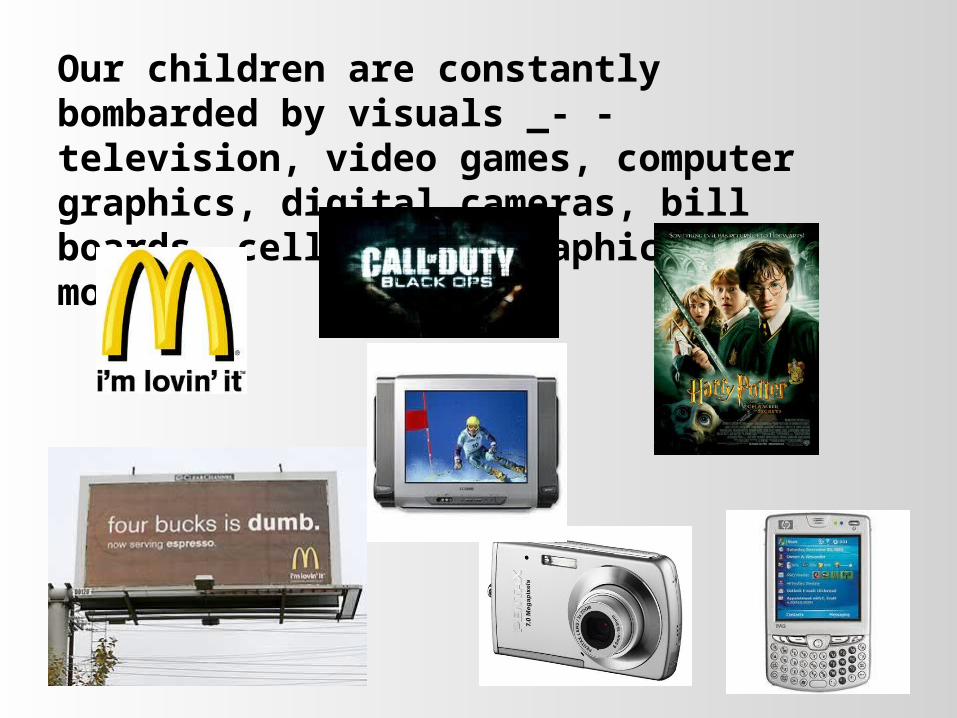
Our children are constantly bombarded by visuals _- - television, video games, computer graphics, digital cameras, bill boards, cell phone graphics, and movies.
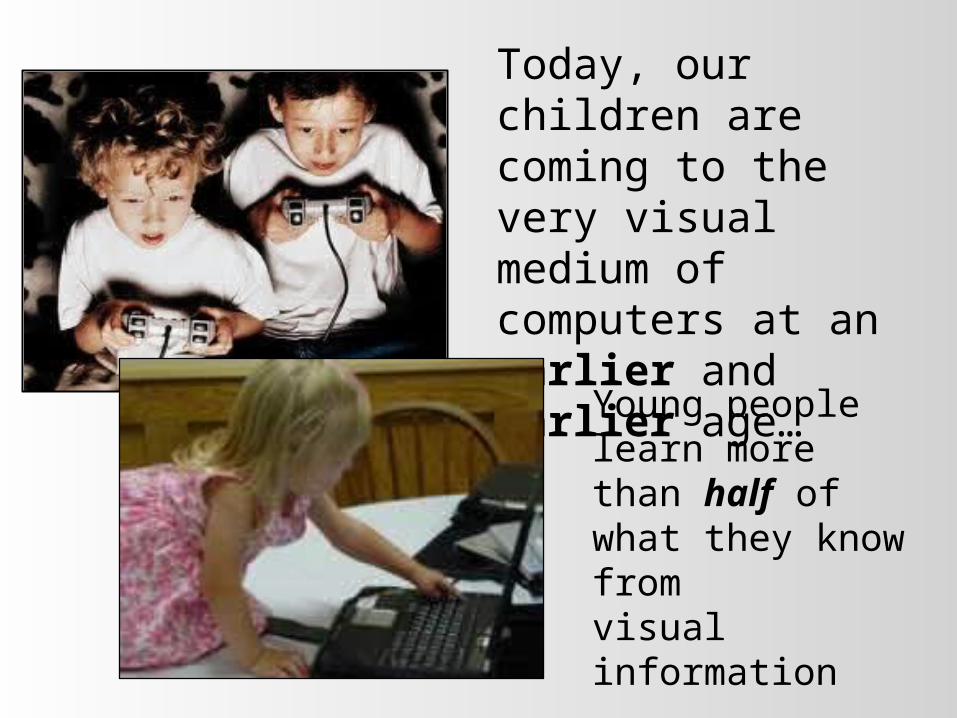
Today, our children are coming to the very visual medium of computers at an earlier and earlier age…
Young people learn more than half of what they know from visual information
.
As Educators of 21st century students, do we have a responsibility to teach with visuals?
As Educators of 21st century students, should we teach how to evaluate visuals?
If a picture can stimulate the memory, and the memory becomes the learning then…

As Educators of 21st Century students, we must take advantage of every opportunity that comes our way.
As Educator of 21st Century Students, we must learn to
becomeVisually Literate
and teachVisual Literacy
in our day-to-day classroom activities!
•How do we learn which visuals to use?
•How do we learn how to use those visuals?
•Where do we start?
Let’s start at
the very
beginning.
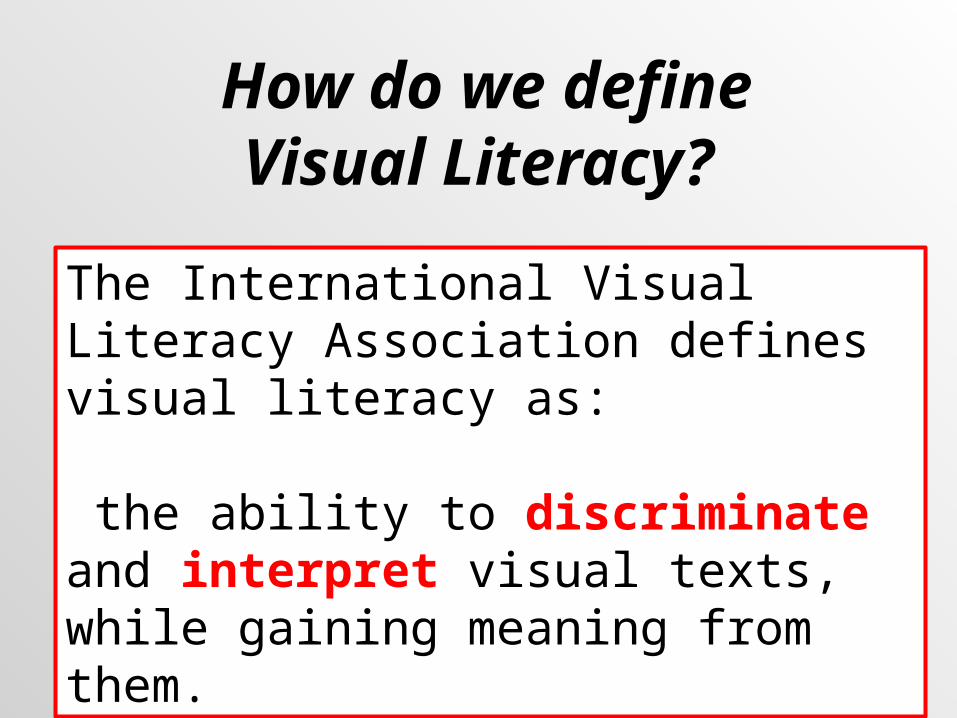
How do we define
Visual Literacy? . The International Visual Literacy Association defines visual literacy as:
the ability to discriminate and interpret visual texts, while gaining meaning from them.
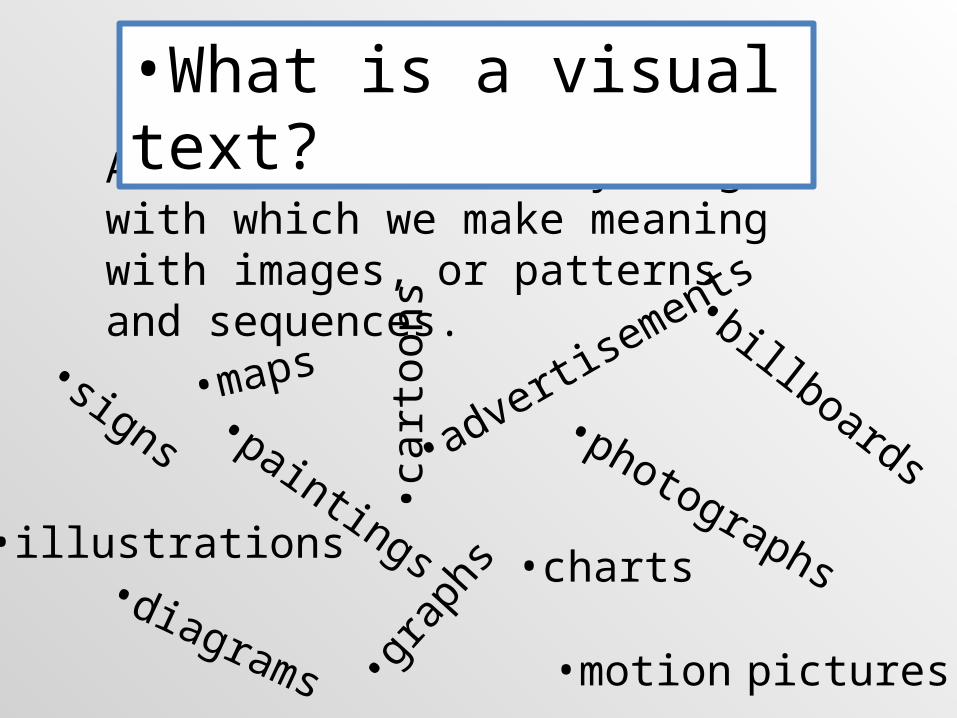
A visual text is anything with which we make meaning with images, or patterns and sequences.
•What is a visual text?
•motion pictures
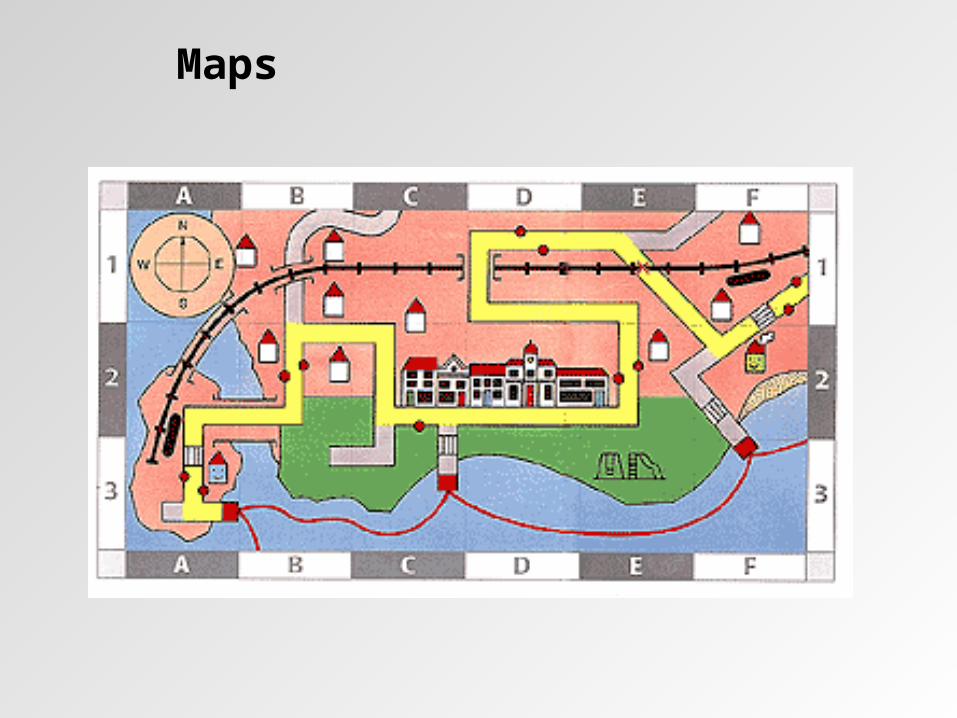
•signs•maps
•paintings
•photographs•illustrations •charts
•grap
hs
•diagrams
•billboards• c
arto
ons
•advertisements

Examples of Visual Texts
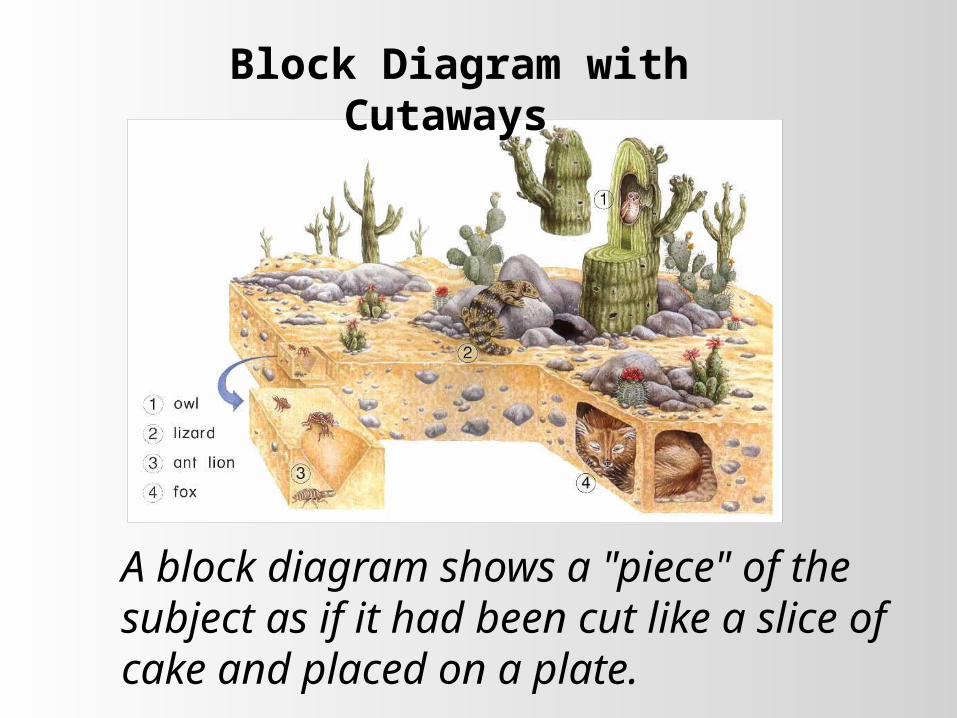
Block Diagram with Cutaways
A block diagram shows a "piece" of the subject as if it had been cut like a slice of cake and placed on a plate.
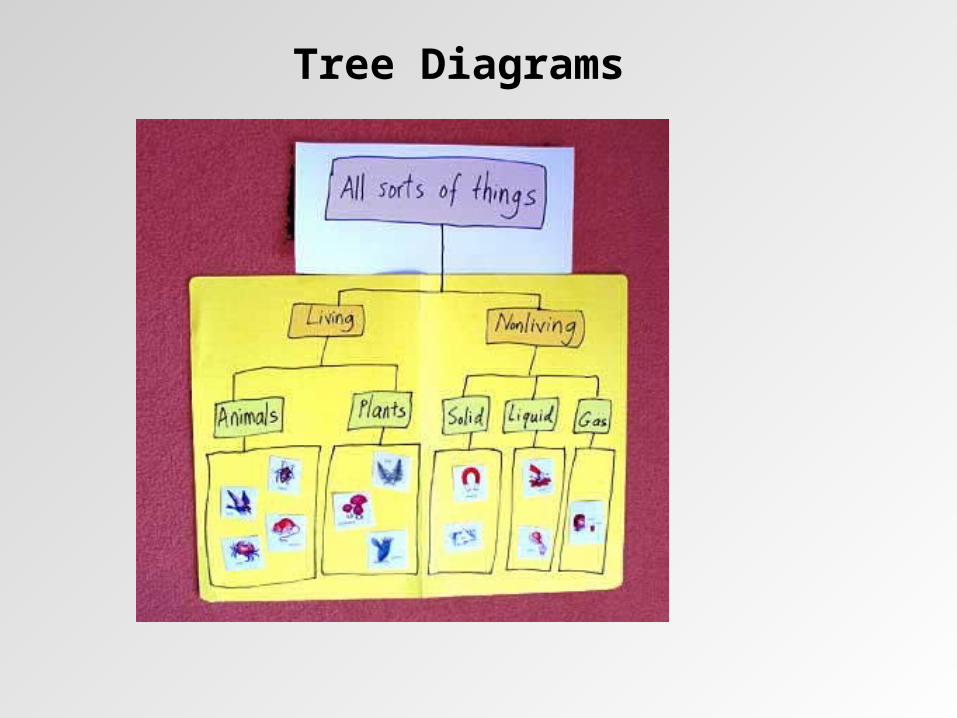
Tree Diagrams

Color key
head
body
abdomen
leg
mandible
antenna
eye
Key features • Clear outlines• Colors identify parts of the subject. • Heading• Color key names parts of the subject without cluttering the diagram with lines and arrows.
Color Key DiagramSimplifies its subject and makes
generalizations.
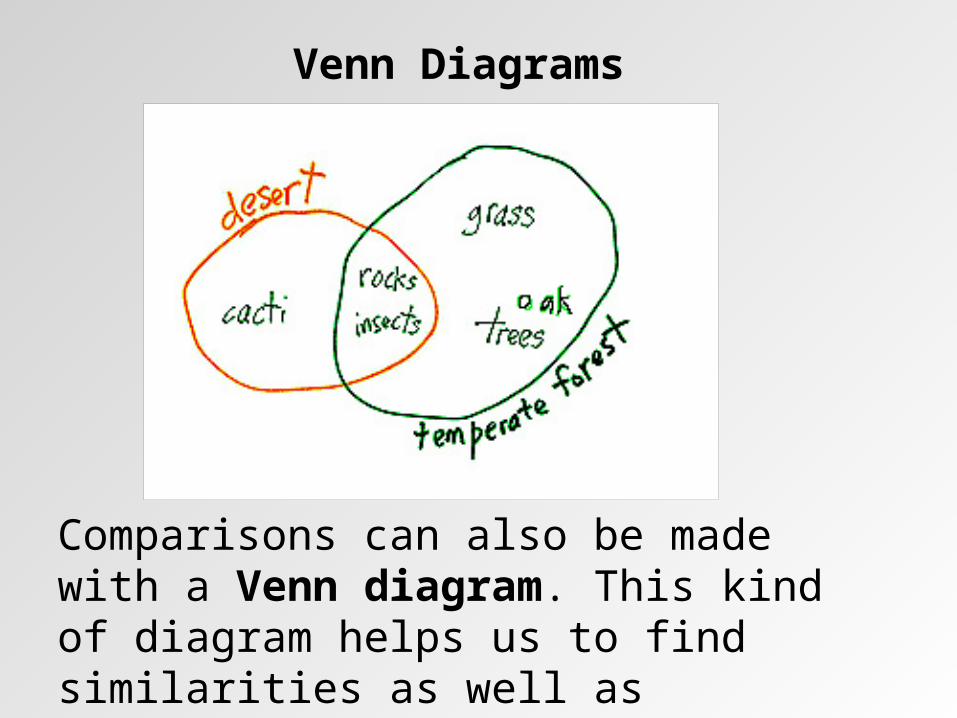
Comparisons can also be made with a Venn diagram. This kind of diagram helps us to find similarities as well as differences:
Venn Diagrams

Exploded Diagram
An exploded diagram separates the parts of a subject so that each part can be seen clearly.
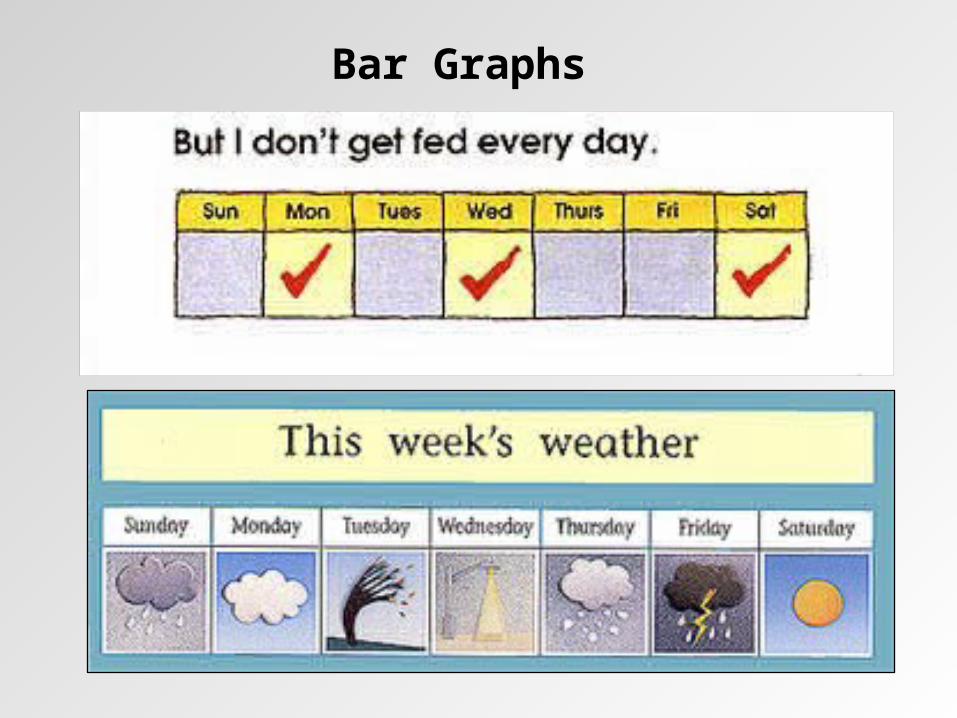
Bar Graphs
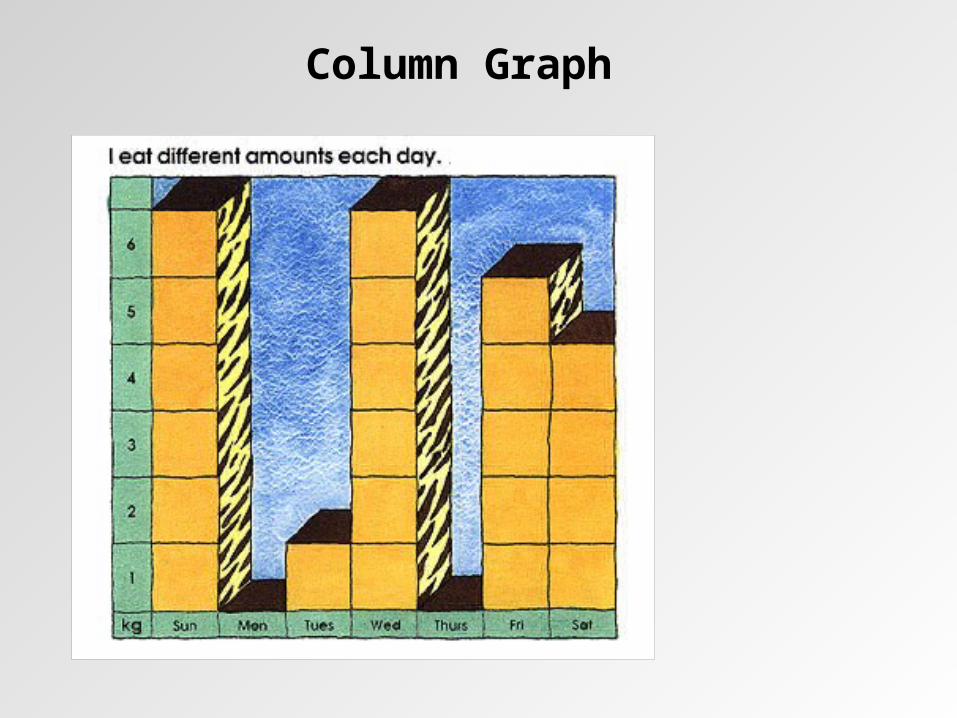
Column Graph
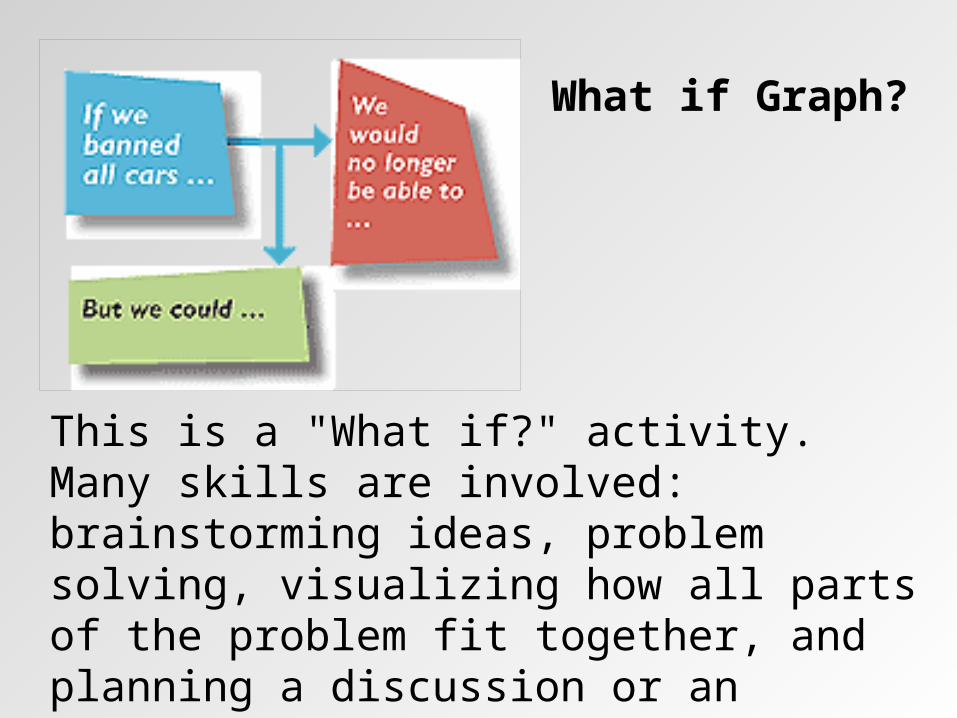
This is a "What if?" activity. Many skills are involved: brainstorming ideas, problem solving, visualizing how all parts of the problem fit together, and planning a discussion or an explanation.
What if Graph?
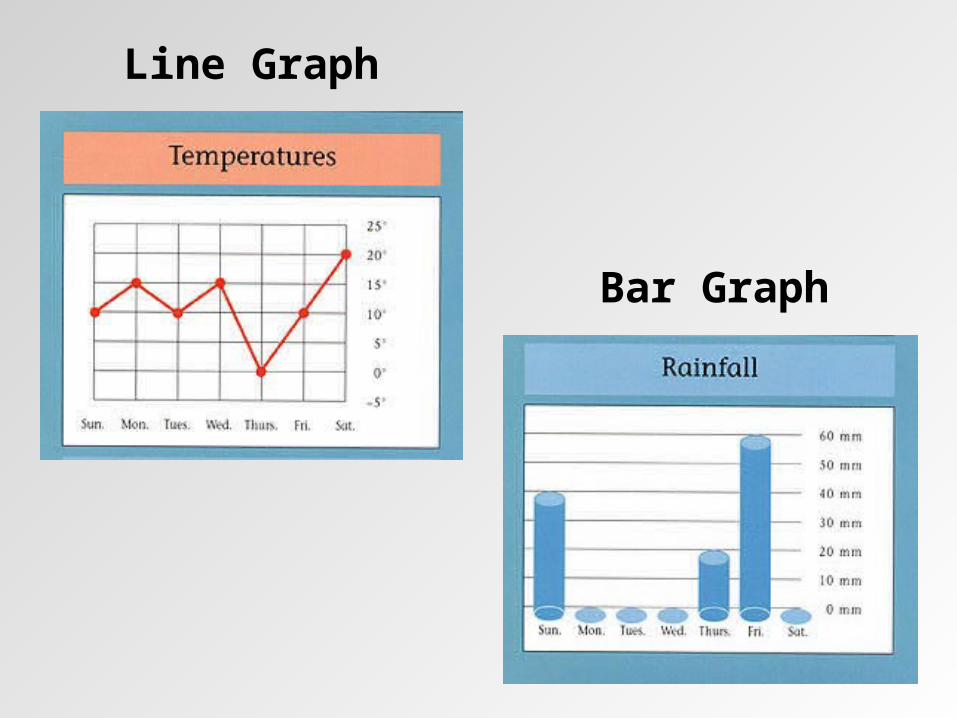
Line Graph
Bar Graph
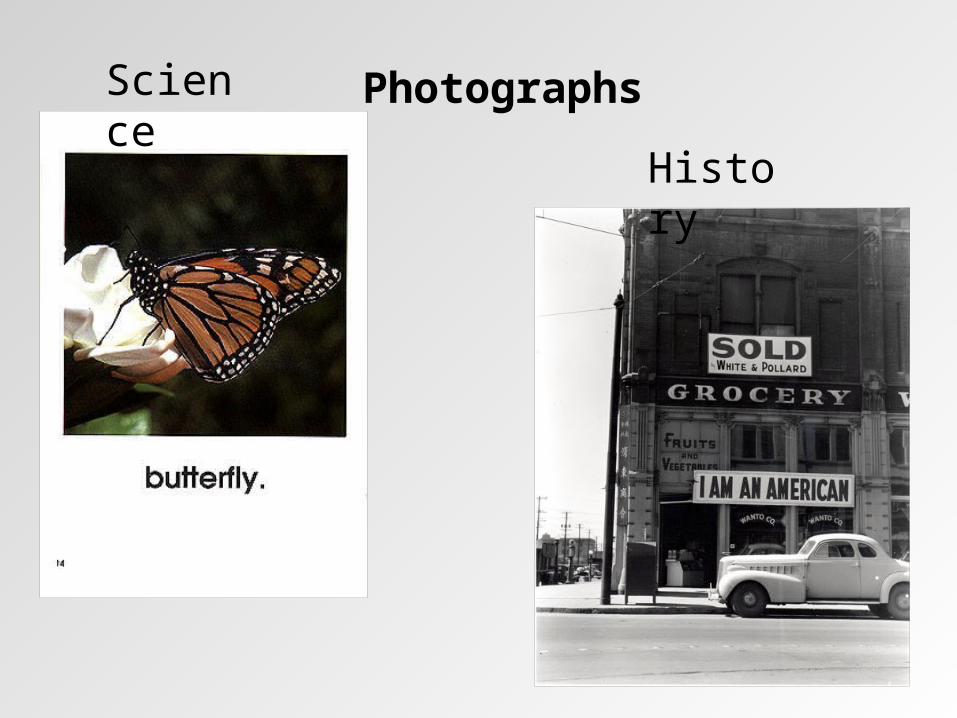
PhotographsScience
History
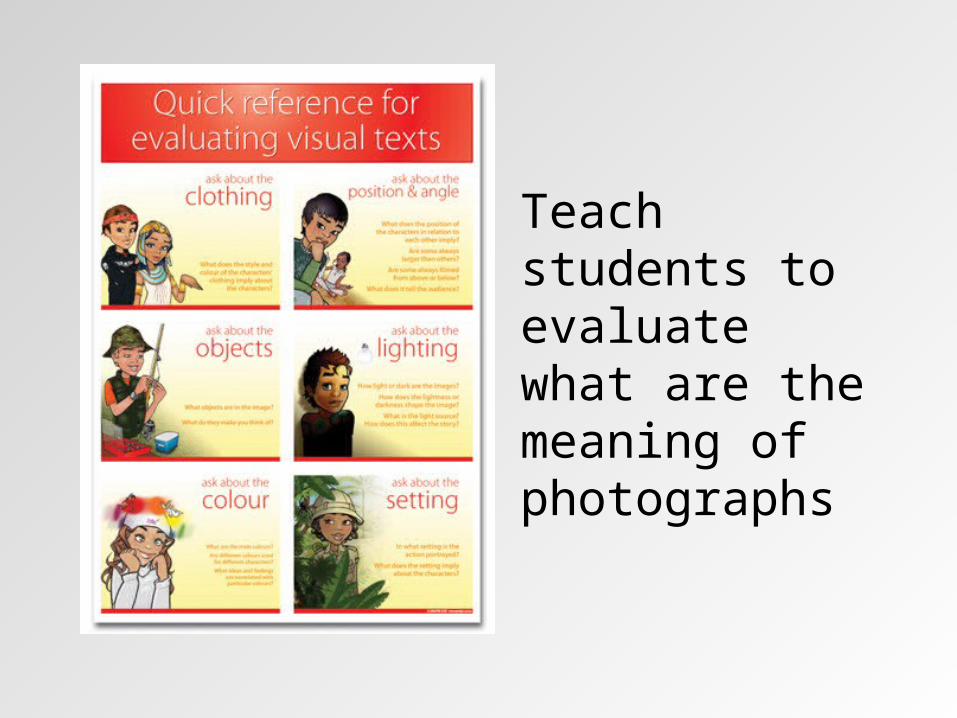
Teach students to evaluate what are the meaning of photographs
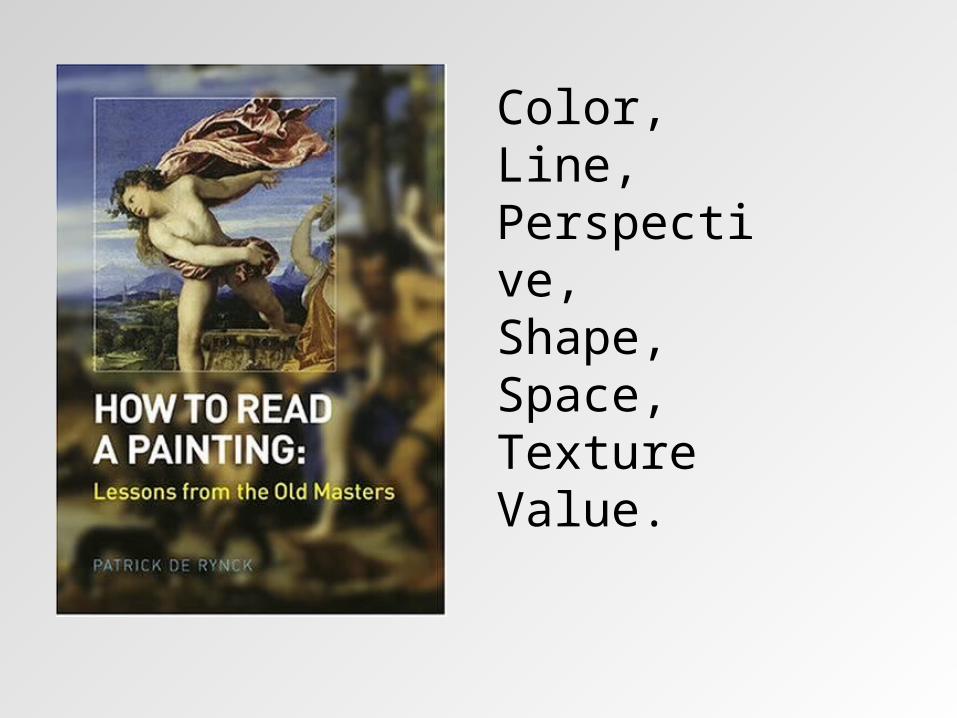
Color, Line,Perspective, Shape, Space, Texture Value.
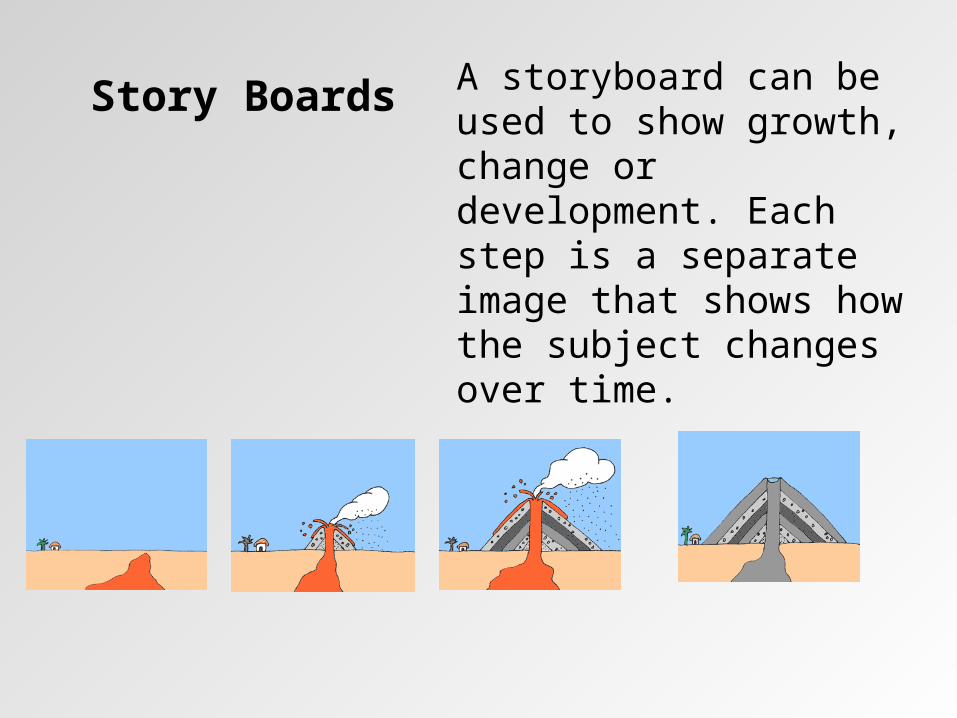
A storyboard can be used to show growth, change or development. Each step is a separate image that shows how the subject changes over time.
Story Boards
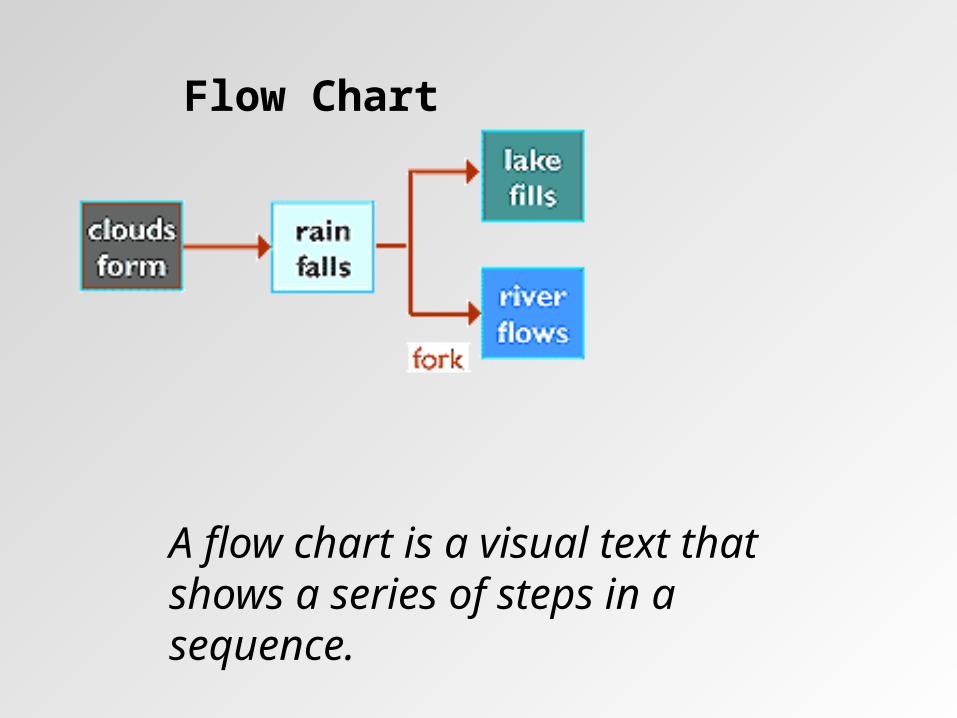
Flow Chart
A flow chart is a visual text that shows a series of steps in a sequence.

Mystery webs Mystery webs are web diagrams that help with comprehension and learning. They are suitable for creating curiosity about a new topic before you begin it; revising a topic that has just been completed. You are also introducing children to the use of web diagrams, sometimes called concept maps.
Why UseVisual Texts?

•Many information texts use visual elements
•Many visual texts are accessible to all readers
•Many visual texts are complex, multilayered texts•Visual texts communicate certain information more clearly than verbal texts
•Visual texts are widely used in electronic media
•Visual literacy is a life skill
How to ChooseAppropriate
Visuals
To recount use: Time Lines
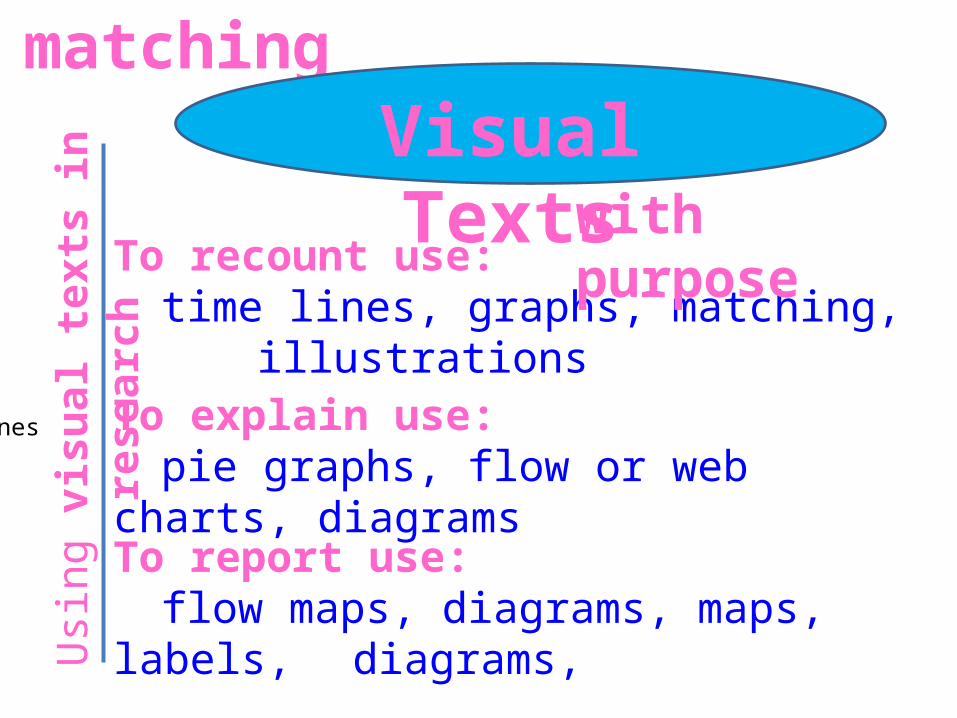
To recount use:time lines, graphs, matching, illustrations
matching
with purpose
Usi
ng v
isua
l tex
ts in
rese
arch
To explain use:pie graphs, flow or web charts, diagrams
To report use:flow maps, diagrams, maps, labels,
diagrams,
Visual Texts

Visual textsU
sing
vis
ual t
exts
in re
sear
ch chose from
using
bird’s eye viewcolumn table
cross sections
column graphcontext maps
flow diagramhow to diagrams flow chartconcept maps
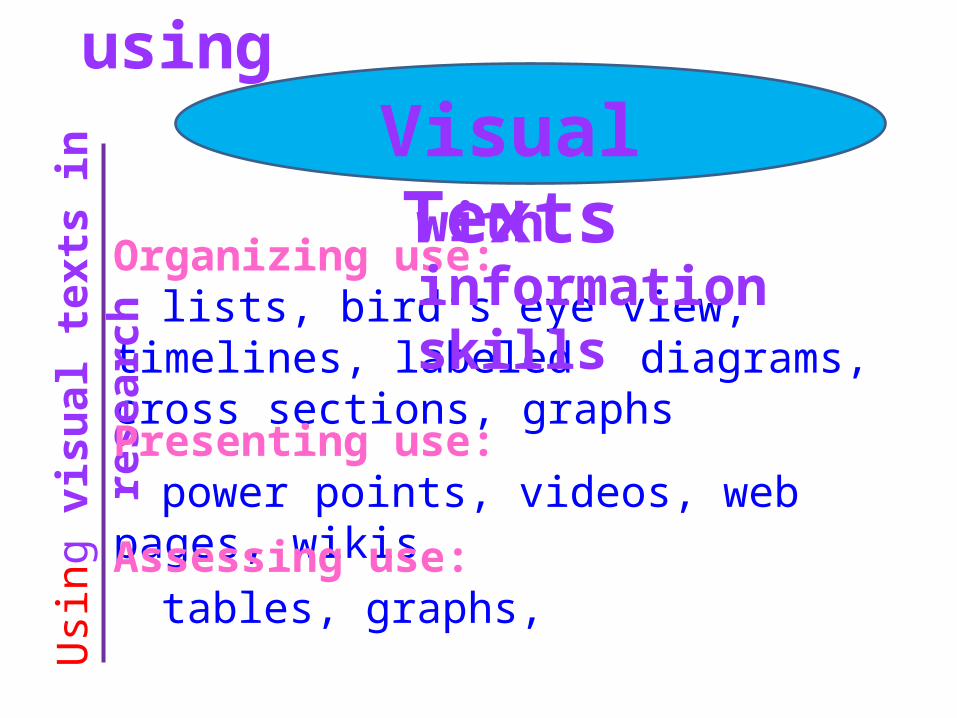
Organizing use: lists, bird’s eye view, timelines, labeled diagrams, cross sections, graphs
using
with information skills
Usi
ng v
isua
l tex
ts in
rese
arch
Presenting use:power points, videos, web pages, wikis
Assessing use:tables, graphs,
Visual Texts
How Will You Teach
And Use Visual Literacy in Your
Classroom?