Embed Size (px)
Citation preview

Table of Contents
UNITED STATESSECURITIES AND EXCHANGE COMMISSION
WASHINGTON, DC 20549 _______________________________________________________________________________________________________________________________________________________________________________________________________
FORM 10-Q(Mark One)
þ QUARTERLY REPORT PURSUANT TO SECTION 13 OR 15(d) OF THE SECURITIES EXCHANGE ACT OF 1934 For the quarterly period ended September 30, 2017
OR
o TRANSITION REPORT PURSUANT TO SECTION 13 OR 15(d) OF THE SECURITIES EXCHANGE ACT OF 1934 For the transition period from to
Commission file number 000-54799
HYSTER-YALE MATERIALS HANDLING, INC. (Exact name of registrant as specified in its charter) DELAWARE 31-1637659
(State or other jurisdiction ofincorporation or organization)
(I.R.S. Employer Identification No.)
5875 LANDERBROOK DRIVE,
SUITE 300, CLEVELAND, OHIO 44124-4069 (Address of principal executive offices) (Zip code) (440) 449-9600 (Registrant's telephone number, including area code) N/A
(Former name, former address and former fiscal year, if changed
since last report)
Indicate by check mark whether the registrant: (1) has filed all reports required to be filed by Section 13 or 15(d) of the Securities Exchange Act of 1934 during the preceding12 months (or for such shorter period that the registrant was required to file such reports), and (2) has been subject to such filing requirements for the past 90 days. YES þþNOo
Indicate by check mark whether the registrant has submitted electronically and posted on its corporate Web site, if any, every Interactive Data File required to be submitted andposted pursuant to Rule 405 of Regulation S-T (§ 232.405 of this chapter) during the preceding 12 months (or for such shorter period that the registrant was required to submitand post such files). YES þNO o Indicate by check mark whether the registrant is a large accelerated filer, an accelerated filer, a non-accelerated filer, a smaller reporting company, or an emerging growthcompany. See the definitions of “large accelerated filer,” “accelerated filer,” “smaller reporting company,” and "emerging growth company" in Rule 12b-2 of the Exchange Act.
Large accelerated filer þþ Accelerated filer o Non-accelerated filer o Smaller reporting company o Emerging growth company o
(Do not check if a smaller
reporting company)
If an emerging growth company, indicate by check mark if the registrant has elected not to use the extended transition period for complying with any new or revised financialaccounting standards provided pursuant to Section 13(a) of the Exchange Act. o
Indicate by check mark whether the registrant is a shell company (as defined in Rule 12b-2 of the Exchange Act). YES oNO þ
Number of shares of Class A Common Stock outstanding at October 27, 2017 : 12,561,017Number of shares of Class B Common Stock outstanding at October 27, 2017 : 3,901,303

HYSTER-YALE MATERIALS HANDLING, INC.TABLE OF CONTENTS
Page NumberPart I.
FINANCIALINFORMATION
Item 1 Financial Statements Unaudited Condensed Consolidated Balance Sheets 2 Unaudited Condensed Consolidated Statements of Operations 3 Unaudited Condensed Consolidated Statements of Comprehensive Income (Loss) 4 Unaudited Condensed Consolidated Statements of Cash Flows 5 Unaudited Condensed Consolidated Statements of Changes in Equity 6 Notes to Unaudited Condensed Consolidated Financial Statements 7 Item 2 Management's Discussion and Analysis of Financial Condition and Results of Operations 21 Item 3 Quantitative and Qualitative Disclosures About Market Risk 33 Item 4 Controls and Procedures 33 Part II.
OTHERINFORMATION
Item 1 Legal Proceedings 33 Item 1A Risk Factors 33 Item 2 Unregistered Sales of Equity Securities and Use of Proceeds 33 Item 3 Defaults Upon Senior Securities 33 Item 4 Mine Safety Disclosures 33 Item 5 Other Information 33 Item 6 Exhibits 34 Signatures 35
1

Table of Contents
PART IFINANCIAL INFORMATION
Item 1. Financial Statements
HYSTER-YALE MATERIALS HANDLING, INC. AND SUBSIDIARIESUNAUDITED CONDENSED CONSOLIDATED BALANCE SHEETS
SEPTEMBER 30
2017 DECEMBER 31
2016 (In millions, except share data)ASSETS Current Assets
Cash and cash equivalents $ 238.2 $ 43.2Accounts receivable, net 403.0 375.3Inventories, net 419.9 352.2Prepaid expenses and other 41.6 39.3
Total Current Assets 1,102.7 810.0Property, Plant and Equipment, Net 256.6 255.1Intangible Assets, Net 57.7 56.2Goodwill 57.4 50.7Deferred Income Taxes 35.1 43.9Investment in Unconsolidated Affiliates 59.0 45.9Other Non-current Assets 38.2 25.3
Total Assets $ 1,606.7 $ 1,287.1
LIABILITIES AND EQUITY Current Liabilities
Accounts payable $ 384.3 $ 242.4Accounts payable, affiliates 16.1 16.5Revolving credit facilities 4.9 79.0Current maturities of long-term debt 65.0 50.0Accrued payroll 44.2 43.7Accrued warranty obligations 28.9 27.8Other current liabilities 128.2 117.1
Total Current Liabilities 671.6 576.5Long-term Debt 224.2 82.2Self-insurance Liabilities 30.8 19.7Pension Obligations 24.5 37.2Deferred Income Taxes 12.6 11.4Other Long-term Liabilities 85.3 89.7
Total Liabilities 1,049.0 816.7Stockholders' Equity
Common stock: Class A, par value $0.01 per share, 12,548,549 shares outstanding (2016 - 12,466,463 sharesoutstanding) 0.1 0.1Class B, par value $0.01 per share, convertible into Class A on a one-for-one basis, 3,909,765 sharesoutstanding (2016 - 3,924,291 shares outstanding) 0.1 0.1
Capital in excess of par value 320.1 319.6Treasury stock (31.8) (36.9)Retained earnings 396.5 360.3Accumulated other comprehensive loss (134.6) (179.4)
Total Stockholders' Equity 550.4 463.8Noncontrolling Interests 7.3 6.6
Total Equity 557.7 470.4
Total Liabilities and Equity $ 1,606.7 $ 1,287.1
See notes to unaudited condensed consolidated financial statements.

2

Table of Contents
HYSTER-YALE MATERIALS HANDLING, INC. AND SUBSIDIARIESUNAUDITED CONDENSED CONSOLIDATED STATEMENTS OF OPERATIONS
THREE MONTHS ENDED NINE MONTHS ENDED
SEPTEMBER 30 SEPTEMBER 30
2017 2016 2017 2016 (In millions, except per share data)Revenues $ 691.1 $ 629.3 $ 2,089.7 $ 1,879.1Cost of sales 569.7 524.7 1,720.5 1,562.6Gross Profit 121.4 104.6 369.2 316.5Operating Expenses
Selling, general and administrative expenses 103.5 99.2 309.6 290.0Operating Profit 17.9 5.4 59.6 26.5Other (income) expense
Interest expense 6.2 1.9 10.6 5.0Income from unconsolidated affiliates (2.0) (1.8) (6.0) (4.8)Other (2.2) (1.6) (3.5) (1.3)
2.0 (1.5) 1.1 (1.1)Income Before Income Taxes 15.9 6.9 58.5 27.6Income tax provision (benefit) (0.8) (5.1) 7.3 (2.6)Net Income 16.7 12.0 51.2 30.2Net (income) loss attributable to noncontrolling interests (0.2) 0.3 (0.2) 0.4
Net Income Attributable to Stockholders $ 16.5 $ 12.3 $ 51.0 $ 30.6
Basic Earnings per Share $ 1.00 $ 0.75 $ 3.10 $ 1.87
Diluted Earnings per Share $ 1.00 $ 0.75 $ 3.09 $ 1.86
Dividends per Share $ 0.3025 $ 0.2950 $ 0.9000 $ 0.8750
Basic Weighted Average Shares Outstanding 16.457 16.385 16.442 16.371
Diluted Weighted Average Shares Outstanding 16.526 16.439 16.502 16.420
See notes to unaudited condensed consolidated financial statements.
3

Table of Contents
HYSTER-YALE MATERIALS HANDLING, INC. AND SUBSIDIARIESUNAUDITED CONDENSED CONSOLIDATED STATEMENTS OF COMPREHENSIVE INCOME (LOSS)
THREE MONTHS ENDED NINE MONTHS ENDED SEPTEMBER 30 SEPTEMBER 30
2017 2016 2017 2016 (In millions)Net Income $ 16.7 $ 12.0 $ 51.2 $ 30.2Other comprehensive income (loss) Foreign currency translation adjustment 10.0 3.7 30.5 18.3Unrealized gain on available-for-sale securities 1.4 — 2.8 —Current period cash flow hedging activity — (0.6) 7.0 4.9Reclassification of hedging activities into earnings 0.6 0.4 1.3 0.2Current period pension adjustment 1.1 — 1.1 —Reclassification of pension into earnings 0.7 0.5 2.1 1.5Comprehensive Income $ 30.5 $ 16.0 $ 96.0 $ 55.1Other comprehensive (income) loss attributable to noncontrolling interests Net (income) loss attributable to noncontrolling interests (0.2) 0.3 (0.2) 0.4Foreign currency translation adjustment attributable to noncontrolling interests (0.1) 0.9 (0.5) 1.9
Comprehensive Income Attributable to Stockholders $ 30.2 $ 17.2 $ 95.3 $ 57.4
See notes to unaudited condensed consolidated financial statements.
4

Table of Contents
HYSTER-YALE MATERIALS HANDLING, INC. AND SUBSIDIARIESUNAUDITED CONDENSED CONSOLIDATED STATEMENTS OF CASH FLOWS
NINE MONTHS ENDED SEPTEMBER 30 2017 2016 (In millions)Operating Activities
Net income $ 51.2 $ 30.2Adjustments to reconcile net income to net cash provided by operating activities:
Depreciation and amortization 31.7 28.7Amortization of deferred financing fees 1.0 0.8Deferred income taxes (5.1) (0.3)Stock-based compensation 5.6 4.0Dividends from unconsolidated affiliates 2.8 5.1Other non-current liabilities (12.9) (6.0)Other 3.1 (9.1)
Working capital changes, excluding the effect of business acquisitions: Accounts receivable (0.8) 17.3Inventories (52.7) (29.2)Other current assets 1.7 —Accounts payable 124.3 18.3Other current liabilities 7.4 (36.9)
Net cash provided by operating activities 157.3 22.9 Investing Activities
Expenditures for property, plant and equipment (25.1) (28.3)Proceeds from the sale of assets 1.1 9.5Investments in equity securities (5.6) —Business acquisitions, net of cash acquired (1.0) (107.7)
Net cash used for investing activities (30.6) (126.5) Financing Activities
Additions to long-term debt 246.2 24.8Reductions of long-term debt (50.7) (40.1)Net change to revolving credit agreements (112.6) 59.4Cash dividends paid (14.8) (14.3)Cash dividends paid to noncontrolling interest (0.3) (0.2)Financing fees paid (4.8) (1.6)Other (0.1) —
Net cash provided by financing activities 62.9 28.0
Effect of exchange rate changes on cash 5.4 5.3 Cash and Cash Equivalents Increase (decrease) for the period 195.0 (70.3)
Balance at the beginning of the period 43.2 155.1
Balance at the end of the period $ 238.2 $ 84.8
See notes to unaudited condensed consolidated financial statements.
5

Table of Contents
HYSTER-YALE MATERIALS HANDLING, INC. AND SUBSIDIARIESUNAUDITED CONDENSED CONSOLIDATED STATEMENTS OF CHANGES IN EQUITY
Accumulated Other Comprehensive Income
(Loss)
Class ACommon
Stock
Class BCommon
StockTreasury
Stock
Capitalin
Excessof ParValue
RetainedEarnings
ForeignCurrency
TranslationAdjustment
DeferredGain on
AFSSecurities
DeferredGain
(Loss) onCash FlowHedging
PensionAdjustment
TotalStockholders'
EquityNoncontrolling
InterestsTotal
Equity (In millions)
Balance, January 1, 2016 $ 0.1 $ 0.1 $ (42.5) $ 320.3 $ 336.7 $ (90.1) $ — $ (4.0) $ (59.8) $ 460.8 $ 1.9 $462.7Stock-based compensation — — — 4.0 — — — — — 4.0 — 4.0Stock issued under stockcompensation plans — — 5.3 (5.3) — — — — — — — —
Net income (loss) — — — — 30.6 — — — — 30.6 (0.4) 30.2Cash dividends on commonstock — — — — (14.3) — — — — (14.3) — (14.3)Current period othercomprehensive income — — — — — 18.3 — 4.9 — 23.2 — 23.2Reclassification adjustmentto net income — — — — — — — 0.2 1.5 1.7 — 1.7
Acquisition of Bolzoni — — — — — — — — — — 69.8 69.8Purchase of noncontrollinginterest — — — — — — — — — — (62.2) (62.2)Cash dividends paid tononcontrolling interest — — — — — — — — — — (0.2) (0.2)Foreign currency translationon noncontrolling interest — — — — — — — — — — (1.9) (1.9)
Balance, September 30, 2016 $ 0.1 $ 0.1 $ (37.2) $ 319.0 $ 353.0 $ (71.8) $ — $ 1.1 $ (58.3) $ 506.0 $ 7.0 $513.0
Balance, January 1, 2017 $ 0.1 $ 0.1 $ (36.9) $ 319.6 $ 360.3 $ (92.0) $ — $ (12.2) $ (75.2) $ 463.8 $ 6.6 $470.4
Stock-based compensation — — — 5.6 — — — — — 5.6 — 5.6Stock issued under stockcompensation plans — — 5.1 (5.1) — — — — — — — —
Net income (loss) — — — — 51.0 — — — — 51.0 0.2 51.2Cash dividends on commonstock — — — — (14.8) — — — — (14.8) — (14.8)Current period othercomprehensive income — — — — — 30.5 2.8 7.0 1.1 41.4 — 41.4Reclassification adjustmentto net income — — — — — — — 1.3 2.1 3.4 — 3.4
Acquisition of business — — — — — — — — — — 0.3 0.3Cash dividends paid tononcontrolling interest — — — — — — — — — (0.3) (0.3)Foreign currency translationon noncontrolling interest — — — — — — — — — — 0.5 0.5
Balance, September 30, 2017 $ 0.1 $ 0.1 $ (31.8) $ 320.1 $ 396.5 $ (61.5) $ 2.8 $ (3.9) $ (72.0) $ 550.4 $ 7.3 $557.7
See notes to unaudited condensed consolidated financial statements.
6

Table of Contents
HYSTER-YALE MATERIALS HANDLING, INC. AND SUBSIDIARIESNOTES TO UNAUDITED CONDENSED CONSOLIDATED FINANCIAL STATEMENTS
SEPTEMBER 30, 2017(Tabular Amounts in Millions, Except Per Share and Percentage Data)
Note 1—Basis of Presentation
The accompanying unaudited condensed consolidated financial statements include the accounts of Hyster-Yale Materials Handling, Inc., a Delaware corporation,and the accounts of Hyster-Yale's wholly owned domestic and international subsidiaries and majority-owned joint ventures (collectively, "Hyster-Yale" or the"Company"). All intercompany accounts and transactions among the consolidated companies are eliminated in consolidation. The Company, through its wholly owned operating subsidiary, Hyster-Yale Group, Inc. ("HYG"), designs, engineers, manufactures, sells and services acomprehensive line of lift trucks and aftermarket parts marketed globally primarily under the Hyster ® and Yale ® brand names, mainly to independent Hyster ® andYale ® retail dealerships. Lift trucks and component parts are manufactured in the United States, Northern Ireland, Mexico, Italy, the Netherlands, Vietnam, Japan,the Philippines, Brazil and China.
The Company also operates Bolzoni S.p.A. ("Bolzoni"). Bolzoni is a leading worldwide producer of attachments, forks and lift tables marketed under the BolzoniAuramo ® and Meyer ® brand names. Bolzoni products are manufactured in Italy, China, Germany, Finland and the United States. Through the design, productionand distribution of a wide range of attachments, Bolzoni has a strong presence in the market niche of lift-truck attachments and industrial material handling.
The Company also operates Nuvera Fuel Cells, LLC ("Nuvera"). Nuvera is an alternative-power technology company focused on fuel-cell stacks and engines.Nuvera also supports on-site hydrogen production and dispensing systems that are designed to deliver clean energy solutions to customers.
Investments in Sumitomo NACCO Forklift Co., Ltd. (“SN”), a 50% -owned joint venture, and HYG Financial Services, Inc. ("HYGFS"), a 20% -owned jointventure, are accounted for by the equity method. SN operates manufacturing facilities in Japan, the Philippines and Vietnam from which the Company purchasescertain components, service parts and lift trucks. Sumitomo Heavy Industries, Ltd. ("Sumitomo") owns the remaining 50% interest in SN. Each stockholder of SNis entitled to appoint directors representing 50% of the vote of SN’s board of directors. All matters related to policies and programs of operation, manufacturingand sales activities require mutual agreement between the Company and Sumitomo prior to a vote of SN’s board of directors. HYGFS is a joint venture with WellsFargo Financial Leasing, Inc. (“WF”), formed primarily for the purpose of providing financial services to independent Hyster ® and Yale ® lift truck dealers andNational Account customers in the United States. National Account customers are large customers with centralized purchasing and geographically dispersedoperations in multiple dealer territories. The Company’s percentage share of the net income or loss from these equity investments is reported on the line “Incomefrom unconsolidated affiliates” in the “Other (income) expense” portion of the unaudited condensed consolidated statements of operations.
These financial statements have been prepared in accordance with U.S. generally accepted accounting principles for interim financial information and theinstructions to Form 10-Q and Article 10 of Regulation S-X. Accordingly, they do not include all of the information and footnotes required by U.S. generallyaccepted accounting principles for complete financial statements. In the opinion of management, all adjustments (consisting of normal recurring accruals)considered necessary for a fair presentation of the financial position of the Company as of September 30, 2017 and the results of its operations for the three andnine months ended September 30, 2017 and 2016 and the results of its cash flows and changes in equity for the nine months ended September 30, 2017 and 2016have been included. These unaudited condensed consolidated financial statements should be read in conjunction with the audited consolidated financial statementsand notes thereto included in the Company's Annual Report on Form 10-K for the year ended December 31, 2016 .
The accompanying unaudited condensed consolidated balance sheet at December 31, 2016 has been derived from the audited financial statements at that date butdoes not include all of the information or notes required by U.S. generally accepted accounting principles for complete financial statements.
7

Table of Contents
Note 2—Recently Issued Accounting Standards
The following table provides a brief description of recent accounting pronouncements adopted January 1, 2017. The adoption of these standards did not have amaterial effect on the Company's financial position, results of operations, cash flows or related disclosures.
Standard DescriptionASU No. 2015-11, Inventory (Topic 330): Simplifying the Measurement ofInventory
The guidance requires inventory to be measured at the lower of cost or net realizable value. Theguidance defines net realizable value as the estimated selling price in the ordinary course ofbusiness, less reasonably predictable costs of completion, disposal and transportation.
ASU No. 2016-05, Derivatives and Hedging (Topic 815): Effect ofDerivative Contract Novations on Existing Hedge Accounting Relationships
The guidance clarifies that a change in the counterparty to a derivative instrument that has beendesignated as the hedging instrument does not, in and of itself, require dedesignation of thathedging relationship, provided that all other hedge accounting criteria continue to be met.
ASU No. 2016-07, Investments - Equity Method and Joint Ventures (Topic323)
The guidance eliminates the requirement that an entity retroactively adopt the equity method ofaccounting if an investment qualifies for use of the equity method as a result of an increase inthe level of ownership or degree of influence. In addition, the guidance requires that the equitymethod investor add the cost of acquiring the additional interest in the investee to the currentbasis of the investor’s previously held interest and adopt the equity method of accounting as ofthe date the investment becomes qualified for equity method accounting.
ASU No. 2016-09, Stock Compensation (Topic 718): Improvements toEmployee Share-Based Payment Accounting
The guidance simplifies several aspects of the accounting for employee share-based paymenttransactions, including the income tax consequences, classification of awards as either equity orliabilities, and classification on the statement of cash flows.
The following table provides a brief description of recent accounting pronouncements not yet adopted:
Standard Description Required Date of
Adoption Effect on the financial statements or other
significant mattersASU No. 2014-09, Revenuefrom Contracts withCustomers (Topic 606)(Subsequent ASUs have beenissued in 2015, 2016 and 2017to update or clarify thisguidance)
The new guidance is based on the principle that revenue is recognizedto depict the transfer of goods or services to customers in an amountthat reflects the consideration to which the entity expects to beentitled in exchange for those goods or services. The new guidancealso requires additional disclosures about the nature, amount, timingand uncertainty of revenue and cash flows arising from customercontracts, including significant judgments and changes in judgmentsand assets recognized from costs incurred to obtain or fulfill acontract.
January 1, 2018
The Company's evaluation process of the newstandard includes, but is not limited to,identifying contracts and revenue streams withinthe scope of the guidance, reviewing anddocumenting the accounting and identifying anddetermining the accounting for any relatedcontract costs. The Company continues todocument this evaluation and has begun toimplement processes and controls for certainrevenue streams as warranted by the guidance.The Company's evaluation of revenue streamsand contracts at Bolzoni will continue in thefourth quarter of 2017. The Company plans toadopt the standard for the first quarter of 2018using the modified retrospective approach andexpects to record a cumulative adjustment toequity for open contracts as of January 1, 2018.At this time, the Company does not expect theimpact of the standard on its financialstatements, business processes and internalcontrols over financial reporting to be material.In addition, the standard requires newdisclosures which the Company continues toevaluate, and which will first be required in theCompany's March 31, 2018 Quarterly Report onForm 10-Q.
8

Table of Contents
Standard Description Required Date of
Adoption Effect on the financial statements or other
significant mattersASU No. 2016-01, FinancialInstruments-Overall (Subtopic825-10): Recognition andMeasurement of FinancialAssets and FinancialLiabilities
The guidance requires equity investments previously accounted forunder the cost method of accounting to be measured at fair value andrecognized in net income. In addition, the guidance definesmeasurement and presentation of financial instruments.
January 1, 2018
The Company anticipates the adoption willincrease the volatility of other (income) expenseas a result of applying the guidance. TheCompany expects to record a cumulativeadjustment to equity for deferred gains or lossesrelated to an equity investment in a third-partyas of January 1, 2018. Subsequent changes inthe fair value of this investment will berecognized directly in earnings.
ASU No. 2016-15, Statementof Cash Flows (Topic 230):Classification of Certain CashReceipts and Cash Payments
The guidance clarifies the classification of certain types of cashreceipts and cash payments. In addition, the guidance provides for theapplication of the predominance principle when certain cash receiptsand payments have aspects of more than one class of cash flows.
January 1, 2018
The Company does not expect the adoption ofthe guidance to have a material effect on itsfinancial position, results of operations, cashflows or related disclosures.
ASU No. 2016-16, IncomeTaxes (Topic 740)
The guidance allows for recognition of current and deferred incometaxes for an intra-entity transfer of an asset other than inventory. Theguidance allows for more accurate representation of the economics ofan intra-entity asset transfer which will require income taxconsequences of the transfer, including income taxes payable or paid.
January 1, 2018
The Company does not expect the adoption ofthe guidance to have a material effect on itsfinancial position, results of operations, cashflows or related disclosures.
ASU No. 2016-18, Statementof Cash Flows (Topic 230):Restricted Cash
The guidance requires that a statement of cash flows explain thechange during the period in the total of cash, cash equivalents, andamounts generally described as restricted cash or restricted cashequivalents.
January 1, 2018
The Company does not expect the adoption ofthe guidance to have a material effect on itsfinancial position, results of operations, cashflows or related disclosures.
ASU No. 2017-01, BusinessCombinations (Topic 805):Clarifying the Definition of aBusiness
The guidance clarifies the definition of a business to assist entities inevaluating whether transactions should be accounted for asacquisitions or disposals of businesses.
January 1, 2018
The Company does not expect the adoption ofthe guidance to have a material effect on itsfinancial position, results of operations, cashflows or related disclosures.
ASU 2017-05, Other Income –Gains and Losses from theDerecognition of NonfinancialAssets (Subtopic 610-20):Clarifying the Scope of AssetDerecognition
The guidance clarifies the scope and accounting of a financial assetthat meets the definition of an "in-substance nonfinancial asset" anddefines the term, "in-substance nonfinancial asset," in addition topartial sales of nonfinancial assets.
January 1, 2018
The Company does not expect the adoption ofthe guidance to have a material effect on itsfinancial position, results of operations, cashflows or related disclosures.
ASU 2017-07, Compensation— Retirement Benefits (Topic715): Improving thePresentation of Net PeriodicPension Cost and Net PeriodicPostretirement
The guidance requires that an employer report the service costcomponent in the same line item or items as other compensation costsarising from services rendered by the pertinent employees during theperiod. The other components of net benefit cost are required to bepresented in the income statement separately from the service costcomponent and outside a subtotal of income from operations.
January 1, 2018
The Company expects to present thecomponents of net benefit cost, other thanservice cost, in other (income) expense for itsU.S. and non-U.S. pension plans as of January1, 2018. Service cost for the Company's U.S.and non-U.S. pension plans will continue to bereported in operating profit.
9

Table of Contents
Standard Description Required Date of
Adoption Effect on the financial statements or other
significant mattersASU No. 2016-02, Leases(Topic 842)(Subsequent ASUshave been issued in 2017 toupdate or clarify this guidance)
The guidance requires lessees (with the exception of short-termleases) to recognize, at the commencement date, a lease liability,which is a lessee's obligation to make lease payments arising from alease, measured on a discounted basis; and a right-of-use asset, whichis an asset that represents the lessee’s right to use, or control the useof, a specified asset for the lease term.
January 1, 2019
The Company's evaluation process of the newstandard includes, but is not limited to,evaluating its current lease portfolio, identifyingrelevant contracts and attributes affected by thestandard and determining the requiredaccounting upon adoption. In addition, theCompany expects to implement new processesand controls regarding asset financingtransactions and financial reporting. TheCompany continues to evaluate its globalleasing portfolio and has initiated training ofrelevant personnel. This evaluation willcontinue in the fourth quarter of 2017 andthroughout 2018. While the Company'sevaluation of the alternative methods ofadoption and the effect on its financial position,results of operations, cash flows and relateddisclosures is ongoing; the Company anticipatesthe adoption will materially affect theconsolidated balance sheets and will requirechanges to the Company's systems andprocesses.
ASU 2017-12, Derivatives andHedging (Topic 815):Targeted Improvements toAccounting for HedgingActivities
The guidance makes targeted changes to the hedge accounting modelintended to facilitate financial reporting that more closely reflects anentity’s risk management activities and to simplify the application ofhedge accounting. Changes include expanding the types of riskmanagement strategies eligible for hedge accounting, easing thedocumentation and effectiveness assessment requirements, changinghow ineffectiveness is measured and changing the presentation anddisclosure requirements for hedge accounting activities.
January 1, 2019
The Company is currently evaluating theadoption and the effect on its financial position,results of operations, cash flows and relateddisclosures.
ASU No. 2016-13, FinancialInstruments-Credit Losses(Topic 326)
The guidance eliminates the probable initial recognition threshold andrequires an entity to reflect its current estimate of all expected creditlosses. The guidance also requires additional disclosures in certaincircumstances.
January 1, 2020
The Company is currently evaluating thealternative methods of adoption and the effecton its financial position, results of operations,cash flows and related disclosures.
ASU No. 2017-04, Intangibles- Goodwill and Other (Topic350): Simplifying the Test forGoodwill Impairment
The guidance removes the second step of the two-step test for themeasurement of goodwill impairment. The guidance allows for earlyadoption for impairment testing dates after January 1, 2017.
January 1, 2020
The Company is currently evaluating the timingof adoption and the effect on its currentimpairment testing process.
Note 3—Business Segments
The Company’s reportable segments for the lift truck business include the following three management units: the Americas, EMEA and JAPIC. Americas includesoperations in the United States, Canada, Mexico, Brazil, Latin America and its corporate headquarters. EMEA includes operations in Europe, the Middle East andAfrica. JAPIC includes operations in the Asia and Pacific regions, including China, as well as the equity earnings of SN operations. Certain amounts are allocatedto these geographic management units and are included in the segment results presented below, including product development costs, corporate headquarter'sexpenses and certain information technology infrastructure costs. These allocations among geographic management units are determined by senior managementand not directly incurred by the geographic operations. In addition, other costs are incurred directly by these geographic management units based upon the locationof the manufacturing plant or sales units, including manufacturing variances, product liability, warranty and sales discounts, which may not be associated with thegeographic management unit of the ultimate end user sales location where revenues and margins are reported. Therefore, the reported results of each segment forthe lift truck business cannot be considered stand-alone entities as all segments are inter-related and integrate into a single global lift truck business.
The Company reports the results of both Bolzoni and Nuvera as separate segments. Intercompany sales between Nuvera, Bolzoni and the lift truck business havebeen eliminated. Bolzoni was acquired on April 1, 2016 and its results of operations have been included since the acquisition date.
10

Table of Contents
Financial information for each reportable segment is presented in the following table:
THREE MONTHS ENDED NINE MONTHS ENDED
SEPTEMBER 30 SEPTEMBER 30
2017 2016 2017 2016
Revenues from external customers Americas $ 447.8 $ 410.7 $ 1,346.7 $ 1,241.9EMEA 165.6 138.0 500.6 441.5JAPIC 38.9 46.2 124.9 125.0
Lift truck business 652.3 594.9 1,972.2 1,808.4Bolzoni 44.3 36.2 127.8 75.1Nuvera 0.3 1.4 3.3 1.9
Eliminations (5.8) (3.2) (13.6) (6.3)
Total $ 691.1 $ 629.3 $ 2,089.7 $ 1,879.1
Gross profit (loss) Americas $ 83.6 $ 72.8 $ 251.2 $ 217.8EMEA 20.5 18.7 66.6 65.1JAPIC 4.4 4.2 14.1 12.9
Lift truck business 108.5 95.7 331.9 295.8Bolzoni 13.5 9.2 39.7 22.0Nuvera (0.4) (0.3) (1.9) (1.3)
Eliminations (0.2) — (0.5) —
Total $ 121.4 $ 104.6 $ 369.2 $ 316.5
Operating profit (loss) Americas $ 27.8 $ 23.4 $ 85.5 $ 55.1EMEA (1.1) (1.4) 3.3 4.2JAPIC (2.6) (1.5) (5.5) (4.0)
Lift truck business 24.1 20.5 83.3 55.3Bolzoni 2.1 (2.5) 4.9 (1.8)Nuvera (8.1) (12.6) (28.1) (27.0)
Eliminations (0.2) — (0.5) —
Total $ 17.9 $ 5.4 $ 59.6 $ 26.5
Net income (loss) attributable to stockholders Americas $ 22.7 $ 20.2 $ 67.0 $ 43.2EMEA (1.7) 1.9 1.6 6.4JAPIC (1.3) (0.2) (2.8) (0.9)
Lift truck business 19.7 21.9 65.8 48.7Bolzoni 1.9 (2.0) 3.3 (1.9)Nuvera (4.9) (7.6) (16.9) (16.2)
Eliminations (0.2) — (1.2) —
Total $ 16.5 $ 12.3 $ 51.0 $ 30.6
Note 4—Income Taxes
The income tax provision includes U.S. federal, state and local, and foreign income taxes and is based on the application of aforecasted annual income tax rate applied to the current quarter's year-to-date pre-tax income or loss. In determining theestimated annual effective income tax rate, the Company analyzes various factors, including projections of the Company'sannual earnings, taxing jurisdictions in which the earnings will be generated, the impact of state and local income taxes, theCompany's ability to use tax credits and net operating loss carryforwards and capital loss carryforwards, and available tax planning alternatives. Discrete items,including the effect of changes in tax laws, tax rates and certain circumstances with respect to valuation allowances or the tax effect of other unusual or non-recurring transactions or adjustments are reflected in
11

Table of Contents
the period in which they occur as an addition to, or reduction from, the income tax provision, rather than included in the estimated effective annual income tax rate.Additionally, the Company's interim effective income tax rate is computed and applied without regard to pre-tax losses where such losses are not expected togenerate a current-year tax benefit, as reflected in the interim adjustment line in the table below.
A reconciliation of the consolidated federal statutory to reported income tax rate is as follows:
THREE MONTHS ENDED NINE MONTHS ENDED SEPTEMBER 30 SEPTEMBER 30
2017 2016 2017 2016Income before income taxes $ 15.9 $ 6.9 $ 58.5 $ 27.6Statutory taxes at 35% $ 5.6 $ 2.4 $ 20.5 $ 9.7Interim adjustment (0.1) — 0.2 —Permanent adjustments:
Non-U.S. rate differences (1.9) (1.9) (6.7) (4.6)Equity interest earnings (0.4) (0.4) (1.8) (1.1)Valuation allowance 1.0 0.5 2.2 1.0Federal tax credits (0.3) (0.6) (1.4) (1.1)State income taxes 0.3 (0.1) 0.8 0.1Other (0.1) 0.1 0.2 0.3
$ (1.4) $ (2.4) $ (6.7) $ (5.4)Discrete items $ (4.9) $ (5.1) $ (6.7) $ (6.9)Income tax provision $ (0.8) $ (5.1) $ 7.3 $ (2.6)Reported income tax rate (5.0)% (73.9)% 12.5% (9.4)%
During the third quarter of 2017, the Company settled various federal obligations in Brazil through the utilization of its federal net operating loss carryforwards forwhich a valuation allowance was previously provided. As a result of the utilization of deferred tax assets, the Company released the associated valuation allowancepreviously provided of $4.7 million .
In addition, during the first nine months of 2017, the Company recognized a net discrete tax benefit of $4.4 million from an internal sale of a subsidiary betweenconsolidated companies resulting in the repatriation of non-U.S. accumulated earnings taxed at higher rates, partially offset by a $1.6 million valuation allowanceprovided against deferred tax assets in China where the Company has determined that such deferred tax assets no longer meet the more likely than not standard forrealization.
During the third quarter of 2016, the Company received a notice from the Italian Tax Authority approving the transfer of certain tax losses as part of an internalrestructuring. As a result, the Company believed it is more likely than not that deferred tax assets for such losses of approximately $3.2 million will be realized inthe foreseeable future and released the valuation allowance previously provided. In addition, the Company recognized a discrete tax benefit of $2.0 million , relatedto provision-to-return items, primarily for a U.S. tax benefit for manufacturing activities, adjustments for certain foreign earnings and repatriations, and theresearch and development credit.
Other discrete items during the first nine months of 2016 include a discrete tax benefit of $4.0 million . As a result of the acquisition of Bolzoni, the Companychanged its previous reinvestment assertion; consequently, all of the earnings of its European operations were considered permanently reinvested and thepreviously provided deferred tax liability was no longer required. In addition, the Company recognized a discrete tax expense of $1.6 million in the first ninemonths of 2016 related to non-deductible acquisition expenses.
12

Table of Contents
Note 5—Reclassifications from OCI
The following table summarizes reclassifications out of accumulated other comprehensive income (loss) ("OCI") as recorded in the unaudited condensedconsolidated statements of operations:
Details about OCI Components Amount Reclassified from OCI Affected Line Item in the Statement Where
Net Income Is Presented
THREE MONTHS ENDED NINE MONTHS ENDED SEPTEMBER 30 SEPTEMBER 30 2017 2016 2017 2016 Gain (loss) on cash flow hedges:
Foreign exchange contracts $ (0.5) $ (0.9) $ (2.0) $ (1.8) Cost of salesTotal before tax (0.5) (0.9) (2.0) (1.8) Income before income taxesTax benefit (0.1) 0.5 0.7 1.6 Income tax provision (benefit)
Net of tax $ (0.6) $ (0.4) $ (1.3) $ (0.2) Net income
Amortization of defined benefit pension items: Actuarial loss $ (1.1) $ (0.7) $ (3.3) $ (2.3) (a)Prior service credit — — 0.2 0.2 (a)
Total before tax (1.1) (0.7) (3.1) (2.1) Income before income taxesTax benefit 0.4 0.2 1.0 0.6 Income tax provision (benefit)Net of tax $ (0.7) $ (0.5) $ (2.1) $ (1.5) Net income
Total reclassifications for the period $ (1.3) $ (0.9) $ (3.4) $ (1.7) (a) These OCI components are included in the computation of net pension cost (see Note 7 for additional details).
Note 6—Financial Instruments and Derivative Financial Instruments
Financial Instruments
The carrying amounts of cash and cash equivalents, accounts receivable and accounts payable approximate fair value due to the short-term maturities of theseinstruments. The fair values of revolving credit agreements and long-term debt, excluding capital leases, were determined using current rates offered for similarobligations taking into account company credit risk. This valuation methodology is Level 2 as defined in the fair value hierarchy. At September 30, 2017 , the fairvalue and book value of revolving credit agreements and long-term debt, excluding capital leases, was $274.6 million and $272.5 million , respectively. AtDecember 31, 2016 , the fair value and book value of revolving credit agreements and long-term debt, excluding capital leases, was $184.5 million .
Derivative Financial Instruments
The Company uses forward foreign currency exchange contracts to partially reduce risks related to transactions denominated in foreign currencies. These contractshedge firm commitments and forecasted transactions relating to cash flows associated with sales and purchases denominated in non-functional currencies. TheCompany offsets fair value amounts related to foreign currency exchange contracts executed with the same counterparty. Changes in the fair value of forwardforeign currency exchange contracts that are effective as hedges are recorded in OCI. Deferred gains or losses are reclassified from OCI to the unauditedcondensed consolidated statements of operations in the same period as the gains or losses from the underlying transactions are recorded and are generallyrecognized in cost of sales. The ineffective portion of derivatives that are classified as hedges is immediately recognized in earnings and is also generallyrecognized in cost of sales.
The Company periodically enters into foreign currency exchange contracts that do not meet the criteria for hedge accounting. These derivatives are used to reducethe Company's exposure to foreign currency risk related to forecasted purchase or sales transactions or forecasted intercompany cash payments or settlements.Gains and losses on these derivatives are generally recognized in cost of sales.
The Company periodically enters into forward foreign currency contracts that are designated as net investment hedges of the Company's net investment in itsforeign subsidiaries. For derivative instruments that are designated and qualified as a hedge of a net investment in foreign currency, the gain or loss is reported inother comprehensive income as part of the cumulative
13

Table of Contents
translation adjustment to the extent it is effective. The Company utilizes the forward-rate method of assessing hedge effectiveness. Any ineffective portion of netinvestment hedges would be recognized in the unaudited condensed consolidated statement of operations in the same period as the change.
During 2017, the Company entered into cross-currency swaps which hedge the variability of expected future cash flows that are attributable to foreign currencyrisk of certain intercompany loans. These agreements include initial and final exchanges of principal and associated interest payments from fixed euro denominatedto fixed U.S.-denominated amounts. Changes in the fair value of cross-currency swaps that are effective as hedges are recorded in OCI. Deferred gains or lossesare reclassified from OCI to the unaudited condensed consolidated statements of operations in the same period as the gains or losses from the underlyingtransactions are recorded and are generally recognized in other (income) expense and interest expense. The ineffective portion of derivatives that are classified ashedges is immediately recognized in earnings and is also generally recognized in other (income) expense.
The Company uses interest rate swap agreements to partially reduce risks related to floating rate financing agreements that are subject to changes in the market rateof interest. Terms of the interest rate swap agreements require the Company to receive a variable interest rate and pay a fixed interest rate. The Company's interestrate swap agreements and its variable rate financings are predominately based upon the one or three-month LIBOR. Changes in the fair value of interest rate swapagreements that are effective as hedges are recorded in OCI. Deferred gains or losses are reclassified from OCI to the unaudited condensed consolidated statementsof operations in the same period as the gains or losses from the underlying transactions are recorded and are generally recognized in interest expense. Theineffective portion of derivatives that are classified as hedges is immediately recognized in earnings and included on the line "Other" in the "Other (income)expense" section of the unaudited condensed consolidated statements of operations.
Cash flows from hedging activities are reported in the unaudited condensed consolidated statements of cash flows with the same classification as the hedged item,generally as a component of cash flows from operations.
The Company measures its derivatives at fair value on a recurring basis using significant observable inputs. This valuation methodology is Level 2 as defined inthe fair value hierarchy. The Company uses a present value technique that incorporates yield curves and foreign currency spot rates to value its derivatives and alsoincorporates the effect of the Company's and its counterparties' credit risk into the valuation.
The Company does not currently hold any nonderivative instruments designated as hedges or any derivatives designated as fair value hedges.
Foreign Currency Derivatives: The Company held forward foreign currency exchange contracts with total notional amounts of $ 850.7 million at September 30,2017 , primarily denominated in euros, U.S. dollars, Japanese yen, British pounds, Swedish kroner and Mexican pesos. The Company held forward foreigncurrency exchange contracts with total notional amounts of $ 592.9 million at December 31, 2016 , primarily denominated in euros, U.S. dollars, Japanese yen,British pounds, Swedish kroner and Mexican pesos. The fair value of these contracts approximated a net liability of $ 7.3 million and $ 22.7 million atSeptember 30, 2017 and December 31, 2016 , respectively.
Forward foreign currency exchange contracts that qualify for hedge accounting are generally used to hedge transactions expected to occur within the next 36months. The mark-to-market effect of forward foreign currency exchange contracts that are considered effective as hedges has been included in OCI. Based onmarket valuations at September 30, 2017 , $ 1.9 million of the amount of net deferred loss included in OCI at September 30, 2017 is expected to be reclassified as aloss into the unaudited condensed consolidated statement of operations over the next twelve months, as the transactions occur.
Interest Rate Derivatives: The Company holds certain contracts that hedge interest payments on the Term Loan borrowings and one and three-month LIBORborrowings. The following table summarizes the notional amounts, related rates, excluding spreads, and remaining terms of interest rate swap agreements atSeptember 30, 2017 and December 31, 2016 :
Notional Amount Average Fixed Rate
September 30 December 31 September 30 December 31
2017 2016 2017 2016 Term at September 30, 2017
$ 100.0 $ 100.0 1.47% 1.47% Extending to December 201856.5 — 1.94% —% November 2017 to November 202283.5 — 2.20% —% December 2018 to May 2023
14

Table of Contents
The Company does not apply hedge accounting to the interest rate derivatives which expire December 2018. The fair value of all interest rate swap agreements wasa net liability of $0.7 million and $ 0.3 million at September 30, 2017 and December 31, 2016 , respectively. The mark-to-market effect of interest rate swapagreements that are considered effective as hedges has been included in OCI. Based on market valuations at September 30, 2017 , $0.1 million of the amountincluded in OCI is expected to be reclassified as expense in the unaudited condensed consolidated statement of operations over the next twelve months, as cashflow payments are made in accordance with the interest rate swap agreements.
The following table summarizes the fair value of derivative instruments reflected on a gross basis by contract as recorded in the unaudited condensed consolidatedbalance sheets:
Asset Derivatives Liability Derivatives
Balance Sheet Location SEPTEMBER 30
2017 DECEMBER 31
2016 Balance Sheet Location SEPTEMBER 30
2017 DECEMBER 31
2016Derivatives designated as hedginginstruments Cash Flow Hedges
Interest rate swap agreements Current Other current liabilities $ — $ — Other current liabilities $ 0.2 $ —
Long-term Other long-term liabilities — — Other long-term liabilities 0.4 —
Foreign currency exchange contracts Current Prepaid expenses and other 2.9 $ — Prepaid expenses and other 0.7 $ —
Other current liabilities 6.5 3.7 Other current liabilities 7.5 14.0Long-term Other non-current assets 4.3 — Other non-current assets 1.1 —
Other long-term liabilities 0.3 — Other long-term liabilities 6.3 10.1Total derivatives designated as hedginginstruments $ 14.0 $ 3.7 $ 16.2 $ 24.1Derivatives not designated as hedginginstruments Cash Flow Hedges
Interest rate swap agreements Current Other current liabilities $ 0.1 $ — Other current liabilities $ — $ 0.3Long-term Other non-current assets 0.1 0.2 Other non-current assets — —
Other long-term liabilities — — Other long-term liabilities 0.3 0.2
Foreign currency exchange contracts Current Prepaid expenses and other — — Prepaid expenses and other — —
Other current liabilities 0.6 1.6 Other current liabilities 6.3 3.9Total derivatives not designated as hedginginstruments $ 0.8 $ 1.8 $ 6.6 $ 4.4
Total derivatives $ 14.8 $ 5.5 $ 22.8 $ 28.5
15

Table of Contents
The following table summarizes the offsetting of the fair value of derivative instruments on a gross basis by counterparty as recorded in the unaudited condensedconsolidated balance sheets:
Derivative Assets as of September 30, 2017 Derivative Liabilities as of September 30, 2017
Gross Amountsof Recognized
Assets
GrossAmounts
Offset Net Amounts
Presented Net Amount
Gross Amountsof Recognized
Liabilities
GrossAmounts
Offset Net Amounts
Presented Net Amount
Cash Flow Hedges
Interest rate swap agreements $ 0.1 $ (0.1) $ — $ — $ 0.8 $ (0.1) $ 0.7 $ 0.7Foreign currency exchangecontracts 5.4 (5.4) — — 12.7 (5.4) 7.3 7.3
Total derivatives $ 5.5 $ (5.5) $ — $ — $ 13.5 $ (5.5) $ 8.0 $ 8.0
Derivative Assets as of December 31, 2016 Derivative Liabilities as of December 31, 2016
Gross Amountsof Recognized
Assets Gross Amounts
Offset Net AmountsPresented Net Amount
Gross Amounts ofRecognizedLiabilities
Gross AmountsOffset
Net AmountsPresented Net Amount
Cash Flow Hedges
Interest rate swap agreements $ 0.2 $ (0.2) $ — $ — $ 0.5 $ (0.2) $ 0.3 $ 0.3Foreign currency exchangecontracts — — — — 22.7 — 22.7 22.7
Total derivatives $ 0.2 $ (0.2) $ — $ — $ 23.2 $ (0.2) $ 23.0 $ 23.0
The following table summarizes the pre-tax impact of derivative instruments as recorded in the unaudited condensed consolidated statements of operations:
Amount of Gain or (Loss) Recognized in OCIon Derivative (Effective Portion)
Location of Gain or(Loss) Reclassified
from OCI into Income(Effective Portion) Amount of Gain or (Loss) Reclassified
from OCI into Income (Effective Portion)
Location of Gain or(Loss) Recognized inIncome on Derivative(Ineffective Portion
and Amount Excludedfrom Effectiveness
Testing)
Amount of Gain or (Loss) Recognized inIncome on Derivative (Ineffective Portionand Amount Excluded from Effectiveness
Testing)
THREEMONTHSENDED
NINE MONTHSENDED
THREEMONTHSENDED
NINEMONTHSENDED
THREEMONTHSENDED
NINEMONTHSENDED
SEPTEMBER 30 SEPTEMBER 30 SEPTEMBER 30Derivatives designated ashedging instruments 2017 2016 2017 2016 2017 2016 2017 2016 2017 2016 2017 2016
Cash Flow Hedges
Interest rate swap agreements $ (0.2) $ — $ (0.6) $ — Interest expense $ — $ — $ — $ — Other $ — $ — $ — $ —Foreign currency exchangecontracts $ 1.5 $ (0.7) $ 15.2 $ 7.7 Cost of sales $(0.5) $(0.9) $(2.0) $(1.8) Cost of sales $(0.1) $(0.1) $(0.1) $(0.2)
Total $ 1.3 $ (0.7) $ 14.6 $ 7.7 $(0.5) $(0.9) $(2.0) $(1.8) $(0.1) $(0.1) $(0.1) $(0.2)
Amount of Gain or (Loss) Recognized inIncome on Derivative
THREEMONTHSENDED
NINEMONTHSENDED
SEPTEMBER 30
Derivatives Not Designated as Hedging Instruments Location of Gain or(Loss) Recognized inIncome on Derivative 2017 2016 2017 2016
Cash Flow Hedges
Interest rate swap agreements Other $ 0.1 $ 0.5 $ — $(1.2)Foreign currency exchange contracts Cost of sales (0.2) (0.2) 1.5 0.3
Total $(0.1) $ 0.3 $ 1.5 $(0.9)
16

Table of Contents
Note 7—Retirement Benefit Plans
The Company maintains various defined benefit pension plans that provide benefits based on years of service and average compensation during certain periods.The Company's policy is to make contributions to fund these plans within the range allowed by applicable regulations. Plan assets consist primarily of publiclytraded stocks and government and corporate bonds.
Pension benefits for employees covered under the Company's U.S. and U.K. plans are frozen. Only certain grandfathered employees in the Netherlands still earnretirement benefits under a defined benefit pension plan. All other eligible employees of the Company, including employees whose pension benefits are frozen,receive retirement benefits under defined contribution retirement plans.
During the third quarter of 2017 , the Company recognized a settlement loss of $1.0 million resulting from lump-sumdistributions exceeding the total projected interest cost for the plan year for one of its U.S. pension plans. The Companyremeasured the plan as of September 30, 2017 using a discount rate of 3.50% compared to the December 31, 2016 discount rate of 3.75% . As a result of theremeasurement, the funded status of the plan increased by $0.8 million and accumulated other comprehensive income increased by $1.8 million ( $1.2 million netof tax).
The Company previously disclosed in its Annual Report on Form 10-K for the year ended December 31, 2016 that it expected to make no contributions to its U.S.pension plans and contribute approximately $3.0 million to its non-U.S. pension plans in 2017 . The Company now expects to contribute approximately $0.5million and $9.2 million to its U.S. and non-U.S. pension plans, respectively, in 2017 .
The components of pension (income) expense are set forth below:
THREE MONTHS ENDED NINE MONTHS ENDED
SEPTEMBER 30 SEPTEMBER 30
2017 2016 2017 2016
U.S. Pension Interest cost $ 0.6 $ 0.7 $ 2.0 $ 2.2Expected return on plan assets (1.2) (1.3) (3.7) (3.7)Settlement loss 1.0 — 1.0 —Amortization of actuarial loss 0.4 0.4 1.3 1.2Amortization of prior service credit — — (0.2) (0.2)
Total $ 0.8 $ (0.2) $ 0.4 $ (0.5)
Non-U.S. Pension Service cost $ — $ — $ 0.1 $ 0.1Interest cost 1.0 1.2 3.0 3.8Expected return on plan assets (2.3) (2.1) (6.8) (6.7)Amortization of actuarial loss 0.7 0.3 2.0 1.1
Total $ (0.6) $ (0.6) $ (1.7) $ (1.7)
Note 8—Inventories
Inventories are summarized as follows:
SEPTEMBER 30
2017 DECEMBER 31
2016
Finished goods and service parts $ 208.3 $ 171.9Work in process 21.2 26.1Raw materials 231.1 191.4
Total manufactured inventories 460.6 389.4LIFO reserve (40.7) (37.2)
Total inventory $ 419.9 $ 352.2
17

Table of Contents
The cost of certain manufactured inventories, including service parts, has been determined using the last-in-first-out (“LIFO”) method. At September 30, 2017 andDecember 31, 2016 , 49% and 54% , respectively, of total inventories were determined using the LIFO method. An actual valuation of inventory under the LIFOmethod can be made only at the end of the year based on the inventory levels and costs at that time. Accordingly, interim LIFO calculations must be based onmanagement's estimates of expected year-end inventory levels and costs. Because these estimates are subject to change and may be different than the actualinventory levels and costs at the end of the year, interim results are subject to the final year-end LIFO inventory valuation.
Note 9—Current and Long-Term Financing
The Company has a $200.0 million secured, floating-rate revolving credit facility (the "Facility”) that expires in April 2022. On May 30, 2017, the Companyamended the Facility to, among other things, permit term loans and related liens, reduce the availability from $240.0 million and extend the expiration of theFacility from April 2021. There were no borrowings outstanding under the Facility at September 30, 2017 . The excess availability under the Facility, atSeptember 30, 2017 , was $196.0 million , which reflects reductions of $4.0 million for letters of credit and other restrictions. The Facility consists of a U.S.revolving credit facility in the maximum initial amount of $120.0 million and a non-U.S. revolving credit facility in the maximum initial amount of $80.0 million.The Facility can be increased up to the total aggregate amount of $300.0 million over the term of the agreement in minimum increments of $10.0 million subject tocertain conditions. The obligations under the Facility are generally secured by a first priority lien on the working capital assets of the borrowers in the Facility,which include but are not limited to, cash and cash equivalents, accounts receivable and inventory and a second priority lien on the Term Loan Collateral (definedbelow). The approximate book value of assets held as collateral under the Facility was $1.0 billion as of September 30, 2017 .
Borrowings bear interest at a floating rate based on a base rate or LIBOR, as defined in the Facility, plus an applicable margin. The applicable margins, effectiveSeptember 30, 2017 , for U.S. base rate loans and LIBOR loans were 0.25% and 1.25% , respectively. The applicable margins, effective September 30, 2017 , fornon-U.S. base rate loans and LIBOR loans was 1.25% . The applicable LIBOR interest rates under the Facility on September 30, 2017 were 2.48% and 1.25% ,respectively, for the U.S. and non-U.S. facility including the applicable floating rate margin. The Facility also required the payment of a fee of 0.350% per annumon the unused commitment as of September 30, 2017 .
The Facility includes restrictive covenants, which, among other things, limit additional borrowings and investments of the Company and its subsidiaries subject tocertain thresholds, as defined in the Facility, and limits the payment of dividends. If availability for both total and U.S. revolving credit facilities on a pro formabasis, is greater than fifteen percent and less than or equal to twenty percent, the Company may pay dividends subject to achieving a minimum fixed chargecoverage ratio of 1.00 to 1.00, as defined in the Facility. If the availability is greater than twenty percent for both total and U.S. revolving credit facilities on a proforma basis, the Company may pay dividends without any minimum fixed charge coverage ratio requirement. The Facility also requires the Company to achieve aminimum fixed charge coverage ratio in certain circumstances in which total excess availability is less than ten percent of the total commitments under the Facilityor excess availability under the U.S. revolving credit facility is less than ten percent of the U.S. revolver commitments, as defined in the Facility. At September 30,2017, the Company was in compliance with the covenants in the Facility.
On May 30, 2017, the Company entered into an agreement for a $200.0 million term loan (the “Term Loan”), which matures on May 30, 2023. The Term Loanrequires quarterly principal payments on the last day of each March, June, September and December commencing September 30, 2017 in an amount equal to $2.5million and the final principal repayment due on the May 30, 2023 . The Company may also be required to make mandatory prepayments, in certain circumstances,as provided in the Term Loan. At September 30, 2017 , there was $197.5 million of principal outstanding under the Term Loan which has been reduced in theunaudited condensed consolidated balance sheet by $4.3 million of discounts and unamortized deferred financing fees.
The obligations under the Term Loan are generally secured by a first priority lien on the present and future shares of capital stock, material real property, fixturesand general intangibles consisting of intellectual property (collectively, the "Term Loan Collateral") and a second priority lien on the remaining collateral of theU.S. borrowers in the Facility. The approximate book value of assets held as collateral under the Term Loan was $690 million as of September 30, 2017 .
Borrowings under the Term Loan bear interest at a floating rate, which can be a base rate or Eurodollar rate, as defined in the Term Loan, plus an applicablemargin. The applicable margin is based on the consolidated leverage ratio, as provided in the Term Loan, and ranges from 2.75% to 3.00% for U.S. base rate loansand 3.75% to 4.00% for Eurodollar loans. The weighted average interest rate on the amount outstanding under the Term Loan at September 30, 2017 was 5.24% .In addition, the Term Loan includes restrictive covenants, which, among other things, limit additional borrowings and investments of the Company
18

Table of Contents
subject to certain thresholds, as provided in the Term Loan. The Term Loan limits the payment of regularly scheduled dividends and other restricted payments to$50.0 million in any fiscal year, unless the consolidated total net leverage ratio, as defined in the Term Loan, does not exceed 1.75 to 1.00 at the time of thepayment. The Term Loan also contains a provision requiring a premium to be paid in the event of a repricing of the borrowings under the Term Loan, whether byamendment or entry into new loans, within the six month period following entry into the Term Loan. At September 30, 2017 , the Company was in compliancewith the covenants in the Term Loan.
The Company incurred fees and expenses of $4.8 million in 2017 related to the amendment to the Facility and entry into the Term Loan. These fees were deferredand are being amortized as interest expense over the term of the applicable debt agreements. Fees related to the Term Loan are presented as a direct deduction ofthe corresponding debt.
The Company had other debt outstanding, excluding capital leases, of approximately $79.3 million at September 30, 2017 .
Note 10—Product Warranties
The Company provides a standard warranty on its lift trucks, generally for twelve months or 1,000 to 2,000 hours . For certain series of lift trucks, the Companyprovides a standard warranty of one to two years or 2,000 or 4,000 hours . For certain components in some series of lift trucks, the Company provides a standardwarranty of two to three years or 4,000 to 6,000 hours . The Company estimates the costs which may be incurred under its standard warranty programs and recordsa liability for such costs at the time product revenue is recognized.
In addition, the Company sells separately-priced extended warranty agreements for its lift trucks, which generally provide a warranty for an additional two to fiveyears or up to 2,400 to 10,000 hours . The specific terms and conditions of those warranties vary depending upon the product sold and the country in which theCompany does business. Revenue received for the sale of extended warranty contracts is deferred and recognized in the same manner as the costs incurred toperform under the warranty contracts.
The Company also maintains a quality enhancement program under which it provides for specifically identified field product improvements in its warrantyobligation. Accruals under this program are determined based on estimates of the potential number of claims and the cost of those claims based on historical andanticipated costs.
The Company periodically assesses the adequacy of its recorded warranty liabilities and adjusts the amounts as necessary. Factors that affect the warranty liabilityinclude the number of units sold, historical and anticipated rates of warranty claims and the cost per claim.
Changes in the Company's current and long-term warranty obligations, including deferred revenue on extended warranty contracts, are as follows:
2017
Balance at January 1 $ 52.3Current year warranty expense 25.3Change in estimate related to pre-existing warranties (4.9)Payments made (19.7)Foreign currency effect 1.7
Balance at September 30 $ 54.7
Note 11—Contingencies
Various legal and regulatory proceedings and claims have been or may be asserted against the Company relating to the conduct of its businesses, including productliability, environmental and other claims. These proceedings and claims are incidental to the ordinary course of business. Management believes that it hasmeritorious defenses and will vigorously defend the Company in these actions. Any costs that management estimates will be paid as a result of these claims areaccrued when the liability is considered probable and the amount can be reasonably estimated. Although the ultimate disposition of these proceedings is notpresently determinable, management believes, after consultation with its legal counsel, that the likelihood is remote that costs will be incurred materially in excessof accruals already recognized.
19

Table of Contents
Note 12—Guarantees
Under various financing arrangements for certain customers, including independent retail dealerships, the Company provides recourse or repurchase obligationssuch that it would be obligated in the event of default by the customer. Terms of the third-party financing arrangements for which the Company is providingrecourse or repurchase obligations generally range from one to five years. Total amounts subject to recourse or repurchase obligations at September 30, 2017 andDecember 31, 2016 were $151.0 million and $149.3 million , respectively. As of September 30, 2017 , losses anticipated under the terms of the recourse orrepurchase obligations were not significant and reserves have been provided for such losses based on historical experience in the accompanying unauditedcondensed consolidated financial statements. The Company generally retains a security interest in the related assets financed such that, in the event the Companywould become obligated under the terms of the recourse or repurchase obligations, the Company would take title to the assets financed. The fair value of collateralheld at September 30, 2017 was approximately $194.6 million based on Company estimates. The Company estimates the fair value of the collateral usinginformation regarding the original sales price, the current age of the equipment and general market conditions that influence the value of both new and used lifttrucks. The Company also regularly monitors the external credit ratings of the entities for which it has provided recourse or repurchase obligations. As ofSeptember 30, 2017 , the Company did not believe there was a significant risk of non-payment or non-performance of the obligations by these entities; however,there can be no assurance that the risk may not increase in the future. In addition, the Company has an agreement with WF to limit its exposure to losses at certaineligible dealers. Under this agreement, losses related to $32.1 million of recourse or repurchase obligations for these certain eligible dealers are limited to 7.5% oftheir original loan balance, or $7.3 million as of September 30, 2017 . The $32.1 million is included in the $151.0 million of total amounts subject to recourse orrepurchase obligations at September 30, 2017 .
Generally, the Company sells lift trucks through its independent dealer network or directly to customers. These dealers and customers may enter into a financingtransaction with HYGFS or other unrelated third parties. HYGFS provides debt and lease financing to both dealers and customers. On occasion, the credit qualityof a customer or credit concentration issues within WF may require the Company to provide recourse or repurchase obligations of the lift trucks purchased bycustomers and financed through HYGFS. At September 30, 2017 , approximately $128.5 million of the Company's total recourse or repurchase obligations of$151.0 million related to transactions with HYGFS. In connection with the joint venture agreement, the Company also provides a guarantee to WF for 20% ofHYGFS’ debt with WF, such that the Company would become liable under the terms of HYGFS’ debt agreements with WF in the case of default by HYGFS. AtSeptember 30, 2017 , loans from WF to HYGFS totaled $954.2 million . Although the Company’s contractual guarantee was $190.8 million , the loans by WF toHYGFS are secured by HYGFS’ customer receivables, of which the Company guarantees $128.5 million . Excluding the HYGFS receivables guaranteed by theCompany from HYGFS’ loans to WF, the Company’s incremental obligation as a result of this guarantee to WF is $170.1 million , which is secured by 20% ofHYGFS' customer receivables and other secured assets of $255.8 million . HYGFS has not defaulted under the terms of this debt financing in the past, andalthough there can be no assurances, the Company is not aware of any circumstances that would cause HYGFS to default in future periods.
The following table includes the exposure amounts related to the Company's guarantees at September 30, 2017 :
HYGFS TotalTotal recourse or repurchase obligations $ 128.5 $ 151.0Less: exposure limited for certain dealers 32.1 32.1Plus: 7.5% of original loan balance 7.3 7.3 103.7 126.2Incremental obligation related to guarantee to WF 170.1 170.1
Total exposure related to guarantees $ 273.8 $ 296.3
Note 13—Equity Investments
The Company maintains an interest in one variable interest entity, HYGFS. HYGFS is a joint venture with WF formed primarily for the purpose of providingfinancial services to independent Hyster ® and Yale ® lift truck dealers and National Account customers in the United States and is included in the Americassegment. The Company does not have a controlling financial interest or have the power to direct the activities that most significantly affect the economicperformance of HYGFS. Therefore, the Company is not the primary beneficiary and uses the equity method to account for its 20% interest in HYGFS. TheCompany does not consider its variable interest in HYGFS to be significant.
20

Table of Contents
The Company has a 50% ownership interest in SN, a limited liability company which was formed primarily to manufacture and distribute Sumitomo-branded lifttrucks in Japan and export Hyster ® - and Yale ® -branded lift trucks and related components and service parts outside of Japan. The Company purchases productsfrom SN under agreed-upon terms. The Company's ownership in SN is also accounted for using the equity method of accounting and is included in the JAPICsegment.
The Company's percentage share of the net income or loss from its equity investments in HYGFS and SN is reported on the line “Income from unconsolidatedaffiliates” in the “Other (income) expense” section of the unaudited condensed consolidated statements of operations. The Company's equity investments areincluded on the line “Investment in Unconsolidated Affiliates” in the unaudited condensed consolidated balance sheets. At September 30, 2017 and December 31,2016 , the Company's investment in HYGFS was $14.4 million and $13.8 million , respectively. The Company's investment in SN was $34.9 million and $31.6million at September 30, 2017 and December 31, 2016 , respectively. Bolzoni's investment in unconsolidated affiliates was $0.4 million and $0.5 million atSeptember 30, 2017 and December 31, 2016 , respectively.
During the first nine months of 2017, the Company acquired an equity investment in a third party for $5.6 million . This investment is accounted for as anavailable-for-sale security and valued using a quoted market price in an active market, or Level 1 in the fair value hierarchy. The Company's investment as ofSeptember 30, 2017 was $9.3 million , which includes a $3.7 million unrealized gain ( $2.8 million net of tax) that was recorded in OCI in the unaudited condensedconsolidated balance sheet.
Summarized financial information for HYGFS and SN is as follows:
THREE MONTHS ENDED NINE MONTHS ENDED
SEPTEMBER 30 SEPTEMBER 30
2017 2016 2017 2016
Revenues $ 94.1 $ 89.3 $ 272.1 $ 259.1Gross profit $ 29.5 $ 27.8 $ 84.6 $ 79.6Income from continuing operations $ 7.5 $ 6.0 $ 20.7 $ 17.1Net income $ 7.5 $ 6.0 $ 20.7 $ 17.1
Note 14—Acquisitions
Subsequent to the filing of the Company's Annual Report on Form 10-K for the year ended December 31, 2016, the Company finalized its analysis of the fair valueof contingent obligations and income taxes for the Bolzoni acquisition on April 1, 2016. As a result of this analysis, the Company recorded a decrease to deferredtax assets and a corresponding increase to goodwill of $1.0 million in the first quarter of 2017.
Item 2. Management's Discussion and Analysis of Financial Condition and Results of Operations(Tabular Amounts in Millions, Except Per Share and Percentage Data)
Hyster-Yale Materials Handling, Inc. ("Hyster-Yale" or the "Company") and its subsidiaries, including its operating company Hyster-Yale Group, Inc. ("HYG"), isa leading, globally integrated, full-line lift truck manufacturer. The Company offers a broad array of solutions aimed at meeting the specific materials handlingneeds of its customers, including attachments and hydrogen fuel-cell power products, telematics, automation and fleet management services, as well as an array ofother power options for its lift trucks. The Company, through HYG, designs, engineers, manufactures, sells and services a comprehensive line of lift trucks,attachments and aftermarket parts marketed globally primarily under the Hyster ® and Yale ® brand names, mainly to independent Hyster ® and Yale ® retaildealerships. The materials handling business historically has been cyclical because the rate of orders for lift trucks fluctuates depending on the general level ofeconomic activity in the various industries and countries its customers serve. Lift trucks and component parts are manufactured in the United States, NorthernIreland, Mexico, Italy, the Netherlands, Vietnam, Japan, the Philippines, Brazil and China.
The Company also operates Bolzoni S.p.A. ("Bolzoni"). Bolzoni is a leading worldwide producer of attachments, forks and lift tables marketed under the BolzoniAuramo ® and Meyer ® brand names. Bolzoni products are manufactured in Italy, China, Germany, Finland and the United States. Through the design, productionand distribution of a wide range of attachments, Bolzoni has a strong presence in the market niche of lift-truck attachments and industrial material handling.
The Company also operates Nuvera Fuel Cells, LLC ("Nuvera"). Nuvera is an alternative-power technology company focused on fuel cell stacks and engines.Nuvera also supports on-site hydrogen production and dispensing systems that are designed to deliver clean energy solutions to customers.
21

Table of Contents
CRITICAL ACCOUNTING POLICIES AND ESTIMATES
Please refer to the discussion of Critical Accounting Policies and Estimates as disclosed on pages 15 through 17 in the Company's Annual Report on Form 10-K forthe year ended December 31, 2016. Critical Accounting Policies and Estimates have not materially changed since December 31, 2016.
FINANCIAL REVIEW
The results of operations for the Company were as follows:
THREE MONTHS ENDED Favorable /
(Unfavorable)
NINE MONTHS ENDED Favorable /
(Unfavorable) SEPTEMBER 30 SEPTEMBER 30
2017 2016 % Change 2017 2016 % Change
Lift truck unit shipments (in thousands) Americas 14.0 13.7 2.2 % 42.3 40.3 5.0 %EMEA 6.5 5.1 27.5 % 20.8 17.5 18.9 %JAPIC 1.5 1.5 — % 4.4 4.1 7.3 %
22.0 20.3 8.4 % 67.5 61.9 9.0 %Revenues
Americas $ 447.8 $ 410.7 9.0 % $ 1,346.7 $ 1,241.9 8.4 %EMEA 165.6 138.0 20.0 % 500.6 441.5 13.4 %JAPIC 38.9 46.2 (15.8)% 124.9 125.0 (0.1)%Lift truck business 652.3 594.9 9.6 % 1,972.2 1,808.4 9.1 %
Bolzoni (1) 44.3 36.2 22.4 % 127.8 75.1 n.m.Nuvera 0.3 1.4 n.m. 3.3 1.9 n.m.Eliminations (5.8) (3.2) 81.3 % (13.6) (6.3) 115.9 %
$ 691.1 $ 629.3 9.8 % $ 2,089.7 $ 1,879.1 11.2 %Gross profit (loss)
Americas $ 83.6 $ 72.8 14.8 % $ 251.2 $ 217.8 15.3 %EMEA 20.5 18.7 9.6 % 66.6 65.1 2.3 %JAPIC 4.4 4.2 4.8 % 14.1 12.9 9.3 %Lift truck business 108.5 95.7 13.4 % 331.9 295.8 12.2 %
Bolzoni (1) 13.5 9.2 46.7 % 39.7 22.0 n.m.Nuvera (0.4) (0.3) n.m. (1.9) (1.3) n.m.Eliminations (0.2) — n.m. (0.5) — n.m.
$ 121.4 $ 104.6 16.1 % $ 369.2 $ 316.5 16.7 %Selling, general and administrative expenses
Americas $ 55.8 $ 49.4 (13.0)% $ 165.7 $ 162.7 (1.8)%EMEA 21.6 20.1 (7.5)% 63.3 60.9 (3.9)%JAPIC 7.0 5.7 (22.8)% 19.6 16.9 (16.0)%Lift truck business 84.4 75.2 (12.2)% 248.6 240.5 (3.4)%
Bolzoni (1) 11.4 11.7 2.6 % 34.8 23.8 n.m.Nuvera 7.7 12.3 37.4 % 26.2 25.7 (1.9)%
$ 103.5 $ 99.2 (4.3)% $ 309.6 $ 290.0 (6.8)%
22

Table of Contents
THREE MONTHS ENDED Favorable /
(Unfavorable)
NINE MONTHS ENDED Favorable /
(Unfavorable) SEPTEMBER 30 SEPTEMBER 30
2017 2016 % Change 2017 2016 % Change
Operating profit (loss) Americas $ 27.8 $ 23.4 18.8 % $ 85.5 $ 55.1 55.2 %EMEA (1.1) (1.4) (21.4)% 3.3 4.2 (21.4)%JAPIC (2.6) (1.5) (73.3)% (5.5) (4.0) n.m.Lift truck business 24.1 20.5 17.6 % 83.3 55.3 50.6 %
Bolzoni (1) 2.1 (2.5) n.m. 4.9 (1.8) n.m.Nuvera (8.1) (12.6) 35.7 % (28.1) (27.0) (4.1)%Eliminations (0.2) — n.m. (0.5) — n.m.
$ 17.9 $ 5.4 231.5 % $ 59.6 $ 26.5 124.9 %Interest expense $ 6.2 $ 1.9 (226.3)% $ 10.6 $ 5.0 (112.0)%Other (income) expense $ (4.2) $ (3.4) 23.5 % $ (9.5) $ (6.1) 55.7 %Net income (loss) attributable to stockholders
Americas $ 22.7 $ 20.2 12.4 % $ 67.0 $ 43.2 55.1 %EMEA (1.7) 1.9 n.m. 1.6 6.4 (75.0)%JAPIC (1.3) (0.2) n.m. (2.8) (0.9) n.m.Lift truck business 19.7 21.9 (10.0)% 65.8 48.7 35.1 %
Bolzoni (1) 1.9 (2.0) n.m. 3.3 (1.9) n.m.Nuvera (4.9) (7.6) 35.5 % (16.9) (16.2) (4.3)%Eliminations (0.2) — n.m. (1.2) — n.m.
$ 16.5 $ 12.3 34.1 % $ 51.0 $ 30.6 66.7 %Diluted earnings per share $ 1.00 $ 0.75 33.3 % $ 3.09 $ 1.86 66.1 %Reported income tax rate n.m. n.m. 12.5% n.m. (1) Bolzoni was acquired on April 1, 2016 and its results of operations have been included since the acquisition date.
Following is the detail of the Company's unit shipments, bookings and backlog of unfilled orders placed with its manufacturing and assembly operations for newlift trucks, reflected in thousands of units. As of September 30, 2017 , substantially all of the Company's backlog is expected to be sold within the next twelvemonths.
THREE MONTHS ENDED NINE MONTHS ENDED SEPTEMBER 30 SEPTEMBER 30
2017 2016 2017 2016
Unit backlog, beginning of period 35.3 30.5 30.7 26.9Unit shipments (22.0) (20.3) (67.5) (61.9)Unit bookings 21.8 20.4 71.9 65.6
Unit backlog, end of period 35.1 30.6 35.1 30.6
The following is the detail of the approximate sales value of the Company's lift truck unit bookings and backlog, reflected in millions of dollars. The dollar value ofbookings and backlog is calculated using the current unit bookings and backlog and the forecasted average sales price per unit.
THREE MONTHS ENDED NINE MONTHS ENDED SEPTEMBER 30 SEPTEMBER 30
2017 2016 2017 2016
Bookings, approximate sales value $ 520 $ 480 $ 1,645 $ 1,470Backlog, approximate sales value $ 860 $ 730 $ 860 $ 730
23

Table of Contents
Third Quarter of 2017 Compared with Third Quarter of 2016
The following table identifies the components of change in revenues for the third quarter of 2017 compared with the third quarter of 2016 :
Revenues
2016 $ 629.3Increase (decrease) in 2017 from: Unit volume and product mix 33.8Bolzoni revenues 8.1Foreign currency 7.6Price 7.5Parts 4.9Other (0.1)
2017 $ 691.1
Revenues increased 9.8% to $691.1 million in the third quarter of 2017 from $629.3 million in the third quarter of 2016 . The increase was mainly due to higherunit and parts volume, favorable foreign currency movements and improved pricing in the lift truck business. In addition, increased Bolzoni revenues contributedto the improvement in revenues during the third quarter of 2017 compared with the third quarter of 2016.
Revenues in the Americas increased in the third quarter of 2017 compared with the third quarter of 2016 primarily as a result of increased unit shipments of higher-priced trucks, less deal-specific pricing and increased part sales. Revenues increased from sales of Class 5 internal combustion engine lift trucks, including the newstandard truck and big trucks and Class 1 and Class 2 electric trucks, partially offset by lower sales of Class 4 trucks.
EMEA's revenues increased in the third quarter of 2017 compared with the third quarter of 2016 mainly as a result of increased unit shipments and favorablecurrency movements of $7.3 million from the translation of sales into U.S. dollars. The increase in unit shipments and revenues in EMEA primarily related to Class1 electric-rider trucks and Class 3 warehouse trucks, as well as the new Class 5 internal combustion engine standard truck.
Revenues in JAPIC decreased in the third quarter of 2017 compared with the third quarter of 2016, mainly as a result of fewer shipments of higher-priced, higher-capacity lift trucks, predominantly big trucks.
The following table identifies the components of change in operating profit for the third quarter of 2017 compared with the third quarter of 2016 :
Operating Profit
2016 $ 5.4Increase (decrease) in 2017 from: Lift truck gross profit 12.6Bolzoni operations 4.6Nuvera operations 4.5Lift truck selling, general and administrative expenses (9.2)
2017 $ 17.9
The Company recognized operating profit of $17.9 million in the third quarter of 2017 compared with $5.4 million in the third quarter of 2016 . The increase inoperating profit was primarily due to higher lift truck gross profit and favorable Nuvera and Bolzoni operations, partially offset by the increase in lift truck'sselling, general and administrative expenses. The increase in the lift truck gross profit was primarily attributable to improved pricing, higher unit shipments andfavorable currency movements of $7.2 million, partially offset by material cost inflation.
Operating profit in the Americas increased in the third quarter of 2017 compared with the third quarter of 2016 primarily as a result of improved gross profitmainly due to higher unit shipments and improved pricing, net of material cost inflation. The increase in gross profit was partially offset by higher selling, generaland administrative expenses mainly from higher employee-related costs and for development and marketing of new products.
24

Table of Contents
EMEA recognized an operating loss of $1.1 million in the third quarter of 2017 compared with $1.4 million in the third quarter of 2016. Higher gross profit fromfavorable currency movements of $6.7 million and higher unit shipments was mainly offset by higher material costs, a shift in sales mix to lower-priced, lower-margin products and an increase in selling, general and administrative expenses.
The operating loss in JAPIC increased in the third quarter of 2017 compared with the third quarter of 2016, primarily as a result of higher selling, general andadministrative expenses as the Company continues to execute its strategic initiatives.
Bolzoni's operating profit increased in the third quarter of 2017 from the third quarter of 2016 primarily due to the absence of $2.6 million of one-time purchaseaccounting adjustments recorded in the third quarter of 2016 and higher gross profit from increased sales and higher productivity.
Nuvera's operating loss decreased in the third quarter of 2017 compared with the third quarter of 2016 primarily due to lower product development and productionstartup expenses which was partially offset by higher selling, general and administrative expenses, including employee-related costs and other general operatingexpenses.
The Company recognized net income attributable to stockholders of $16.5 million in the third quarter of 2017 compared with $12.3 million in the third quarter of2016 . The increase was primarily the result of the increase in operating profit, partially offset by higher interest expense in the third quarter of 2017 compared withthe third quarter of 2016.
First Nine Months of 2017 Compared with First Nine Months of 2016
The following table identifies the components of change in revenues for the first nine months of 2017 compared with the first nine months of 2016 :
Revenues
2016 $ 1,879.1Increase (decrease) in 2017 from: Unit volume and product mix 133.8Bolzoni revenues First quarter 2017 $ 41.6 Increase in second and third quarter 2017 revenues 11.1 52.7
Unit price 18.0Parts 15.2Other (5.8)Foreign currency (3.3)
2017 $ 2,089.7
Revenues increased 11.2% to $2,089.7 million in the first nine months of 2017 from $1,879.1 million in the first nine months of 2016 . The increase was mainlyattributable to the lift truck business from higher unit and parts volumes and the favorable effect of a decrease in deal-specific pricing during the first nine monthsof 2017 compared with the first nine months of 2016.
Revenues in the Americas increased in the first nine months of 2017 from the first nine months of 2016 primarily as a result of increased unit shipments of higher-priced trucks. Revenues increased primarily from sales of the Company's new Class 5 internal combustion engine standard truck and increased sales of higher-capacity, 3.5 to 8 ton, Class 5 trucks, as well as Class 1 and Class 2 trucks. In addition, a decrease in deal-specific pricing and an increase in parts sales alsocontributed to the increase in revenues in the first nine months of 2017 compared with the first nine months of 2016.
EMEA's revenues improved in the first nine months of 2017 from the first nine months of 2016 mainly as a result of increased unit shipments primarily related toshipments of the new Class 5 internal combustion engine standard truck and an increase in shipments of Class 1 electric-rider trucks.
25

Table of Contents
The following table identifies the components of change in operating profit for the first nine months of 2017 compared with the first nine months of 2016 :
Operating Profit
2016 $ 26.5Increase (decrease) in 2017 from: Lift truck gross profit 35.6Bolzoni operations 6.7Lift truck selling, general and administrative expenses (8.1)Nuvera operations (1.1)
2017 $ 59.6
The Company recognized operating profit of $59.6 million in the first nine months of 2017 compared with $26.5 million in the first nine months of 2016 . Theincrease in operating profit was primarily due to higher lift truck gross profit, partially offset by an increase in selling, general and administrative expenses. Theincrease in the lift truck gross profit was primarily due to higher unit shipments and related production efficiencies in addition to improved pricing, partially offsetby material cost inflation.
Operating profit in the Americas increased in the first nine months of 2017 compared with the first nine months of 2016 primarily as a result of improved grossprofit mainly due to higher unit shipments and related production efficiencies in addition to improved pricing. The increase in gross profit was partially offset bymaterial cost inflation. In addition, selling, general and administrative expenses in the Americas increased in the first nine months of 2017 compared with the firstnine months of 2016 primarily due to higher employee-related costs and for development and marketing of new products, offset by the absence of $6.1 million ofprior period acquisition-related costs.
Operating profit in EMEA declined in the first nine months of 2017 compared with the first nine months of 2016 mainly as a result of an increase in selling,general and administrative expenses partially offset by higher gross profit. Gross profit improved primarily from higher unit shipments, partially offset by materialcost inflation.
The operating loss in JAPIC increased in the first nine months of 2017 compared with the first nine months of 2016 mainly as a result of increased selling, generaland administrative expenses partly offset by improved pricing.
Bolzoni's operating profit improved in the first nine months of 2017 from the first nine months of 2016 primarily due to the absence of $2.7 million of one-timepurchase accounting adjustments recorded in 2016 and higher gross profit from higher sales in the comparable second and third quarters of 2017 compared with2016. Gross profit in the first quarter of 2017 was $2.3 million.
During the first nine months of 2017, Nuvera's operating loss increased $1.1 million compared with the first nine months of 2016. In the first nine months of 2017,Nuvera had lower product development and production start-up expenses as the Company began transitioning from product development to production of its fuel-cell system in the second half of 2016. This decrease was more than offset by increased marketing, employee-related costs, professional fees and other generaloperating expenses.
The Company recognized net income attributable to stockholders of $51.0 million in the first nine months of 2017 compared with $30.6 million in the first ninemonths of 2016 . The increase was primarily the result of the increase in operating profit, partially offset by higher interest expense in the first nine months of 2017compared with the first nine months of 2016.
26
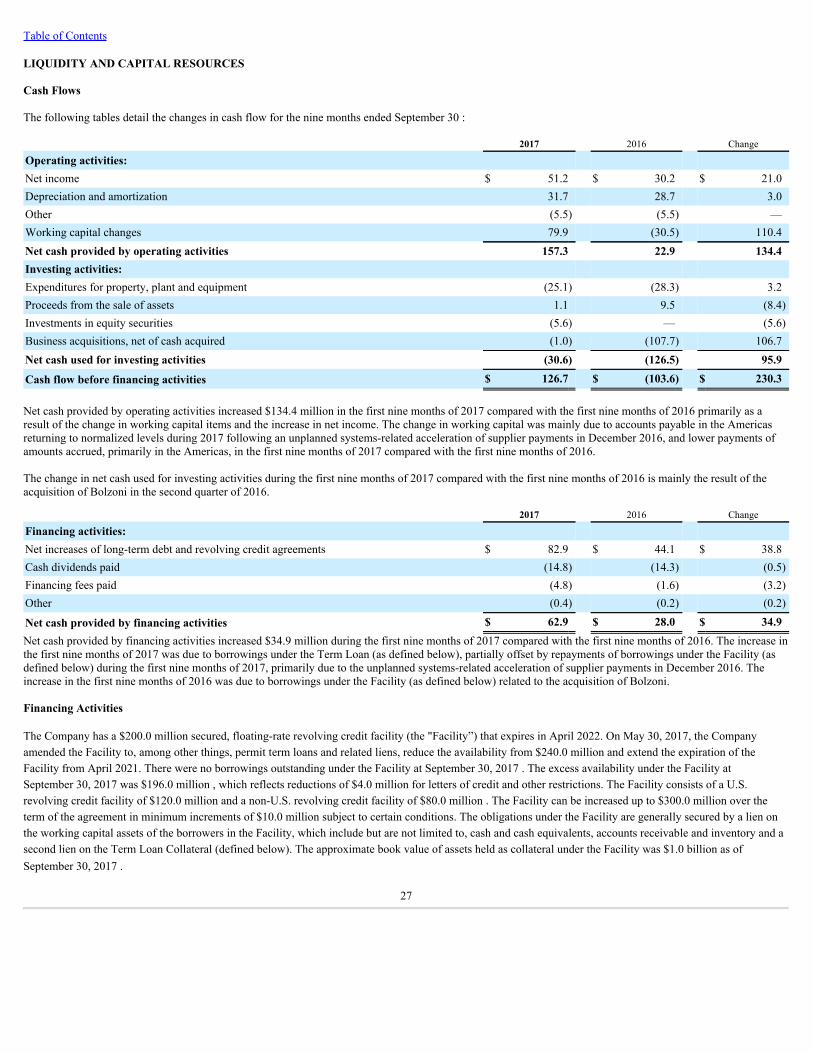
Table of Contents
LIQUIDITY AND CAPITAL RESOURCES
Cash Flows
The following tables detail the changes in cash flow for the nine months ended September 30 :
2017 2016 Change
Operating activities: Net income $ 51.2 $ 30.2 $ 21.0Depreciation and amortization 31.7 28.7 3.0Other (5.5) (5.5) —Working capital changes 79.9 (30.5) 110.4Net cash provided by operating activities 157.3 22.9 134.4Investing activities: Expenditures for property, plant and equipment (25.1) (28.3) 3.2Proceeds from the sale of assets 1.1 9.5 (8.4)Investments in equity securities (5.6) — (5.6)Business acquisitions, net of cash acquired (1.0) (107.7) 106.7Net cash used for investing activities (30.6) (126.5) 95.9
Cash flow before financing activities $ 126.7 $ (103.6) $ 230.3
Net cash provided by operating activities increased $134.4 million in the first nine months of 2017 compared with the first nine months of 2016 primarily as aresult of the change in working capital items and the increase in net income. The change in working capital was mainly due to accounts payable in the Americasreturning to normalized levels during 2017 following an unplanned systems-related acceleration of supplier payments in December 2016, and lower payments ofamounts accrued, primarily in the Americas, in the first nine months of 2017 compared with the first nine months of 2016.
The change in net cash used for investing activities during the first nine months of 2017 compared with the first nine months of 2016 is mainly the result of theacquisition of Bolzoni in the second quarter of 2016.
2017 2016 Change
Financing activities: Net increases of long-term debt and revolving credit agreements $ 82.9 $ 44.1 $ 38.8Cash dividends paid (14.8) (14.3) (0.5)Financing fees paid (4.8) (1.6) (3.2)Other (0.4) (0.2) (0.2)
Net cash provided by financing activities $ 62.9 $ 28.0 $ 34.9Net cash provided by financing activities increased $34.9 million during the first nine months of 2017 compared with the first nine months of 2016. The increase inthe first nine months of 2017 was due to borrowings under the Term Loan (as defined below), partially offset by repayments of borrowings under the Facility (asdefined below) during the first nine months of 2017, primarily due to the unplanned systems-related acceleration of supplier payments in December 2016. Theincrease in the first nine months of 2016 was due to borrowings under the Facility (as defined below) related to the acquisition of Bolzoni.
Financing Activities
The Company has a $200.0 million secured, floating-rate revolving credit facility (the "Facility”) that expires in April 2022. On May 30, 2017, the Companyamended the Facility to, among other things, permit term loans and related liens, reduce the availability from $240.0 million and extend the expiration of theFacility from April 2021. There were no borrowings outstanding under the Facility at September 30, 2017 . The excess availability under the Facility atSeptember 30, 2017 was $196.0 million , which reflects reductions of $4.0 million for letters of credit and other restrictions. The Facility consists of a U.S.revolving credit facility of $120.0 million and a non-U.S. revolving credit facility of $80.0 million . The Facility can be increased up to $300.0 million over theterm of the agreement in minimum increments of $10.0 million subject to certain conditions. The obligations under the Facility are generally secured by a lien onthe working capital assets of the borrowers in the Facility, which include but are not limited to, cash and cash equivalents, accounts receivable and inventory and asecond lien on the Term Loan Collateral (defined below). The approximate book value of assets held as collateral under the Facility was $1.0 billion as ofSeptember 30, 2017 .
27

Table of Contents
Borrowings bear interest at a floating rate based on a base rate or LIBOR, as defined in the Facility, plus an applicable margin. The applicable margins, effectiveSeptember 30, 2017 , for U.S. base rate loans and LIBOR loans were 0.25% and 1.25% , respectively. The applicable margin, effective September 30, 2017 , fornon-U.S. base rate loans and LIBOR loans was 1.25% . The applicable LIBOR interest rates under the Facility on September 30, 2017 were 2.48% and 1.25% ,respectively, for the U.S. and non-U.S. facility including the applicable floating rate margin. The Facility also required the payment of a fee of 0.350% per annumon the unused commitment as of September 30, 2017 .
The Facility includes restrictive covenants, which, among other things, limit additional borrowings and investments of the Company and its subsidiaries subject tocertain thresholds, as defined in the Facility, and limits the payment of dividends. If availability for both total and U.S. revolving credit facilities on a pro formabasis, is greater than fifteen percent and less than or equal to twenty percent, the Company may pay dividends subject to achieving a minimum fixed chargecoverage ratio of 1.00 to 1.00, as defined in the Facility. If the availability is greater than twenty percent for both total and U.S. revolving credit facilities on a proforma basis, the Company may pay dividends without any minimum fixed charge coverage ratio requirement. The Facility also requires the Company to achieve aminimum fixed charge coverage ratio in certain circumstances in which total excess availability is less than ten percent of the total commitments under the Facilityor excess availability under the U.S. revolving credit facility is less than ten percent of the U.S. revolver commitments, as defined in the Facility. At September 30,2017, the Company was in compliance with the covenants in the Facility.
On May 30, 2017, the Company entered into an agreement for a $200.0 million term loan (the “Term Loan”), which matures on May 30, 2023. The Term Loanrequires quarterly principal payments on the last day of each March, June, September and December commencing September 30, 2017 in an amount equal to $2.5million and the final principal repayment due on the May 30, 2023 . The Company may also be required to make mandatory prepayments, in certaincircumstances, as provided in the Term Loan. At September 30, 2017, there was $197.5 million of principle outstanding under the Term Loan which has beenreduced in the unaudited condensed consolidated balance sheet by $4.3 million of discounts and unamortized deferred financing fees.
The obligations under the Term Loan are generally secured by a first priority lien on the present and future shares of capital stock, material real property, fixturesand general intangibles consisting of intellectual property (collectively, the "Term Loan Collateral") and a second priority lien on the remaining collateral of theU.S. borrowers in the Facility. The approximate book value of assets held as collateral under the Term Loan was $690 million as of September 30, 2017 .
Borrowings under the Term Loan bear interest at a floating rate, which can be a base rate or Eurodollar rate, as defined in the Term Loan, plus an applicablemargin. The applicable margin is based on the consolidated leverage ratio, as provided in the Term Loan, and ranges from 2.75% to 3.00% for U.S. base rate loansand 3.75% to 4.00% for Eurodollar loans. The weighted average interest rate on the amount outstanding under the Term Loan at September 30, 2017 was 5.24% .In addition, the Term Loan includes restrictive covenants, which, among other things, limit additional borrowings and investments of the Company subject tocertain thresholds, as provided in the Term Loan. The Term Loan limits the payment of regularly scheduled dividends and other restricted payments to $50.0million in any fiscal year, unless the consolidated total net leverage ratio, as defined in the Term Loan, does not exceed 1.75 to 1.00 at the time of the payment.The Term Loan also contains a provision requiring a premium to be paid in the event of a repricing of the borrowings under the Term Loan, whether byamendment or entry into new loans, within the six month period following entry into the Term Loan. At September 30, 2017 , the Company was in compliancewith the covenants in the Term Loan.
The Company incurred fees and expenses of $4.8 million in 2017 related to the amendment of the Facility and entry into the Term Loan. These fees were deferredand are being amortized as interest expense over the term of the applicable debt agreements. Fees related to the Term Loan are presented as a direct deduction ofthe corresponding debt.
The Company had other debt outstanding, excluding capital leases, of approximately $79.3 million at September 30, 2017 . In addition to the excess availabilityunder the Facility, the Company had remaining availability of $46.6 million related to other non-U.S. revolving credit agreements.
The Company believes funds available from cash on hand, Term Loan, the Facility, other available lines of credit and operating cash flows will provide sufficientliquidity to meet its operating needs and commitments during the next twelve months and until the expiration of the Facility in April 2022.
28

Table of Contents
Contractual Obligations, Contingent Liabilities and Commitments
On May 30, 2017, the Company entered into the Term Loan which matures on May 30, 2023. The Company used the borrowings under the Term Loan to repayborrowings under the Facility and plans to use the remaining proceeds from the Term Loan to fund any future acquisitions and strategic investments and forgeneral corporate purposes. In addition, the Company also entered into an amendment to the Facility during the second quarter of 2017.
Following is a table summarizing the Term Loan and the Facility, as amended, as of September 30, 2017 :
Payments Due by PeriodContractual Obligations Total Year 1 Year 2 Year 3 Year 4 Year 5 After Year 5
Term Loan $ 197.5 $ 10.0 $ 10.0 $ 10.0 $ 10.0 $ 10.0 $ 147.5Interest payments on Term Loan 51.2 10.1 9.6 9.1 8.6 8.1 5.7
$ 248.7 $ 20.1 $ 19.6 $ 19.1 $ 18.6 $ 18.1 $ 153.2
Since December 31, 2016 , there have been no other significant changes in the total amount of the Company's contractual obligations or commercial commitments,or the timing of cash flows in accordance with those obligations, as reported on pages 26 and 27 in the Company's Annual Report on Form 10-K for the year endedDecember 31, 2016 .
Capital Expenditures
The following table summarizes actual and planned capital expenditures:
Nine Months EndedSeptember 30, 2017
Planned for Remainder of2017 Planned 2017 Total Actual 2016
Lift truck business $ 19.9 $ 17.7 $ 37.6 $ 36.5Bolzoni 4.1 2.5 6.6 4.0Nuvera 1.1 1.3 2.4 2.2
$ 25.1 $ 21.5 $ 46.6 $ 42.7
Planned expenditures for the remainder of 2017 are primarily for product development, improvements to information technology infrastructure, improvements atmanufacturing locations and manufacturing equipment. The principal sources of financing for these capital expenditures are expected to be internally generatedfunds and bank financing.
Capital Structure
The Company's capital structure is presented below:
SEPTEMBER 30
2017 DECEMBER 31
2016 Change
Cash and cash equivalents $ 238.2 $ 43.2 $ 195.0Other net tangible assets 498.5 531.5 (33.0)Intangible assets 57.7 56.2 1.5Goodwill 57.4 50.7 6.7
Net assets 851.8 681.6 170.2Total debt (294.1) (211.2) (82.9)
Total equity $ 557.7 $ 470.4 $ 87.3
Debt to total capitalization 35% 31% 4%
29

Table of Contents
OUTLOOK
Americas Outlook
As it was in the first half of the year, growth in the Americas market in the third quarter of 2017 continued to be stronger than originally anticipated, and thatgrowth is expected to continue in the fourth quarter of 2017. Unit shipments and unit and parts revenues are expected to increase in the fourth quarter of 2017compared with the fourth quarter of 2016 as a result of the strong 2017 market and an increase in sales of higher-priced Class 5 internal combustion engine trucks,Class 1 electric trucks and Class 3 warehouse trucks.
Fourth-quarter 2017 operating profit in the Americas is expected to increase substantially compared with the fourth quarter of 2016. This anticipated improvementis expected to be driven by an increase in sales volumes of higher-priced Class 5 internal combustion engine trucks, including Big Trucks, as well as an expectedimprovement in product pricing, partially offset by material cost inflation and higher operating expenses.
In 2018, the Company expects the Americas market to continue to grow but at a more moderate rate than in 2017. In this market environment, 2018 revenues andparts sales are expected to increase over 2017 more than the market due to anticipated market share gains. Full-year 2018 operating profit is expected to becomparable to 2017. An increase in sales of higher-priced units, as well as the favorable effect of anticipated price increases, net of material cost inflation, areexpected to be offset by higher operating expenses and an increase in costs associated with the marketing and sale of battery box replacement units along with thestart of manufacturing of the 14- and 18-inch BBRs at the Greenville, North Carolina plant in the second half of 2018. These new BBR models are being developedto be used in many high-density warehouse applications.
EMEA Outlook
Markets in EMEA are expected to continue to grow in the fourth quarter of 2017 compared with the prior year period, but at a more moderate rate than in thefourth quarter of 2016 and first nine months of 2017. Unit revenues are expected to increase substantially in the fourth quarter of 2017 primarily as a result of theoverall market conditions, as well as an expected increase in sales of Class 1 electric counterbalanced trucks and Class 2 and 3 electric warehouse trucks. Inaddition, anticipated benefits from favorable current currency rates are expected to contribute to the revenue increase.
Operating profit in the fourth quarter of 2017 is expected to be comparable to 2016. The anticipated favorable impact of improvements in unit revenues and relatedproduction efficiencies from the higher units, as well as benefits expected from the weakening U.S. dollar are anticipated to be offset by material cost inflation andhigher operating expenses.
In 2018, the EMEA markets are expected to grow modestly. As a result of these market conditions, anticipated market share gains and the favorable effect ofanticipated price increases, unit revenues are expected to increase in 2018. Anticipated benefits from favorable current currency rates are also expected tocontribute to the revenue increase. Operating profit in the EMEA segment is also expected to increase in 2018 compared with 2017 as a result of benefits expectedfrom currency movements, specifically the weakening U.S. dollar, higher sales volumes and favorable pricing, net of moderating material costs, partially offset byhigher operating expenses.
JAPIC Outlook
For the fourth quarter of 2017, JAPIC is expected to continue to grow, driven primarily by China, but at a more moderate rate than in the prior year and first ninemonths of 2017. In this market environment, revenues and operating results are expected to improve during the fourth quarter of 2017 compared with the fourthquarter of 2016. This improvement is expected to be driven by increased unit volumes and a shift in mix to higher-margin Class 5 internal combustion enginetrucks, including Big Trucks, Class 1 counter-balanced electric trucks and Class 2 warehouse trucks.
In 2018, the JAPIC market is expected to decline modestly, driven by China. However, as a result of the continued implementation of the Company's strategicinitiatives, revenues and operating results are expected to improve compared with 2017, with higher employee-related expenses expected to partly offset theimprovement in operating results.
Overall Lift Truck Outlook
The Company remains focused on gaining market share in its Lift Truck business through the continued implementation of its key strategic initiatives ofunderstanding customer needs, providing the lowest cost of ownership over the life-cycle of the truck, enhancing its independent distribution, increasing itswarehouse market position, increasing the Company's success in
30

Table of Contents
the Asia markets, increasing its Big Truck market position, strengthening its sales and marketing organization, and leveraging its solutions and technology drivers.
To meet customer needs, the Company is developing new products in many segments that are expected to support its market share growth. In April 2017, theCompany launched its new ReachStacker Big Truck model dedicated solely to container-handling applications in defined markets. This product has been well-received and is gaining traction. In October 2017, production began on a new 11-ton empty container handler Big Truck with a taller mast for higher stackingcapabilities. The Company is also working with a customer to test a 52-ton Big Truck powered by a lithium-ion battery. In EMEA, the Company launched a newClass 3 electric stacker, warehouse truck with a platform for the driver in the 2017 third quarter, and, in early 2018, expects to introduce new Class 3 warehouseproducts in the Americas and new Class 1 electric counterbalanced trucks in EMEA. In addition to the lithium-ion Big Truck, the Company is testing an 8-9 tonhigh-performance, lithium-ion counterbalanced truck in EMEA. These new products, as well as those recently launched and the introduction of other new productsin the pipeline, including trucks with new Nuvera BBRs, are expected to help increase market share, improve revenues and enhance operating margins.
The global lift truck market has remained strong throughout 2017 and is expected to continue to be strong through the end of the year. With this stronger thanexpected market, the Company has focused on a carefully paced ramp up in production and achievement of price goals, while maintaining a healthy backlog tomanage production efficiencies.
Unit shipments and unit and parts revenues in the Lift Truck business are expected to increase during the fourth quarter of 2017 compared with the same period in2016. Lift Truck operating profit is also expected to increase in the fourth quarter of 2017 compared with the fourth quarter of 2016, but net income is expected tobe comparable to 2016. The increase in operating profit is primarily driven by higher revenues and anticipated benefits from favorable current currency rates,partly offset by higher operating costs and material cost inflation, net of price increases. Higher interest expense and a higher effective income tax rate are expectedto offset the fourth quarter operating profit improvements.
The Company anticipates that commodity costs will continue to increase in the fourth quarter of 2017 from 2016 levels, but will moderate in 2018, although thesemarkets, particularly steel, remain volatile and sensitive to changes in the global economy. The Company will continue to monitor these closely and adjust pricingaccordingly.
Global markets in 2018 are expected to be comparable to 2017. The Company anticipates that benefits from expected unit and parts revenue increases driven bycontinued investments in the Company's strategic initiatives will be partially offset by higher operating expenses and moderating material cost inflation, resultingin a moderate increase in operating profit in 2018 compared with 2017. However, net income in 2018 is expected to decrease modestly from 2017 as a result ofhigher interest expense and a higher effective income tax rate, as well as the absence of tax benefits recognized in 2017 that are not expected to reoccur.
Bolzoni Outlook
The majority of Bolzoni's revenues are generated in the EMEA market, primarily Western and Eastern Europe, and, to a lesser degree, in the North Americamarket. As a result of anticipated strong growth in both the EMEA and Americas markets and the continued implementation of sales enhancement programs,Bolzoni expects revenues in the fourth quarter of 2017 to increase compared with the prior year fourth quarter.
In addition to the anticipated increase in revenues and the expected operating leverage resulting from the sales growth, the implementation of several key strategicprograms are expected to generate substantial growth in Bolzoni's operating profit and net income in the fourth quarter of 2017 compared with the prior year.
Continued improvements in revenues, operating profit and net income are expected in 2018 compared with 2017.
Nuvera Outlook
Progress continues to be made on the organizational realignment designed to enhance the overall strategic positioning and operational effectiveness of the fuel cellbusiness, with Nuvera focused on fuel cell stacks, engines and associated components and the Lift Truck business focused on battery box replacements andintegrated engine solutions. As mentioned above, the transition of the design, sales, marketing and product support responsibilities for the BBRs from Nuvera tothe Lift Truck business has been completed. However, the manufacturing of the current range of BBRs remains at Nuvera's Billerica facility at the present time.
31

Table of Contents
Due to the relatively high cost position and limited product range of currently available BBRs, the Company is taking a measured approach to developing itscustomer base by building relationships with customers that are willing to pay a premium for the high power density of the Nuvera BBR solution and the productsupport now offered through the Lift Truck business. During the 2017 third quarter, a number of additional units were built for further testing and developmentapplications by the Lift Truck business, and sales of BBRs are increasing, with production slots filled through the end of the year. Nuvera expects a ramp-up ofshipments during the fourth quarter from third quarter levels, with shipments expected to continue to increase in the first quarter of 2018. As the supply chainmatures and volumes increase, costs for BBR components are expected to decrease, and as new, cost-reduced BBR models are introduced, including new 14- and18-inch BBRs, the target customer portfolio is anticipated to expand. By the second half of 2018, production of the new 14- and 18-inch BBRs is expected to beginat the Lift Truck business' manufacturing plant in Greenville, North Carolina, with a steady ramp up in demand anticipated. In addition, BBR manufacturing atNuvera's Billerica facility is expected to be phased out and transferred to the Lift Truck business by the end of 2018.
With the phase out of battery box replacement production in Billerica, Nuvera will focus on the design, manufacture and sales and marketing of fuel cell stacks andengines. In addition to growing demand for engines for BBRs, Nuvera is seeing significant interest for its stacks and fuel cell engines for applications outside of theBBR market and believes this can be a significant and profitable growth opportunity.
During the third quarter, the Company's fuel cell engines and BBRs reached a sufficient level of maturity that the Company could perform a detailed review of themost likely forward financial projection for the Nuvera business, taking into account the status and timing of engineering projects currently underway to costreduce current products (stacks, engines and BBRs), the timing of the introduction of new products, the projected trajectory of sales by product type, includingdevelopment activities and sales of fuel cell stacks and engines for application outside of the BBR market, and the level of operating expenses required at fullcommercialization. As a result of this exercise and based on the Company's revised business model, the Company believes it has better visibility of the future costsand actions required to reach profitable commercialization. The Company's current target is to achieve break-even in a late 2019 period, although this target couldbe achieved earlier or later depending on sales volumes for fuel cell powered lift trucks, as well as sales in other markets. The expected path is for moderatinglosses over the next two years.
EFFECTS OF FOREIGN CURRENCY
The Company operates internationally and enters into transactions denominated in foreign currencies. As a result, the Company is subject to the variability thatarises from exchange rate movements. The effects of foreign currency fluctuations on revenues, operating profit and net income are addressed in the previousdiscussions of operating results. See also Item 3, "Quantitative and Qualitative Disclosures About Market Risk,” in Part I of this Quarterly Report on Form 10-Q.
FORWARD-LOOKING STATEMENTS
The statements contained in this Form 10-Q that are not historical facts are “forward-looking statements” within the meaning of Section 27A of the Securities Actof 1933 and Section 21E of the Securities Exchange Act of 1934. These forward-looking statements are made subject to certain risks and uncertainties, whichcould cause actual results to differ materially from those presented. Readers are cautioned not to place undue reliance on these forward-looking statements, whichspeak only as of the date hereof. The Company undertakes no obligation to publicly revise these forward-looking statements to reflect events or circumstances thatarise after the date hereof. Among the factors that could cause plans, actions and results to differ materially from current expectations are, without limitation: (1)reduction in demand for lift trucks, attachments and related aftermarket parts and service on a global basis, (2) the ability of dealers, suppliers and end-users toobtain financing at reasonable rates, or at all, as a result of current economic and market conditions, (3) the political and economic uncertainties in the countrieswhere the Company does business, (4) customer acceptance of pricing, (5) delays in delivery or increases in costs, including transportation costs, of raw materialsor sourced products and labor or changes in or unavailability of quality suppliers, (6) exchange rate fluctuations and monetary policies and other changes in theregulatory climate in the countries in which the Company operates and/or sells products, (7) delays in manufacturing and delivery schedules, (8) bankruptcy of orloss of major dealers, retail customers or suppliers, (9) customer acceptance of, changes in the costs of, or delays in the development of new products, (10)introduction of new products by, or more favorable product pricing offered by, competitors, (11) product liability or other litigation, warranty claims or returns ofproducts, (12) the effectiveness of the cost reduction programs implemented globally, including the successful implementation of procurement and sourcinginitiatives, (13) changes mandated by federal, state and other regulation, including tax, health, safety or environmental legislation, (14) the successfulcommercialization of Nuvera's technology, and (15) unfavorable effects of geopolitical and legislative developments on global operations, including withoutlimitation, the United Kingdom's exit from the European Union, the entry into new trade agreements and the imposition of tariffs.
32

Table of Contents
Item 3. Quantitative and Qualitative Disclosures About Market Risk
See pages 32, 33 and F-24 through F-27 of the Company's Annual Report on Form 10-K for the year ended December 31, 2016 for a discussion of the Company'sderivative hedging policies and use of financial instruments. There have been no material changes in the Company's market risk exposures since December 31,2016 .
Item 4. Controls and Procedures
Evaluation of disclosure controls and procedures: An evaluation was carried out under the supervision and with the participation of the Company'smanagement, including the principal executive officer and the principal financial officer, of the effectiveness of the Company's disclosure controls and proceduresas of the end of the period covered by this report. Based on that evaluation, these officers have concluded that the Company's disclosure controls and procedureswere effective as of the end of the period covered by this report.
Changes in internal control over financial reporting: During the third quarter of 2017 , there were no changes in the Company's internal control over financialreporting that materially affected, or are reasonably likely to materially affect, the Company's internal control over financial reporting.
PART IIOTHER INFORMATION
Item 1 Legal ProceedingsNone
Item 1A Risk FactorsThere have been no material changes from risk factors previously disclosed in the Company's Annual Report on Form 10-K for the fiscal year endedDecember 31, 2016 in the Section entitled "Risk Factors."
Item 2 Unregistered Sales of Equity Securities and Use of ProceedsNone
Item 3 Defaults Upon Senior SecuritiesNone
Item 4 Mine Safety DisclosuresNot applicable
Item 5 Other InformationNone
33

Table of Contents
Item 6 Exhibits
The following exhibits are filed as part of this report:
Exhibit Number* Description of Exhibits 31(i)(1) Certification of Alfred M. Rankin, Jr. pursuant to Rule 13a-14(a)/15d-14(a) of the Exchange Act31(i)(2) Certification of Kenneth C. Schilling pursuant to Rule 13a-14(a)/15d-14(a) of the Exchange Act32
Certifications pursuant to 18 U.S.C. Section 1350, as adopted pursuant to Section 906 of the Sarbanes-Oxley Act of 2002, signed and dated byAlfred M. Rankin, Jr. and Kenneth C. Schilling
101.INS XBRL Instance Document101.SCH XBRL Taxonomy Extension Schema Document101.CAL XBRL Taxonomy Extension Calculation Linkbase Document101.DEF XBRL Taxonomy Extension Definition Linkbase Document101.LAB XBRL Taxonomy Extension Label Linkbase Document101.PRE XBRL Taxonomy Extension Presentation Linkbase Document* Numbered in accordance with Item 601 of Regulation S-K.
34

Table of Contents
Signatures
Pursuant to the requirements of the Securities Exchange Act of 1934, the registrant has duly caused this report to be signed on its behalf by the undersignedthereunto duly authorized.
Hyster-Yale Materials Handling, Inc.
Date: November 3, 2017 /s/ Kenneth C. Schilling Kenneth C. Schilling
Senior Vice President and Chief Financial Officer (principalfinancial and accounting officer)
35

Exhibit 31(i)(1)
Certifications
I, Alfred M. Rankin, Jr., certify that:
1. I have reviewed this quarterly report on Form 10-Q of Hyster-Yale Materials Handling, Inc.;
2. Based on my knowledge, this report does not contain any untrue statement of a material fact or omit to state a material fact necessary to make thestatements made, in light of the circumstances under which such statements were made, not misleading with respect to the period covered by thisreport;
3. Based on my knowledge, the financial statements, and other financial information included in this report, fairly present in all material respects thefinancial condition, results of operations and cash flows of the registrant as of, and for, the periods presented in this report;
4. The registrant's other certifying officer(s) and I are responsible for establishing and maintaining disclosure controls and procedures (as defined inExchange Act Rules 13a-15(e) and 15d-15(e)) and internal control over financial reporting (as defined in Exchange Act Rules 13a-15(f) and 15d-15(f)) for the registrant and have:
a) Designed such disclosure controls and procedures, or caused such disclosure controls and procedures to be designed under our supervision,to ensure that material information relating to the registrant, including its consolidated subsidiaries, is made known to us by others withinthose entities, particularly during the period in which this report is being prepared;
b) Designed such internal control over financial reporting, or caused such internal control over financial reporting to be designed under oursupervision, to provide reasonable assurance regarding the reliability of financial reporting and the preparation of financial statements forexternal purposes in accordance with generally accepted accounting principles;
c) Evaluated the effectiveness of the registrant's disclosure controls and procedures and presented in this report our conclusions about theeffectiveness of the disclosure controls and procedures, as of the end of the period covered by this report based on such evaluation; and
d) Disclosed in this report any change in the registrant's internal control over financial reporting that occurred during the registrant's mostrecent fiscal quarter (the registrant's fourth fiscal quarter in the case of an annual report) that has materially affected, or is reasonably likelyto materially affect, the registrant's internal control over financial reporting; and
5. The registrant's other certifying officer(s) and I have disclosed, based on our most recent evaluation of internal control over financial reporting, to theregistrant's auditors and the audit committee of the registrant's board of directors (or persons performing the equivalent functions):
a) All significant deficiencies and material weaknesses in the design or operation of internal control over financial reporting which arereasonably likely to adversely affect the registrant's ability to record, process, summarize and report financial information; and
b) Any fraud, whether or not material, that involves management or other employees who have a significant role in the registrant's internalcontrol over financial reporting.
Date: November 3, 2017 /s/ Alfred M. Rankin, Jr. Alfred M. Rankin, Jr.
Chairman, President and Chief Executive Officer (principalexecutive officer)
.

Exhibit 31(i)(2)
Certifications
I, Kenneth C. Schilling, certify that:
1. I have reviewed this quarterly report on Form 10-Q of Hyster-Yale Materials Handling, Inc.;
2. Based on my knowledge, this report does not contain any untrue statement of a material fact or omit to state a material fact necessary to make thestatements made, in light of the circumstances under which such statements were made, not misleading with respect to the period covered by thisreport;
3. Based on my knowledge, the financial statements, and other financial information included in this report, fairly present in all material respects thefinancial condition, results of operations and cash flows of the registrant as of, and for, the periods presented in this report;
4. The registrant's other certifying officer(s) and I are responsible for establishing and maintaining disclosure controls and procedures (as defined inExchange Act Rules 13a-15(e) and 15d-15(e)) and internal control over financial reporting (as defined in Exchange Act Rules 13a-15(f) and 15d-15(f)) for the registrant and have:
a) Designed such disclosure controls and procedures, or caused such disclosure controls and procedures to be designed under our supervision,to ensure that material information relating to the registrant, including its consolidated subsidiaries, is made known to us by others withinthose entities, particularly during the period in which this report is being prepared;
b) Designed such internal control over financial reporting, or caused such internal control over financial reporting to be designed under oursupervision, to provide reasonable assurance regarding the reliability of financial reporting and the preparation of financial statements forexternal purposes in accordance with generally accepted accounting principles;
c) Evaluated the effectiveness of the registrant's disclosure controls and procedures and presented in this report our conclusions about theeffectiveness of the disclosure controls and procedures, as of the end of the period covered by this report based on such evaluation; and
d) Disclosed in this report any change in the registrant's internal control over financial reporting that occurred during the registrant's mostrecent fiscal quarter (the registrant's fourth fiscal quarter in the case of an annual report) that has materially affected, or is reasonably likelyto materially affect, the registrant's internal control over financial reporting; and
5. The registrant's other certifying officer(s) and I have disclosed, based on our most recent evaluation of internal control over financial reporting, to theregistrant's auditors and the audit committee of the registrant's board of directors (or persons performing the equivalent functions):
a) All significant deficiencies and material weaknesses in the design or operation of internal control over financial reporting which arereasonably likely to adversely affect the registrant's ability to record, process, summarize and report financial information; and
b) Any fraud, whether or not material, that involves management or other employees who have a significant role in the registrant's internalcontrol over financial reporting.
Date: November 3, 2017 /s/ Kenneth C. Schilling Kenneth C. Schilling
Senior Vice President and Chief Financial Officer (principalfinancial officer)
Exhibit 32
CERTIFICATION PURSUANT TO 18 U.S.C. SECTION 1350, AS ADOPTED PURSUANT TO SECTION 906 OF THE SARBANES-OXLEY ACT OF2002
In connection with the Quarterly Report of Hyster-Yale Materials Handling, Inc. (the "Company") on Form 10-Q for the quarter ended September 30, 2017 , asfiled with the Securities and Exchange Commission on the date hereof (the "Report"), each of the undersigned officers of the Company certifies, pursuant to 18U.S.C. § 1350, as adopted pursuant to § 906 of the Sarbanes-Oxley Act of 2002, that, to such officer's knowledge:
(1) The Report fully complies with the requirements of Section 13(a) or 15(d) of the Securities Exchange Act of 1934; and
(2) The information contained in the Report fairly presents, in all material respects, the financial condition and results of operations of theCompany as of the dates and for the periods expressed in the Report.
Date: November 3, 2017 /s/ Alfred M. Rankin, Jr. Alfred M. Rankin, Jr.
Chairman, President and Chief Executive Officer (principalexecutive officer)
Date: November 3, 2017 /s/ Kenneth C. Schilling Kenneth C. Schilling
Senior Vice President and Chief Financial Officer (principalfinancial officer)


![Glycosylation-dependent Collagen-binding Activities of Two …cancerres.aacrjournals.org/content/canres/48/17/4743... · (CANCER RESEARCH 48, 4743-4748, September 1, 1988] Glycosylation-dependent](https://img.dokumen.tips/doc/110x75/5e44cb33a5c756777e467286/glycosylation-dependent-collagen-binding-activities-of-two-cancer-research-48.jpg)