Embed Size (px)
Citation preview

Hypertriglyceridemia
CVD Risk Assessment
and Management
Strategies in Women
Gregory S. Pokrywka, MD, FACP, FNLA, NCMP
Assistant Professor of Medicine
Johns Hopkins University School of Medicine
Director, Baltimore Lipid Center
Diplomate, American Board of Clinical Lipidology
Baltimore, MD
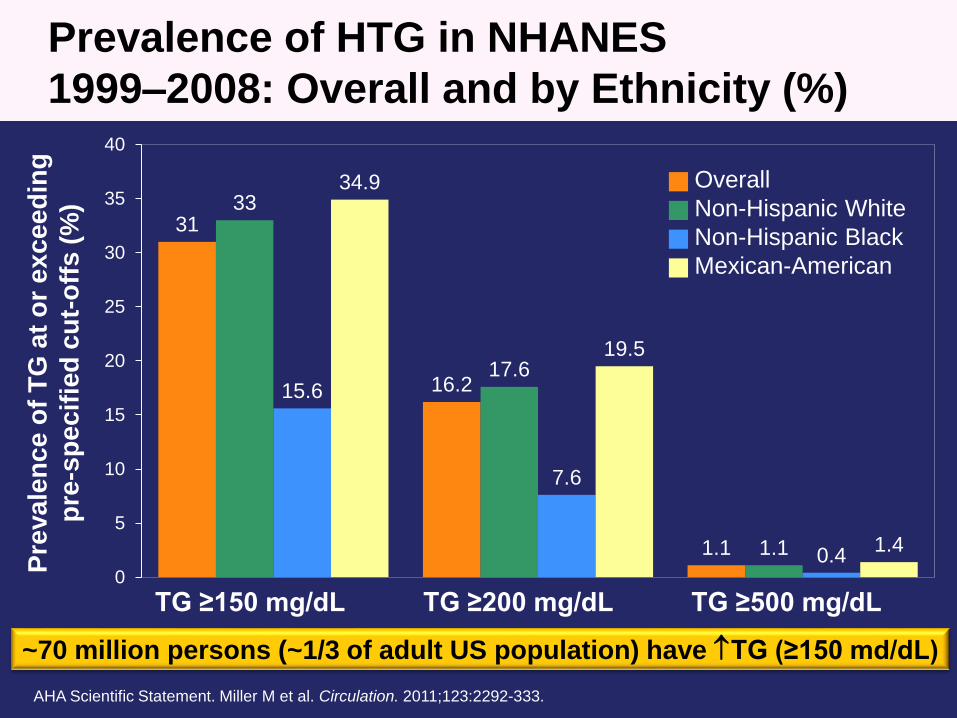
Prevalence of HTG in NHANES
1999–2008: Overall and by Ethnicity (%)
AHA Scientific Statement. Miller M et al. Circulation. 2011;123:2292-333.
31
16.2
1.1
33
17.6
1.1
15.6
7.6
0.4
34.9
19.5
1.4
0
5
10
15
20
25
30
35
40
TG ≥150 mg/dL TG ≥200 mg/dL TG ≥500 mg/dL
~70 million persons (~1/3 of adult US population) have TG (≥150 md/dL)
Pre
va
len
ce
of
TG
at
or
ex
ce
ed
ing
pre
-sp
ecif
ied
cu
t-o
ffs
(%
)
Overall
Non-Hispanic White
Non-Hispanic Black
Mexican-American

Components, Size, and Density of Human
Serum Lipoproteins
Genest J, Libby P. Lipoprotein Disorders and Cardiovascular Disease. Braunwald’s Heart Disease: a textbook of cardiovascular
medicine, tenth edition. Elsevier 2014, Chapter 45.
Structural components of lipoproteins
Apolipoprotein B
Phospholipid
Triglyceride
Cholesterol
Cholesteryl ester
Apolipoprotein C
Apolipoprotein E
Relation to diameter and density
Chylomicron
VLDL
IDL
LDL
HDL2
HDL3
Chylomicron
remnant
0.95
De
ns
ity (
g/m
L)
1.01
1.02
1.06
1.10
1.20
5 10 20 40 60 80 1000
Diameter (nm)Apolipoproteins (A-I, A-II, A-IV, A-V, B48, B100, C-I, C-II, C-III, C-IV)
• Assist in structural integrity and solubility
• Serve as co-factors in enzymatic reactions
• Act as ligands
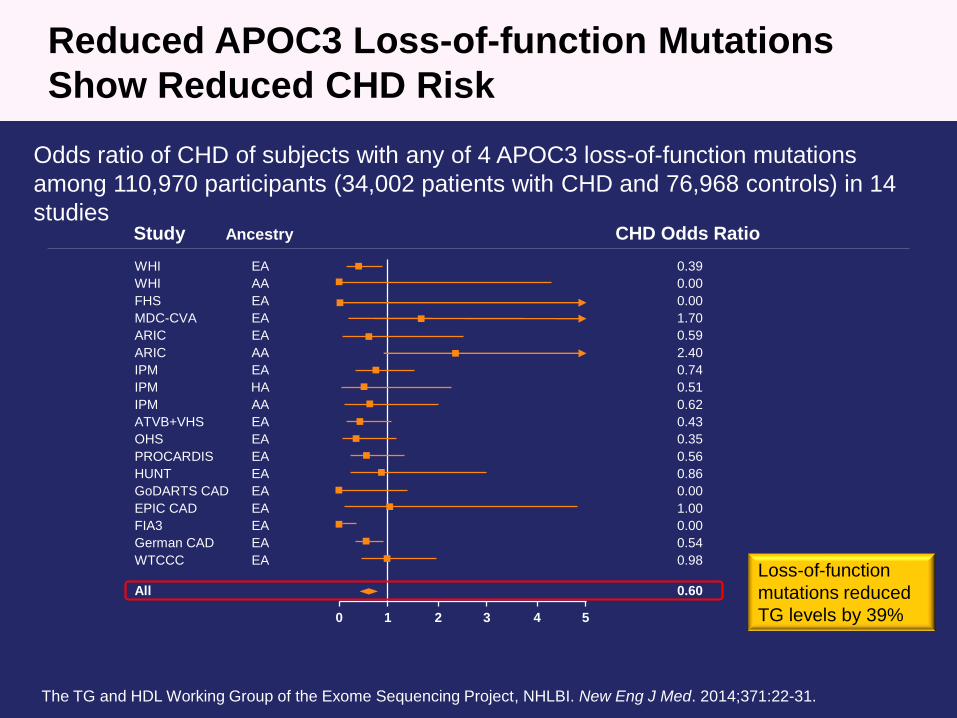
Reduced APOC3 Loss-of-function Mutations
Show Reduced CHD Risk
The TG and HDL Working Group of the Exome Sequencing Project, NHLBI. New Eng J Med. 2014;371:22-31.
Loss-of-function
mutations reduced
TG levels by 39%
Odds ratio of CHD of subjects with any of 4 APOC3 loss-of-function mutations
among 110,970 participants (34,002 patients with CHD and 76,968 controls) in 14
studiesStudy Ancestry CHD Odds Ratio
WHI EA 0.39
WHI AA 0.00
FHS EA 0.00
MDC-CVA EA 1.70
ARIC EA 0.59
ARIC AA 2.40
IPM EA 0.74
IPM HA 0.51
IPM AA 0.62
ATVB+VHS EA 0.43
OHS EA 0.35
PROCARDIS EA 0.56
HUNT EA 0.86
GoDARTS CAD EA 0.00
EPIC CAD EA 1.00
FIA3 EA 0.00
German CAD EA 0.54
WTCCC EA 0.98
All 0.60
0 1 2 3 4 5

PROVE IT-
TIMI 22 Trialb
TG ≥150 mg/dL Predicts Higher CHDa Risk in
Statin Takers with LDL-C <70 mg/dL
CH
D E
ven
t R
ate
aft
er
30 D
ays
c(%
)
a. Death, MI, and recurrent ACS. b. ACS patients on atorvastatin 80 mg or pravastatin 40 mg. c. Adjusted for age, gender, low
HDL-C, smoking, hypertension (HTN), obesity, diabetes, prior statin therapy, prior ACS, peripheral vascular disease, and
treatment. CHD=coronary heart disease; HR=hazard ratio; PROVE IT-TIMI=Pravastatin or Atorvastatin Evaluation and
Infection Therapy Thrombolysis In Myocardial Infarction. Miller M et al. J Am Coll Cardiol. 2008;51:724-30.
(N=4162)
11.7%
16.5%
TG <150 mg/dL TG ≥150 mg/dL
LDL-C <70 mg/dL
HR: 0.72
P=0.017
HR: 0.84
P=0.192
Referent
LDL-C ≥70 mg/dL
TG ≥150 mg/dL
Event Rate=17.9%
0
10
15
20
5

Increasing TG Levels Increase Risk of
Pancreatitis
• Pancreatitis risk increases 4% for every 100 mg/dL increase in TG above 500 mg/dL*
0.0
0.5
1.0
1.5
2.0
2.5
Crude Incidence (cases/1000 pt-yr)
Triglycerides (mg/dL)
*After adjustment for covariates and removal of patients hospitalized for gallstones, chronic
pancreatitis, alcohol-related morbidities, renal failure, and other biliary disease.
Murphy MJ et al. JAMA Intern Med. 2013;173:162-4.
≤150(n=31,740)
150-499(n=31,887)
≥500(n=3642)
Group 1
Group 2
Group 3

How Should We Use Lipid
Measures, Including
Triglycerides, to Assess CV
Risk in Patients with
Dyslipidemia?
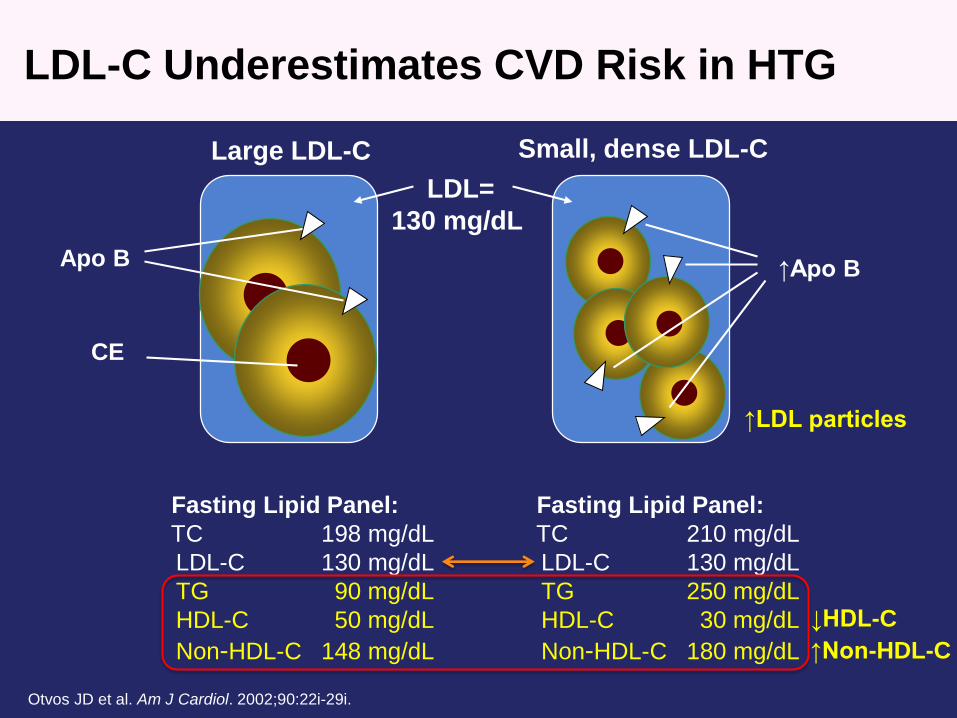
LDL-C Underestimates CVD Risk in HTG
Apo B
LDL=
130 mg/dL
Large LDL-C Small, dense LDL-C
CE
Otvos JD et al. Am J Cardiol. 2002;90:22i-29i.
Fasting Lipid Panel:
TC 198 mg/dL
LDL-C 130 mg/dL
TG 90 mg/dL
HDL-C 50 mg/dL
Non-HDL-C 148 mg/dL
Fasting Lipid Panel:
TC 210 mg/dL
LDL-C 130 mg/dL
TG 250 mg/dL
HDL-C 30 mg/dL
Non-HDL-C 180 mg/dL
↑Apo B
↑Non-HDL-C
↑LDL particles
↓HDL-C

NLA: Treatment Goals for Non-HDL-C,
LDL-C, and Apo B
Risk Category Treatment Goal (mg/dL)
Non-HDL-C LDL-C Apo B
Low <130 <100 <90
Moderate <130 <100 <90
High <130 <100 <90
Very High <100 <70 <80
Jacobson TA et al. J Clin Lipidol. 2014;8:473-88.

2013 ACC/AHA Cholesterol Guideline* Was
Not Charged to Review HTG
• “Although elevations in LDL-C often occur
simultaneously with elevated triglyceride levels,
the Panel did not conduct a systematic review on
lifestyle and drug therapies for the treatment of
elevated triglyceride levels.”
• “Management of individuals with fasting
triglycerides >500 mg/dL has been addressed in
an AHA statementӠ
*Stone NJ et al. Circulation. 2014;129:S1-45. †Miller M et al. Circulation. 2011;123:2292-333.

NLA: Drug Therapy For TG Reduction
• A drug targeting TG reduction should be considered for
first-line therapy in those with TG ≥500 mg/dL
– TG-lowering drug therapies include fibric acids, high-dose long-
chain omega-3 fatty acids, and nicotinic acid
– A statin may be a reasonable first-line agent if the TG
concentration is ≥500 mg/dL, but <1000 mg/dL, if no history of
pancreatitis
• Combination therapy with a statin plus a second (or third)
agent may be considered for patients who have not
reached their treatment goals for atherogenic cholesterol
levels, particularly in those at high and very high risk
Jacobson TA et al. J Clin Lipidol. 2014;8:473-88.

National Lipid Association (NLA): Targets
of Therapy – Triglycerides
• An elevated TG level is not a target of therapy per
se, except when very high (severe; ≥500 mg/dL)
• When TG levels are between 200–499 mg/dL, the
targets of therapy are non-HDL-C and LDL-C
• When the TG concentration is very high (≥500
mg/dL, and especially if ≥1000 mg/dL), reducing the
concentration to <500 mg/dL to prevent pancreatitis
becomes the primary goal of therapy
– Very similar to ATP III
Jacobson TA et al. J Clin Lipidol. 2014;8:473-88.

Treating Underlying Factors of HTG
• Obtain Hx of diet (calories, fat, sugar, and ethanol
consumed) and physical activity
• Measure BMI (waist circumference), TSH, A1c, UA
• Prescribe less calories, sugar, ethanol, and fat. Prescribe
more physical activity
• Treat underlying co-morbidities
• Address TG-raising medications
Bays HE. In: Kwiterovich PO Jr, ed. The Johns Hopkins Textbook of Dyslipidemia.
1st ed. Lippincott Williams & Wilkins;2010:245-57.
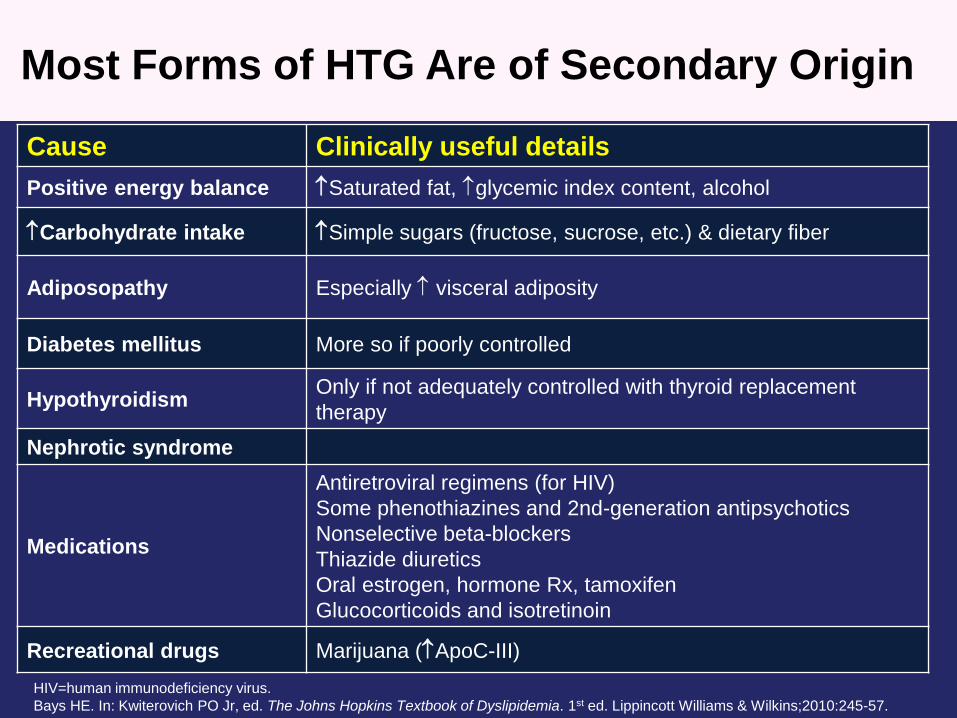
Most Forms of HTG Are of Secondary Origin
HIV=human immunodeficiency virus.
Bays HE. In: Kwiterovich PO Jr, ed. The Johns Hopkins Textbook of Dyslipidemia. 1st ed. Lippincott Williams & Wilkins;2010:245-57.
Cause Clinically useful details
Positive energy balance Saturated fat, glycemic index content, alcohol
Carbohydrate intake Simple sugars (fructose, sucrose, etc.) & dietary fiber
Adiposopathy Especially visceral adiposity
Diabetes mellitus More so if poorly controlled
HypothyroidismOnly if not adequately controlled with thyroid replacement
therapy
Nephrotic syndrome
Medications
Antiretroviral regimens (for HIV)
Some phenothiazines and 2nd-generation antipsychotics
Nonselective beta-blockers
Thiazide diuretics
Oral estrogen, hormone Rx, tamoxifen
Glucocorticoids and isotretinoin
Recreational drugs Marijuana (ApoC-III)
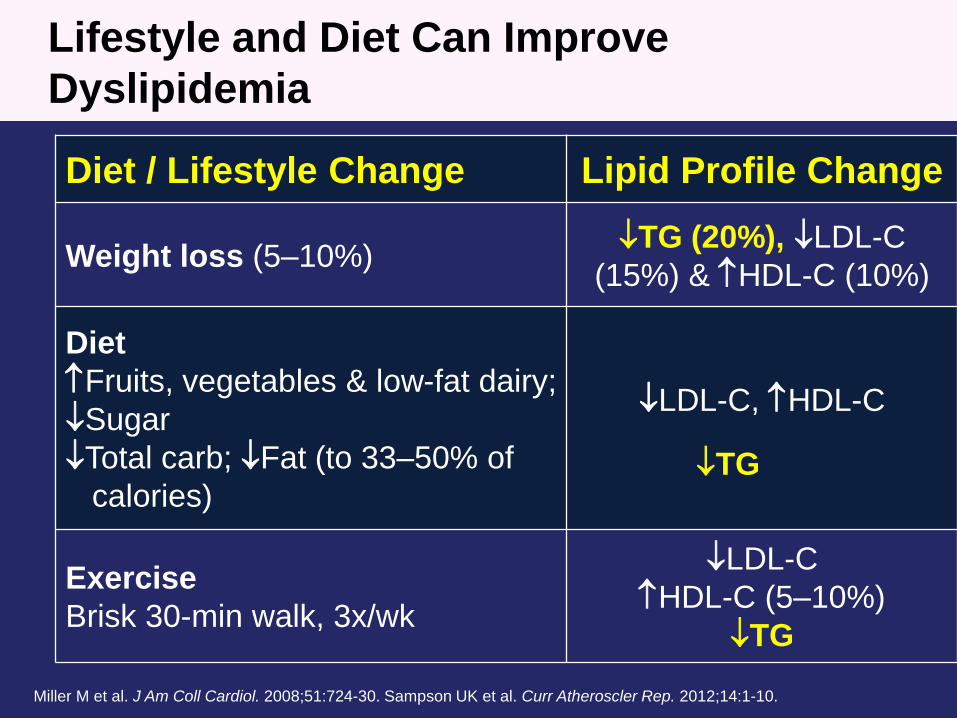
Lifestyle and Diet Can Improve
Dyslipidemia
Diet / Lifestyle Change Lipid Profile Change
Weight loss (5–10%)TG (20%), LDL-C
(15%) & HDL-C (10%)
Diet
Fruits, vegetables & low-fat dairy;
Sugar
Total carb; Fat (to 33–50% of
calories)
LDL-C, HDL-C
Exercise
Brisk 30-min walk, 3x/wk
LDL-C
HDL-C (5–10%)
TG
Miller M et al. J Am Coll Cardiol. 2008;51:724-30. Sampson UK et al. Curr Atheroscler Rep. 2012;14:1-10.
TG
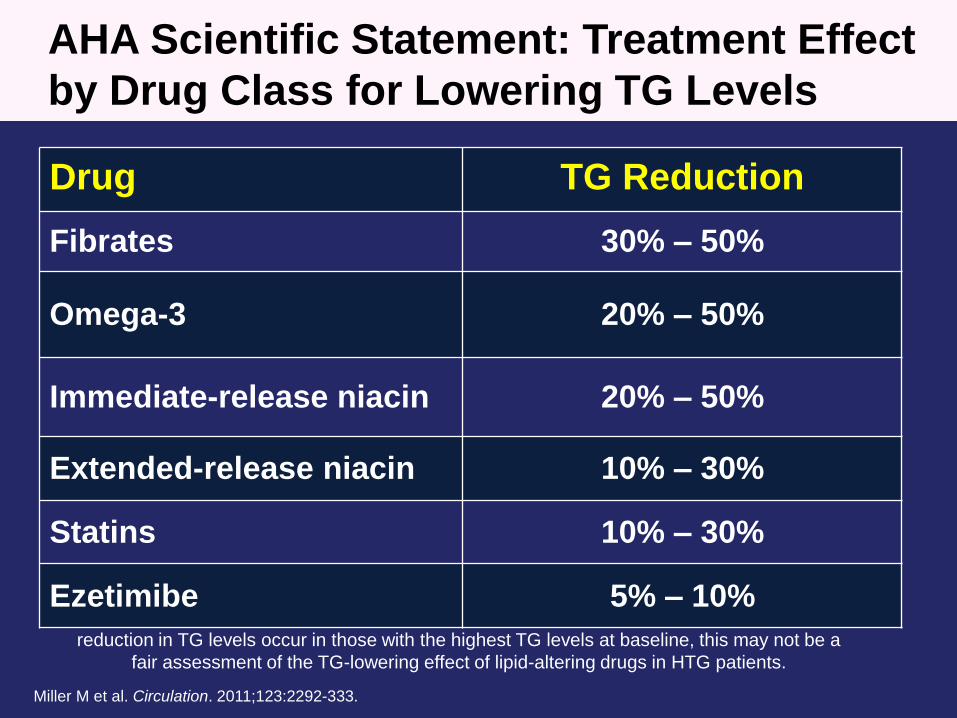
TG reduction values are not always corrected for baseline TG levels. Given that the greatest
reduction in TG levels occur in those with the highest TG levels at baseline, this may not be a
fair assessment of the TG-lowering effect of lipid-altering drugs in HTG patients.
AHA Scientific Statement: Treatment Effect
by Drug Class for Lowering TG Levels
Drug TG Reduction
Fibrates 30% – 50%
Omega-3 20% – 50%
Immediate-release niacin 20% – 50%
Extended-release niacin 10% – 30%
Statins 10% – 30%
Ezetimibe 5% – 10%
Miller M et al. Circulation. 2011;123:2292-333.
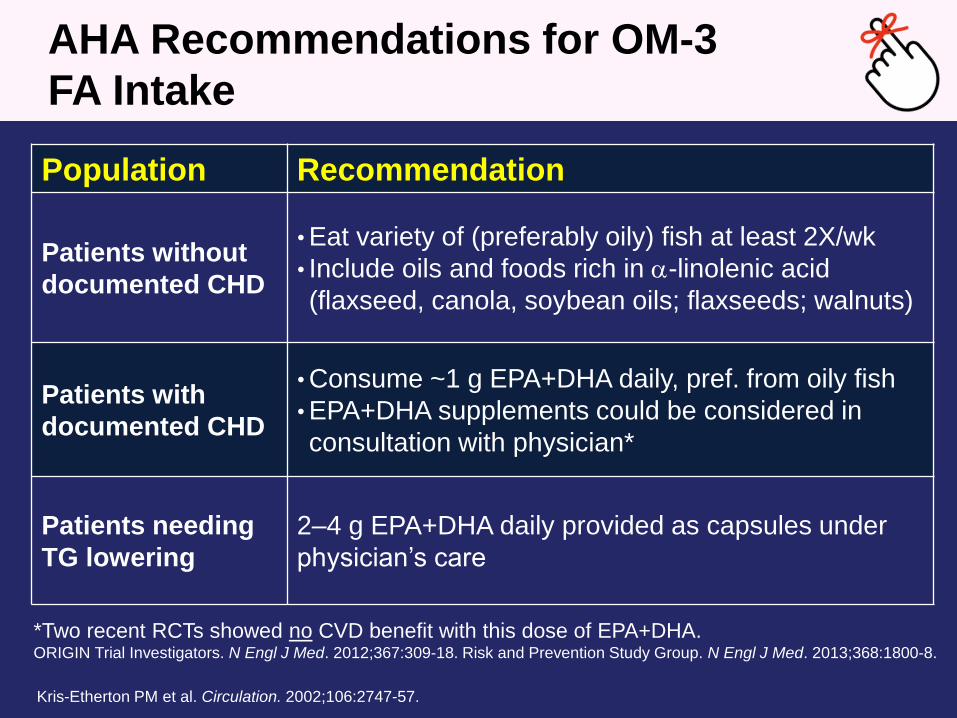
AHA Recommendations for OM-3
FA Intake
Kris-Etherton PM et al. Circulation. 2002;106:2747-57.
Population Recommendation
Patients without
documented CHD
• Eat variety of (preferably oily) fish at least 2X/wk
• Include oils and foods rich in -linolenic acid
(flaxseed, canola, soybean oils; flaxseeds; walnuts)
Patients with
documented CHD
• Consume ~1 g EPA+DHA daily, pref. from oily fish
• EPA+DHA supplements could be considered in
consultation with physician*
Patients needing
TG lowering
2–4 g EPA+DHA daily provided as capsules under
physician’s care
*Two recent RCTs showed no CVD benefit with this dose of EPA+DHA.ORIGIN Trial Investigators. N Engl J Med. 2012;367:309-18. Risk and Prevention Study Group. N Engl J Med. 2013;368:1800-8.

Statin + EPA: MARINE Trial Lipid Efficacy
TG >500 mg/dL
Me
dia
n P
lac
eb
o-a
dju
ste
d C
ha
ng
e (
%)
ITT Population
*P<0.0001. †P<0.001. ‡P<0.01. NS = P≥0.05. P-values reflect differences between EPA vs placebo.
ITT=intention to treat; Lp-PLA=lipoprotein-associated phospholipase A; MARINE=Multi-center, Placebo-controlled,
Randomized, Double-blind, 12-week Study with an Open-label Extension. Bays HE et al. Am J Cardiol. 2011;108:682-90.
-33.1
-17.7-16.3
-28.6
-3.6-2.3
-8.5
-13.6
-25.8
-35
-30
-25
-20
-15
-10
-5
0
* EPA 4 g/day
Non-
HDL-CTG TC
*
†
VLDL-C HDL-C
NS
LDL-C
NS
Apo B
‡
Lp-PLA2
†
VLDL-TG
‡
*
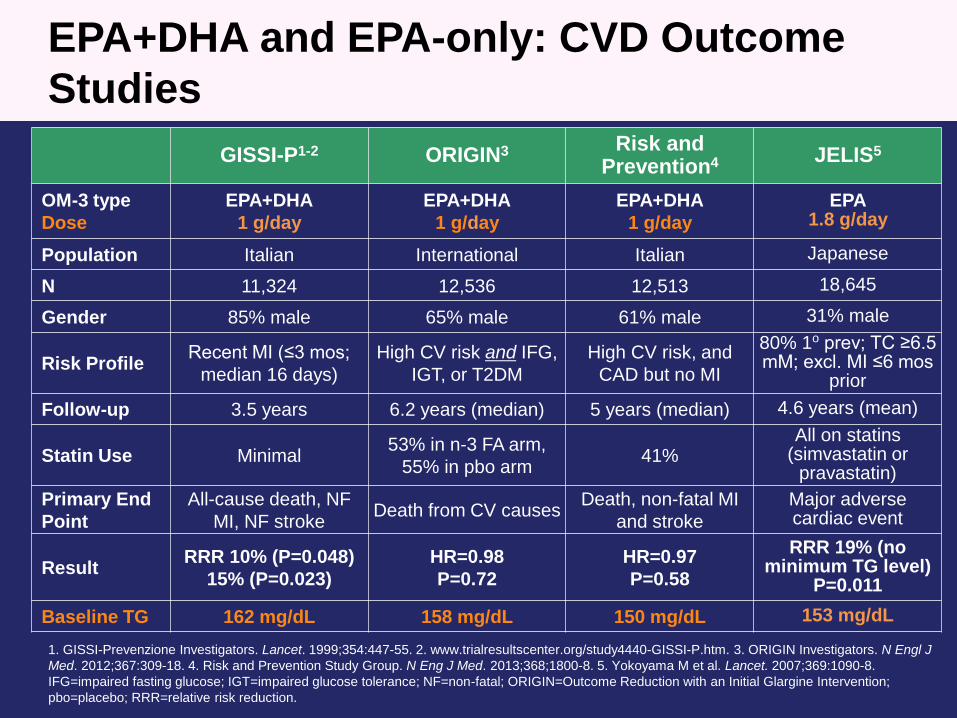
EPA+DHA and EPA-only: CVD Outcome
Studies
1. GISSI-Prevenzione Investigators. Lancet. 1999;354:447-55. 2. www.trialresultscenter.org/study4440-GISSI-P.htm. 3. ORIGIN Investigators. N Engl J
Med. 2012;367:309-18. 4. Risk and Prevention Study Group. N Eng J Med. 2013;368;1800-8. 5. Yokoyama M et al. Lancet. 2007;369:1090-8.
IFG=impaired fasting glucose; IGT=impaired glucose tolerance; NF=non-fatal; ORIGIN=Outcome Reduction with an Initial Glargine Intervention;
pbo=placebo; RRR=relative risk reduction.
GISSI-P1-2 ORIGIN3 Risk and Prevention4 JELIS5
OM-3 type
Dose
EPA+DHA
1 g/day
EPA+DHA
1 g/day
EPA+DHA
1 g/day
EPA1.8 g/day
Population Italian International Italian Japanese
N 11,324 12,536 12,513 18,645
Gender 85% male 65% male 61% male 31% male
Risk ProfileRecent MI (≤3 mos;
median 16 days)
High CV risk and IFG,
IGT, or T2DM
High CV risk, and
CAD but no MI
80% 1o prev; TC ≥6.5 mM; excl. MI ≤6 mos
prior
Follow-up 3.5 years 6.2 years (median) 5 years (median) 4.6 years (mean)
Statin Use Minimal53% in n-3 FA arm,
55% in pbo arm41%
All on statins(simvastatin or
pravastatin)
Primary End
Point
All-cause death, NF
MI, NF strokeDeath from CV causes
Death, non-fatal MI
and stroke
Major adverse cardiac event
ResultRRR 10% (P=0.048)
15% (P=0.023)
HR=0.98
P=0.72
HR=0.97
P=0.58
RRR 19% (no minimum TG level)
P=0.011
Baseline TG 162 mg/dL 158 mg/dL 150 mg/dL 153 mg/dL

JELIS: EPA Reduced Major Coronary Events*
in Hypercholesterolemic Patients on Statins
Yokoyama M et al. Lancet. 2007;369:1090-8.
No. at Risk
Control
EPA
0 1 4 5 Years
9319 8931 8671 8433 8192 7958
9326 8929 8658 8389 8153 7924
Cu
mu
lati
ve I
ncid
en
ce o
f M
ajo
r
Co
ron
ary
Even
ts
(%)
4
P=0.011
Statin + EPA 1.8g/day
Statin only3
2
1
0
HR (95% CI): 0.81 (0.69–0.95)
↓
2 3
–19%
N=18,645 Japanese pts with TC ≥251 mg/dL prior to baseline statin Rx. Baseline TG=153 mg/dL.
Statin up-titrated to 20 mg pravastatin or 10 mg simvastatin for LDL-C control.
*Primary endpoint: sudden cardiac death, fatal and non-fatal MI, unstable angina pectoris,
angioplasty, stenting, or coronary artery bypass graft.

*Pre-specified. MACE=major adverse CV event. Saito Y et al. Atherosclerosis. 2008;200:135-40.
JELIS: Larger Decrease in MACE in those with
TG >150 mg/dL & HDL-C <40 mg/dL*
HR and P-value
adjusted for age,
gender, smoking,
diabetes, and HTN
No. of patients
Control 475 444 432 414 400 392
EPA 482 455 443 427 413 403
0 1 2 3 4 5 Years
Cu
mu
lati
ve i
ncid
en
ce o
f m
ajo
r
co
ron
ary
eve
nts
(%
)
EPA 1.8 gm/day group
Control group–53%
HR: 0.47
95% CI: 0.23–0.98
P=0.043
5.0
4.0
3.0
2.0
1.0
0
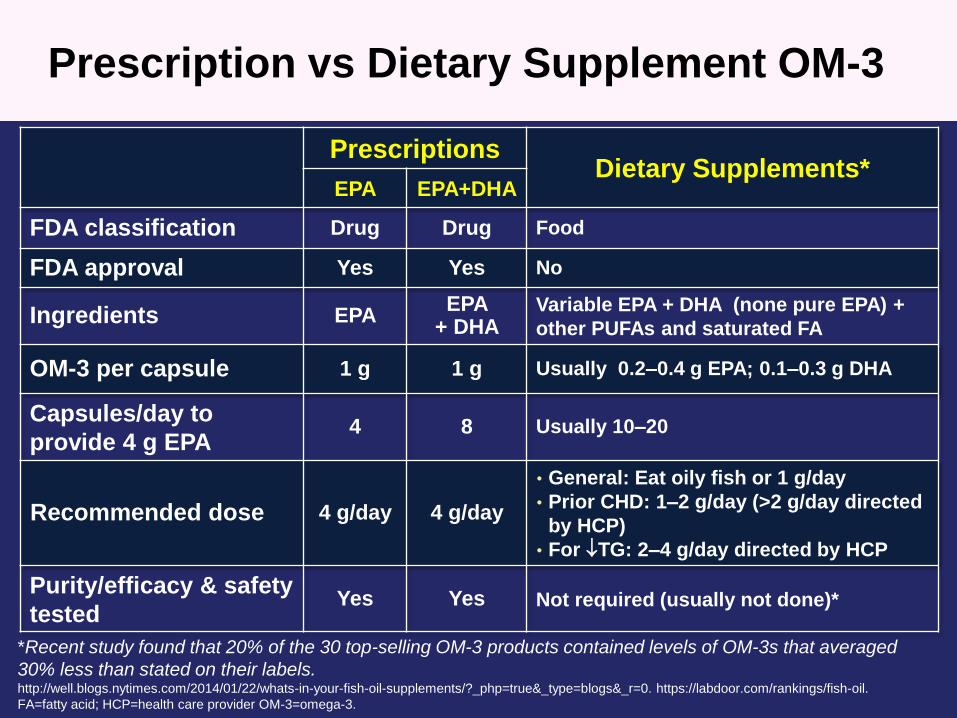
Prescription vs Dietary Supplement OM-3
PrescriptionsDietary Supplements*
EPA EPA+DHA
FDA classification Drug Drug Food
FDA approval Yes Yes No
Ingredients EPAEPA
+ DHAVariable EPA + DHA (none pure EPA) +
other PUFAs and saturated FA
OM-3 per capsule 1 g 1 g Usually 0.2–0.4 g EPA; 0.1–0.3 g DHA
Capsules/day to
provide 4 g EPA4 8 Usually 10–20
Recommended dose 4 g/day 4 g/day
• General: Eat oily fish or 1 g/day
• Prior CHD: 1–2 g/day (>2 g/day directed
by HCP)
• For TG: 2–4 g/day directed by HCP
Purity/efficacy & safety
testedYes Yes Not required (usually not done)*
*Recent study found that 20% of the 30 top-selling OM-3 products contained levels of OM-3s that averaged
30% less than stated on their labels. http://well.blogs.nytimes.com/2014/01/22/whats-in-your-fish-oil-supplements/?_php=true&_type=blogs&_r=0. https://labdoor.com/rankings/fish-oil.
FA=fatty acid; HCP=health care provider OM-3=omega-3.
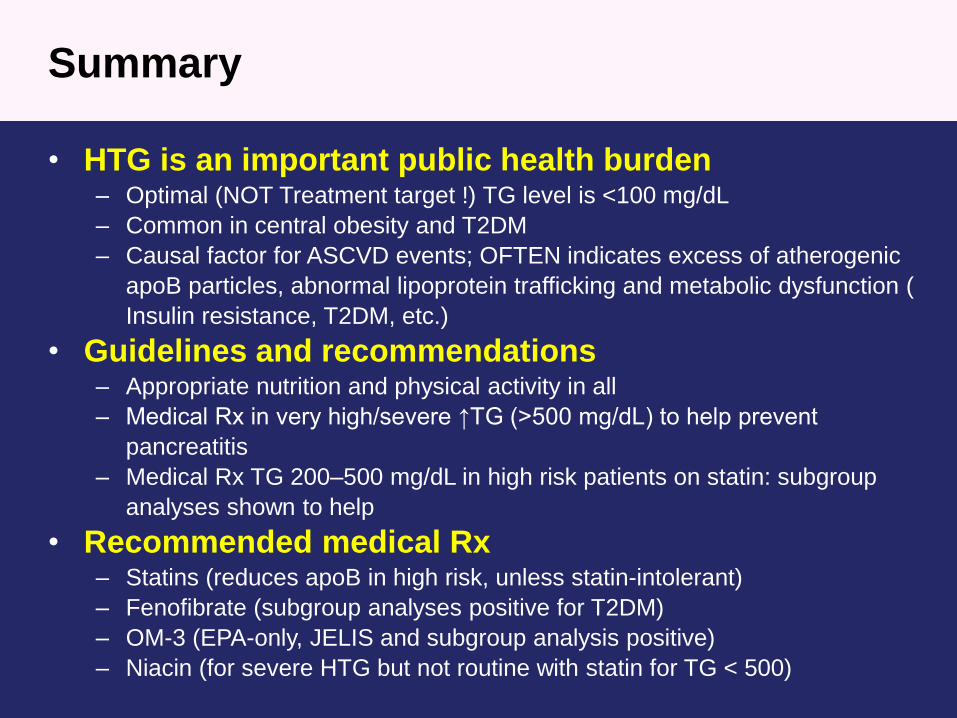
Summary
• HTG is an important public health burden – Optimal (NOT Treatment target !) TG level is <100 mg/dL
– Common in central obesity and T2DM
– Causal factor for ASCVD events; OFTEN indicates excess of atherogenic
apoB particles, abnormal lipoprotein trafficking and metabolic dysfunction (
Insulin resistance, T2DM, etc.)
• Guidelines and recommendations– Appropriate nutrition and physical activity in all
– Medical Rx in very high/severe ↑TG (>500 mg/dL) to help prevent
pancreatitis
– Medical Rx TG 200–500 mg/dL in high risk patients on statin: subgroup
analyses shown to help
• Recommended medical Rx– Statins (reduces apoB in high risk, unless statin-intolerant)
– Fenofibrate (subgroup analyses positive for T2DM)
– OM-3 (EPA-only, JELIS and subgroup analysis positive)
– Niacin (for severe HTG but not routine with statin for TG < 500)