Embed Size (px)
Citation preview


ปัจจุบันทั่วโลกกำลังเผชิญกับปัญหาวิกฤตด้านพลังงานและสิ่งแวดล้อม อันเนื่องมาจากการใช้ทรัพยากรธรรมชาติในปริมาณที่มากเกินขนาด และขาดการจัดการ ที่ถูกต้องเหมาะสม ก่อให้เกิดภาวะโลกร้อน (Global Warming) และการเปลี่ยนแปลงสภาพ ภูมิอากาศ (Climate Change) ที่รุนแรงตามมา ทำให้ประชาคมโลกเริ่มตระหนักและสร้างมาตรการต่างๆ เพื่อลดปัญหาด้านสิ่งแวดล้อม การพัฒนาพลังงานสะอาด (Clean Energy) พลังงานทดแทน (Renewable Energy) และพลังงานทางเลือก (Alternative Energy) ถือได้ว่าเป็นมาตรการหนึ่งที่ทั่วโลกได้คำนึงถึงและให้ความสำคัญกันอย่างมาก ไฟฟ้าพลังน้ำ (Hydropower) เป็นพลังงานสะอาดประเภทหนึ่งที่มีศักยภาพสูง และในปัจจุบันมีการลงทุนโดยภาคเอกชน ในประเทศเพื่อนบ้าน ผลิตและนำเข้ามาจำหน่ายให้กับหน่วยงานที่มีหน้าที่ผลิตและจำหน่ายไฟฟ้าในประเทศไทย
กลุ่มบริษัททีม เป็นกลุ่มบริษัทที่ปรึกษาที่มีความเชี่ยวชาญในหลากหลายสาขา โดยเฉพาะด้านโครงสร้างพื้นฐาน ได้เข้าไปมีบทบาทมีส่วนร่วมสนับสนุนภาครัฐและเอกชนในการดำเนินการโครงการพัฒนาต่างๆ มากมายโดยเฉพาะอย่างยิ่งการพัฒนาโครงการด้านแหล่งน้ำ ที่ได้บูรณาการความรู้ความชำนาญ เทคโนโลยี และประสบการณ์กว่า 32 ปี ในการพัฒนาด้านแหล่งน้ำ เขื่อนไฟฟ้าพลังน้ำ การแก้ไขปัญหาน้ำท่วมและระบบระบายน้ำ ทั้งในประเทศไทยและประเทศแถบภูมิภาคนี้ ที่ภาคภูมิใจคือการเข้าไปมีส่วนร่วม ในโครงการไฟฟ้าพลังน้ำหลายโครงการโดยเฉพาะอย่างยิ่งที่ประเทศสาธารณรัฐประชาธิปไตยประชาชนลาว

การก่อสร้างเขื่อนและโรงไฟฟ้าพลังน้ำนั้น สามารถผลิตพลังงานไฟฟ้าในลักษณะพลังงานหมุนเวียนที่สะอาดและยั่งยืน นำกลับมาใช้ใหม่ได้ โดยส่งผลกระทบต่อสภาพแวดล้อมน้อยที่สุดเมื่อเทียบกับโรงไฟฟ้าชนิดอื่น ในการพัฒนาโครงการไฟฟ้าพลังน้ำนั้น กลุ่มบริษัททีมได้ให้บริการที่ปรึกษาตั้งแต่การศึกษาแผนแม่บทในการพัฒนา การคัดเลือกโครงการที่มีความเป็นไปได้ทางด้านเทคนิค เศรษฐกิจ วิศวกรรม การออกแบบเขื่อน โรงไฟฟ้า อุโมงค์ และองค์ประกอบต่างๆ ของโครงการ การประเมินราคา การทำรายงานด้านการศึกษาผลกระทบด้านสิ่งแวดล้อม (EIA) การศึกษาผลกระทบด้านสังคม (SIA) การจัดทำแผนการอพยพย้ายถิ่นฐาน (RAP) และการจัดทำแผนการจัดการด้านสิ่งแวดล้อม (EMP) รวมถึงกำหนดแผนการดำเนินงาน ตลอดจนจัดเตรียมเอกสารการประมูลและสัญญาให้แก่โครงการ การประเมินผลและคัดเลือกผู้รับจ้าง การบริหารการก่อสร้าง และควบคุมการก่อสร้าง ตลอดจนการดำเนินการตามแผนงานด้านสิ่งแวดล้อมหลังการก่อสร้างแล้วเสร็จ
กลุ่มบริษัททีม ไม่เพียงแต่มุ่งเน้นความเป็นเลิศทางบริการ แต่ยังให้ความสำคัญต่อการพัฒนาอย่างยั่งยืน ด้วยตระหนักในความสำคัญของการเผยแพร่องค์ความรู้ จึงได้จัดทำหนังสือ “Hydropower: พลังน้ำกับการผลิตพลังงานไฟฟ้า” ขึ้น หนังสือ เล่มนี้เป็นการรวบรวมข้อเขียนบทความของผู้ทรงคุณวุฒิผู้เชี่ยวชาญด้านแหล่งน้ำและ ที่เกี่ยวข้องกับการพัฒนาโครงการไฟฟ้าพลังน้ำ นำมาตีพิมพ์เผยแพร่ข้อมูลที่เป็นประโยชน์แก่ผู้เกี่ยวข้องที่มีความสนใจได้เล็งเห็นถึงความสำคัญและโอกาสในการพัฒนาไฟฟ้าพลังน้ำต่อไปในอนาคต
ดร.ประเสริฐ ภัทรมัย ประธานกรรมการบริหาร กลุ่มบริษัททีม
คำนำ
วิกฤตพลังงานและสิ่งแวดล้อมที่ทั่วโลกกำลังเผชิญอยู่ทุกวันนี้ เป็นผลมาจาก การใช้พลังงานและทรัพยากรธรรมชาติอย่างไม่มีประสิทธิภาพและถูกวิธี ก่อให้เกิดปัญหามลพิษมากมาย รวมถึงปัญหาโลกร้อน (Global Warming) หลายประเทศได้ตระหนัก ให้ความสำคัญและรณรงค์การประหยัดการใช้ทรัพยากรและพลังงานอย่างคุ้มค่า และเสาะแสวงหาแหล่งพลังงานทดแทนอื่นๆ เพื่อการใช้สอยต่อไปในอนาคตจนทำให้เกิดการพัฒนาแบบสีเขียว (GREEN) มากขึ้น กระแส สีเขียว (Going GREEN) จึงมีการพูดกันอย่างแพร่หลายในทุกวงการ และสื่อไปถึงตัวแทนของการพัฒนาที่ห่วงใยต่อทรัพยากรธรรมชาติและสิ่งแวดล้อม ในการใช้อย่างเหมาะสม พอเพียง ก่อให้เกิดประโยชน์สูงสุด และต้องเก็บรักษาไว้ใช้ในอนาคตด้วย เพื่อให้เกิดความยั่งยืนนั่นเอง
การใช้พลังงานในโลกของมนุษย์มีมาตั้งแต่สมัยดึกดำบรรพ์ เช่น มนุษย์รู้จักใช้พลังงานลมเพื่อการวิดน้ำ พลังน้ำเพื่อใช้ในการสีข้าว หมุนกังหัน ต่อมาในช่วงหลังยุคปฏิวัติอุตสาหกรรม โลกเริ่มมีการใช้พลังงานโดยเฉพาะพลังงานจากฟอสซิล (fossil) เช่น ถ่านหิน น้ำมัน และก๊าซธรรมชาติ อย่างไร้ขีดจำกัด ทำให้เกิดการขาดแคลนและยังเป็นอันตรายต่อสิ่งแวดล้อมก่อให้เกิดมลพิษทางอากาศมากมายตามมา
การผลิตพลังงานของประเทศไทย โดยเฉพาะพลังงานไฟฟ้านั้น มีการนำเข้าเชื้อเพลิงวัตถุดิบมาจากต่างประเทศ ทำให้ต้องสูญเสียเงินตราต่างประเทศเป็นจำนวนมาก ทำให้เกิดภาวะขาดดุลการค้า เพื่อสนองตอบต่อความต้องการที่เพิ่มสูงขึ้นตลอดเวลาทุกปี ตามอัตราการเติบโตของผลิตภัณฑ์มวลรวมในประเทศ (Gross Domestic Product: GDP) ที่สำคัญ ประเทศไทยไม่มีแหล่ง เชื้อเพลิงในประเทศเพียงพอ เว้นเสียแต่ว่ามีแหล่งพลังงานหมุนเวียนธรรมชาติ (Renewable Energy) อื่นๆ เช่น พลังงานคลื่น ลม น้ำ แสงอาทิตย์ ความร้อนจากใต้ดิน หรือแม้แต่พลังงานทดแทน เช่น นิวเคลียร์ ไฮโดรเจน ก๊าซชีวภาพ ชีวมวล และไบโอดีเซล มาใช้ทดแทนการใช้เชื้อเพลิงฟอสซิล
สถานการณ์การใช้พลังงานของประเทศไทย ในปี 2552 มีการใช้พลังงานขั้นสุดท้าย 66.3 ล้านตัน เทียบกับน้ำมันดิบ (ktoe) เพิ่มขึ้นจากช่วงเวลาเดียวกันในปี 2551 ร้อยละ 0.7 คิดเป็นมูลค่าการใช้พลังงาน 1.03 ล้านล้านบาท โดยมีการใช้น้ำมันสำเร็จรูปในสัดส่วนที่สูงถึงร้อยละ 47.7 ของการใช้พลังงานทั้งหมด ในขณะที่ปริมาณการใช้พลังงานทดแทนมีจำนวนไม่สูงมากนักเพียงร้อยละ 18.8 ใช้ในรูปของพลังงานไฟฟ้าร้อยละ 17.4 ถ่านหิน/ลิกไนต์ร้อยละ 10.7 และก๊าซธรรมชาติร้อยละ 5.4
และจากแผนยุทธศาสตร์ด้านพลังงานของรัฐบาล ที่ได้มุ่งเน้นส่งเสริมประสิทธิภาพและประหยัดการใช้พลังงาน การพัฒนาและใช้ประโยชน์จากพลังงานทดแทน การสำรวจและพัฒนาแหล่งพลังงานทั้งภายในประเทศและนอกประเทศ รวมถึงเขตพัฒนาร่วมกันกับประเทศเพื่อนบ้าน การ ส่งเสริมการใช้พลังงานสะอาด การกำหนดโครงสร้างราคาพลังงานที่เหมาะสม และการปรับโครงสร้างการบริหารกิจการพลังงานให้เหมาะสม โดยแยกงานด้านนโยบายและการกำกับดูแลให้มีความชัดเจน รวมทั้งส่งเสริมการแข่งขันในธุรกิจพลังงานในระยะยาว และการศึกษาวิจัยพลังงานทางเลือก นับเป็นทางออกทางเลือก และโอกาสการลงทุนในโครงการผลิตไฟฟ้า
การผลิตไฟฟ้าในประเทศไทย มีทั้งโรงไฟฟ้าพลังความร้อน โรงไฟฟ้าไอน้ำ และโรงไฟฟ้าพลังน้ำ โดยใช้เชื้อเพลิง เช่น น้ำมันดิบ ก๊าซธรรมชาติ และถ่านหิน ร้อยละ 89.1 ใช้พลังงานทดแทนร้อยละ 1.8 ใช้ไฟฟ้าพลังน้ำผลิตในไทยร้อยละ 3.9 และนำเข้าไฟฟ้าพลังน้ำจากประเทศเพื่อนบ้านร้อยละ 5.2 โดยคาดว่าจะเพิ่มขึ้นเป็นร้อยละ 26 ในปี 2560 ร้อยละ 28 ในปี 2564 และร้อยละ 30 ในปี 2570 การผลิตกระแสไฟฟ้า (Hydropower Generation) จากพลังน้ำ (Hydropower) หรือโรงไฟฟ้าพลังน้ำนั้น เป็นแหล่งผลิตไฟฟ้าที่สำคัญ ปัจจุบันทั่วโลกมีการส่งเสริมให้มีการใช้พลังงานน้ำเพื่อผลิตไฟฟ้า โดยใช้แหล่งน้ำธรรมชาติเป็นพลังงานในการเดินเครื่อง โดยวิธีสร้างเขื่อนปิดกั้นแม่น้ำไว้ เป็นพื้นที่รับน้ำหรืออ่างเก็บน้ำ ให้มีระดับอยู่ในที่สูงจนมีปริมาณน้ำและแรงดันเพียงพอที่จะนำมาหมุนเครื่องกังหันน้ำและเครื่องกำเนิดไฟฟ้าซึ่งอยู่ในโรงไฟฟ้าท้ายน้ำที่มีระดับต่ำกว่าได้
พลังน้ำ เป็นพลังงานหมุนเวียนตามธรรมชาติ ที่มีให้ใช้ได้อย่างไม่มีวันหมด ทั้งยังเป็นพลังงานสะอาดที่ไม่ก่อให้เกิดมลพิษทางอากาศ และเป็นแหล่งพลังงานเพื่อทดแทนการใช้เชื้อเพลิงจากซากดึกดำบรรพ์ (fossil) ไม่ว่าจะเป็นน้ำจากแหล่งกักเก็บธรรมชาติ หรือแหล่งกักเก็บที่มนุษย์สร้างขึ้น เช่น ฝาย เขื่อน แหล่งสะสมพลังงานของน้ำในรูปพลังงานศักย์ที่จะเปลี่ยนรูปเป็นพลังงานจลน์ ที่มนุษย์สามารถนำเอาพลังงานจลน์ที่เกิดขึ้นไปหมุนกังหันเป็นพลังงานกลเพื่อผลิตกระแสไฟฟ้าได้ โดยหลักการนี้มนุษย์จึงได้สร้างแหล่งกักเก็บน้ำดังกล่าวเพื่อใช้พลังงานจากน้ำไปผลิตกระแสไฟฟ้า
อย่างไรก็ดี ในการสร้างเขื่อนเพื่อให้ได้ประโยชน์สูงสุดจากปริมาณน้ำและสภาพภูมิประเทศที่มีอยู่นั้น จะมีผลกระทบ เช่น การสูญเสียพื้นที่ป่าไม้ ทำให้สัตว์ป่าต้องอพยพหนีน้ำท่วม บางชนิดอาจ สูญพันธ์ุจากระบบนิเวศที่ถูกทำลาย รวมถึงความเป็นอยู่ของคนในพื้นที่ที่ต้องเปลี่ยนไปจากเดิม ดังนั้นการศึกษาสำรวจลักษณะภูมิประเทศ (Topography) อุทกวิทยาและอุตุวิทยา (Hydrology and Meteorology) ธรณีวิทยาและฐานราก (Geology and Foundation) วัสดุก่อสร้าง (Construction Materials) และผลกระทบต่อสิ่งแวดล้อม (Environmental Impact) จึงเป็นเรื่องที่สำคัญและจำเป็น
จากประสบการณ์และความชำนาญในด้านการพัฒนาแหล่งน้ำ ไฟฟ้าพลังน้ำ และการศึกษาและบรรเทาผลกระทบต่อสิ่งแวดล้อมมากว่า 30 ปี ในการพัฒนาโครงการทั้งในประเทศและต่างประเทศ กลุ่มบริษัททีม จึงได้จัดทำหนังสือ “Hydropower: พลังน้ำกับการผลิตพลังงานไฟฟ้า” ขึ้น โดยรวบรวมองค์ความรู้เชิงวิชาการของผู้เชี่ยวชาญในการพัฒนาโครงการไฟฟ้าพลังน้ำ เพื่อมอบให้กับสถานศึกษา ห้องสมุด เพื่อนำไปใช้ประโยชน์ต่อไป และส่วนหนึ่งได้
มอบให้ผู้เข้าร่วมฟังการสัมมนา ในหัวข้อเรื่อง “โอกาสการลงทุนโครงการไฟฟ้าพลังน้ำ” ซึ่งกำหนดจัดขึ้นในวันที่ 25 สิงหาคม 2553 ณ โรงแรมแกรนด์ ไฮแอท เอราวัณ กรุงเทพฯ ด้วย
ชวลิต จันทรรัตน์ กรรมการผู้จัดการ หน่วยธุรกิจน้ำ และกรรมการบริหาร
บริษัท ทีม คอนซัลติ้ง เอนจิเนียริ่ง แอนด์ แมเนจเมนท์ จำกัด
คำปรารภ
ส า ร บั ญ
: C o n t e n t s
3036
4256
6884
96102
Hydropower: พลังน้ำกับการผลิตพลังงานไฟฟ้าWater Power and Hydroelectricity
การพึ่งพาแหล่งพลังงานเพื่อผลิตไฟฟ้าจากประเทศเพื่อนบ้านDependence on Electricity Energy Sources from Neighboring Countries
เกณฑ์การบริหารน้ำในเขื่อนที่เหมาะสมที่สุดของโครงการโรงไฟฟ้าพลังน้ำ น้ำบาก 1 Nam Bak 1 Hydropower Project in Lao PDR Rule Curves Optimization
การศึกษาปฏิบัติการโครงการโรงไฟฟ้าพลังน้ำ น้ำบาก 1 และ 2 แบบขั้นบันได Optimized Operation of the Nam Bak 1 and 2 Cascade Schemes in Lao PDR
การออกแบบและก่อสร้างเขื่อน โครงการไฟฟ้าพลังน้ำ น้ำงึม 2 Design of 182-meter High NN2 Concrete Face Rockfill Dam
การออกแบบอุโมงค์ส่งน้ำคอนกรีตเสริมเหล็ก สำหรับโครงการน้ำงึม 2Design of Reinforced Concrete Linings of NN2 Headrace Tunnel
โครงการไฟฟ้าพลังน้ำ น้ำงึม 2 กับการจัดการสังคมและสิ่งแวดล้อมHydroelectric Power Plant Project: Nam Ngum 2 and The Environmental and Social Management Plan
ไฟฟ้าพลังน้ำ ขุนด่านปราการชล หนึ่งเปอร์เซ็นต์ที่ยั่งยืนHydropower: Khundan Prakarnchon, 1% of Sustainability
H y d r o p o w e r Project Development
Stages in Lao PDR
8
H y d r o p o w e r Project Development
Stages in Lao PDR
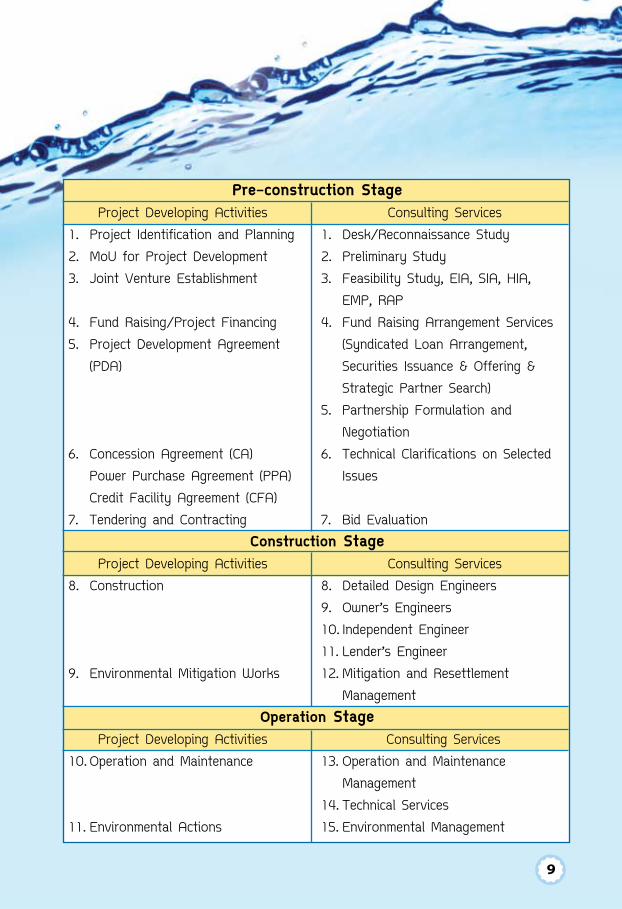
Pre-construction Stage Project Developing Activities Consulting Services1. Project Identification and Planning 1. Desk/Reconnaissance Study2. MoU for Project Development 2. Preliminary Study3. Joint Venture Establishment 3. Feasibility Study, EIA, SIA, HIA, EMP, RAP4. Fund Raising/Project Financing 4. Fund Raising Arrangement Services5. Project Development Agreement (Syndicated Loan Arrangement, (PDA) Securities Issuance & Offering & Strategic Partner Search) 5. Partnership Formulation and Negotiation6. Concession Agreement (CA) 6. Technical Clarifications on Selected Power Purchase Agreement (PPA) Issues Credit Facility Agreement (CFA)7. Tendering and Contracting 7. Bid Evaluation
Construction Stage Project Developing Activities Consulting Services8. Construction 8. Detailed Design Engineers 9. Owner’s Engineers 10. Independent Engineer 11. Lender’s Engineer9. Environmental Mitigation Works 12. Mitigation and Resettlement Management
Operation Stage Project Developing Activities Consulting Services10. Operation and Maintenance 13. Operation and Maintenance Management 14. Technical Services11. Environmental Actions 15. Environmental Management
9


• Hydropower: พลังน้ำกับการผลิตพลังงานไฟฟ้า Water Power and Hydroelectricity
• การพึ่งพาแหล่งพลังงานเพื่อผลิตไฟฟ้าจากประเทศเพื่อนบ้าน Dependence on Electricity Energy Sources from Neighboring Countries
• เกณฑ์การบริหารน้ำในเขื่อนที่เหมาะสมที่สุดของโครงการโรงไฟฟ้า พลังน้ำ น้ำบาก 1 Nam Bak 1 Hydropower Project in Lao PDR Rule Curves Optimization
• การศึกษาปฏิบัติการโครงการโรงไฟฟ้าพลังน้ำ น้ำบาก 1 และ 2 แบบขั้นบันได Optimized Operation of the Nam Bak 1 and 2 Cascade Schemes in Lao PDR
• การออกแบบและก่อสร้างเขื่อน โครงการไฟฟ้าพลังน้ำ น้ำงึม 2 Design of 182-meter High NN2 Concrete Face Rockfill Dam
• การออกแบบอุโมงค์ส่งน้ำคอนกรีตเสริมเหล็ก สำหรับโครงการน้ำงึม 2 Design of Reinforced Concrete Linings of NN2 Headrace Tunnel
• โครงการไฟฟ้าพลังน้ำน้ำงึม 2 กับการจัดการสังคมและสิ่งแวดล้อม Hydroelectric Power Plant Project: Nam Ngum 2 and The Environmental and Social Management Plan
• ไฟฟ้าพลังน้ำ ขุนด่านปราการชล หนึ่งเปอร์เซ็นต์ที่ยั่งยืน Hydropower : Khundan Prakarnchon, 1% of Sustainability
12
Hydropower: พลังน้ำกับการผลิตพลังงานไฟฟ้า
ม.ร.ว. วิพุธดนัย เทวกุล
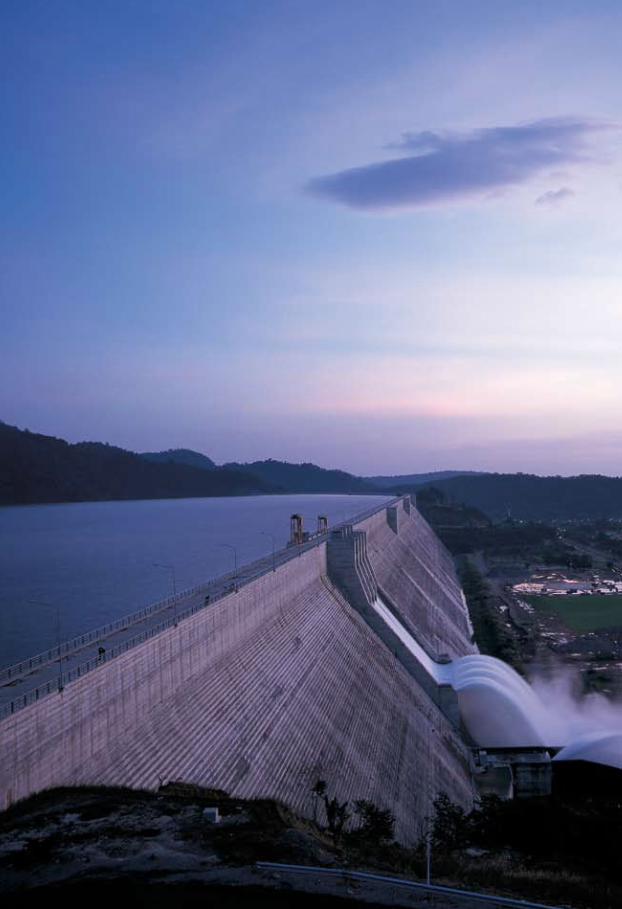
การเคลื่อนที่ของน้ำเต็มไปด้วยพลังงานธรรมชาติมหาศาล ดังนั้นหากควบคุมการเคลื่อนที่ของน้ำและนำพลังน้ำเหล่านี้มาใช้จะก่อให้เกิดประโยชน์เป็นคุณอนันต์
มนุษย์รู้จักนำพลังน้ำมาใช้งานให้เกิดประโยชน์มาแล้วหลายศตวรรษ การใช้พลังงานน้ำในยุคแรกๆ เป็นการแปลงพลังน้ำเป็นพลังงานกล (Direct Mechanical Power Transmission) เพื่อใช้ในการสีข้าว หมุนกังหันน้ำเพื่อยกน้ำเข้าไร่นา การใช้ประโยชน์โดยตรงเหล่านี้ ทำให้ต้องอยู่ใกล้แหล่งน้ำ ต่อมาเมื่อมนุษย์รู้จักพลังงานไฟฟ้าและผลิตกระแสไฟฟ้ามาใช้ประโยชน์ จึงนำพลังน้ำมาเป็นต้นพลังในการผลิตกระแสไฟฟ้า แล้วจึงส่งกระแสไฟฟ้าไปยังผู้ใช้ที่อยู่ห่างไกลออกไปเพื่อเปลี่ยนเป็นพลังงานที่ต้องการ เช่น พลังงานกล พลังงานแสงสว่าง พลังงานความร้อน ฯลฯ
โครงการโรงไฟฟ้าพลังน้ำได้รับการพัฒนาอย่างมากมาย ประเทศไทยมีการศึกษาวางแผน ดำเนินการโรงไฟฟ้าพลังน้ำขนาดใหญ่ครั้งแรกในโครงการก่อสร้างเขื่อนภูมิพล จ.ตาก ในช่วงทศวรรษที่ 2490
การพัฒนาโครงการโรงไฟฟ้าพลังน้ำมักจะทำในรูปแบบของโครงการอเนกประสงค์ (Multi-Purpose Project) กล่าวคือ เมื่อน้ำผ่านเครื่องกังหันน้ำเพื่อการผลิตกระแสไฟฟ้าแล้ว จะถูกนำไปใช้ในการอุปโภค บริโภค อุตสาหกรรม และส่งต่อเข้าระบบชลประทานเพื่อการเกษตรกรรมต่อไป ส่วนอ่างเก็บน้ำสามารถใช้ในการป้องกันอุทกภัย เป็นแหล่งประมงน้ำจืดขนาดใหญ่ และใช้เป็นแหล่งท่องเที่ยว
ถึงแม้ว่าพลังน้ำ (Hydropower) เป็นพลังงานหมุนเวียนตามธรรมชาติ (Renewable Energy) ที่สะอาดปราศจากมลพิษ สามารถควบคุมและบริหารจัดการให้จ่ายพลังงานได้รวดเร็ว (High Availability) สม่ำเสมอ มีประสิทธิภาพสูงสุดและไม่มีต้นทุนค่าเชื้อเพลิง แต่การพัฒนาโรงไฟฟ้าพลังน้ำส่งผลกระทบ ต่อระบบนิเวศและสิ่งแวดล้อม จำเป็นที่จะต้องศึกษาและวางมาตรการแก้ไขผลกระทบต่อสิ่งแวดล้อม อย่างละเอียดถี่ถ้วนเป็นการล่วงหน้า
อย่างไรก็ตามพลังงานไฟฟ้าก็ยังคงเป็นปัจจัยสำคัญในอุตสาหกรรมและการดำรงชีวิต เป็นพลังงานหลักในการพัฒนาประเทศต่อไปในอนาคต จึงต้องวางแผนพัฒนาให้สนองความต้องการไฟฟ้า ที่นับวันจะเพิ่มมากขึ้น อย่างรอบคอบและมีประสิทธิภาพสูงสุด

13
Hydropower: Water Power and Hydroelectricity
MR Vibudhtanaya Devakula
Water power is power that is derived from the mass of moving water, which can be harnessed for the useful purposes.
Early uses of waterpower date back for centuries as a direct mechanical power trans-mission for irrigation, and operation of various machines, such as water mills and waterwheels. Limitation is that these machineries have to be close to the sources of water.
When the people know and can generate the electric power, the hydropower is used to produce the electric power in the remote area and then transmitted to the community and transformed into the required power such as heat, light, mechanical power, etc.
Hydroelectricity projects have undergone great development after the World War II. Most hydroelectricity projects have been developed as the multi-purpose project. In Thailand, the Bhumibol Dam and Hydropower plant is the genesis of the large-scale multi-purpose hy-dropower development in Thailand. Since 1964, this first and only concrete arch gravity dam in the country has for over four decades been creating electric power, domestic and industrial water uses and irrigation profits, flood control, fresh water fishery, tourism as well as many other benefits.
Although hydropower is an environmentally-friendly renewable energy with high avail-ability, efficiency and fuel-less, each and every development project poses environmental impacts and requires comprehensive studies and environmental mitigation measures in advance.
Modern society uses large amounts of electrical power. It is the significant factor in industry and living. Hydropower project development planning has tremendously contributed to the country’s continual development and need to be conducted carefully to obtain the highest-possible efficiency.

14
การพึง่พาแหลง่พลงังาน เพื่อผลิตไฟฟ้าจากประเทศเพื่อนบ้าน
ชวลิต จันทรรัตน์
พลังงานไฟฟ้าเป็นปัจจัยสำคัญในการดำรงชีวิตของคนไทย ปัจจุบันความต้องการใช้ไฟฟ้าของ
ประเทศมีเพิ่มสูงขึ้นทุกปี ตามอัตราการเจริญเติบโตของเศรษฐกิจ (GDP) ดังนั้น เพื่อรองรับความต้องการ ดังกล่าว ประเทศไทยจะต้องสร้างโรงไฟฟ้าขนาดใหญ่ที่มีกำลังผลิต 700 เมกะวัตต์ เพิ่มขึ้นทุกปี เพื่อตอบสนองต่อปริมาณความต้องการกำลังไฟฟ้า (Power) พลังงาน (Energy) และลักษณะของการใช้ไฟฟ้าในเวลานั้นๆ โดยพิจาณาถึงต้นทุนการผลิต ชนิดของเชื้อเพลิง ราคาเชื้อเพลิง และระยะเวลาในการก่อสร้าง โรงไฟฟ้าจนแล้วเสร็จ (อย่างน้อย 5 ปี) แต่ปัญหาสำคัญที่พบก็คือ ประเทศไทยไม่มีเชื้อเพลิงในประเทศเพียงพอกับความต้องการที่มีเพิ่มขึ้น
โรงไฟฟ้าที่ผลิตกระแสไฟฟ้าในประเทศไทยปัจจุบันมี โรงไฟฟ้าพลังความร้อน โรงไฟฟ้าไอน้ำ และโรงไฟฟ้าพลังน้ำ โดยใช้เชื้อเพลิง อาทิ น้ำมันดิบ ก๊าซธรรมชาติ และถ่านหิน ร้อยละ 89 และนำเข้าไฟฟ้าพลังน้ำจากประเทศเพื่อนบ้านร้อยละ 5 โดยมีกำลังสำรองทั้งระบบประมาณร้อยละ 10 ถึง 15 และจากแผนพัฒนาพลังงานไฟฟ้าแห่งชาติ ปี 2558 ประเทศไทยจะต้องพึ่งพาพลังงานไฟฟ้าจากประเทศเพื่อนบ้านในอัตราร้อยละ 26 กล่าวคือเริ่มมีค่ามากกว่ากำลังการผลิตไฟฟ้าสำรองของปีนั้นๆ และจะเพิ่มขึ้นเป็นร้อยละ 28 ใน ปี 2564 และอาจเพิ่มสูงขึ้นถึงร้อยละ 30 ในปี 2570
การศึกษาการพึ่งพาแหล่งพลังงานโดยเฉพาะไฟฟ้าพลังน้ำจากประเทศเพื่อนบ้านจึงมีความสำคัญและจำเป็นเพื่อหาแผนทางเลือกที่เป็นไปได้ในการพัฒนาพลังงานไฟฟ้าของประเทศ โดยใช้มาตรการและยุทธศาสตร์ในการถ่วงดุลแหล่งพลังงาน ลดความเสี่ยงและจำกัดผลกระทบให้อยู่ในระดับที่รับได้ เพื่อให้การพึ่งพาพลังน้ำจากประเทศเพื่อนบ้านอยู่ในระดับที่เหมาะสม สามารถแก้ปัญหาด้านพลังงานของประเทศ ในระยะยาวได้
จากการศึกษาดังกล่าวนี้ มีข้อเสนอแนะที่หน่วยงานเกี่ยวข้องควรนำไปพิจารณา เช่น การพึ่งพาแหล่งพลังงานไฟฟ้าจากแต่ละประเทศ ควรกำหนดให้มีค่าไม่เกินร้อยละ 15 ของความต้องการกำลังไฟฟ้ารวมของประเทศ การปรับค่าก่อสร้างโรงไฟฟ้า ด้านงบประมาณให้เพียงพอไม่ก่อให้เกิดปัญหาการหยุดชะงัก ชะลอ หรือล้มเลิกโครงการ มีการทบทวนปรับเพิ่มค่าไฟฟ้าที่จะซื้อจากภาคเอกชน (Tariff Rate) ให้เหมาะสม เพื่อให้เอกชนผู้ลงทุนสามารถดำเนินโครงการต่อไปได้ การลดความเสี่ยงจากการผันผวนทางเศรษฐกิจ การก่อการร้าย การก่อวินาศกรรม การเปลี่ยนแปลงทางการเมืองภายในประเทศ การเมืองและความสัมพันธ์ระหว่างประเทศ การปรับแผนพัฒนาการผลิตไฟฟ้าในช่วงปี 2560-2564 และ การใช้ก๊าซธรรมชาติจากบ่อ M9 ในทะเลอันดามันของพม่า เพื่อสร้างมูลค่าเพิ่มโดยการใช้เพื่อการอุตสาหกรรมและการขนส่ง และเพื่อลดความเสี่ยงที่จะเกิดจากการใช้ก๊าซธรรมชาติจากประเทศเพื่อนบ้านมาผลิตไฟฟ้าลงได้อีกด้วย
15
Dependence on Electricity Energy Sources from Neighboring Countries
Chawalit Chantararat
Electricity is undeniably a necessity of Thai people’s daily life. Thailand’s domestic energy demand has been on the increase every year in tandem with the GDP growth. Conse-quently, Thailand needs to build an additional large power plant with generating capacity of 700 MW every year to meet the ever-rising power and energy demands for each and every type of electricity consumption. Consideration must be given to production costs, type and price of fuels, and construction period (5 years at a minimum). The critical problem is the insufficiency of domestic fuel supplies for the growing demands.
The existing types of power plants in Thailand consist of thermal power plants, steam power plants and hydroelectric power plants. Various fuel types are presently used in power production, e.g. crude oil, natural gas, coal – accounting for 89% of the total. Electricity imported from neighboring countries makes up the remaining 5%. The reserved capacity of the entire system is about 10-15%. According to the national power development plan, Thailand’s dependence on imported energy supplies is expected to be 26% in 2015 and 28% in 2021 before reaching 30% in 2027. This indicates that the energy demand will be greater than the reserved generating capacity of the projected years.
The study of dependence on imported energy supplies, particularly hydropower, from neighboring countries is therefore crucial and necessary so as to find feasible alternative plans for the country’s power development. Emphasis is placed on measures and strategies for balanced energy sources, and reduction of risks and impacts to an acceptable level in order to manage dependence on electricity energy sources from neighboring countries and to find solutions to the country’s energy security problems in the long run.
The said study provides recommendations for further consideration by the concerned agencies. For example, dependence on energy sources from each neighboring country should be set not to exceed 15% of Thailand’s total energy demands. Construction costs of power plants should be adjusted so that the budget will be sufficient for the work completion, thus prevent-ing suspension, delay or termination of potential projects. Tariff rates are also recommended to be adjusted to an appropriate level so that private investors can successfully implement their projects. Moreover, risk reduction should be addressed, encompassing risks from economic volatility, terrorism, sabotage, national political changes, politics, and international relations. Additionally, the study suggests the revision of the power development plan for 2017-2021, and the utilization of natural gas from the offshore M9 Block in the Andaman Sea, Myanmar, for industry and transport sectors. This can create value addition and reduce risks that may arise from dependence on natural gas imports from neighboring countries for power generation.
16
เกณฑก์ารบรหิารนำ้ในเขือ่นทีเ่หมาะสมทีส่ดุ ของโครงการโรงไฟฟ้าพลังน้ำ น้ำบาก 1
พินชัย วิบูลย์ศิริกุล
น้ำบาก เป็นหนึ่งในลำน้ำสาขาที่สำคัญของน้ำงึม โดยบรรจบกับน้ำงึมที่ระยะประมาณ 1.5
กิโลเมตร ท้ายเขื่อนน้ำงึม 2 ได้เริ่มมีการศึกษาศักยภาพด้านไฟฟ้าพลังน้ำในลำน้ำบากมาตั้งแต่ปี 2513 น้ำงึมซึ่งเป็นสาขาที่สำคัญของแม่น้ำโขง ด้วยขนาดพื้นที่รับน้ำประมาณ 16,640 ตารางกิโลเมตร
ไหลบรรจบกับแม่น้ำโขง ทางฝั่งซ้ายที่ระยะประมาณ 60 กิโลเมตร ท้ายน้ำ จังหวัดหนองคาย ความร่วมมือด้านไฟฟ้าพลังน้ำระหว่างประเทศไทยและ สปป.ลาว เริ่มต้นขึ้นตั้งแต่ปี 2511 จาก
การพัฒนาโครงการไฟฟ้าพลังน้ำ น้ำงึม 1 ขนาดกำลังผลิต 150 เมกะวัตต์ ซึ่งอยู่ท้ายเขื่อนน้ำงึม 2 โดยไฟฟ้าจากโครงการส่วนใหญ่ถูกขายให้กับประเทศไทย
บริษัท เซาท์อีสท์ เอเชีย เอนเนอร์จี จำกัด (SEAN) ซึ่งเป็นผู้ผลิตไฟฟ้าอิสระ (IPP) รายใหญ่ ลงทุนพัฒนาโครงการไฟฟ้าพลังน้ำ น้ำงึม 2 ขนาดกำลังผลิต 615 เมกะวัตต์ เพื่อขายไฟฟ้าให้กับการไฟฟ้าฝ่ายผลิตแห่งประเทศไทย (EGAT) โดยสัญญาการซื้อขาย จะเริ่มขึ้นในวันที่ 1 มกราคม 2556
บริษัท SEAN มีแผนที่จะพัฒนาโครงการน้ำบาก 1 เพื่อขายไฟฟ้าให้กับการไฟฟ้าฝ่ายผลิตแห่งประเทศไทย โดยใช้สายส่งร่วมกับโครงการเขื่อนน้ำงึม 2
เขื่อนน้ำบาก 1 มีขนาดพื้นที่รับน้ำประมาณ 597 ตารางกิโลเมตร ตั้งอยู่บนลำน้ำบาก จากจุดบรรจบน้ำงึมไปประมาณ 15 กิโลเมตร จากการศึกษา (Optimization Study) ระดับน้ำเก็บกักที่เหมาะสมคือ +635 เมตร และระดับน้ำใช้การต่ำสุด (MOL) + 585 เมตร โดยมีปริมาณน้ำใช้การ 372 ล้านลูกบาศก์เมตร และความจุรวม 450 ล้านลูกบาศก์เมตร
ระบบท่อส่งน้ำของโครงการ ประกอบด้วยอาคารรับน้ำทางฝั่งขวา อุโมงค์ส่งน้ำแรงดันต่ำยาว 14.3 กิโลเมตร อาคารลดแรงดัน และอุโมงค์ ท่อส่งน้ำแรงดันสูง ยาว 1.4 กิโลเมตร โรงไฟฟ้า ขนาดกำลังผลิตติดตั้ง 160 เมกะวัตต์ ตั้งอยู่ฝั่งซ้ายของน้ำงึม โดยห่างจากโรงไฟฟ้าของโครงการน้ำงึม 2 เพียงประมาณ 1.2 กิโลเมตร
ตามสัญญาการซื้อขายไฟฟ้า (PPA) กับ การไฟฟ้าฝ่ายผลิตแห่งประเทศไทยพลังงานไฟฟ้าถูกจำแนกเป็น 3 ประเภท ได้แก่ Primary Energy (PE), Secondary Energy (SE) และ Excess Energy (EE), โดยค่าไฟฟ้าของ PE จะสูงที่สุด ในขณะที่ค่าไฟฟ้าสำหรับ SE และ EE ประมาณ 65% และ 55% ของค่าไฟฟ้า PE
เพื่อให้มีแนวทางในการปฏิบัติการอ่างเก็บน้ำในช่วงดำเนินการได้มีการจัดทำเกณฑ์การบริหารน้ำในเขื่อนที่เหมาะสมที่สุด ดังนี้
1. การผลิตไฟฟ้ารวมและ PE มีปริมาณสูงสุด 2. ลดปริมาณน้ำที่จะล้นผ่านเขื่อนให้เหลือน้อยที่สุด 3. ผลิตไฟฟ้า PE ได้อย่างน้อย 8 ชั่วโมงต่อวัน เฉลี่ยจากค่ารายเดือน 4. ผลิตไฟฟ้า PE ได้อย่างน้อย 10 ชั่วโมงต่อวัน เฉลี่ยจากค่ารายปี
17
Nam Bak 1 Hydropower Project in Lao PDR Rule Curves Optimization
Pinchai Vibulsirikul
Nam Bak is the main tributary of Nam Ngum and joins Nam Ngum at about 1.5 km downstream of Nam Ngum 2 dam. The hydropower potential in Nam Bak basin has been identified since 1970.
Nam Ngum, a main tributary of the Mekong River with catchment area about 16,640 km2, joins the Mekong River on the left bank at about 60 km downstream of Nong Khai province, Thailand.
The development of hydropower in Nam Ngum started in 1968 by the construction of Nam Ngum 1 dam with the total installed capacity of 150 MW. The development is the beginning of coop-eration between Lao PDR and Thailand on power trade since most of the energy from this project has been sold to Thailand.
SouthEast Asia Energy Limited (SEAN) is presently developing Nam Ngum 2 Hydropower Project as an Independent Power Producer (IPP) for selling energy to Thailand. The project is of reservoir type located at the upstream tip of Nam Ngum 1 reservoir, which was developed as the intermediate peak-ing plant with 615 MW installed capacity. The commercial operation date specified in the Power Purchase Agreement (PPA) with the Electricity Generating Authority of Thailand (EGAT) is 1 January 2013.
SEAN has planned to develop Nam Bak 1 Hydropower Project. The MOU for Nam Bak development between the Lao’s government and SEAN was signed on 11 April 2007. The energy from Nam Bak 1 HPP and from Nam Ngum 2 HPP will be transmitted to Thailand with the same 230 kV transmission line.
The dam of Nam Bak 1, with a catchment area of about 597 km2, is to be located at about 15 km upstream from the confluence of Nam Bak and Nam Ngum. From the dam height optimization, the optimum Full Supply Level (FSL) of +635 m and Minimum Operating Level (MOL) of +585 m will contain an active storage volume of about 372 MCM and a gross storage volume of about 450 MCM.
The power waterway system consists of a power intake on the right bank, about 14.3 km long low pressure tunnel, a surge shaft and about 1.4 km long underground inclined penstock. The powerhouse is to be located at Nam Ngum left bank about 1.2 km downstream of Nam Ngum 2 powerhouse where the tail water level is +208 m. The optimum installed capacity of Nam Bak 1 is 160 MW.
According to the Power Purchase Agreement (PPA) of EGAT, the energy purchased from hydropower project is classified as Primary Energy (PE), Secondary Energy (SE), and Excess Energy (EE). The tariff for PE is the highest while the tariff for SE and EE is about 65% and 55% of PE tariff respectively.
As a guideline for reservoir operation, a set of rule curves were established and optimized by considering the following conditions:
1) Maximizing the amount of total energy and PE generation.2) Minimizing the amount of water spill.3) Must be able to generate PE at least 8 hours a day on monthly average.4) Must be able to generate PE at least 10 hours a day on yearly average.
18
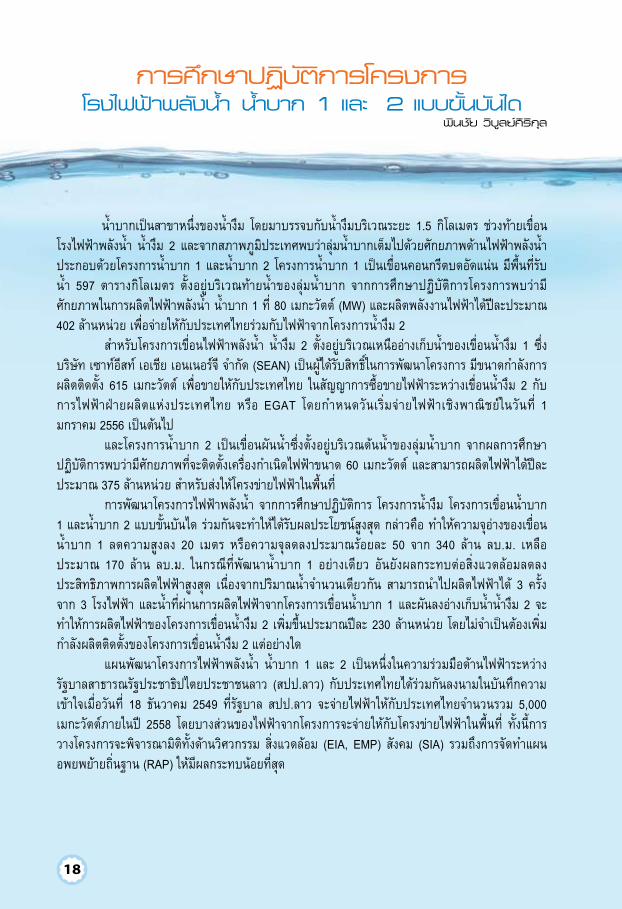
น้ำบากเป็นสาขาหนึ่งของน้ำงึม โดยมาบรรจบกับน้ำงึมบริเวณระยะ 1.5 กิโลเมตร ช่วงท้ายเขื่อนโรงไฟฟ้าพลังน้ำ น้ำงึม 2 และจากสภาพภูมิประเทศพบว่าลุ่มน้ำบากเต็มไปด้วยศักยภาพด้านไฟฟ้าพลังน้ำ ประกอบด้วยโครงการน้ำบาก 1 และน้ำบาก 2 โครงการน้ำบาก 1 เป็นเขื่อนคอนกรีตบดอัดแน่น มีพื้นที่รับน้ำ 597 ตารางกิโลเมตร ตั้งอยู่บริเวณท้ายน้ำของลุ่มน้ำบาก จากการศึกษาปฏิบัติการโครงการพบว่ามีศักยภาพในการผลิตไฟฟ้าพลังน้ำ น้ำบาก 1 ที่ 80 เมกะวัตต์ (MW) และผลิตพลังงานไฟฟ้าได้ปีละประมาณ 402 ล้านหน่วย เพื่อจ่ายให้กับประเทศไทยร่วมกับไฟฟ้าจากโครงการน้ำงึม 2
สำหรับโครงการเขื่อนไฟฟ้าพลังน้ำ น้ำงึม 2 ตั้งอยู่บริเวณเหนืออ่างเก็บน้ำของเขื่อนน้ำงึม 1 ซึ่งบริษัท เซาท์อีสท์ เอเชีย เอนเนอร์จี จำกัด (SEAN) เป็นผู้ได้รับสิทธิ์ในการพัฒนาโครงการ มีขนาดกำลังการผลิตติดตั้ง 615 เมกะวัตต์ เพื่อขายให้กับประเทศไทย ในสัญญาการซื้อขายไฟฟ้าระหว่างเขื่อนน้ำงึม 2 กับการไฟฟ้าฝ่ายผลิตแห่งประเทศไทย หรือ EGAT โดยกำหนดวันเริ่มจ่ายไฟฟ้าเชิงพาณิชย์ในวันที่ 1 มกราคม 2556 เป็นต้นไป
และโครงการน้ำบาก 2 เป็นเขื่อนผันน้ำซึ่งตั้งอยู่บริเวณต้นน้ำของลุ่มน้ำบาก จากผลการศึกษาปฏิบัติการพบว่ามีศักยภาพที่จะติดตั้งเครื่องกำเนิดไฟฟ้าขนาด 60 เมกะวัตต์ และสามารถผลิตไฟฟ้าได้ปีละประมาณ 375 ล้านหน่วย สำหรับส่งให้โครงข่ายไฟฟ้าในพื้นที่
การพัฒนาโครงการไฟฟ้าพลังน้ำ จากการศึกษาปฏิบัติการ โครงการน้ำงึม โครงการเขื่อนน้ำบาก 1 และน้ำบาก 2 แบบขั้นบันได ร่วมกันจะทำให้ได้รับผลประโยชน์สูงสุด กล่าวคือ ทำให้ความจุอ่างของเขื่อนน้ำบาก 1 ลดความสูงลง 20 เมตร หรือความจุลดลงประมาณร้อยละ 50 จาก 340 ล้าน ลบ.ม. เหลือประมาณ 170 ล้าน ลบ.ม. ในกรณีที่พัฒนาน้ำบาก 1 อย่างเดียว อันยังผลกระทบต่อสิ่งแวดล้อมลดลง ประสิทธิภาพการผลิตไฟฟ้าสูงสุด เนื่องจากปริมาณน้ำจำนวนเดียวกัน สามารถนำไปผลิตไฟฟ้าได้ 3 ครั้งจาก 3 โรงไฟฟ้า และน้ำที่ผ่านการผลิตไฟฟ้าจากโครงการเขื่อนน้ำบาก 1 และผันลงอ่างเก็บน้ำน้ำงึม 2 จะทำให้การผลิตไฟฟ้าของโครงการเขื่อนน้ำงึม 2 เพิ่มขึ้นประมาณปีละ 230 ล้านหน่วย โดยไม่จำเป็นต้องเพิ่มกำลังผลิตติดตั้งของโครงการเขื่อนน้ำงึม 2 แต่อย่างใด
แผนพัฒนาโครงการไฟฟ้าพลังน้ำ น้ำบาก 1 และ 2 เป็นหนึ่งในความร่วมมือด้านไฟฟ้าระหว่างรัฐบาลสาธารณรัฐประชาธิปไตยประชาชนลาว (สปป.ลาว) กับประเทศไทยได้ร่วมกันลงนามในบันทึกความเข้าใจเมื่อวันที่ 18 ธันวาคม 2549 ที่รัฐบาล สปป.ลาว จะจ่ายไฟฟ้าให้กับประเทศไทยจำนวนรวม 5,000 เมกะวัตต์ภายในปี 2558 โดยบางส่วนของไฟฟ้าจากโครงการจะจ่ายให้กับโครงข่ายไฟฟ้าในพื้นที่ ทั้งนี้การวางโครงการจะพิจารณามิติทั้งด้านวิศวกรรม สิ่งแวดล้อม (EIA, EMP) สังคม (SIA) รวมถึงการจัดทำแผนอพยพย้ายถิ่นฐาน (RAP) ให้มีผลกระทบน้อยที่สุด
การศึกษาปฏบัิติการโครงการ โรงไฟฟ้าพลงันำ้ นำ้บาก 1 และ 2 แบบขัน้บนัได
พินชัย วิบูลย์ศิริกุล
19
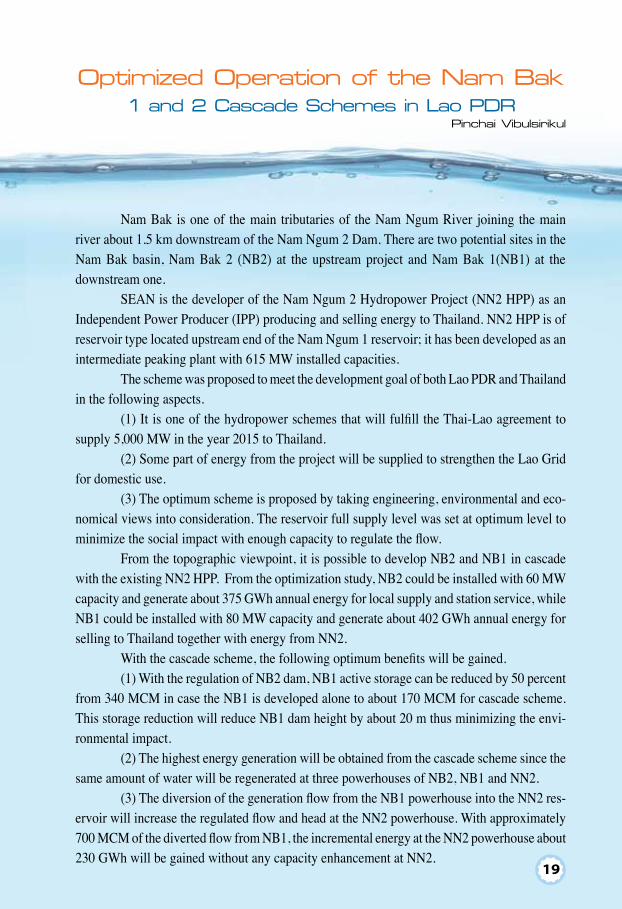
Nam Bak is one of the main tributaries of the Nam Ngum River joining the main river about 1.5 km downstream of the Nam Ngum 2 Dam. There are two potential sites in the Nam Bak basin, Nam Bak 2 (NB2) at the upstream project and Nam Bak 1(NB1) at the downstream one.
SEAN is the developer of the Nam Ngum 2 Hydropower Project (NN2 HPP) as an Independent Power Producer (IPP) producing and selling energy to Thailand. NN2 HPP is of reservoir type located upstream end of the Nam Ngum 1 reservoir; it has been developed as an intermediate peaking plant with 615 MW installed capacities.
The scheme was proposed to meet the development goal of both Lao PDR and Thailand in the following aspects.
(1) It is one of the hydropower schemes that will fulfill the Thai-Lao agreement to supply 5,000 MW in the year 2015 to Thailand.
(2) Some part of energy from the project will be supplied to strengthen the Lao Grid for domestic use.
(3) The optimum scheme is proposed by taking engineering, environmental and eco-nomical views into consideration. The reservoir full supply level was set at optimum level to minimize the social impact with enough capacity to regulate the flow.
From the topographic viewpoint, it is possible to develop NB2 and NB1 in cascade with the existing NN2 HPP. From the optimization study, NB2 could be installed with 60 MW capacity and generate about 375 GWh annual energy for local supply and station service, while NB1 could be installed with 80 MW capacity and generate about 402 GWh annual energy for selling to Thailand together with energy from NN2.
With the cascade scheme, the following optimum benefits will be gained.(1) With the regulation of NB2 dam, NB1 active storage can be reduced by 50 percent
from 340 MCM in case the NB1 is developed alone to about 170 MCM for cascade scheme. This storage reduction will reduce NB1 dam height by about 20 m thus minimizing the envi-ronmental impact.
(2) The highest energy generation will be obtained from the cascade scheme since the same amount of water will be regenerated at three powerhouses of NB2, NB1 and NN2.
(3) The diversion of the generation flow from the NB1 powerhouse into the NN2 res-ervoir will increase the regulated flow and head at the NN2 powerhouse. With approximately 700 MCM of the diverted flow from NB1, the incremental energy at the NN2 powerhouse about 230 GWh will be gained without any capacity enhancement at NN2.
Optimized Operation of the Nam Bak 1 and 2 Cascade Schemes in Lao PDR
Pinchai Vibulsirikul

20
การออกแบบ และก่อสร้างเขื่อน โครงการโรงไฟฟ้าพลังน้ำ น้ำงึม 2
ดร. อภิชาติ สระมูล
โครงการโรงไฟฟ้าพลังน้ำ น้ำงึม 2 ตั้งอยู่ในตอนกลางของประเทศลาว และห่างออกไปทางตอน
เหนือของกรุงเวียงจันทน์ประมาณ 90 กิโลเมตร ลักษณะของตัวเขื่อนเป็นเขื่อนแบบหินถมดาดหน้าด้วย
คอนกรีต (Concrete Face Rockfill Dam - CFRD) เขื่อนมีความสูง 182 เมตร ฐานยันของเขื่อน (Dam
Plinth) นั้นเป็นองค์ประกอบที่สำคัญที่สุดของเขื่อนชนิดนี้ ภายหลังจากเริ่มกักเก็บน้ำ ส่วนฐานรากของเขื่อน
จำเป็นต้องได้รับการตรวจสอบดูแลเพื่อให้เขื่อนอยู่ในสภาพที่มั่นคงแข็งแรงอยู่เสมอ ส่วนฐานยันเขื่อน
(Plinth) มีความกว้างตั้งแต่ 6-23 เมตร ซึ่งค่านี้ขึ้นอยู่กับสภาพของชั้นหินฐานรากและค่า Hydraulic
Gradient ซึ่งสัมพันธ์กับระดับน้ำในอ่างเก็บน้ำ (Reservoir Head) เขื่อนน้ำงึม 2 มีพื้นคอนกรีตเสริมเหล็ก
ดาดหน้าเขื่อน โดยเชื่อมต่อกับฐานยันเขื่อนด้วยรอยต่อที่สามารถปรับตัวได้ (Perimeter Joint) พื้นคอนกรีต
นี้มีความหนาน้อยที่สุดในบริเวณสันเขื่อน โดยมีความหนา 0.30 เมตร และความหนาของพื้นคอนกรีตนี้จะ
เพิ่มขึ้นเรื่อยๆ ตามความลึกของระดับน้ำ จนถึงตีนเขื่อนซึ่งมีความหนา 0.85 เมตร ประสิทธิภาพของพื้น
คอนกรีตดาดหน้าและชั้นหินถมที่รองรับนั้นมีความสำคัญยิ่งสำหรับเขื่อนแบบหินทิ้งดาดหน้าด้วยคอนกรีต
ซึ่งสามารถปรับปรุงให้ดีขึ้นโดยการควบคุมความหนาแน่นของชั้นหินบดอัดอย่างเคร่งครัด

21
Design of 182-meter High NN2 Concrete Face Rockfill Dam
Dr. Aphichat Sramoon
The Nam Ngum 2 Hydroelectric Power Project (NN2 HPP) is located approximately 90 km north of Vientiane in central Laos. The Dam is of the Concrete Face Rockfill Dam (CFRD) with the dam height of 182 m. The dam plinth is the most important component of a CFRD and much attention is needed to ensure its satisfactory performance after reservoir impounding. The total width of the plinth depends on the foundation conditions and the hydraulic gradient relative to the reservoir head, as a result the total width of the plinth varies from 6.0 m to 23.0 m. The reinforced concrete face slab will be laid against the upstream face of the dam, connecting to the dam plinth by the perimeter joint. The face slab will have a minimum thickness of 0.30 m near the dam crest and will increase linearly to a maximum thickness of 0.85 m at the toe of the dam. The performances of rockfill and face slab are of importance for CFRD, which can improve by strictly control the rockfill compaction density.

22
การออกแบบอุโมงค์รับแรงดันภายใน สำหรับใช้ส่งน้ำไปผลิตกระแสไฟฟ้าของโครงการโรงไฟฟ้า
พลังน้ำ น้ำงึม 2 ในสาธารณรัฐประชาธิปไตยประชาชนลาว เป็นอุโมงค์ที่มีขนาดเส้นผ่านศูนย์กลางภายใน
10.70 เมตร และมีความยาวรวมประมาณ 460 เมตร ได้แบ่งประเภทของดาดอุโมงค์เป็น 2 ประเภท คือ
ดาดอุโมงค์คอนกรีตเสริมเหล็ก (Reinforced Concrete Lining) และดาดอุโมงค์เหล็ก (Steel Lining) การ
พิจารณาความยาวของการดาดอุโมงค์เหล็กนั้นจะใช้เกณฑ์การจำกัดขอบเขตของ Austrian ส่วนการ
วิเคราะห์และออกแบบดาดอุโมงค์คอนกรีตเสริมเหล็กจะพิจารณาสภาพทางธรณีวิทยาและน้ำหนักที่กระทำ
เฉพาะตามแนวที่อุโมงค์ผ่าน ปริมาณการไหลซึมออกของน้ำจากรอยแตกของดาดอุโมงค์คอนกรีตมีการ
ทำนายเพื่อตรวจสอบการยอมรับได้ในการสูญเสียน้ำสำหรับอุโมงค์ประเภทนี้ นอกจากนั้นยังมีการตรวจสอบ
ความมั่นคงเชิงลาดของหินและดินที่ปกคลุมอุโมงค์ เนื่องจากการไหลซึมของน้ำ ซึ่งผลการวิเคราะห์และ
ออกแบบแสดงให้เห็นว่าอุโมงค์ส่งน้ำมีความปลอดภัยตรงตามข้อกำหนดของอุโมงค์รับแรงดันภายใน
การออกแบบอุโมงค์ส่งน้ำคอนกรีตเสริมเหล็ก สำหรับโครงการน้ำงึม 2
ดร. อภิชาติ สระมูล

23
The design of the pressure tunnel is illustrated by the example of the headrace tun-nel of Nam Ngum 2 Hydroelectric Power Project (NN2 HPP) in Lao PDR. The diameter of headrace tunnel is 10.70 m with the total length of 460 m. The required length of steel liner is determined based on Austrian’s confinement requirement criteria. The analysis and design of reinforced concrete lining is performed according to the geological conditions and specific loading conditions. The prediction of the water losses due to crack of the lining is performed to verify the acceptation of concrete lining. The slope stability analysis is carried out to ensure the stability of the rock cover and overburden above the headrace tunnel due to water leakage from the concrete lining. The analysis and design results show that the headrace tunnel is safe and meets the requirement for pressure tunnel.
Design of Reinforced Concrete Linings of NN2 Headrace Tunnel
Dr. Aphichat Sramoon

24
ในการสร้างเขื่อนกักเก็บน้ำเพื่อนำมาผลิตพลังงานไฟฟ้า กระแสไฟฟ้า หรือที่เราเรียกว่า Hydropower ก็เหมือนกับการก่อสร้างเขื่อนทั่วๆ ไป ที่มีวัตถุประสงค์เพื่อกักเก็บน้ำในฤดูฝนนำมาใช้ในฤดูแล้ง เพื่อให้มีน้ำใช้ได้ตลอดทั้งปี ครอบคลุมถึงการกักเก็บน้ำเพื่อใช้ในการเกษตร การบริโภค อุปโภค การป้องกันน้ำท่วม และเพื่อผลิตกระแสไฟฟ้า
โครงการโรงไฟฟ้าพลังน้ำ น้ำงึม 2 หรือโครงการก่อสร้างเขื่อนน้ำงึม 2 เป็นโครงการสร้างเขื่อนเพื่อผลิตกระแสไฟฟ้าให้กับ สปป.ลาว และส่วนหนึ่งส่งมาขายให้กับประเทศไทย ในการดำเนินการพัฒนาโครงการนอกจากพิจารณาถึงองค์ประกอบด้านวิศวกรรมหรือการก่อสร้างยังได้มีการศึกษาถึงปัญหาและ ผลกระทบด้านอื่นๆ ซึ่งพบว่าเมื่อโครงการก่อสร้างได้เข้าไปดำเนินการแล้ว ประชาชนที่เคยอยู่อาศัยในบริเวณที่เป็นอ่างน้ำ โรงไฟฟ้าและองค์ประกอบอื่นๆ จำนวน 16 หมู่บ้าน 1,059 ครัวเรือน จะได้รับ ผลกระทบและต้องถูกโยกย้าย
ดังนั้น การวางแผนงานโครงการ ภายใต้แผนการจัดการสิ่งแวดล้อมและสังคม บริษัท SEAN บริษัทรับเหมาก่อสร้าง และบริษัทที่ปรึกษา ได้ทำการศึกษาและวางแผนอย่างดีในการจัดสร้างชุมชนใหม่ ให้กับผู้ถูกโยกย้ายเพื่อให้ผู้ถูกโยกย้ายได้กลับมามีสถานะดังเดิมหรือดีกว่า ประกอบด้วย แผนการจัดการด้านสิ่งแวดล้อม (Environmental Management Plan) แผนปฏิบัติการจัดสร้างชุมชนใหม่ให้กับผู้ถูกโยกย้าย (Resettlement Action Plan) แผนพัฒนาทางด้านสังคม และแผนพัฒนาชนกลุ่มน้อย
การจัดการชุมชนใหม่ให้แก่ผู้ถูกโยกย้าย มี 2 ด้านหลักๆ คือ การจ่ายเงินชดเชยให้กับ ผู้ถูกโยกย้ายหรือได้รับผลกระทบ และการจัดสร้างชุมชนใหม่ให้กับผู้ถูกโยกย้าย โดยทั้ง 2 องค์ประกอบ ได้มีการสื่อสารและทำการประชาสัมพันธ์ให้กับผู้ถูกโยกย้ายเป็นระยะๆ ที่เรียกว่า Public Consultation เพื่อรับทราบข้อมูล วัตถุประสงค์ ความก้าวหน้าของโครงการ ตลอดจนรับทราบความคิดเห็นต่างๆ จากผู้ได้รับผลกระทบ นับเป็นกิจกรรมที่สำคัญและนำมาซึ่งความสำเร็จของการดำเนินโครงการ
นอกจากนี้อีกแผนงานหนึ่งที่มีความสำคัญ คือ การจัดการด้านสิ่งแวดล้อม ทั้งขณะเมื่อดำเนินการโครงการและหลังจากการก่อสร้างได้แล้วเสร็จ คือ การตรวจสอบคุณภาพน้ำเป็นระยะๆ ตาม Standard Methods for Examination of Water and Wastewater และแผนการจัดการต้นน้ำ เพื่อยืนยันถึงความยั่งยืนของอ่างเก็บน้ำในโครงการ ผู้ที่จะได้รับประโยชน์ และผู้ได้รับผลกระทบ
โครงการโรงไฟฟ้าพลังน้ำ น้ำงึม 2 นับเป็นอีกหนึ่งความภาคภูมิใจของนักธุรกิจไทย บริษัทที่ปรึกษา วิศวกร นักวิชาการคนไทย ในความสำเร็จก้าวหน้าของโครงการที่ได้ก้าวข้ามขอบประเทศไปทำงานด้านการพัฒนาให้กับประเทศเพื่อนบ้าน ในโครงการพัฒนาใหญ่ๆ ใช้เงินลงทุนสูง ในฐานะผู้รับสัมปทานการผลิตกระแสไฟฟ้าให้กับรัฐบาล สปป.ลาว ซึ่งจะเป็นโครงการตัวอย่างของการพัฒนาด้านเศรษฐกิจ สังคม และสิ่งแวดล้อมร่วมกันอย่างไม่มีพรมแดนต่อไป
โครงการโรงไฟฟ้าพลังน้ำ น้ำงึม 2 ตั้งอยู่ห่างจากกรุงเวียงจันทน์ สปป.ลาว ไปทางทิศเหนือประมาณ 90 กิโลเมตร ประกอบด้วยเขื่อนหินทิ้งดาดหน้าคอนกรีต สูง 181 เมตร ยาว 485 เมตร อ่างเก็บน้ำความจุ 6,774 ล้านลูกบาศก์เมตร โครงการติดตั้งเครื่องกำเนิดไฟฟ้าขนาด 615 เมกะวัตต์ จะสามารถผลิตไฟฟ้าได้ปีละ 2,218 กิกะวัตต์
โครงการไฟฟ้าพลังน้ำ น้ำงึม 2 กับการจัดการสังคมและสิ่งแวดล้อม
รศ. ดร. จีรเกียรติ อภิบุณโยภาส

25
Hydroelectric facilities, like most multi-purpose dams, are assigned to reserve water during the rainy season to mitigate drought effects in the dry season, for irrigated agriculture, domestic consumption, flood control, but for electricity generation purpose in particular.
The Nam Ngum 2 hydroelectric power project of the government of Lao People’s Democratic Republic (Lao PDR) is aiming to generate power for domestic use and partly for export to Thailand. During the construction phase, due to the project’s concession agreement with the Government of Lao PDR, the Environmental and Social Management Plan (ESMP) was conducted in order to alleviate impacts on inhabitants and the environment around the project area. The project covered 1,059 households in 16 villages that need to be resettled.
The ESMP assigned by the SouthEast Asia Energy Limited (SEAN) as a key shareholder in Nam Ngum 2 Power Company Limited (NN2PC) consists of the Environmental Manage-ment Plan (EMP), the Resettlement Action Plan (RAP), the Social Development Plan and the Ethnic Minorities Development Plan.
Resettlement consists of two measures: compensation for those affected by the con-struction or those to be resettled, and the provision of new settlement sites. These two measures need constant communication and public relations tasks with those concerned, also known as ‘Public Consultation’. Thus a meeting for affected stakeholders was arranged, providing them with information on project progress, and collecting ideas and suggestions from villagers, which is one of the keys to project success.
Besides the resettlement arrangement, routine water quality monitoring and manage-ment plan of headwaters are also vital to environmental management programs during and after the construction phase.
The Nam Ngum 2 hydroelectric power plant will be the proud achievement of Thai construction contractors, hydroelectric power project developers, and Thai engineering con-sultants, through working with the government of Lao PDR and its citizens. Hence this project will be an example of borderless cooperation towards development in economic, social, and environmental aspects.
Nam Ngum 2 Hydroelectric Power Plant is approximately 90 kilometers north of Vientiane. It is the concrete-faced rockfill dam (CRFD) with the crest length of 485 meters and dam height of 181 meters, a reservoir with storage capacity of 6,774 MCM. This 615 MW hydroelectric power plant can generate the annual energy of 2,218 GWh.
Hydroelectric Power Plant Project: NN2 and the Environmental and Social
Management Plan Assoc. Prof. Dr. Jeerakiat Apibunyopas
26
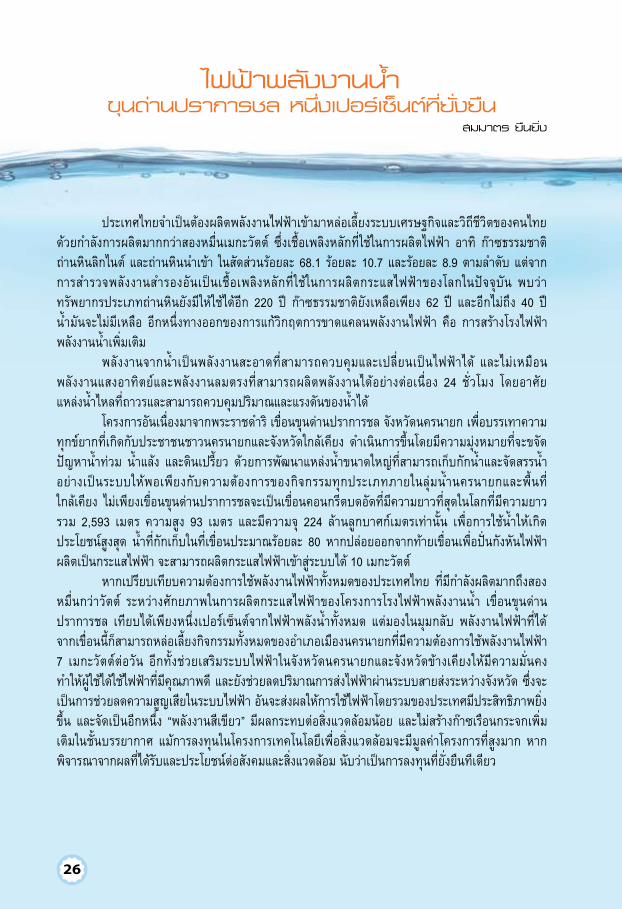
ประเทศไทยจำเป็นต้องผลิตพลังงานไฟฟ้าเข้ามาหล่อเลี้ยงระบบเศรษฐกิจและวิถีชีวิตของคนไทยด้วยกำลังการผลิตมากกว่าสองหมื่นเมกะวัตต์ ซึ่งเชื้อเพลิงหลักที่ใช้ในการผลิตไฟฟ้า อาทิ ก๊าซธรรมชาติ ถ่านหินลิกไนต์ และถ่านหินนำเข้า ในสัดส่วนร้อยละ 68.1 ร้อยละ 10.7 และร้อยละ 8.9 ตามลำดับ แต่จากการสำรวจพลังงานสำรองอันเป็นเชื้อเพลิงหลักที่ใช้ในการผลิตกระแสไฟฟ้าของโลกในปัจจุบัน พบว่าทรัพยากรประเภทถ่านหินยังมีให้ใช้ได้อีก 220 ปี ก๊าซธรรมชาติยังเหลือเพียง 62 ปี และอีกไม่ถึง 40 ปี น้ำมันจะไม่มีเหลือ อีกหนึ่งทางออกของการแก้วิกฤตการขาดแคลนพลังงานไฟฟ้า คือ การสร้างโรงไฟฟ้าพลังงานน้ำเพิ่มเติม
พลังงานจากน้ำเป็นพลังงานสะอาดที่สามารถควบคุมและเปลี่ยนเป็นไฟฟ้าได้ และไม่เหมือนพลังงานแสงอาทิตย์และพลังงานลมตรงที่สามารถผลิตพลังงานได้อย่างต่อเนื่อง 24 ชั่วโมง โดยอาศัย แหล่งน้ำไหลที่ถาวรและสามารถควบคุมปริมาณและแรงดันของน้ำได้
โครงการอันเนื่องมาจากพระราชดำริ เขื่อนขุนด่านปราการชล จังหวัดนครนายก เพื่อบรรเทาความทุกข์ยากที่เกิดกับประชาชนชาวนครนายกและจังหวัดใกล้เคียง ดำเนินการขึ้นโดยมีความมุ่งหมายที่จะขจัดปัญหาน้ำท่วม น้ำแล้ง และดินเปรี้ยว ด้วยการพัฒนาแหล่งน้ำขนาดใหญ่ที่สามารถเก็บกักน้ำและจัดสรรน้ำอย่างเป็นระบบให้พอเพียงกับความต้องการของกิจกรรมทุกประเภทภายในลุ่มน้ำนครนายกและพื้นที่ ใกล้เคียง ไม่เพียงเขื่อนขุนด่านปราการชลจะเป็นเขื่อนคอนกรีตบดอัดที่มีความยาวที่สุดในโลกที่มีความยาวรวม 2,593 เมตร ความสูง 93 เมตร และมีความจุ 224 ล้านลูกบาศก์เมตรเท่านั้น เพื่อการใช้น้ำให้เกิดประโยชน์สูงสุด น้ำที่กักเก็บในที่เขื่อนประมาณร้อยละ 80 หากปล่อยออกจากท้ายเขื่อนเพื่อปั่นกังหันไฟฟ้าผลิตเป็นกระแสไฟฟ้า จะสามารถผลิตกระแสไฟฟ้าเข้าสู่ระบบได้ 10 เมกะวัตต์
หากเปรียบเทียบความต้องการใช้พลังงานไฟฟ้าทั้งหมดของประเทศไทย ที่มีกำลังผลิตมากถึงสองหมื่นกว่าวัตต์ ระหว่างศักยภาพในการผลิตกระแสไฟฟ้าของโครงการโรงไฟฟ้าพลังงานน้ำ เขื่อนขุนด่านปราการชล เทียบได้เพียงหนึ่งเปอร์เซ็นต์จากไฟฟ้าพลังน้ำทั้งหมด แต่มองในมุมกลับ พลังงานไฟฟ้าที่ได้จากเขื่อนนี้ก็สามารถหล่อเลี้ยงกิจกรรมทั้งหมดของอำเภอเมืองนครนายกที่มีความต้องการใช้พลังงานไฟฟ้า 7 เมกะวัตต์ต่อวัน อีกทั้งช่วยเสริมระบบไฟฟ้าในจังหวัดนครนายกและจังหวัดข้างเคียงให้มีความมั่นคง ทำให้ผู้ใช้ได้ใช้ไฟฟ้าที่มีคุณภาพดี และยังช่วยลดปริมาณการส่งไฟฟ้าผ่านระบบสายส่งระหว่างจังหวัด ซึ่งจะเป็นการช่วยลดความสูญเสียในระบบไฟฟ้า อันจะส่งผลให้การใช้ไฟฟ้าโดยรวมของประเทศมีประสิทธิภาพยิ่งขึ้น และจัดเป็นอีกหนึ่ง “พลังงานสีเขียว” มีผลกระทบต่อสิ่งแวดล้อมน้อย และไม่สร้างก๊าซเรือนกระจกเพิ่มเติมในชั้นบรรยากาศ แม้การลงทุนในโครงการเทคโนโลยีเพื่อสิ่งแวดล้อมจะมีมูลค่าโครงการที่สูงมาก หากพิจารณาจากผลที่ได้รับและประโยชน์ต่อสังคมและสิ่งแวดล้อม นับว่าเป็นการลงทุนที่ยั่งยืนทีเดียว
ไฟฟ้าพลังงานน้ำ ขุนด่านปราการชล หนึ่งเปอร์เซ็นต์ที่ยั่งยืน
สมมาตร ยืนยิ่ง
27
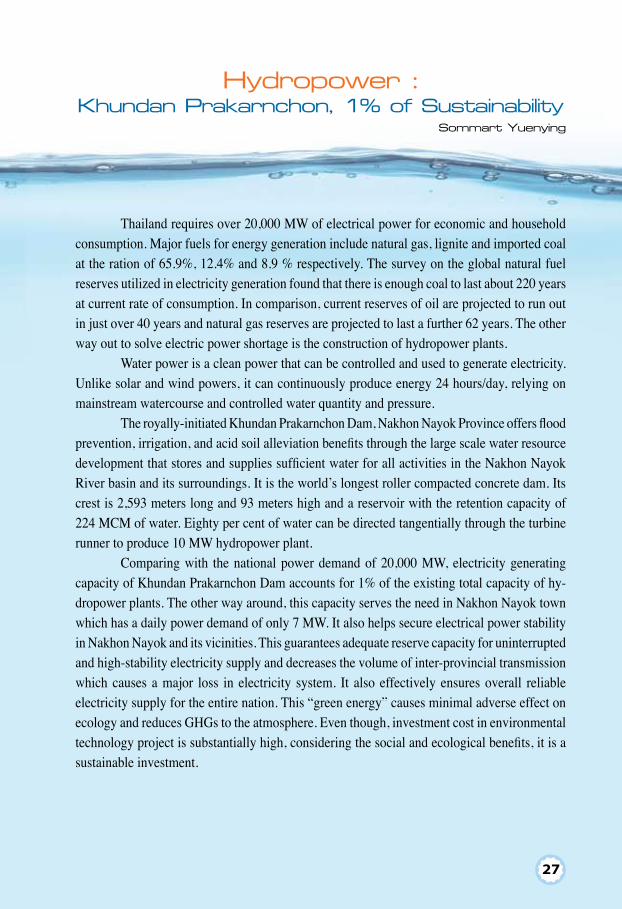
Thailand requires over 20,000 MW of electrical power for economic and household consumption. Major fuels for energy generation include natural gas, lignite and imported coal at the ration of 65.9%, 12.4% and 8.9 % respectively. The survey on the global natural fuel reserves utilized in electricity generation found that there is enough coal to last about 220 years at current rate of consumption. In comparison, current reserves of oil are projected to run out in just over 40 years and natural gas reserves are projected to last a further 62 years. The other way out to solve electric power shortage is the construction of hydropower plants.
Water power is a clean power that can be controlled and used to generate electricity. Unlike solar and wind powers, it can continuously produce energy 24 hours/day, relying on mainstream watercourse and controlled water quantity and pressure.
The royally-initiated Khundan Prakarnchon Dam, Nakhon Nayok Province offers flood prevention, irrigation, and acid soil alleviation benefits through the large scale water resource development that stores and supplies sufficient water for all activities in the Nakhon Nayok River basin and its surroundings. It is the world’s longest roller compacted concrete dam. Its crest is 2,593 meters long and 93 meters high and a reservoir with the retention capacity of 224 MCM of water. Eighty per cent of water can be directed tangentially through the turbine runner to produce 10 MW hydropower plant.
Comparing with the national power demand of 20,000 MW, electricity generating capacity of Khundan Prakarnchon Dam accounts for 1% of the existing total capacity of hy-dropower plants. The other way around, this capacity serves the need in Nakhon Nayok town which has a daily power demand of only 7 MW. It also helps secure electrical power stability in Nakhon Nayok and its vicinities. This guarantees adequate reserve capacity for uninterrupted and high-stability electricity supply and decreases the volume of inter-provincial transmission which causes a major loss in electricity system. It also effectively ensures overall reliable electricity supply for the entire nation. This “green energy” causes minimal adverse effect on ecology and reduces GHGs to the atmosphere. Even though, investment cost in environmental technology project is substantially high, considering the social and ecological benefits, it is a sustainable investment.
Hydropower : Khundan Prakarnchon, 1% of Sustainability
Sommart Yuenying


ได้รับการตีพิมพ์ในหนังสือพิมพ์ประชาชาติธุรกิจ วันพฤหัสบดีที่ 1-วันอาทิตย์ที่ 4 กรกฎาคม พ.ศ. 2553 ปีที่ 34 ฉบับที่ 4223 เซ็กชั่น ฮิวแมนแคปิตอล หน้า 34 คอลัมน์เปิดมุมมอง
31
Hydropower: พลังน้ำกับการผลิตพลังงานไฟฟ้า ม.ร.ว. วิพุธดนัย เทวกุล
การเคลื่อนที่ของน้ำเต็มไปด้วยพลังงานธรรมชาติมหาศาล เห็นได้จากการเกิด
อุทกภัยคราวใด จะก่อให้เกิดครามเสียหายต่อเรือกสวนไร่นา สิ่งปลูกสร้าง สาธารณูปโภค
ตลอดจนชีวิตของมนุษย์ การเคลื่อนที่ของน้ำโดยธรรมชาติจะไหลจากที่สูงลงสู่ที่ต่ำเสมอ
ซึ่งเกิดจากแรงดึงดูดของโลกนั่นเอง ดังนั้นหากควบคุมการเคลื่อนที่ของน้ำและนำพลังน้ำ
เหล่านี้มาใช้จะก่อให้เกิดประโยชน์เป็นคุณอนันต์
มนุษย์รู้จักนำพลังน้ำมาใช้งานให้เกิดประโยชน์มาแล้วหลายศตวรรษ การใช้
พลังงานน้ำในยุคแรกๆ เป็นการแปลงพลังน้ำเป็นพลังงานกล (Direct Mechanical Power
Transmission) ชาวโรมันสร้างกังหันน้ำ (Water Wheel) เพื่อใช้พลังงานกลในการสีข้าว
ชาวจีนนำพลังน้ำมาหมุนกังหันน้ำเพื่อยกน้ำเข้าไร่นา การใช้ประโยชน์โดยตรงเหล่านี้
ทำให้ต้องอยู่ใกล้แหล่งน้ำ ต่อมาเมื่อมนุษย์รู้จักพลังงานไฟฟ้าและผลิตกระแสไฟฟ้ามาใช้
ประโยชน์ จึงนำพลังน้ำมาเป็นต้นพลังในการผลิตกระแสไฟฟ้า แล้วจึงส่งกระแสไฟฟ้าไปยัง
ผู้ใช้ที่อยู่ห่างไกลออกไปเพื่อเปลี่ยนเป็นพลังงานที่ต้องการ เช่น พลังงานกล พลังงานแสง
สว่าง พลังงานความร้อน ฯลฯ
โครงการโรงไฟฟ้าพลังน้ำได้รับการพัฒนาอย่างมากมาย ทั้งในยุโรป อเมริกา
ออสเตรเลียและเอเชีย โดยเฉพาะในช่วงสิ้นสุดสงครามโลกครั้งที่ 2 ประเทศไทยมีการ
ศึกษาวางแผนดำเนินการโรงไฟฟ้าพลังน้ำขนาดใหญ่ครั้งแรกในโครงการก่อสร้างเขื่อน
ภูมิพล จ.ตาก ในช่วงทศวรรษที่ 2490 และเปิดทำการตั้งแต่ปี 2507 เป็นต้นมา
การพัฒนาโครงการโรงไฟฟ้าพลังน้ำมักจะทำในรูปแบบของโครงการอเนกประสงค์
(Multi-Purpose Project) กล่าวคือ เมื่อน้ำผ่านเครื่องกังหันน้ำเพื่อการผลิตกระแสไฟฟ้า
แล้ว จะถูกส่งต่อเข้าระบบชลประทานเพื่อการเกษตรกรรมต่อไป ส่วนอ่างเก็บน้ำสามารถใช้
ในการป้องกันอุทกภัย เป็นแหล่งประมงน้ำจืดขนาดใหญ่ และใช้เป็นแหล่งท่องเที่ยว
32
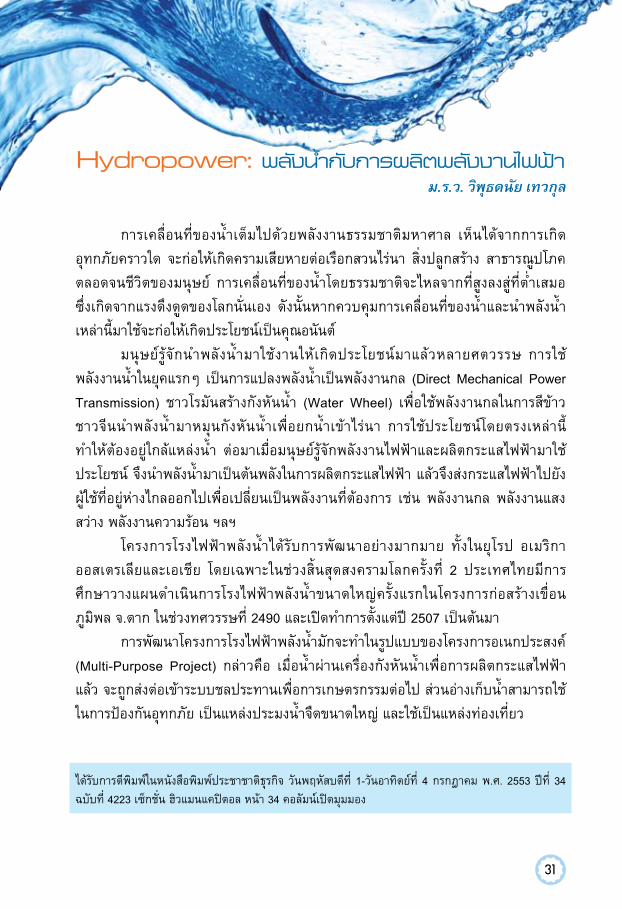
แล้วโรงไฟฟ้าพลังน้ำเป็นโรงไฟฟ้าประเภทเดียวในระบบไฟฟ้าหรือ? ความจริงแล้ว
ในระบบไฟฟ้าที่มีประสิทธิภาพสูงสุดต้องประกอบด้วยโรงไฟฟ้าหลายประเภท แต่ละ
ประเภทเหมาะสมที่จะสนองความต้องการในแต่ละช่วง ระบบไฟฟ้าของประเทศไทย
ประกอบด้วยโรงไฟฟ้า 4 ประเภท แต่ละประเภทจะกล่าวโดยสังเขปคือ
1. โรงไฟฟ้าพลังน้ำ (Hydropower Plant) เป็นการนำทรัพยากรน้ำมาใช้ผลิต
กระแสไฟฟ้า โดยอาศัยพลังน้ำมาหมุนกังหันน้ำซึ่งต่อเพลาตรงกับเครื่องกำเนิดไฟฟ้า
33
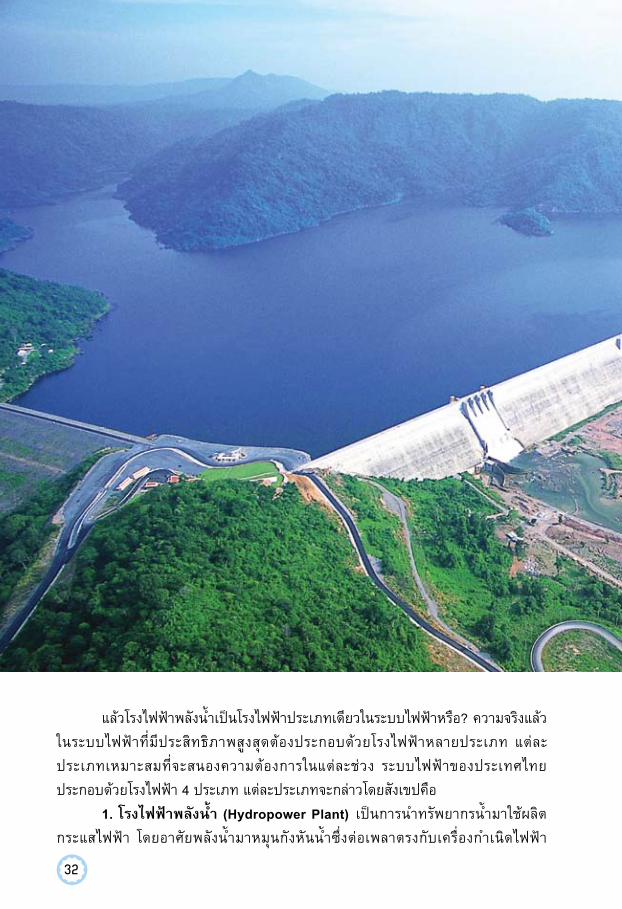
ตัวอย่างเช่น เขื่อนภูมิพล จ.ตาก เขื่อนศรีนครินทร์ จ.กาญจนบุรี เขื่อนรัชชประภา
จ.สุราษฎร์ธานี
2. โรงไฟฟ้าพลังไอน้ำ (Steam Power Plant) เป็นการแปรสภาพพลังงาน
เชื้อเพลิงไปเป็นพลังงานไฟฟ้าโดยใช้ไอน้ำเป็นตัวกลาง ปัจจุบันไทยใช้น้ำมันเตา ถ่าน
ลิกไนต์ และแก๊สธรรมชาติ เป็นเชื้อเพลิงนำไปต้มน้ำ เพื่อให้กลายเป็นไอน้ำในอุณหภูมิและ
ความดันที่ต้องการ แล้วส่งไอน้ำเข้าไปหมุนเครื่องกังหันไอน้ำที่มีเพลาต่ออยู่กับเครื่อง
เขื่อนขุนด่านปราการชล จ. นครนายก
34
กำเนิดไฟฟ้า ตัวอย่างเช่น โรงไฟฟ้าพระนครเหนือ โรงไฟฟ้าพระนครใต้ โรงไฟฟ้าแม่เมาะ
ในต่างประเทศยังมีการใช้เชื้อเพลิงเพลิงนิวเคลียร์ ถ่านหินคุณภาพดี เช่น แอนทราไซต์
(Anthracite) และบิทูมินัส (Bituminous)
3. โรงไฟฟ้ากังหันแก๊ส (Gas Turbine Power Plant) เครื่องกังหันแก๊สเป็น
เครื่องยนต์สันดาปภายใน เปลี่ยนสภาพพลังงานเชื้อเพลิงเป็นพลังงานไฟฟ้า ขั้นตอนการ
ทำงานมีการอัดอากาศให้มีความดันสูง 8-10 เท่า และส่งเข้าห้องเผาไหม้ที่มีเชื้อเพลิง
ทำการเผาไหม้ เมื่ออากาศในห้องเผาไหม้เกิดการขยายตัว ทำให้มีแรงดันและอุณหภูมิสูง
ก็จะส่งอากาศไปหมุนเพลาของเครื่องกังหันแก๊สที่ต่อผ่านชุดเกียร์เข้ากับเพลาของเครื่อง
กำเนิดไฟฟ้า โรงไฟฟ้าประเภทนี้ ได้แก่ โรงไฟฟ้ากังหันแก๊สสุราษฎร์ธานี โรงไฟฟ้ากังหัน
แก๊สหนองจอก กรุงเทพฯ โรงไฟฟ้ากังหันแก๊สไทรน้อย จ.นนทบุรี และโรงไฟฟ้ากังหันแก๊ส
ลานกระบือ จ.กำแพงเพชร
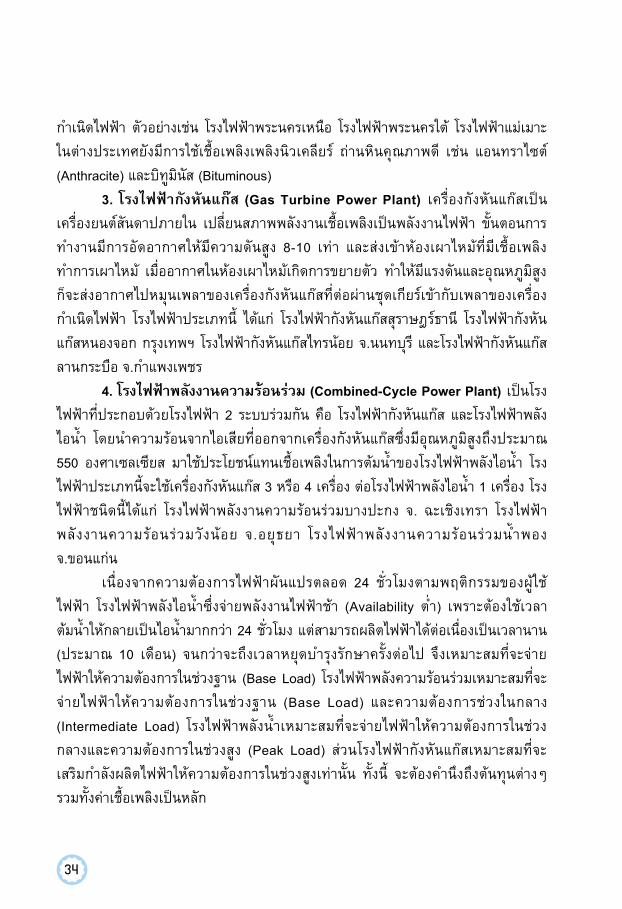
4. โรงไฟฟ้าพลังงานความร้อนร่วม (Combined-Cycle Power Plant) เป็นโรง
ไฟฟ้าที่ประกอบด้วยโรงไฟฟ้า 2 ระบบร่วมกัน คือ โรงไฟฟ้ากังหันแก๊ส และโรงไฟฟ้าพลัง
ไอน้ำ โดยนำความร้อนจากไอเสียที่ออกจากเครื่องกังหันแก๊สซึ่งมีอุณหภูมิสูงถึงประมาณ
550 องศาเซลเซียส มาใช้ประโยชน์แทนเชื้อเพลิงในการต้มน้ำของโรงไฟฟ้าพลังไอน้ำ โรง
ไฟฟ้าประเภทนี้จะใช้เครื่องกังหันแก๊ส 3 หรือ 4 เครื่อง ต่อโรงไฟฟ้าพลังไอน้ำ 1 เครื่อง โรง
ไฟฟ้าชนิดนี้ได้แก่ โรงไฟฟ้าพลังงานความร้อนร่วมบางปะกง จ. ฉะเชิงเทรา โรงไฟฟ้า
พลังงานความร้อนร่วมวังน้อย จ.อยุธยา โรงไฟฟ้าพลังงานความร้อนร่วมน้ำพอง
จ.ขอนแก่น
เนื่องจากความต้องการไฟฟ้าผันแปรตลอด 24 ชั่วโมงตามพฤติกรรมของผู้ใช้
ไฟฟ้า โรงไฟฟ้าพลังไอน้ำซึ่งจ่ายพลังงานไฟฟ้าช้า (Availability ต่ำ) เพราะต้องใช้เวลา
ต้มน้ำให้กลายเป็นไอน้ำมากกว่า 24 ชั่วโมง แต่สามารถผลิตไฟฟ้าได้ต่อเนื่องเป็นเวลานาน
(ประมาณ 10 เดือน) จนกว่าจะถึงเวลาหยุดบำรุงรักษาครั้งต่อไป จึงเหมาะสมที่จะจ่าย
ไฟฟ้าให้ความต้องการในช่วงฐาน (Base Load) โรงไฟฟ้าพลังความร้อนร่วมเหมาะสมที่จะ
จ่ายไฟฟ้าให้ความต้องการในช่วงฐาน (Base Load) และความต้องการช่วงในกลาง
(Intermediate Load) โรงไฟฟ้าพลังน้ำเหมาะสมที่จะจ่ายไฟฟ้าให้ความต้องการในช่วง
กลางและความต้องการในช่วงสูง (Peak Load) ส่วนโรงไฟฟ้ากังหันแก๊สเหมาะสมที่จะ
เสริมกำลังผลิตไฟฟ้าให้ความต้องการในช่วงสูงเท่านั้น ทั้งนี้ จะต้องคำนึงถึงต้นทุนต่างๆ
รวมทั้งค่าเชื้อเพลิงเป็นหลัก
35
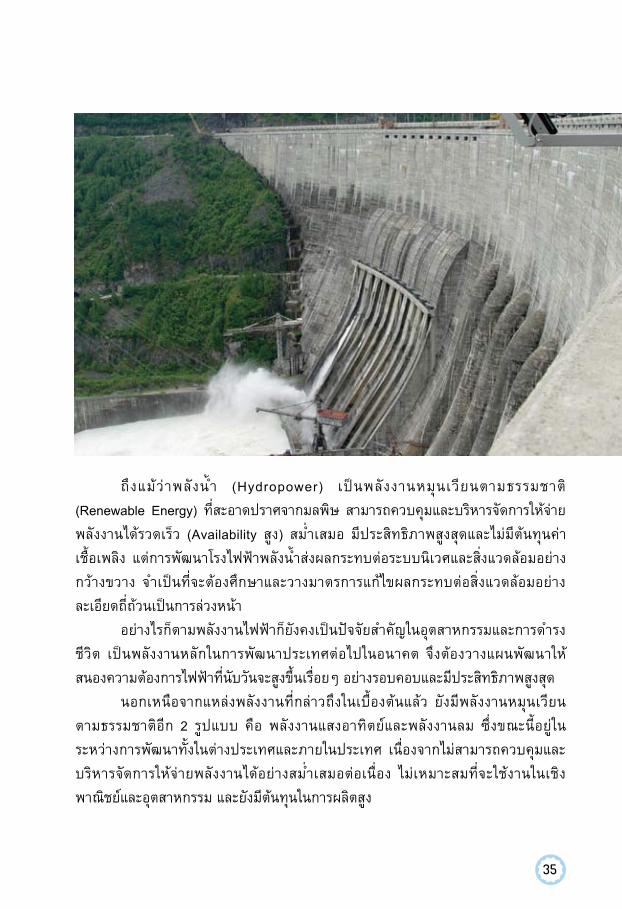
ถึงแม้ว่าพลังน้ำ (Hydropower) เป็นพลังงานหมุนเวียนตามธรรมชาติ
(Renewable Energy) ที่สะอาดปราศจากมลพิษ สามารถควบคุมและบริหารจัดการให้จ่าย
พลังงานได้รวดเร็ว (Availability สูง) สม่ำเสมอ มีประสิทธิภาพสูงสุดและไม่มีต้นทุนค่า
เชื้อเพลิง แต่การพัฒนาโรงไฟฟ้าพลังน้ำส่งผลกระทบต่อระบบนิเวศและสิ่งแวดล้อมอย่าง
กว้างขวาง จำเป็นที่จะต้องศึกษาและวางมาตรการแก้ไขผลกระทบต่อสิ่งแวดล้อมอย่าง
ละเอียดถี่ถ้วนเป็นการล่วงหน้า
อย่างไรก็ตามพลังงานไฟฟ้าก็ยังคงเป็นปัจจัยสำคัญในอุตสาหกรรมและการดำรง
ชีวิต เป็นพลังงานหลักในการพัฒนาประเทศต่อไปในอนาคต จึงต้องวางแผนพัฒนาให้
สนองความต้องการไฟฟ้าที่นับวันจะสูงขึ้นเรื่อยๆ อย่างรอบคอบและมีประสิทธิภาพสูงสุด
นอกเหนือจากแหล่งพลังงานที่กล่าวถึงในเบื้องต้นแล้ว ยังมีพลังงานหมุนเวียน
ตามธรรมชาติอีก 2 รูปแบบ คือ พลังงานแสงอาทิตย์และพลังงานลม ซึ่งขณะนี้อยู่ใน
ระหว่างการพัฒนาทั้งในต่างประเทศและภายในประเทศ เนื่องจากไม่สามารถควบคุมและ
บริหารจัดการให้จ่ายพลังงานได้อย่างสม่ำเสมอต่อเนื่อง ไม่เหมาะสมที่จะใช้งานในเชิง
พาณิชย์และอุตสาหกรรม และยังมีต้นทุนในการผลิตสูง
37
การพึ่งพาแหล่งพลังงาน เพื่อผลิตไฟฟ้าจากประเทศเพื่อนบ้าน
ชวลิต จันทรรัตน์
พลังงานไฟฟ้าเป็นปัจจัยสำคัญในการดำรงชีวิตของคนไทย ปัจจุบันความต้องการ
ใช้ไฟฟ้าของประเทศมีเพิ่มสูงขึ้นทุกปีในอัตราร้อยละ 1 ถึง 6 ต่อปี โดยมีค่าเพิ่มขึ้นเฉลี่ย
ร้อยละ 4.5 ต่อปี โดยในปี 2550 ประเทศไทยมีความต้องการไฟฟ้าสูงสุด 22,250 เมกะวัตต์
และในปี 2553 มีค่าสูงสุดถึง 23,250 เมกะวัตต์ ในเดือนเมษายน ซึ่งเป็นช่วงที่มีอากาศร้อน
เพื่อตอบสนองความต้องการดังกล่าว ประเทศไทยจะต้องสร้างโรงไฟฟ้าขนาดใหญ่ที่มีกำลัง
ผลิต 700 เมกะวัตต์ เพิ่มขึ้นทุกปี แต่ปัญหาคือ ประเทศไทยไม่มีเชื้อเพลิงเพียงพอที่จะผลิต
กระแสไฟฟ้า เพื่อตอบสนองความต้องการที่มีเพิ่มขึ้นทุกปีเช่นนี้ได้
ปัจจุบันประเทศไทยผลิตกระแสไฟฟ้าโดยใช้เชื้อเพลิงชนิดต่างๆ ร้อยละ 89 และ
นำเข้าไฟฟ้าพลังน้ำจากประเทศเพื่อนบ้านร้อยละ 5 โดยมีกำลังสำรองทั้งระบบประมาณ
ร้อยละ 10 ถึง 15 และจากแผนพัฒนาพลังงานไฟฟ้าของประเทศไทย (PDP) ฉบับ
กุมภาพันธ์ 2553 พบว่า ปี 2560 เป็นต้นไป ประเทศไทยจะต้องพึ่งพาพลังงานไฟฟ้าจาก
ประเทศเพื่อนบ้านในอัตราร้อยละ 26 กล่าวคือ เริ่มมีค่ามากกว่ากำลังไฟฟ้าสำรองในปีนั้นๆ
เพิ่มขึ้นเป็นร้อยละ 28 ในปี 2564 และเพิ่มสูงถึงร้อยละ 30 ในปี 2570
นั่นคือ ประเทศไทยจะต้องพึ่งพาพลังงานไฟฟ้าจากประเทศเพื่อนบ้านมากกว่า
กำลังสำรองของไฟฟ้าทั้งระบบของประเทศในเกณฑ์ปกติ และจะใช้พลังงานไฟฟ้าจาก
ประเทศเพื่อนบ้านถึงหนึ่งในสี่ของความต้องการใช้ไฟฟ้าทั้งประเทศ ดังนั้นจึงมีความ
จำเป็นที่จะต้องศึกษาหาแผนทางเลือกที่เป็นไปได้ในการพัฒนาพลังงานไฟฟ้าของประเทศ
โดยใช้มาตรการและยุทธศาสตร์ในการถ่วงดุลแหล่งพลังงานไฟฟ้า ลดความเสี่ยง และจำกัด
ผลกระทบให้อยู่ในวงแคบและในระดับที่ยอมรับได้
จากการศึกษาพบว่า ความต้องการใช้ไฟฟ้าของประเทศไทยมีเพิ่มสูงขึ้นทุกปีใน
อัตราเฉลี่ยร้อยละ 4.5 โดยเพิ่มขึ้นสูงมากในปี 2550 กล่าวคือ สูงขึ้นถึงร้อยละ 12.76 จากปี
ก่อน อย่างไรก็ตามความต้องการกำลังไฟฟ้าสูงสุดของปี 2551 ไม่ได้เพิ่มขึ้น เนื่องจาก
เศรษฐกิจชะลอตัว และอุณหภูมิในฤดูร้อนของปี 2551 ไม่สูงมากเหมือนปีที่ผ่านมา
38
อย่างไรก็ตามในปี 2553 ความต้องการใช้ไฟฟ้าสูงสุดก็ได้เพิ่มขึ้นเป็น 23,250
เมกะวัตต์ กล่าวคือเพิ่มขึ้นร้อยละ 4.2 นอกจากนี้จากการคาดการณ์ในระยะยาวจัดทำโดย
สำนักงานนโยบายและแผนพลังงาน กระทรวงพลังงาน ในปี 2553 พบว่า ความต้องการ
กำลังผลิตจะเพิ่มขึ้นจาก 23,250 เมกะวัตต์ ในปัจจุบันขึ้นไปเป็น 37,856 เมกะวัตต์ในปี
2564 โดยเพิ่มขึ้นเฉลี่ยปีละ 1,300 เมกะวัตต์ และเพิ่มขึ้นเป็น 52,890 เมกะวัตต์ ในปี
2573 กล่าวคือเพิ่มขึ้นเฉลี่ยปีละ 1,600 เมกะวัตต์ ในช่วง 10 ปี ดังกล่าว
ประเด็นสำคัญคือประเทศไทยมีการใช้ไฟฟ้าสูงกว่าประเทศเพื่อนบ้าน เช่น
สปป.ลาว ราชอาณาจักรกัมพูชา และสหภาพพม่า เป็นอย่างมาก โดยที่ไทยมีแหล่ง
พลังงานน้อยกว่า ไม่ว่าจะเป็นน้ำมัน ถ่านหิน ก๊าซธรรมชาติ หรือแม้แต่พลังน้ำ จึงมีความ
จำเป็นที่ประเทศไทยจะต้องพึ่งพาอาศัยแหล่งพลังงานจากประเทศเพื่อนบ้าน โดยจะต้อง
วางแผนพัฒนากำลังผลิต แผนการจัดซื้อไฟฟ้าและซื้อเชื้อเพลิงจากประเทศเพื่อนบ้าน
อย่างรัดกุมเหมาะสม ให้มีความเสี่ยงในระดับที่ไม่มากเกินไป
จากการศึกษาเปรียบเทียบต้นทุนการผลิตไฟฟ้าจากเชื้อเพลิงต่างๆ พบว่า
โรงไฟฟ้านิวเคลียร์มีต้นทุนการผลิตไฟฟ้าต่ำที่สุด (2.08 บาทต่อหน่วย) ถัดไปเป็นโรง
ไฟฟ้าถ่านหิน โรงไฟฟ้าก๊าซธรรมชาติ และโรงไฟฟ้าชีวมวล (2.63 บาทต่อหน่วย) ตาม
ลำดับ ส่วนไฟฟ้าพลังน้ำนั้นค่าลงทุนขึ้นอยู่กับสภาพภูมิประเทศและปริมาณน้ำท่า ซึ่งหาก
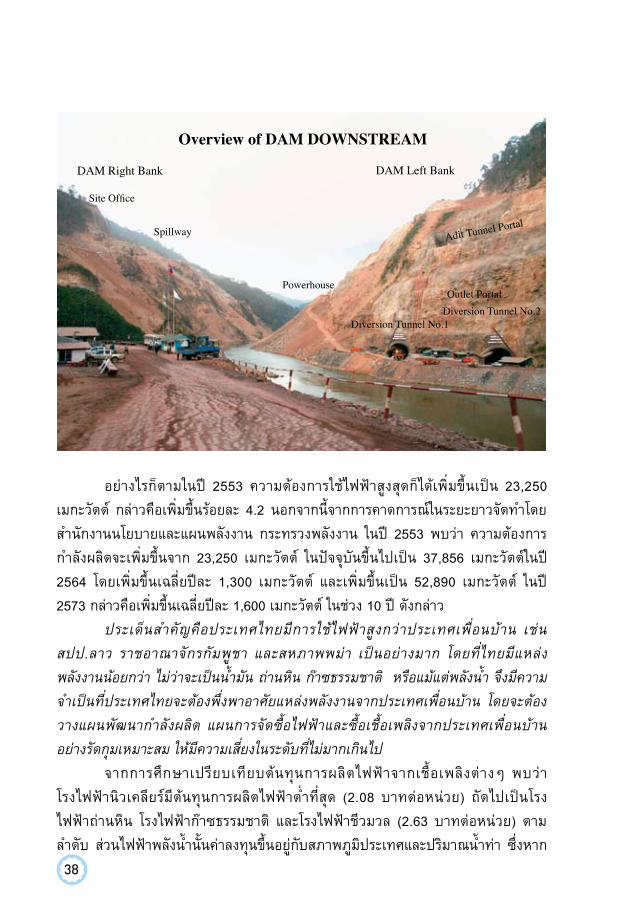
Overview of DAM DOWNSTREAM
DAM Right Bank
Site Office
Spillway
Powerhouse
Diversion Tunnel No.1
Outlet Portal
Adit Tunnel Portal
Diversion Tunnel No.2
DAM Left Bank
39
เป็นโครงการในสปป.ลาว ต้นทุนการผลิตจะมีค่าในช่วง 2.0 ถึง 2.60 บาทต่อหน่วย (kWh)
โดยในประเทศเพื่อนบ้านได้แก่ สปป.ลาว ราชอาณาจักรกัมพูชา และสหภาพพม่า ยังมี
ศักยภาพที่จะสร้างโรงไฟฟ้าพลังน้ำได้อีกไม่น้อยกว่า 11,000 และ 12,000 เมกะวัตต์ ตาม
ลำดับ นอกจากนั้นก็จะเป็นโรงไฟฟ้าที่ใช้ถ่านหินและก๊าซธรรมชาติเป็นเชื้อเพลิง
แผนพัฒนากำลังผลิตไฟฟ้าของประเทศไทย (PDP ฉบับปรับปรุง ครั้งที่ 1
มกราคม 2551 และฉบับกุมภาพันธ์ 2553) วางแผนที่จะผลิตไฟฟ้าภายในประเทศโดยใช้
ก๊าซธรรมชาติ ถ่านหิน และไฟฟ้าพลังน้ำ โดยมีเป้าหมายจะลดการใช้ก๊าซธรรมชาติ
ในปัจจุบันร้อยละ 66 เหลือเพียงร้อยละ 36 ในปี 2564 โดยจะนำเข้าก๊าซธรรมชาติจาก
ประเทศเพื่อนบ้านเพื่อผลิตกระแสไฟฟ้าถึงร้อยละ 12.5 และเพิ่มการใช้ไฟฟ้าพลังน้ำจาก
ร้อยละ 6 เป็นร้อยละ 29 โดยพึ่งพาการนำเข้าจากประเทศเพื่อนบ้านถึงร้อยละ 28 ผลิตใน
ประเทศในปี 2564 เพียงร้อยละ 1 และได้วางแผนจะใช้โรงไฟฟ้านิวเคลียร์โดยให้เริ่มส่งจ่าย
ไฟฟ้าได้ตั้งแต่ปี 2563 เป็นต้นไป โดยจะสร้างโรงไฟฟ้านิวเคลียร์ขนาดโรงละ 2x1,000
เมกะวัตต์ จำนวน 2 โรง ส่งจ่ายไฟฟ้าได้ในปี 2563 จำนวน 1,000 เมกะวัตต์ และในปี
2564 อีก 1,000 เมกะวัตต์
จากการวิเคราะห์ความเสี่ยงของแผนการพัฒนากำลังผลิตไฟฟ้าฯ พบว่ามี
ความเสี่ยงด้านการเงินจากการเพิ่มขึ้นเป็นอย่างมากเนื่องจากการเพิ่มขึ้นของราคาน้ำมัน
เหล็ก และวัสดุก่อสร้าง ซึ่งมีผลทำให้ค่าก่อสร้างโดยรวมเพิ่มขึ้นจากค่าก่อสร้างในปี 2550
ถึงร้อยละ 30 ถึง 40 ซึ่งจะมีผลทำให้โครงการมีผลตอบแทนการลงทุนลดต่ำลงมาก และจะ
ต้องใช้เงินลงทุนในการก่อสร้างมากขึ้น อาจจะมีผลทำให้โครงการชะลอ ชะงัก หรืออาจจะ
ถึงกับเลิกล้มโครงการด้วยหากไม่มีการเพิ่มค่าไฟฟ้า
นอกจากนั้นก็ยังมีความเสี่ยงจากการก่อการร้ายหรือก่อวินาศกรรม ซึ่งก็ได้เคย
เกิดเหตุการณ์ขึ้นเมื่อวันที่ 2 เมษายน 2551 ทำให้ท่อขนส่งก๊าซธรรมชาติจากบ่อเยตากุน
เสียหาย ต้องใช้เวลาในการซ่อมแซม 10 วัน และต้องดำเนินการในภาวะฉุกเฉินหลาย
ประการเพื่อควบคุมไม่ให้เกิดผลกระทบต่อผู้ใช้ไฟฟ้า
ดังนั้น จึงควรวางแผนพัฒนาโครงการ โดยคำนึงถึงความเสี่ยงที่อาจจะเกิดจาก
เหตุต่างๆ และวางแผนกระจายชนิดของเชื้อเพลิงที่ใช้ แหล่งพลังงานที่ใช้ และแหล่ง
เชื้อเพลิงที่จะนำมาใช้งาน เพื่อลดผลกระทบที่เกิดจากเหตุการณ์ต่างๆ ให้มีขนาดน้อยที่สุด
จำกัดให้เกิดผลกระทบในวงแคบในพื้นที่ที่เล็กที่สุด โดยให้เกิดผลกระทบในระยะเวลาสั้น
ที่สุดด้วย โดยเตรียมพร้อมที่จะปฏิบัติตามมาตรการต่างๆ ในสถานการณ์ฉุกเฉิน โดย
เตรียมกำลังสำรองให้เพียงพอ อยู่ในสภาพที่พร้อมใช้งาน และมีการฝึกซ้อมอย่างสม่ำเสมอ
ด้วย
40
จากการศึกษาเพื่อจัดทำแผนเผื่อเลือกนั้น พบว่าควรกำหนดเป้าหมายให้มีการ
พึ่งพาไฟฟ้าและก๊าซธรรมชาติเพื่อการผลิตฟ้าจากประเทศเพื่อนบ้านจากแต่ละประเทศ
ให้อยู่ในระดับที่เหมาะสมยิ่งขึ้น และควรปรับเปลี่ยนแผนพัฒนาฯ เดิมเฉพาะโรงไฟฟ้าที่ยัง
ไม่ได้ตกลงกันไว้ (ยังไม่ระบุชื่อในแผน) กล่าวคือตั้งแต่ปี 2560 ถึง 2564 ซึ่งพบว่า
สามารถจะกระจายความเสี่ยงของการพึ่งพาไฟฟ้ารวมก๊าซธรรมชาติที่ใช้ในการผลิตไฟฟ้า
จากแต่ละประเทศได้ไม่เกินร้อยละ 15 ตามเป้าหมาย ส่วนการพึ่งพาไฟฟ้าจากประเทศ
เพื่อนบ้านรวมทุกประเทศไม่เกินร้อยละ 30 นั้น จะต้องก่อสร้าง
โรงไฟฟ้าถ่านหิน ก๊าซธรรมชาติหรือ นิวเคลียร์ในประเทศไทย
เพิ่มขึ้นอีกรวม 3,200 เมกะวัตต์ ให้เริ่มส่งจ่ายไฟฟ้าได้ในปี
2563 และ 2564
รัฐโดยหน่วยงานที่ เกี่ยวข้องควรจะปรับปรุงให้การ
วางแผนพัฒนากำลังผลิตไฟฟ้าของประเทศไทย และการดำเนิน
การด้านอื่นๆ ที่เกี่ยวข้องให้มีความสมบูรณ์ยิ่งขึ้นดังต่อไปนี้
1. การพึ่งพาไฟฟ้า รวมถึงการพึ่งพาก๊าซธรรมชาติที่ใช้
ในการผลิตไฟฟ้าจากประเทศใดประเทศหนึ่ง ควรกำหนดให้มีค่า
ไม่เกินร้อยละ 15 ของความต้องการกำลังไฟฟ้ารวมของประเทศ
(รวมกำลังสำรอง) ในปีนั้นๆ เพื่อลดความเสี่ยงจากการพึ่งพา
ไฟฟ้าจากแต่ละประเทศ และเมื่อรวมการพึ่งพาประเทศเพื่อนบ้าน
ทั้ง 3 ประเทศแล้ว ควรมีปริมาณไม่เกินร้อยละ 30 ของ
ความต้องการกำลังผลิตในปีดังกล่าว
2. เนื่องจากประเทศไทยมีเชื้อเพลิงในการผลิตไฟฟ้าไม่เพียงพอ และจากการเพิ่ม
ขึ้นของราคาน้ำมัน ก๊าซธรรมชาติ และถ่านหิน ของตลาดโลก เนื่องจากปริมาณที่มีอยู่จะ
ถูกใช้ให้หมดไปไม่เกินปี 2590 นั้น ทำให้มีความจำเป็นอย่างหลีกเลี่ยงไม่ได้ที่จะต้องสร้าง
โรงไฟฟ้าพลังนิวเคลียร์ขึ้น เพื่อให้สามารถจ่ายไฟฟ้าได้ 1,000 เมกะวัตต์ ในปี 2563 และ
2564 และต่อไปในทุกๆ 3 ปี อีกด้วย ทั้งนี้เพื่อเป็นการควบคุมให้การพึ่งพาแหล่งพลังงาน
จากประเทศเพื่อนบ้านให้อยู่ในอัตราไม่เกินร้อยละ 30 ของความต้องการกำลังผลิตไฟฟ้า
ในปีดังกล่าว ตามแผนที่เสนอไว้ในข้อ 1 ข้างต้น
3. การกำหนดแผนพัฒนากำลังคน (Human Resources Development) ให้มี
วิศวกรระบบไฟฟ้าพลังนิวเคลียร์ นักวิชาการนิวเคลียร์ ในระดับผู้บริหารหน่วยโรงไฟฟ้า
หัวหน้าฝ่าย หัวหน้าชุดปฏิบัติงานที่ต้องทำงานเป็น 3 กะ และผู้ปฏิบัติงานในโรงไฟฟ้า
นิวเคลียร์ให้มีความพร้อม มีความรู้ มีประสบการณ์ที่ได้ฝึกฝนการปฏิบัติงานจริงใน
41
โรงไฟฟ้านิวเคลียร์ที่สร้างเสร็จแล้วจนมีความชำนาญและให้มีจำนวนเพียงพอรวมประมาณ
200 คน ต่อ 1 โรงไฟฟ้านิวเคลียร์ เพื่อให้ทันตามแผนการสร้างตามข้อ 2 ข้างต้น
4. ปรับค่าก่อสร้างโรงไฟฟ้าทุกแห่งขึ้นตามราคาค่าก่อสร้างที่สะท้อนถึงค่าก่อสร้าง
จริงที่เพิ่มขึ้นเนื่องจากราคาน้ำมัน เหล็ก และวัสดุก่อสร้าง เพื่อการจัดเตรียมงบประมาณให้
มีจำนวนเพียงพอ ไม่ก่อให้เกิดปัญหาการหยุดชะงัก ชะลอ หรือล้มเลิกโครงการ
5. ทบทวนปรับเพิ่มค่าไฟฟ้าที่จะซื้อจากภาคเอกชน (Tariff Rate) ให้เหมาะสมกับ
ค่าก่อสร้างโครงการที่เพิ่มสูงขึ้น จากการวิเคราะห์โครงการ
ตัวอย่างพบว่าควรปรับราคาซื้อขายไฟฟ้าจาก สปป.ลาวขึ้นเป็น
7.5 เซ็นต์อเมริกาต่อหน่วย (US Cents/kWh) เพื่อให้เอกชน
ผู้ลงทุนสามารถดำเนินโครงการได้อย่างคุ้มค่าการลงทุนต่อไป
6. ลดความเสี่ยงจากการผันผวนทางเศรษฐกิจ การ
ก่อการร้าย การก่อวินาศกรรม การเปลี่ยนแปลงทางการเมือง
ภายในประเทศ การเมืองและความสัมพันธ์ระหว่างประเทศ โดย
การสร้างความสัมพันธ์อันดี ความเป็นมิตรกับประเทศเพื่อนบ้าน
และกับกลุ่มต่างๆ ที่เกี่ยวข้อง รวมถึงกลุ่มคนที่อยู่ในพื้นที่แนว
สายส่งไฟฟ้าแรงสูงและแนวท่อส่งก๊าซธรรมชาติ นอกจากนั้นควร
กำหนดมาตรการในการกระจายความเสี่ยงในการเจรจาให้ไปเป็น
คู่เจรจาหลายประเทศและหลายกลุ่มคน โดยการพึ่งพาพลังงาน
จากหลายแหล่ง จากหลายประเทศเพื่อถ่วงดุล และเป็นการเพิ่ม
อำนาจในการต่อรองอีกด้วย
7. ปรับแผนพัฒนาการผลิตไฟฟ้าในช่วงปี 2560 ถึง 2564 โดยคำนึงถึงการ
กระจายการพึ่งพาไฟฟ้ารวมถึงก๊าซธรรมชาติที่จะใช้ในการผลิตไฟฟ้าจากแต่ละประเทศ
เพื่อควบคุมระดับการพึ่งพาให้อยู่ในระดับที่มีความเสี่ยงไม่มากเกินไป (ดังที่กล่าวไว้ในข้อ 1)
8. เนื่องจากในปัจจุบันประเทศไทยนำเข้าก๊าซธรรมชาติจากแหล่งยานาดา และเย
ตากุนในปริมาณ 1,050 ล้านลูกบาศก์ฟุตต่อวันมาใช้ในการผลิตไฟฟ้าประมาณ 6,600
เมกะวัตต์ ซึ่งเป็นปริมาณที่สูงมากแล้ว ในอนาคตการใช้ก๊าซธรรมชาติจากบ่อ M9 ในทะเล
อันดามันของสหภาพพม่า ซึ่งมีปริมาณ 240 ล้านลูกบาศก์ฟุตต่อวันที่จะสามารถใช้กับ
โรงไฟฟ้าได้ 1,600 เมกกะวัตต์ นั้น ไม่ควรใช้ในการผลิตไฟฟ้า ควรนำมาใช้ในอุตสาหกรรม
ปิโตรเคมี และอุตสาหกรรมอื่นๆ เพื่อสร้างมูลค่าเพิ่มจากก๊าซธรรมชาติดังกล่าว และใช้ใน
ภาคการขนส่งเพื่อทดแทนการใช้น้ำมันที่มีราคาสูงกว่า ทั้งนี้เพื่อลดความเสี่ยงที่เกิดจาก
การใช้ก๊าซธรรมชาติจากประเทศเพื่อนบ้านในการผลิตกระแสไฟฟ้าลงได้อีกด้วย
42
43
Nam Bak 1 HydropowerProject in Lao PDR
Rule Curves OptimizationPinchai Vibulsirikul
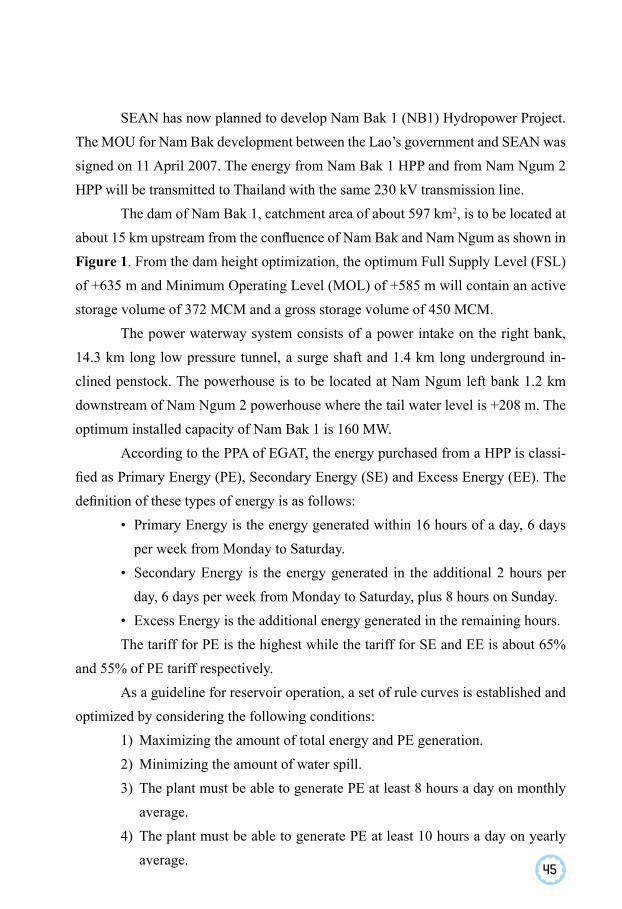
1. Project BackgroundNam Bak is the main tributary of Nam Ngum. It joins Nam Ngum at about
1.5 km downstream of Nam Ngum 2 (NN2) dam. The hydropower potential in Nam Bak basin has been identified since 1970.
Nam Ngum, a main tributary of the Mekong River with catchment area about 16,640 km2, joins the Mekong River on the left bank at about 60 km downstream of Nong Khai province, Thailand.
The development of hydropower in Nam Ngum started in 1968 by the con-struction of Nam Ngum 1 dam with the total installed capacity of 150 MW. The de-velopment is the beginning of cooperation between Lao PDR and Thailand on power trade since most of the energy from this project has been sold to Thailand.
SouthEast Asia Energy Limited (SEAN) is presently developing Nam Ngum 2 Hydropower Project (HPP) as an Independent Power Producer (IPP) for selling energy to Thailand. The project is of reservoir type located at the upstream tip of Nam Ngum 1 reservoir, which was developed as the intermediate peaking plant with 615 MW installed capacity. The commercial operation date specified in the Power Purchase Agreement (PPA) with the Electricity Generating Authority of Thailand (EGAT) is 1 January 2013.
Published in The International Journal on Hydropower & Dams, September 2010. Session 16 - Asset Management and Optimizing Operation.
44
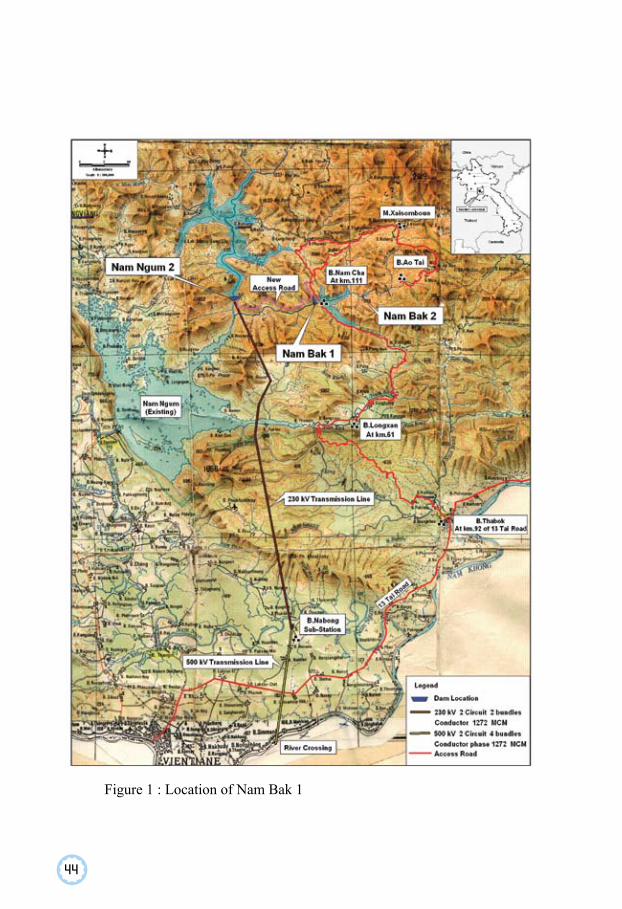
Figure 1 : Location of Nam Bak 1
45
SEAN has now planned to develop Nam Bak 1 (NB1) Hydropower Project. The MOU for Nam Bak development between the Lao’s government and SEAN was signed on 11 April 2007. The energy from Nam Bak 1 HPP and from Nam Ngum 2 HPP will be transmitted to Thailand with the same 230 kV transmission line.
The dam of Nam Bak 1, catchment area of about 597 km2, is to be located at about 15 km upstream from the confluence of Nam Bak and Nam Ngum as shown in Figure 1. From the dam height optimization, the optimum Full Supply Level (FSL) of +635 m and Minimum Operating Level (MOL) of +585 m will contain an active storage volume of 372 MCM and a gross storage volume of 450 MCM.
The power waterway system consists of a power intake on the right bank, 14.3 km long low pressure tunnel, a surge shaft and 1.4 km long underground in-clined penstock. The powerhouse is to be located at Nam Ngum left bank 1.2 km downstream of Nam Ngum 2 powerhouse where the tail water level is +208 m. The optimum installed capacity of Nam Bak 1 is 160 MW.
According to the PPA of EGAT, the energy purchased from a HPP is classi-fied as Primary Energy (PE), Secondary Energy (SE) and Excess Energy (EE). The definition of these types of energy is as follows:
• Primary Energy is the energy generated within 16 hours of a day, 6 days per week from Monday to Saturday.
• Secondary Energy is the energy generated in the additional 2 hours per day, 6 days per week from Monday to Saturday, plus 8 hours on Sunday.
• Excess Energy is the additional energy generated in the remaining hours.The tariff for PE is the highest while the tariff for SE and EE is about 65%
and 55% of PE tariff respectively.As a guideline for reservoir operation, a set of rule curves is established and
optimized by considering the following conditions:1) Maximizing the amount of total energy and PE generation.2) Minimizing the amount of water spill.3) The plant must be able to generate PE at least 8 hours a day on monthly
average.4) The plant must be able to generate PE at least 10 hours a day on yearly
average.
46
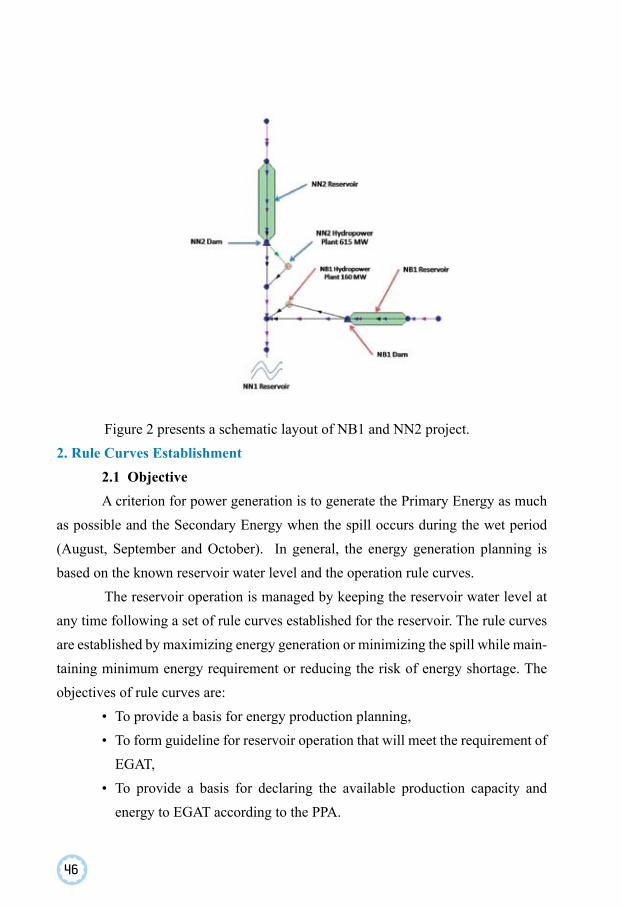
Figure 2 presents a schematic layout of NB1 and NN2 project.2. Rule Curves Establishment
2.1 Objective A criterion for power generation is to generate the Primary Energy as much
as possible and the Secondary Energy when the spill occurs during the wet period (August, September and October). In general, the energy generation planning is based on the known reservoir water level and the operation rule curves.
The reservoir operation is managed by keeping the reservoir water level at any time following a set of rule curves established for the reservoir. The rule curves are established by maximizing energy generation or minimizing the spill while main-taining minimum energy requirement or reducing the risk of energy shortage. The objectives of rule curves are:
• To provide a basis for energy production planning,• To form guideline for reservoir operation that will meet the requirement of
EGAT,• To provide a basis for declaring the available production capacity and
energy to EGAT according to the PPA.
47
2.2 AssumptionSince the flow varies from year to year, two sets of rule curves need to be es-
tablished, i.e. upper rule curve (URC) and lower rule curve (LRC). URC represents the strategy for reservoir operation in the wet year and LRC the dry year. From the long-term monthly inflow data, the wet season period covers 5 months from June to October and the remaining 7 months from November to May are the dry season period.
From the flow pattern, the reservoir level should be kept at a high level in October to store as much water as possible for energy generation in the following dry season, and at a low level in May to provide reservoir volume for storing surplus water during the following rainy season.
The assumptions for establishing the rule curves are as follows:• The inflow to NB1 follows the available record of 37 years data. The
analysis of the long-term data gives the yearly inflow of 750 MCM, 1,000 MCM, and 500 MCM for normal year, wet year, and dry year, respectively.
• In establishing URC, the flow of seven months of the dry season is based on the monthly flow pattern of the normal year while the flow of the five months of the rainy season is based on the monthly flow pattern of the wet year. A yearly inflow of 965 MCM represents the amount of flow for URC establishment.
• The yearly inflow of 500 MCM which is a representative flow of dry year is the basis for LRC establishment.
• At the end of the rainy season, i.e. end of October, the reservoir water level is to be kept at the full supply level of +635 m MSL for a wet year and +620 m MSL for a dry year. While at the end of dry season, i.e. end of May, the reservoir water level is to be kept at +597.5 m MSL for a wet year and +590 m MSL for a dry year.
• The outflow is manageable especially during the dry season.• The Reservoir volume curve is based on a detailed topographic map of
scale 1:10,000 with 5 m contour interval.
48
• The water use rate for energy generation is based on the typical value of machine efficiency
• The reservoir operation will follow the conditions in the EGAT’s PPA.2.3 Computation for Upper Rule Curve (URC)(1) 1st Stage• The total amount of outflow to turbine during the incoming seven months
of the dry season is the difference of reservoir storage between level +635 m MSL to +597.5 m MSL plus the sum of monthly inflow of normal year within this period minus the amount of reservoir evaporation. This total amount of outflow is to be released equally on the daily basis except Sunday.
• From the known amount of inflow and outflow for each month and the known reservoir level at the beginning of month starting from November, the successive end of month reservoir level can be computed from reservoir water balance.
• With the known averaged reservoir level of the month, the generating capacity can be declared.
• From the known generation capacity, the water use rate for energy production can be calculated.
• From the amount of outflow and water use rate, the amount of energy generated in the month can be computed.
• The number of hours for energy production in the month then can be computed from the amount of energy production and the generating capacity.
In summary, the URC for the 1st stage or seven months of dry season (No-vember to May) can be fixed by managing outflow to the turbine.
(2) 2nd Stage• The total amount of outflow to turbine during the incoming five months of
the rainy season are the sum of monthly inflow of a wet year during this five months period minus the difference of reservoir storage between +635 m MSL to +597.5 m MSL and the amount of reservoir evaporation.
49
The monthly outflow to the turbine during this five months period is be released unequally.
• The number of hours for energy production in June and July is limited to not more than 16 hours a day and then the amount of outflow for each month is calculated.
• The reservoir level at the end of month in June and July is computed from the balance of inflow and outflow.
• The outflow in August, September and October can be released more than 16 hours a day to avoid spilling.
• The reservoir level at end of month in August, September and October can be computed from reservoir water balance.
• From the known water level in the month, the production capacity, energy and number of hours can be computed.
2.4 Optimization for Lower Rule Curve (LRC)(1) 1st Stage• The total amount of outflow to turbine during the incoming seven months
of the dry season is the difference of reservoir storage between level +620 m MSL to +590 m MSL plus the sum of monthly inflow within this period minus the amount of reservoir evaporation. This total amount of outflow will be managed to be released equally on the daily basis except Sunday.
• From the known outflow, the reservoir level at the end of month, production capacity, energy and number of hours for energy production for each month can be computed in the same way as in the computation for URC.
(2) 2nd Stage• The total amount of outflow to turbine during the incoming five months
of the rainy season is the sum of inflow during this period minus the difference of reservoir storage between +620 m MSL to +590 m MSL and the amount of reservoir evaporation. This total amount of outflow will be managed to be released equally on the daily basis except Sunday.
50
• From the known outflow, the reservoir level at the end of month, production capacity, energy and number of hours for energy production for each month can be computed.
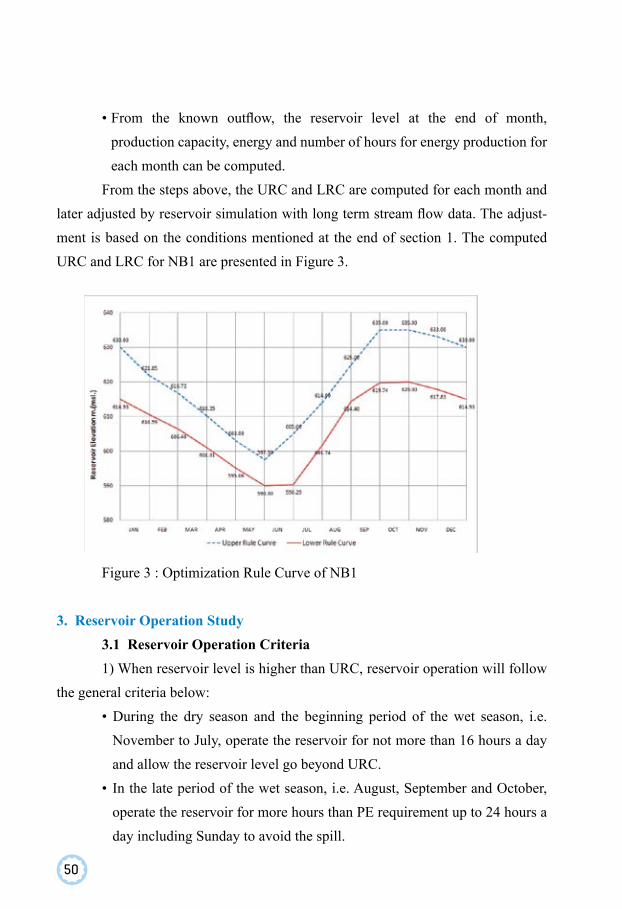
From the steps above, the URC and LRC are computed for each month and later adjusted by reservoir simulation with long term stream flow data. The adjust-ment is based on the conditions mentioned at the end of section 1. The computed URC and LRC for NB1 are presented in Figure 3.
Figure 3 : Optimization Rule Curve of NB1
3. Reservoir Operation Study3.1 Reservoir Operation Criteria1) When reservoir level is higher than URC, reservoir operation will follow
the general criteria below: • During the dry season and the beginning period of the wet season, i.e.
November to July, operate the reservoir for not more than 16 hours a day and allow the reservoir level go beyond URC.
• In the late period of the wet season, i.e. August, September and October, operate the reservoir for more hours than PE requirement up to 24 hours a day including Sunday to avoid the spill.
51
2) When reservoir level is lower than LRC, operate the reservoir for fewer hours, i.e. 8 hours a day, to only fulfil the minimum requirement of PE generation to raise the reservoir level up to LRC.
3) When reservoir level lies between URC and LRC, operate the reservoir by keeping the level following the URC and limit the number of hours for PE generation between 8 to 16 hours a day.
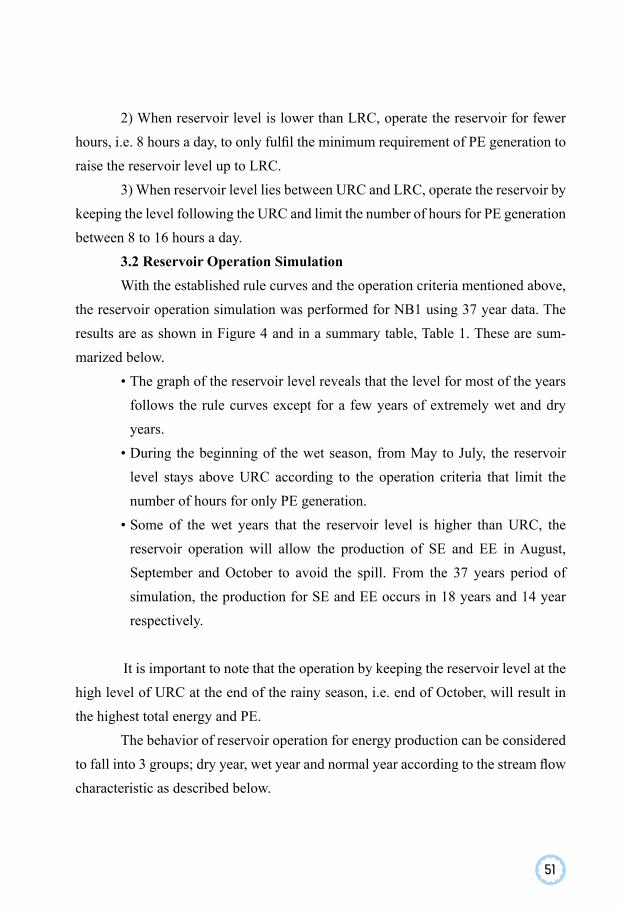
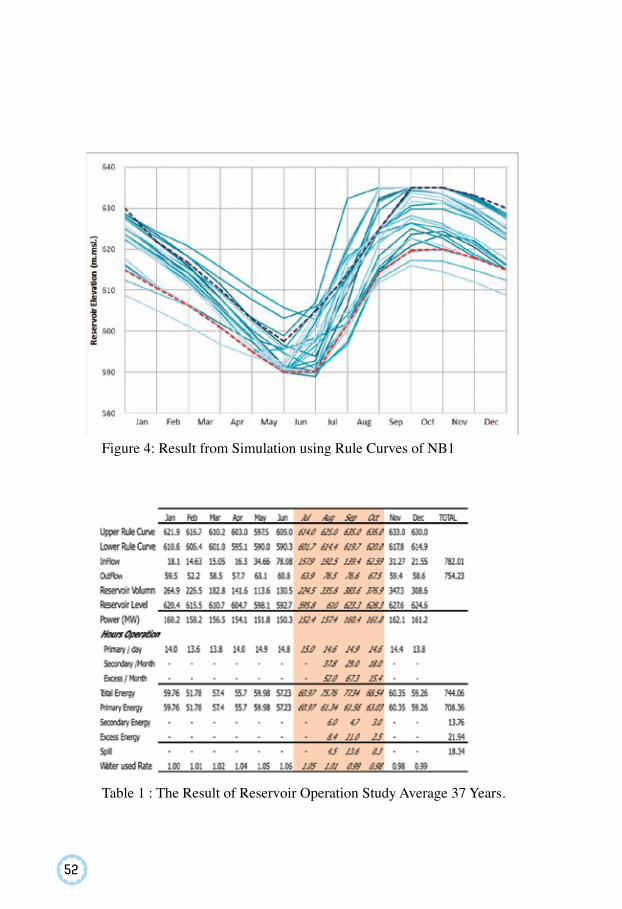
3.2 Reservoir Operation SimulationWith the established rule curves and the operation criteria mentioned above,
the reservoir operation simulation was performed for NB1 using 37 year data. The results are as shown in Figure 4 and in a summary table, Table 1. These are sum-marized below.
• The graph of the reservoir level reveals that the level for most of the years follows the rule curves except for a few years of extremely wet and dry years.
• During the beginning of the wet season, from May to July, the reservoir level stays above URC according to the operation criteria that limit the number of hours for only PE generation.
• Some of the wet years that the reservoir level is higher than URC, the reservoir operation will allow the production of SE and EE in August, September and October to avoid the spill. From the 37 years period of simulation, the production for SE and EE occurs in 18 years and 14 year respectively.
It is important to note that the operation by keeping the reservoir level at the high level of URC at the end of the rainy season, i.e. end of October, will result in the highest total energy and PE.
The behavior of reservoir operation for energy production can be considered to fall into 3 groups; dry year, wet year and normal year according to the stream flow characteristic as described below.
52
Figure 4: Result from Simulation using Rule Curves of NB1
Table 1 : The Result of Reservoir Operation Study Average 37 Years.
53
3.2.1 Dry YearFrom the 37 years data, the driest year is 1998 with a yearly flow of 495
MCM. While 1988 is the least energy production year from the flow of 508 MCM. Some important results from the reservoir operation study of some representative dry years which cover the period of consecutive dry years are summarized in Table 2.
Year Inflow(MCM)
Outflow(MCM)
Reservoir Level at
Beginning of the
Year (m MSL)
Reservoir Volume at Beginning of the Year
(MCM)
PrimaryEnergy
Generation (GWh)
No-of Hours for PE Generation
Monthly Min.
Monthly Max. Yearly
1987 565 559 614.9 258 542 8.0 13.9 11.21988 508 502 614.9 258 486 8.0 13.8 10.11989 644 640 614.9 258 620 10.0 16.0 12.81991 599 601 615.9 266 581 9.6 16.0 12.01992 510 526 614.9 258 508 8.0 15.8 10.51998 495 614 623.4 334 595 8.0 16.0 12.3
Considering the number of hour for PE generation, the requirement of 8 hours a day on monthly basis is fulfilled in every year even in the most driest year, and the requirement of 10 hours a day on yearly average is also fulfilled in every year.
3.2.2 Wet YearFrom the 37 years data, the wettest year is 1981 with a yearly flow of 1,150
MCM. The energy production is also the highest in 1981 at 960 GWh. Some impor-tant results from the reservoir operation study for the representative wet years are summarized in Table 3.
Due to the high volume of inflow in July, August and September in the wet year, the reservoir operation allows the energy production for SE and EE. In 1981 when the flow is extremely high, spill occurs even though the reservoir is operated 24 hours a day.
54
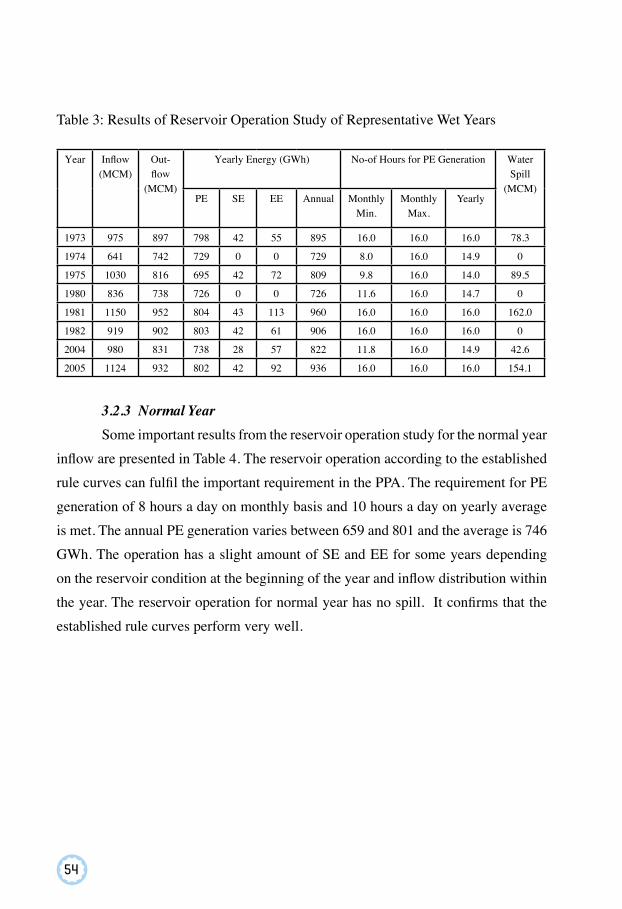
Table 3: Results of Reservoir Operation Study of Representative Wet Years
Year Inflow(MCM)
Out-flow
(MCM)
Yearly Energy (GWh) No-of Hours for PE Generation WaterSpill
(MCM)PE SE EE Annual Monthly
Min.Monthly
Max.Yearly
1973 975 897 798 42 55 895 16.0 16.0 16.0 78.3
1974 641 742 729 0 0 729 8.0 16.0 14.9 0
1975 1030 816 695 42 72 809 9.8 16.0 14.0 89.5
1980 836 738 726 0 0 726 11.6 16.0 14.7 0
1981 1150 952 804 43 113 960 16.0 16.0 16.0 162.0
1982 919 902 803 42 61 906 16.0 16.0 16.0 0
2004 980 831 738 28 57 822 11.8 16.0 14.9 42.6
2005 1124 932 802 42 92 936 16.0 16.0 16.0 154.1
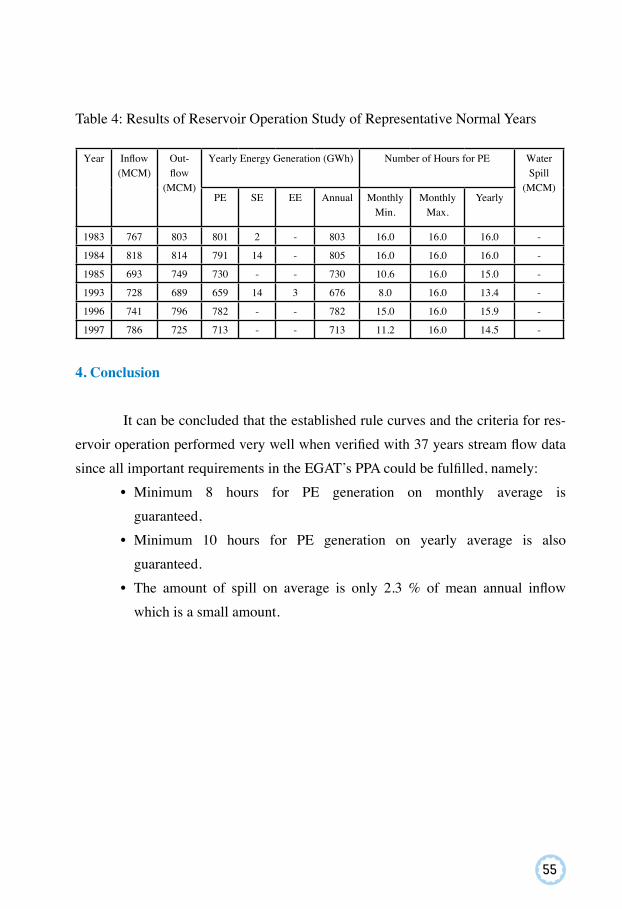
3.2.3 Normal YearSome important results from the reservoir operation study for the normal year
inflow are presented in Table 4. The reservoir operation according to the established rule curves can fulfil the important requirement in the PPA. The requirement for PE generation of 8 hours a day on monthly basis and 10 hours a day on yearly average is met. The annual PE generation varies between 659 and 801 and the average is 746 GWh. The operation has a slight amount of SE and EE for some years depending on the reservoir condition at the beginning of the year and inflow distribution within the year. The reservoir operation for normal year has no spill. It confirms that the established rule curves perform very well.
55
Table 4: Results of Reservoir Operation Study of Representative Normal Years
Year Inflow(MCM)
Out-flow
(MCM)
Yearly Energy Generation (GWh) Number of Hours for PE WaterSpill
(MCM)PE SE EE Annual Monthly
Min.Monthly
Max.Yearly
1983 767 803 801 2 - 803 16.0 16.0 16.0 -
1984 818 814 791 14 - 805 16.0 16.0 16.0 -
1985 693 749 730 - - 730 10.6 16.0 15.0 -
1993 728 689 659 14 3 676 8.0 16.0 13.4 -
1996 741 796 782 - - 782 15.0 16.0 15.9 -
1997 786 725 713 - - 713 11.2 16.0 14.5 -
4. Conclusion
It can be concluded that the established rule curves and the criteria for res-ervoir operation performed very well when verified with 37 years stream flow data since all important requirements in the EGAT’s PPA could be fulfilled, namely:
• Minimum 8 hours for PE generation on monthly average is guaranteed,
• Minimum 10 hours for PE generation on yearly average is also guaranteed.
• The amount of spill on average is only 2.3 % of mean annual inflow which is a small amount.
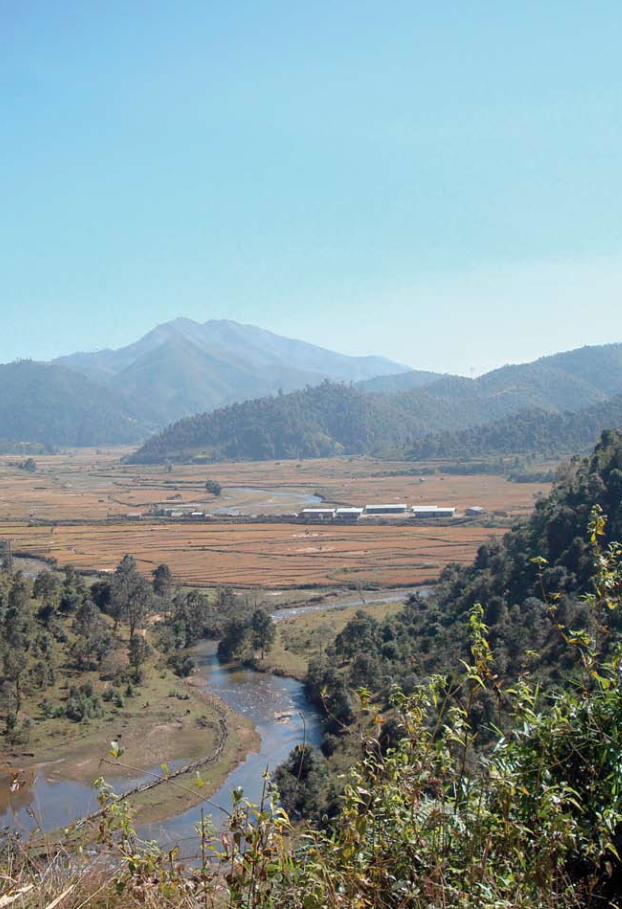
57
Optimized Operation of the Nam Bak 1 and 2Cascade Schemes in Lao PDR
Pinchai Vibulsirikul 1, Thumrong Suthawaree2
1 TEAM Consulting Engineering and Management Co., Ltd. 2 SouthEast Asia Energy Limited
IntroductionNam Bak is one of the main tributaries of the Nam Ngum River joining the
main river about 1.5 km downstream of the Nam Ngum 2 Dam. Potential of the hydropower in Nam Bak basin has been identified since 1970.
Nam Ngum is a big tributary with catchment areas about 16,640 km2 located on the left bank of the Mekong River and joins the Mekong River about 60 km downstream of Nong Khai Province, Thailand.
Hydropower development in Nam Ngum River started in 1968, by the con-struction of Nam Ngum 1 dam with total installed capacities of 150 MW. Such de-velopment has become the beginning of the cooperation between Lao PDR and Thai-land on power trade since then, for most of the energy produced from this project has been sold to Thailand up to now.
1. BackgroundSEAN is the developer of the Nam Ngum 2 Hydropower Project (NN2 HPP)
as an Independent Power Producer (IPP) producing and selling energy to Thailand. NN2 HPP is of reservoir type located upstream end of the Nam Ngum 1 reservoir; it has been developed as an intermediate peaking plant with 615 MW installed capacities. The commercial operation date of the power plant as specified in the Power Purchase Agreement (PPA) with EGAT is on the 1st of January, 2013.
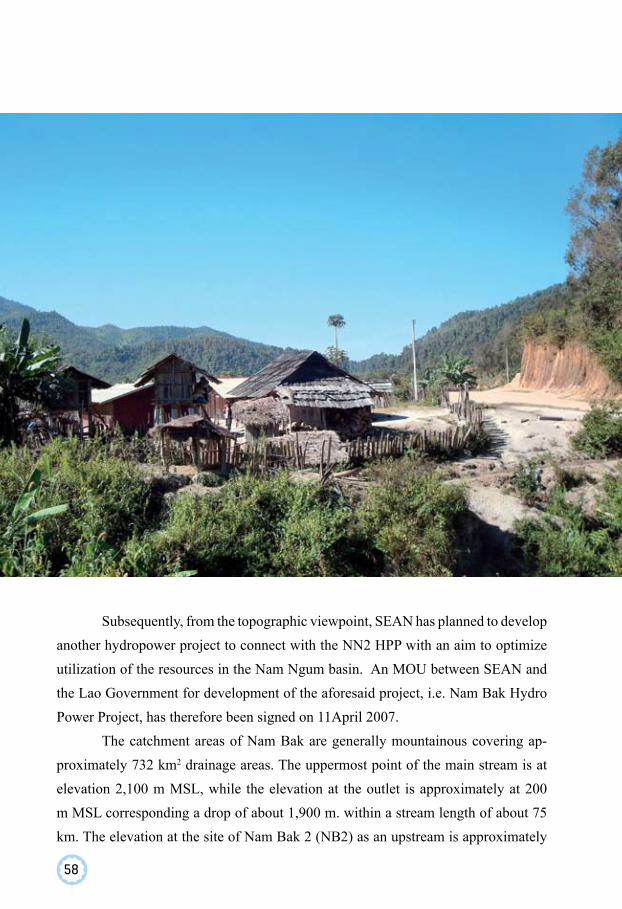
58
Subsequently, from the topographic viewpoint, SEAN has planned to develop another hydropower project to connect with the NN2 HPP with an aim to optimize utilization of the resources in the Nam Ngum basin. An MOU between SEAN and the Lao Government for development of the aforesaid project, i.e. Nam Bak Hydro Power Project, has therefore been signed on 11April 2007.
The catchment areas of Nam Bak are generally mountainous covering ap-proximately 732 km2 drainage areas. The uppermost point of the main stream is at elevation 2,100 m MSL, while the elevation at the outlet is approximately at 200 m MSL corresponding a drop of about 1,900 m. within a stream length of about 75 km. The elevation at the site of Nam Bak 2 (NB2) as an upstream is approximately
59
at 1,000 m MSL. and Nam Bak 1 (NB1) about at 600 m MSL, while Nam Ngum 2 (NN2) is at 375 m MSL. Therefore, there comes a potential to develop the high-head cascade scheme with the final diversion to Nam Ngum 2.
With the cascade scheme, regulated flow from NB2 will make it possible to reduce the required active storage of NB1. This will also lead to cost reduction and environmental impact lessening. In addition, the diverted flow from NB1 to NN2 will increase the regulated flow and head at NN2 powerhouse, which will increase the energy production as well. As a result, the proposed cascade scheme will get the highest benefit with the lowest investment cost.
The scheme was proposed to meet the development goal of both Lao PDR and Thailand in the following aspects.
(1) It is one of the hydropower schemes that will fulfill the Thai-Lao agree-ment to supply 5,000 MW to Thailand.
(2) Some part of energy from the project will be supplied to strengthen the Lao Grid for domestic use.
(3) The optimum scheme is proposed by taking engineering, environmental and economic views into consideration. The reservoir full supply level was set at optimum level to minimize the social impact with enough capacity to regulate the flow.
2. Proposed Development Scheme2.1 Project Development ConceptsThe project is aimed to develop the abundant water resources in Nam Bak
basin for high efficiency use. In this respect, the investigation of all available po-tentials in the basin is necessary. The energy from the project will be transmitted to strengthen Thailand’s and Lao PDR’s grids. The following concepts are guidelines for this study.
(1) SEAN is the developer of both NN2 and Nam Bak projects. Therefore, the development of Nam Bak in connection with NN2 for high benefits is consid-ered.
60
(2) The electricity generated from the project will mainly be sold to Thailand. Most is the primary energy which is generated within 16 hours a day. Therefore, the development of a storage dam with enough capacity to regulate the mean annual inflow at the dam site is necessary.
(3) Environmental impact from the project development should be mini-mized while the optimum use of available resources should be maintained.
(4) The project layout should be configured by considering economic point of view during the construction phase, and the effectiveness should be maintained during the operation and maintenance phase.
(5) Both vertical and horizontal datum used in NN2 project will be referred to.2.2 Project InformationFrom topographic maps, two projects were identified in Nam Bak Basin, i.e.
Nam Bak1 at downstream and Nam Bak 2 at upstream. Important information on both projects is described as below.
2.2.1 Nam Bak 1 (NB1)The suitable location for the NB1 dam site is located at 20 km upstream of
the confluence with the Nam Ngum River. Three alternative sites were identified for comparison. From geological aspect, NB1 site with 597 km2 catchment area was selected for further investigation.
Data of the stream flow at the dam site was collected from the records of the stations in the vicinity. Daily and monthly rainfall data from 19 stations within the Nam Ngum basin and neighborhood stations were collected. While available 6 stream flow gauging stations in the nearby basin were also collected for regional correlation analysis. The stream flow at the dam site was obtained from two meth-ods, i.e. catchment area and annual inflow correlation method and adjustment factor method. Based on the analysis, the mean annual inflow at NB1 dam was estimated to be 750 million cubic meter (MCM).
The geological condition at the dam site was interpreted from aerial pho-tograph and confirmed by site reconnaissance. The rock type at the proposed site comprised sandstone and inter-bed layer.
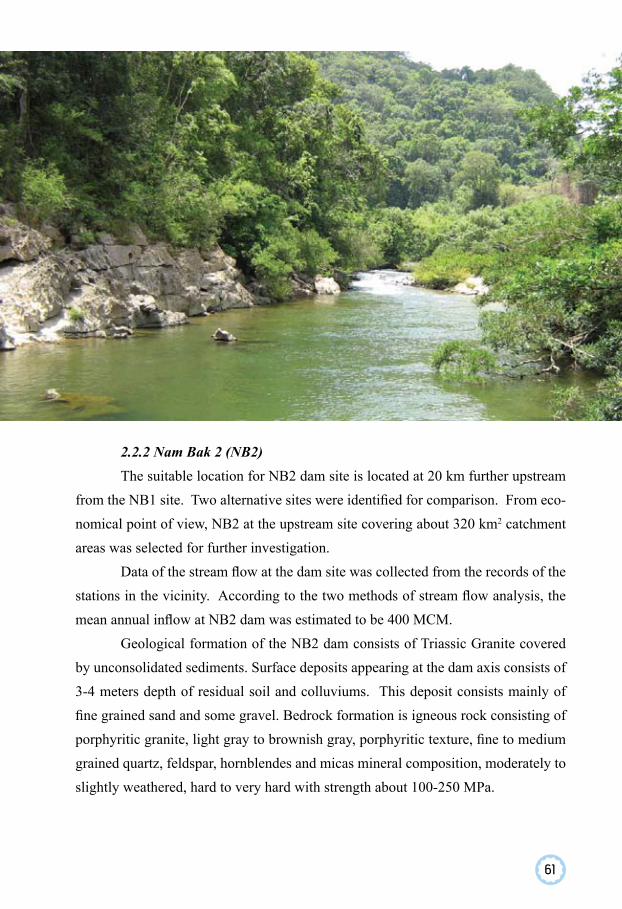
61
2.2.2 Nam Bak 2 (NB2)The suitable location for NB2 dam site is located at 20 km further upstream
from the NB1 site. Two alternative sites were identified for comparison. From eco-nomical point of view, NB2 at the upstream site covering about 320 km2 catchment areas was selected for further investigation.
Data of the stream flow at the dam site was collected from the records of the stations in the vicinity. According to the two methods of stream flow analysis, the mean annual inflow at NB2 dam was estimated to be 400 MCM.
Geological formation of the NB2 dam consists of Triassic Granite covered by unconsolidated sediments. Surface deposits appearing at the dam axis consists of 3-4 meters depth of residual soil and colluviums. This deposit consists mainly of fine grained sand and some gravel. Bedrock formation is igneous rock consisting of porphyritic granite, light gray to brownish gray, porphyritic texture, fine to medium grained quartz, feldspar, hornblendes and micas mineral composition, moderately to slightly weathered, hard to very hard with strength about 100-250 MPa.
62
2.3 Proposed Development Scheme The cascade scheme which includes NB1 and NB2 will make a full use of
water resources in the basin.According to the optimization study, NB2 dam with reservoir full supply
level (FSL) at 1,050 m MSL and minimum operating level (MOL) at 1,010 m MSL is optimum and able to regulate the whole inflow to the reservoir. The 40 m drawdown will create an active storage of 173 MCM and a gross storage of 238 MCM.
With the existence of NB2, the required active storage for NB1 reservoir will be reduced only to be enough for regulating the flow from the catchment between NB2 and NB1 dam sites. In this case, NB1 dam with reservoir FSL at 615 m MSL and MOL at 585 m MSL is appropriate. The 30 m drawdown will create an active storage of 169 MCM and a gross storage of 250 MCM.
The layout of NB1 + NB2 development scheme is shown in Figure 1.2.3.1 Energy Generation StudyAssumptions(1) In this development scheme, the energy from NB2 will be sold for domes-
tic use by connecting with the EdL’s Grid. Some part of energy, about 10 GWh per year, will be supplied for station use at NB2, NB1 and NN2 dams and powerhouse via the new constructed 22 kV lines. The energy from NB1 will be sold to Thailand by connecting the 230 kV line at NN2 switchyard and transmitted together with the energy generated from NN2 to Na Bong substation.
(2) According to the Power Purchase Agreement (PPA) with EGAT, the en-ergy generated from the plant is classified as primary, secondary and excess energy. The criteria for energy classification are as follows:
- Primary energy, the energy generated within 16 hours per day, 6 days per week from Monday to Saturday
- Secondary energy, the energy generated for the additional 2 hours per days, 6 days per week from Monday to Saturday, plus 8 hours in Sunday
- Excess energy, the additional energy generated for the remaining hours

63
Since the tariff rate for the primary energy is the highest among the three types, the generation unit for Thailand’s Grid will be designed based on 57% plant factor.
(3) Major load of the EdL’s Grid around this area comes from Phu Bia Min-ing which consumes about 30 MW, 24 hours a day, but the demand may not reach peak for the whole day. In this study, the generation unit fully dispatched for the EdL’s Grid will be designed based on 72% plant factor. The energy for station use for NN2, NB1 and NB2 will also be supplied by this set of generation unit.
Simulation StudyNB2 dam with reservoir FSL at 1,050 m MSL and MOL at 1,010 m MSL is
optimum and able to regulate the whole inflow to the reservoir. The 40 m drawdown will create an active storage of 173 MCM and a gross storage of 238 MCM.
64
The power waterway to the reservoir tip of NB1 consists of a headrace tun-nel 12.5 km long and a penstock about 820 m long. With the mean operating level at 1,036.7 m MSL and tail water level at 610 m MSL, an average gross head of 426.7 m will be developed at the powerhouse. The designed discharge about 16.1 m3/s flows through 3.5 m dia. tunnel will formulate an averaged velocity of 1.67 m/s resulting in 7.05 m head loss in the tunnel. This same discharge when flowing through 2.5 m dia. penstock will develop an averaged velocity of 3.28 m/s resulting in 2.0 m head loss. When including minor losses, the total losses through power waterway will be 9.1 m. After deducting the head loss through the power waterway, an average net head of 417.6 m is available for power generation. The powerhouse of NB2 will be installed with the 60 MW generating unit.
The reservoir of NB1 with FSL at 615 m MSL and MOL at 585 m MSL, or 30 m drawdown will create an active storage of 169 MCM and a gross storage of 250 MCM. With this active storage, NB1 reservoir will be able to regulate the side flow of NB1 dam.
The power waterway from NB1 reservoir to the powerhouse upstream of NN2 reservoir consists of a headrace tunnel 10.5 km long and a penstock 400 m long. With the mean operating level at 605 m MSL and tail water level at 370 m MSL, an averaged gross head of 235 m will be developed at the powerhouse. The designed discharge about 39.16 m3/s flows through 5.0 m dia. tunnel will develop an averaged velocity of 1.99 m/s resulting in 5.24 m head loss in the tunnel. This same discharge when flow through a 3.5 m dia. penstock will develop an averaged veloc-ity of 4.07 m/s resulting in 0.96 m head loss. When including minor losses, the total losses through power waterway will be 6.35 m. Deducting the head loss through the
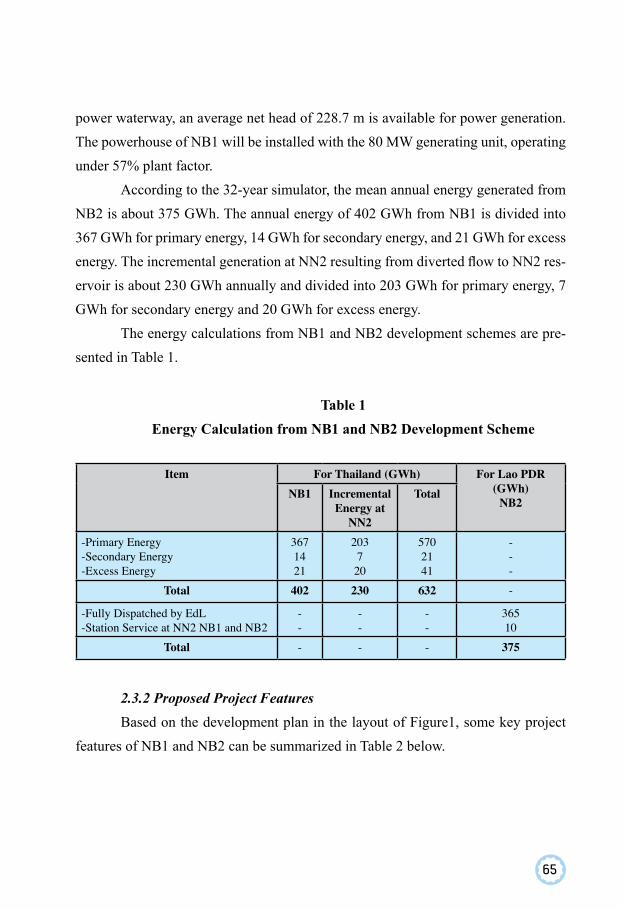
65
power waterway, an average net head of 228.7 m is available for power generation. The powerhouse of NB1 will be installed with the 80 MW generating unit, operating under 57% plant factor.
According to the 32-year simulator, the mean annual energy generated from NB2 is about 375 GWh. The annual energy of 402 GWh from NB1 is divided into 367 GWh for primary energy, 14 GWh for secondary energy, and 21 GWh for excess energy. The incremental generation at NN2 resulting from diverted flow to NN2 res-ervoir is about 230 GWh annually and divided into 203 GWh for primary energy, 7 GWh for secondary energy and 20 GWh for excess energy.
The energy calculations from NB1 and NB2 development schemes are pre-sented in Table 1.
Table 1Energy Calculation from NB1 and NB2 Development Scheme
Item For Thailand (GWh) For Lao PDR (GWh)
NB2NB1 Incremental
Energy at NN2
Total
-Primary Energy-Secondary Energy-Excess Energy
3671421
203720
5702141
---
Total 402 230 632 -
-Fully Dispatched by EdL-Station Service at NN2 NB1 and NB2
--
--
--
36510
Total - - - 375
2.3.2 Proposed Project FeaturesBased on the development plan in the layout of Figure1, some key project
features of NB1 and NB2 can be summarized in Table 2 below.
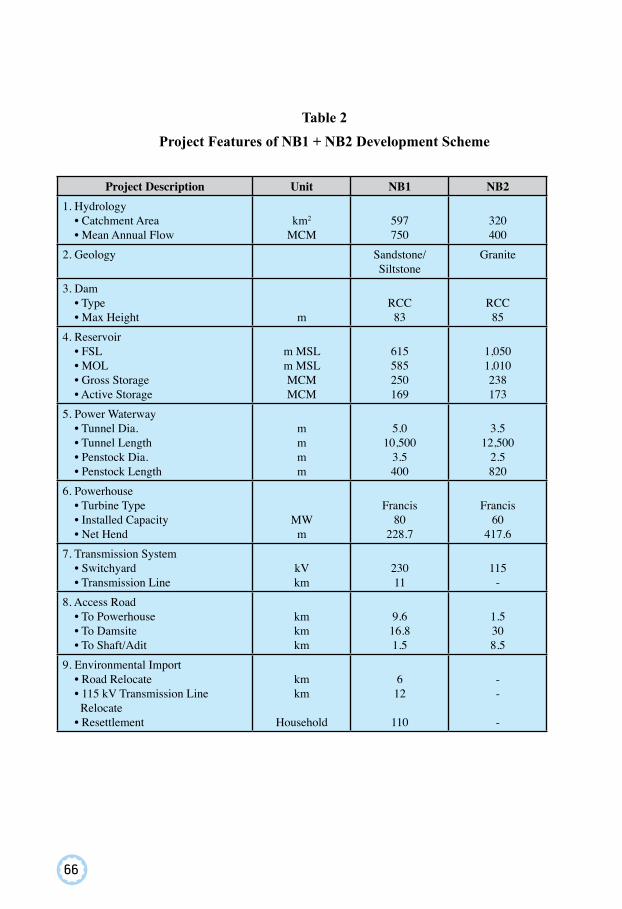
66
Table 2Project Features of NB1 + NB2 Development Scheme
Project Description Unit NB1 NB21. Hydrology • Catchment Area • Mean Annual Flow
km2
MCM597750
320400
2. Geology Sandstone/Siltstone
Granite
3. Dam • Type • Max Height m
RCC83
RCC85
4. Reservoir • FSL • MOL • Gross Storage • Active Storage
m MSLm MSLMCMMCM
615585250169
1,0501,010238173
5. Power Waterway • Tunnel Dia. • Tunnel Length • Penstock Dia. • Penstock Length
mmmm
5.010,500
3.5400
3.512,500
2.5820
6. Powerhouse • Turbine Type • Installed Capacity • Net Hend
MWm
Francis80
228.7
Francis60
417.67. Transmission System • Switchyard • Transmission Line
kVkm
23011
115-
8. Access Road • To Powerhouse • To Damsite • To Shaft/Adit
kmkmkm
9.616.81.5
1.5308.5
9. Environmental Import • Road Relocate • 115 kV Transmission Line Relocate • Resettlement
kmkm
Household
612
110
--
-
67
3. ConclusionWith the cascade scheme, the following optimum benefits will be gained.(1) With the regulation of NB2 dam, NB1 active storage can be reduced by
50 percents from 340 MCM for the case of development NB1 only to about 170 MCM for cascade scheme. This storage reduction will reduce NB1 dam height about 20 m thus minimizing the environmental impact.
(2) The highest energy generation will be obtained from the cascade scheme since the same amount of water will be regenerated at three powerhouses of NB2, NB1 and NN2.
(3) The diversion of the generation flow from the NB1 powerhouse into the NN2 reservoir will increase the regulated flow and head at the NN2 powerhouse. With approximately 700 MCM of the diverted flow from NB1, the incremental en-ergy at the NN2 powerhouse about 230 GWh will be gained without any capacity enlargement at NN2.
Reference1. TEAM Consulting Engineering and Management Co., Ltd. and South-
East Asia Energy Limited “Feasibility Study of Nam Bak 1-2 Hydro Power Project Lao PDR”, 2007
2. TEAM Consulting Engineering and Management Co., Ltd. and ATT consultants Co., Ltd. “Supplementary Engineering Study of Nam Ngum 2 Hydro-electric Power Project”, 2004
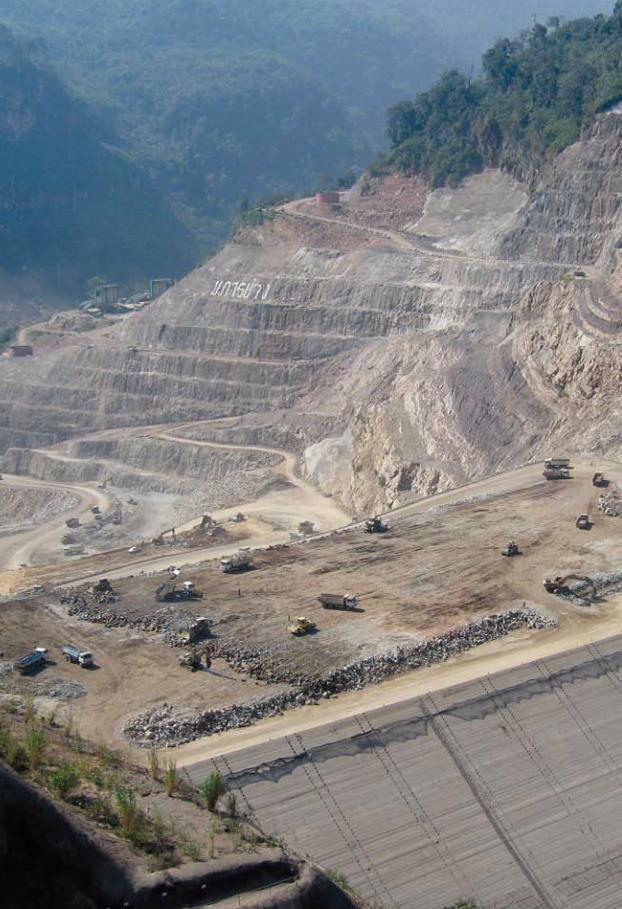
69
Design of 182-meter High NN2 Concrete Face Rockfill Dam
Aphichat Sramoon1, Pastsakorn Kitiyodom1, Weerayot Chalermnon2, Rawee Sittipod3
1 Geotechnical and Foundation Engineering Co., Ltd. (A Member of TEAM Group), Thailand 2 Ch. Karnchang (Lao) Company Limited, Vientiane, Lao PDR 3 Nam Ngum 2 Power Company Limited, Vientiane, Lao PDR
AbstractThe Nam Ngum 2 Hydroelectric Power Project (NN2 HPP) is located ap-
proximately 90 km north of Vientiane in central Laos. The Dam is of the Concrete Face Rockfill Dam (CFRD) with the crest elevation at 381.0 masl, which corre-sponds to the dam height of 182.0 m. The dam plinth is the most important compo-nent of a CFRD and much attention is needed to ensure its satisfactory performance after reservoir impounding. The total width of the plinth depends on the foundation conditions and the hydraulic gradient relative to the reservoir head, which results the total width of the plinth vary from 6.0 m to 23.0 m. The reinforced concrete face slab will be laid against the upstream face of the dam, connecting to the dam plinth by the perimeter joint. The face slab will have a minimum thickness of 0.30 m near the dam crest and will increase linearly to a maximum thickness of 0.85 m at the toe of the dam. The performances of rockfill and face slab are of importance for CFRD, which can improve by strictly control the rockfill compaction density.
Published in CEAT Journal, Vol.3, March 2009 Pages 19-27.
70
1. INTRODUCTIONThe Nam Ngum 2 Hydroelectric Power Project (NN2 HPP) is located ap-
proximately 90 km north of Vientiane in central Laos and approximately 35 km up-stream of Nam Ngum 1 reservoir. The study of the project was initially commenced in 1986 sponsored by UNDP/IBRD. Many consequential studies were undertaken by other agencies since then.
The Nam Ngum River is one of the major tributaries of the Mekong River which forms the border between Laos and Thailand in this area. The Nam Ngum River originates on the Tran Ninh Plateau, north of Xeong Khuang, and after flowing past both dam sites, joins the Nam Lik River and flows into the Mekong River about 100 km downstream of Vientiane. The NN2 dam site is located in a narrow valley with steep slopes covered by dense vegetation.
Nam Ngum 2 Power Company Limited (NN2PC), the client, agreed to make a contract with Ch. Karnchang (Lao) Company Limited as the EPC contractor to design, engineer, manufacture, supply, install, procure, construct, test and commis-sion a 615 MW (3 Nos. of 205 MW turbines) hydroelectric power plant. The general layout of the project is as shown in Figure 1. The project was started in 2006 and will be fully operated in 2013.
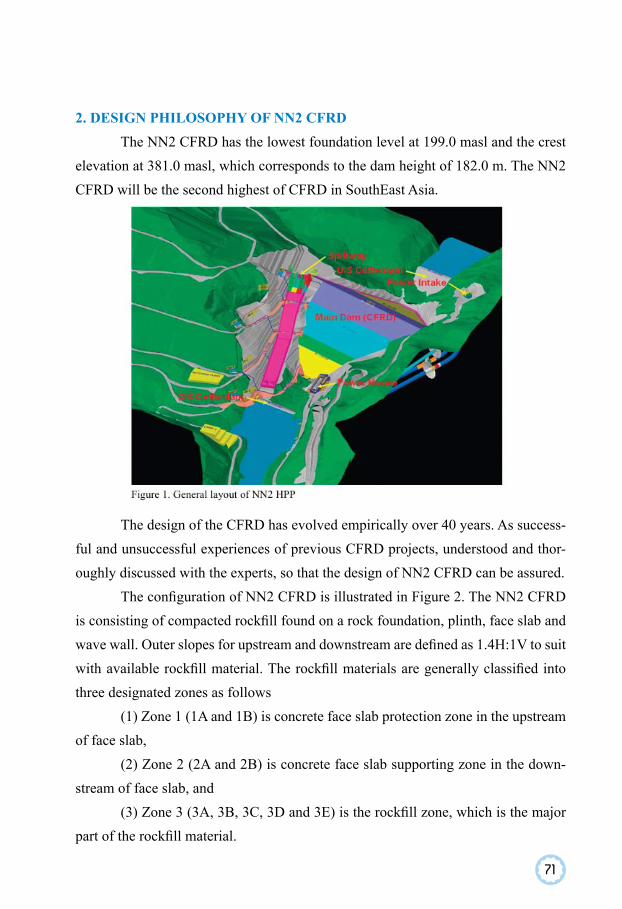
71
2. DESIGN PHILOSOPHY OF NN2 CFRD The NN2 CFRD has the lowest foundation level at 199.0 masl and the crest
elevation at 381.0 masl, which corresponds to the dam height of 182.0 m. The NN2 CFRD will be the second highest of CFRD in SouthEast Asia.
The design of the CFRD has evolved empirically over 40 years. As success-ful and unsuccessful experiences of previous CFRD projects, understood and thor-oughly discussed with the experts, so that the design of NN2 CFRD can be assured.
The configuration of NN2 CFRD is illustrated in Figure 2. The NN2 CFRD is consisting of compacted rockfill found on a rock foundation, plinth, face slab and wave wall. Outer slopes for upstream and downstream are defined as 1.4H:1V to suit with available rockfill material. The rockfill materials are generally classified into three designated zones as follows
(1) Zone 1 (1A and 1B) is concrete face slab protection zone in the upstream of face slab,
(2) Zone 2 (2A and 2B) is concrete face slab supporting zone in the down-stream of face slab, and
(3) Zone 3 (3A, 3B, 3C, 3D and 3E) is the rockfill zone, which is the major part of the rockfill material.
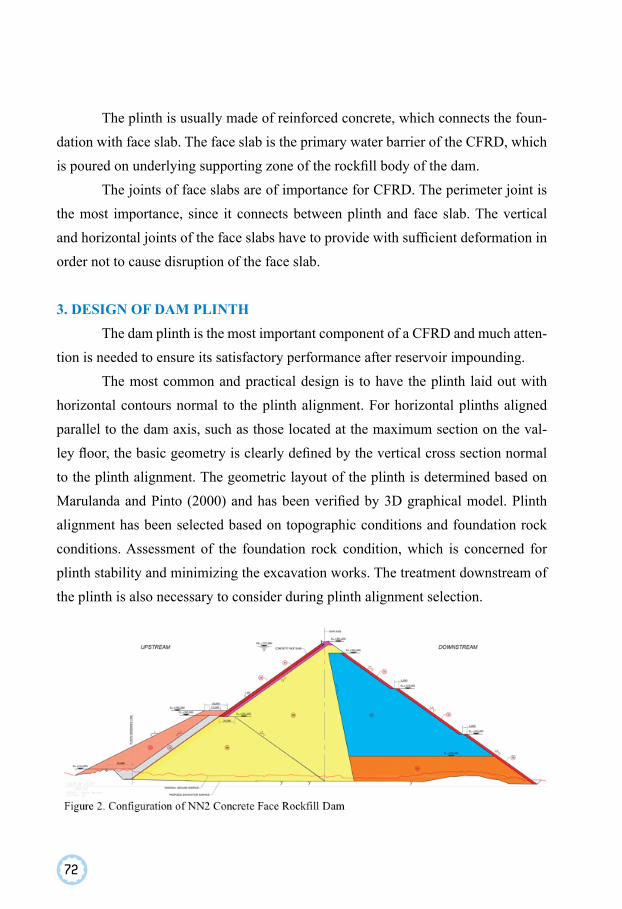
72
The plinth is usually made of reinforced concrete, which connects the foun-dation with face slab. The face slab is the primary water barrier of the CFRD, which is poured on underlying supporting zone of the rockfill body of the dam.
The joints of face slabs are of importance for CFRD. The perimeter joint is the most importance, since it connects between plinth and face slab. The vertical and horizontal joints of the face slabs have to provide with sufficient deformation in order not to cause disruption of the face slab.
3. DESIGN OF DAM PLINTH The dam plinth is the most important component of a CFRD and much atten-
tion is needed to ensure its satisfactory performance after reservoir impounding. The most common and practical design is to have the plinth laid out with
horizontal contours normal to the plinth alignment. For horizontal plinths aligned parallel to the dam axis, such as those located at the maximum section on the val-ley floor, the basic geometry is clearly defined by the vertical cross section normal to the plinth alignment. The geometric layout of the plinth is determined based on Marulanda and Pinto (2000) and has been verified by 3D graphical model. Plinth alignment has been selected based on topographic conditions and foundation rock conditions. Assessment of the foundation rock condition, which is concerned for plinth stability and minimizing the excavation works. The treatment downstream of the plinth is also necessary to consider during plinth alignment selection.
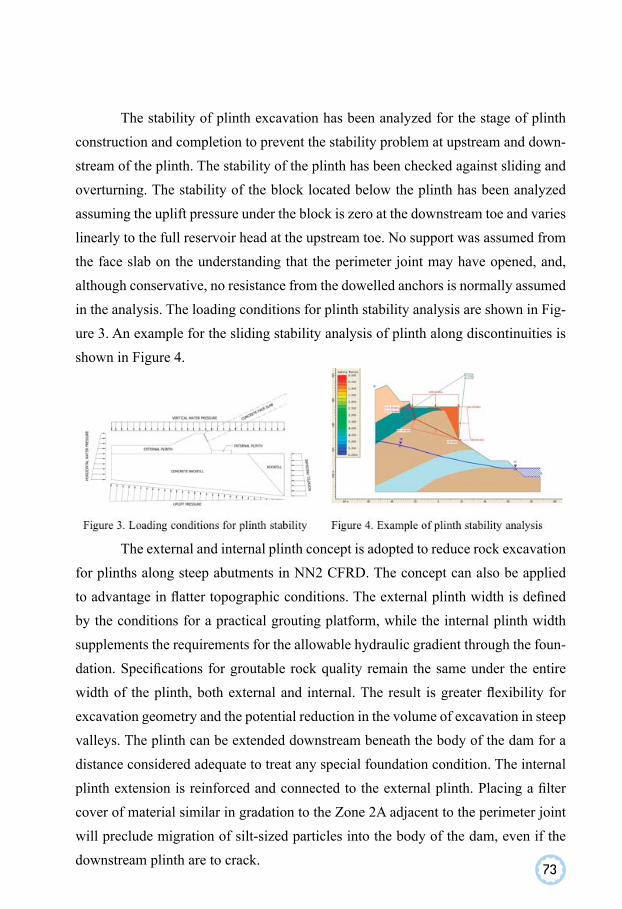
73
The stability of plinth excavation has been analyzed for the stage of plinth construction and completion to prevent the stability problem at upstream and down-stream of the plinth. The stability of the plinth has been checked against sliding and overturning. The stability of the block located below the plinth has been analyzed assuming the uplift pressure under the block is zero at the downstream toe and varies linearly to the full reservoir head at the upstream toe. No support was assumed from the face slab on the understanding that the perimeter joint may have opened, and, although conservative, no resistance from the dowelled anchors is normally assumed in the analysis. The loading conditions for plinth stability analysis are shown in Fig-ure 3. An example for the sliding stability analysis of plinth along discontinuities is shown in Figure 4.
The external and internal plinth concept is adopted to reduce rock excavation for plinths along steep abutments in NN2 CFRD. The concept can also be applied to advantage in flatter topographic conditions. The external plinth width is defined by the conditions for a practical grouting platform, while the internal plinth width supplements the requirements for the allowable hydraulic gradient through the foun-dation. Specifications for groutable rock quality remain the same under the entire width of the plinth, both external and internal. The result is greater flexibility for excavation geometry and the potential reduction in the volume of excavation in steep valleys. The plinth can be extended downstream beneath the body of the dam for a distance considered adequate to treat any special foundation condition. The internal plinth extension is reinforced and connected to the external plinth. Placing a filter cover of material similar in gradation to the Zone 2A adjacent to the perimeter joint will preclude migration of silt-sized particles into the body of the dam, even if the downstream plinth are to crack.
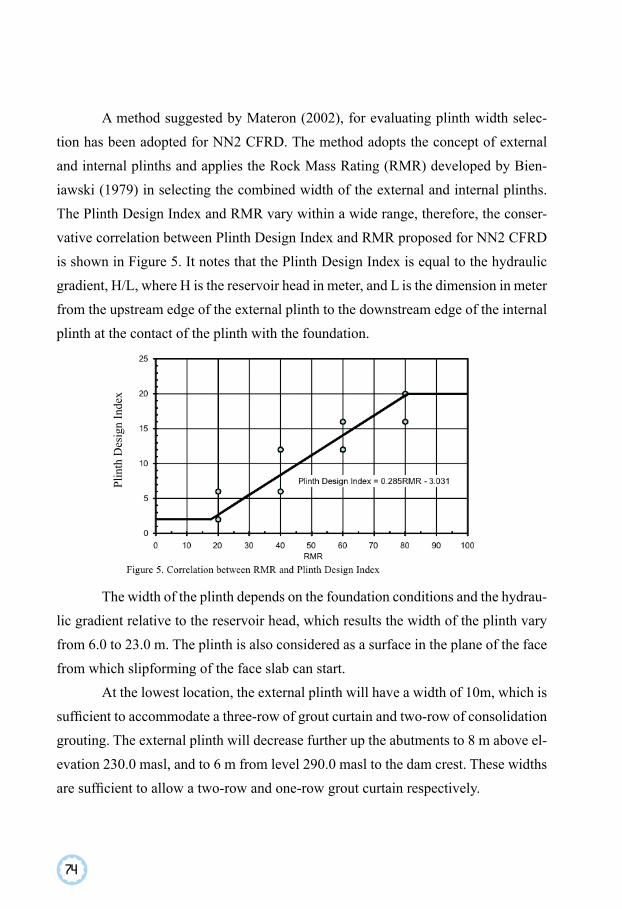
74
A method suggested by Materon (2002), for evaluating plinth width selec-tion has been adopted for NN2 CFRD. The method adopts the concept of external and internal plinths and applies the Rock Mass Rating (RMR) developed by Bien-iawski (1979) in selecting the combined width of the external and internal plinths. The Plinth Design Index and RMR vary within a wide range, therefore, the conser-vative correlation between Plinth Design Index and RMR proposed for NN2 CFRD is shown in Figure 5. It notes that the Plinth Design Index is equal to the hydraulic gradient, H/L, where H is the reservoir head in meter, and L is the dimension in meter from the upstream edge of the external plinth to the downstream edge of the internal plinth at the contact of the plinth with the foundation.
The width of the plinth depends on the foundation conditions and the hydrau-lic gradient relative to the reservoir head, which results the width of the plinth vary from 6.0 to 23.0 m. The plinth is also considered as a surface in the plane of the face from which slipforming of the face slab can start.
At the lowest location, the external plinth will have a width of 10m, which is sufficient to accommodate a three-row of grout curtain and two-row of consolidation grouting. The external plinth will decrease further up the abutments to 8 m above el-evation 230.0 masl, and to 6 m from level 290.0 masl to the dam crest. These widths are sufficient to allow a two-row and one-row grout curtain respectively.
Plin
th D
esig
n In
dex
75
4. DAM ZONING The designation of the rockfill zones of NN2 CFRD, as shown in Figure 2,
are adopted as suggested by ICOLD (2004). The NN2 CFRD dam zoning is further validated by 2D and 3D FEM. A brief description for each zone is as follows:
Zone 1A is selected fine grain material, which normally is cohesionless ma-terial. The zone serves as a source of material that, if required, can migrate through cracks in the face slab.
Zone 1B is random rockfill to provide support or protect to Zone 1A.Zone 2A is sand and gravel filter located within perimeter joint. In the event
of disruption of the waterstops at the perimeter joints, the filter zone 2A will prevent the movement of the silt size particles through the zone and, thus, serve as secondary defense against leakage.
Zone 2B is the dam face bedding, which provides support to face slab and consists of sand and gravel-sized particle.
Zone 3A is the transition zone between Zone 2B and rockfill Zone 3B.Zone 3B is quarry-run rockfill material mainly consists of fresh and slightly
to moderately weathered sandstone with certain percentage of fine material. This zone is designed to transfer water load to the foundation level.
Zone 3C is quarry-run rockfill material mainly consists of fresh and slightly to moderately weathered sandstone with certain percentage of fine material. The quality requirements for Zone 3C might be lower than Zone 3B rockfill, since it re-ceives a little water loading and settlement is essentially during construction.
Zone 3D is designed to meet the requirement as drainage to a certain ex-tended Zone 3B material. It can be attained a similar level of permeability. However, it will not endanger to the downstream stability.
Zone 3E is the oversize rockfill, which is designed to place at the down-stream slope for protecting erosion that might be occurred at the downstream.
2D and 3D FEM are carried out to assess the rockfill material properties in order to make use of available rockfill material at potential quarry (IWHR, 2008). The non-linear properties employed in the 2D and 3D FEM is determined based on large triaxial test (IWHR, 2007). The analyses results revealed that the material
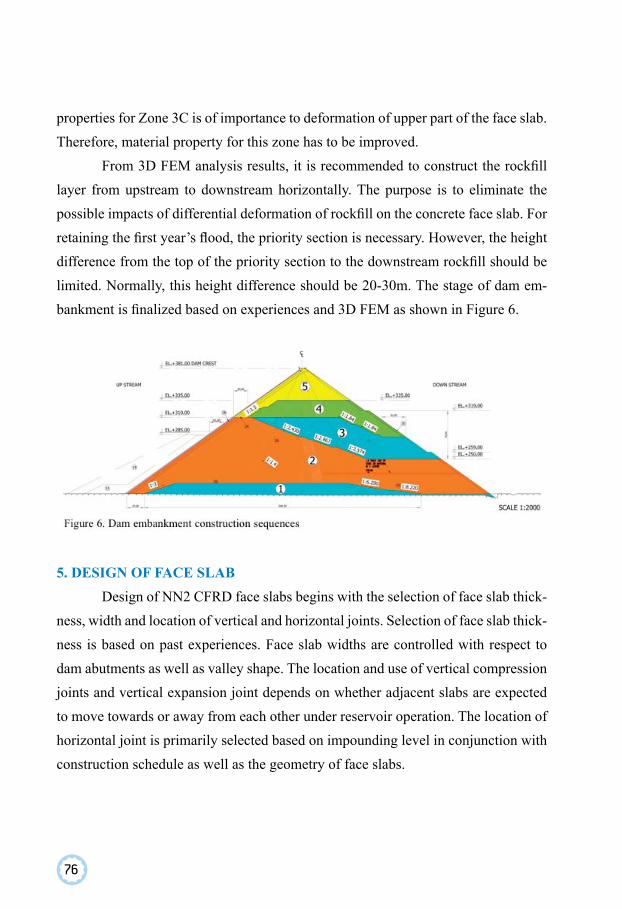
76
properties for Zone 3C is of importance to deformation of upper part of the face slab. Therefore, material property for this zone has to be improved.
From 3D FEM analysis results, it is recommended to construct the rockfill layer from upstream to downstream horizontally. The purpose is to eliminate the possible impacts of differential deformation of rockfill on the concrete face slab. For retaining the first year’s flood, the priority section is necessary. However, the height difference from the top of the priority section to the downstream rockfill should be limited. Normally, this height difference should be 20-30m. The stage of dam em-bankment is finalized based on experiences and 3D FEM as shown in Figure 6.
5. DESIGN OF FACE SLABDesign of NN2 CFRD face slabs begins with the selection of face slab thick-
ness, width and location of vertical and horizontal joints. Selection of face slab thick-ness is based on past experiences. Face slab widths are controlled with respect to dam abutments as well as valley shape. The location and use of vertical compression joints and vertical expansion joint depends on whether adjacent slabs are expected to move towards or away from each other under reservoir operation. The location of horizontal joint is primarily selected based on impounding level in conjunction with construction schedule as well as the geometry of face slabs.
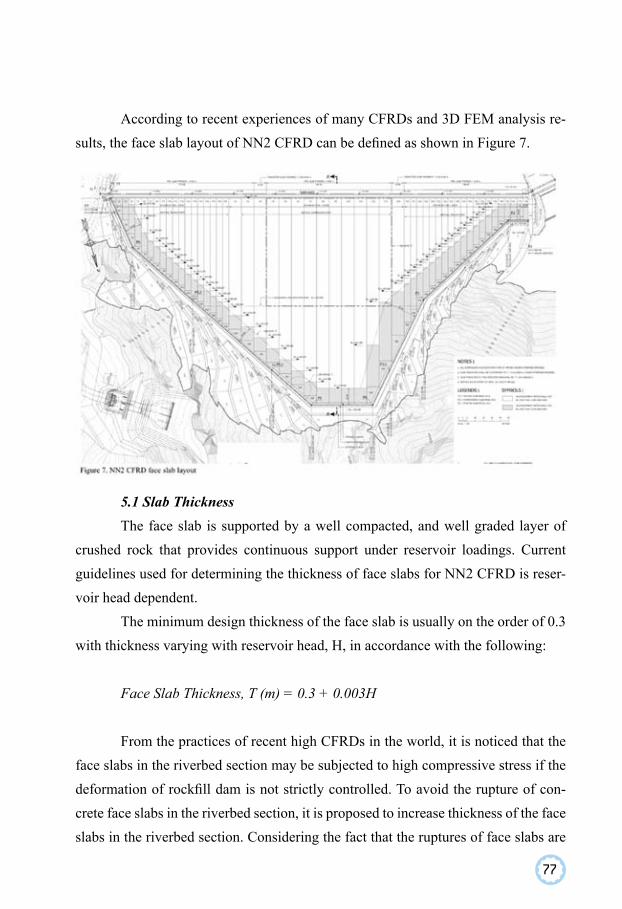
77
According to recent experiences of many CFRDs and 3D FEM analysis re-sults, the face slab layout of NN2 CFRD can be defined as shown in Figure 7.
5.1 Slab ThicknessThe face slab is supported by a well compacted, and well graded layer of
crushed rock that provides continuous support under reservoir loadings. Current guidelines used for determining the thickness of face slabs for NN2 CFRD is reser-voir head dependent.
The minimum design thickness of the face slab is usually on the order of 0.3 with thickness varying with reservoir head, H, in accordance with the following:
Face Slab Thickness, T (m) = 0.3 + 0.003H
From the practices of recent high CFRDs in the world, it is noticed that the face slabs in the riverbed section may be subjected to high compressive stress if the deformation of rockfill dam is not strictly controlled. To avoid the rupture of con-crete face slabs in the riverbed section, it is proposed to increase thickness of the face slabs in the riverbed section. Considering the fact that the ruptures of face slabs are
78
happened in upper part of face slab, the increase of the slab thickness could only be applied for the second stage face slabs. The thickness of the first stage face slab is remain unchanged. The suggested starting thickness at the top of face slab could be 40cm. Thus, thickness of the face slab for second stage face slab at riverbed section can be determined from
Face Slab Thickness, T (m) = 0.4 + 0.00178H
5.2 Panel WidthFrom the results of 3D FEM analysis, the general tendency of horizontal dis-
placement of face slab along the direction of dam axis is that the face slabs will move from both abutments towards the central part of the riverbed. So the face slabs in the riverbed sections are subjected to compressive stresses, while the face slabs in the abutment areas are subjected to tensile stresses. To adapt the differential deformation of face slabs between the abutment areas and riverbed areas, narrow slabs, which is half width of the face slabs in riverbed area, are recommended. The range of half width face slab and full width face slab is adjusted by considering the stress distribu-tion of face slab along the direction of dam axis after reservoir impoundment.
Panel widths for NN2 CFRD face slabs are typically classified into two categories. Narrower panel widths (7.5 m wide) are used where vertical joints are desired as tension joints, which are located on the abutments. Wider panel widths (15.0 m wide) are used where vertical joints are treated as compression joints, which are mostly located in the riverbed area. The layout of face slab is determined based on 3D-FEM analysis result as described above.
5.3 ReinforcementFor improving the performance of concrete face slab, double layers of rein-
forcement is recommended with 0.4% of the gross area of the concrete face slab for each way. The reinforcement is increased up to 0.5% of the gross area of the concrete face slab in the area close to the dam plinth.

79
6. DESIGN OF JOINTS The perimeter joint, vertical joints and horizontal joint are used to separate
adjacent face slab panels in NN2 CFRD. The perimeter joint separates the plinth from the face slab. Vertical joints separate adjacent panels perpendicular to the dam axis. Horizontal joint separate the first and second stages of the same slab. The loca-tion and design of each of these joints are different according to their purpose and importance in the performance of the face slab as the water barrier.
6.1 Perimeter JointThe perimeter joint separates the face slab from the plinth. Due to its loca-
tion and the movements that will occur at this joint two-barrier waterstop system are employed in NN2 CFRD as shown in Figure 8. The material used in perimeter joint include the following
(1) Copper waterstop with a thickness of 1.2 mm is considered as lower water-barrier. To improve watertightness and increase of seepage length, the base of copper waterstop in contact with plinth or face slab concrete is treated with GB sealant material.

80
(2) For upper water barrier, it is consisting of GB filler and GB corrugated rubber waterstop, which cover by GB-NR-EDPM cover. GB filler have been developed to maintain a watertight seal and capable of large extension without breaking. GB corrugated rubber waterstop is intended to perform the same function as the middle PVC waterstop used in other high CFRDs.
6.2 Vertical Tension JointVertical tension joints are designed to allow movement between adjacent
slabs while maintaining a watertight barrier to the reservoir. They are located near the dam abutments or where two adjacent slabs have the potential to separate from each other under self-weight or reservoir loading. The design of vertical tension joint is similar to the design of the perimeter joint. To allow for the anticipated movement at the tension joint, slab reinforcement is terminated at the joint. To maintain water-tightness, two-barrier waterstop and joint sealing material are provided as shown in Figure 9(a), which is similar to perimeter joint. The spacing of vertical tension joint is considered as half spacing of vertical compression joint, which is 7.5 m.
6.3 Vertical Compression JointVertical compression joints are located between adjacent face slabs that are
not anticipated to separate away from each other. These joints are located towards the middle of the dam away from abutments where adjacent slabs will tend to move towards each other. The spacing of vertical compression joint is considered as 15.0 m. Slab reinforcement is not continued through the vertical compression joint. Oth-er important design considerations for the vertical compression joints in the NN2 CFRD include following
(1) The copper waterstops and mortar pad is outside the theoretical thickness of face slab and within extruded curb,
(2) The theoretical slab thickness is always preserved,(3) The height of the central loop of the waterstop is reduced to keep the
theoretical slab thickness,(4) Compressible material is placed at the joint to mitigate compressive
stresses,
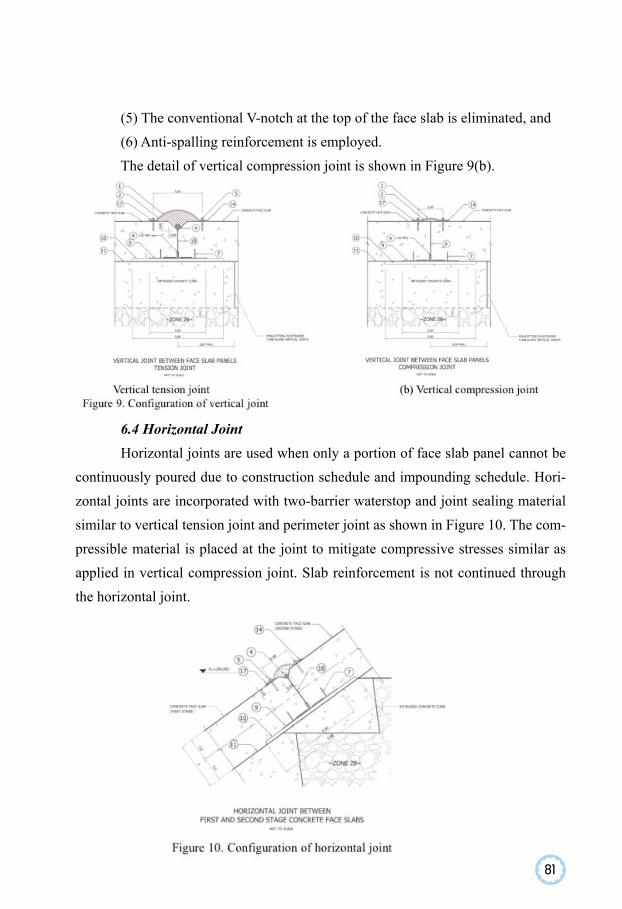
81
(5) The conventional V-notch at the top of the face slab is eliminated, and(6) Anti-spalling reinforcement is employed.The detail of vertical compression joint is shown in Figure 9(b).
6.4 Horizontal JointHorizontal joints are used when only a portion of face slab panel cannot be
continuously poured due to construction schedule and impounding schedule. Hori-zontal joints are incorporated with two-barrier waterstop and joint sealing material similar to vertical tension joint and perimeter joint as shown in Figure 10. The com-pressible material is placed at the joint to mitigate compressive stresses similar as applied in vertical compression joint. Slab reinforcement is not continued through the horizontal joint.
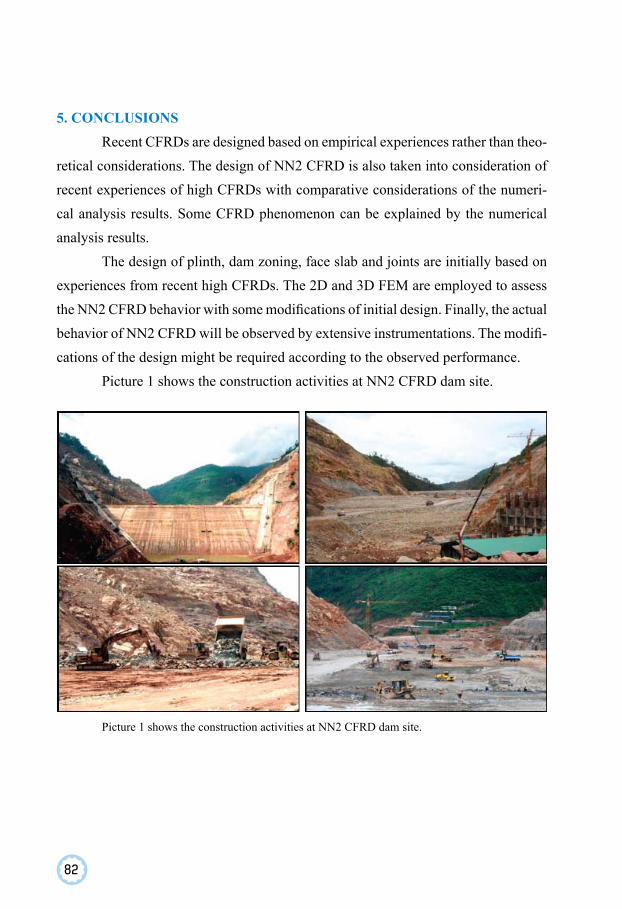
82
5. CONCLUSIONS Recent CFRDs are designed based on empirical experiences rather than theo-
retical considerations. The design of NN2 CFRD is also taken into consideration of recent experiences of high CFRDs with comparative considerations of the numeri-cal analysis results. Some CFRD phenomenon can be explained by the numerical analysis results.
The design of plinth, dam zoning, face slab and joints are initially based on experiences from recent high CFRDs. The 2D and 3D FEM are employed to assess the NN2 CFRD behavior with some modifications of initial design. Finally, the actual behavior of NN2 CFRD will be observed by extensive instrumentations. The modifi-cations of the design might be required according to the observed performance.
Picture 1 shows the construction activities at NN2 CFRD dam site.
Picture 1 shows the construction activities at NN2 CFRD dam site.

REFERENCES
Bieniawski, Z.T. (1979) “The Geomechanics Classification in Rock Engineering Applications”, Proc. 4th Int. Cong. on Rock Mech., Balkema, Rotterdam, Vol. 2, pp. 41-48.ICOLD Committee on Materials for Fill Dams (2004) “Concrete Face Rockfill Dams Concepts for Design and Construction”, Draft.IWHR (2007) “Report on Laboratory Tests of the Rockfill Materials of Nam Ngum 2 CFRD”, 36p.IWHR (2008) “Three-dimensional Numerical Analysis of Nam Ngum 2 CFRD”, 80p.Marulanda, A. & Pinto, N. L. S. (2000) “Recent Experience on Design, Construction and Performance of CFRD Dams”, J. Barry Cooke Volume: Concrete Face Rockfill Dams, Proc. 20th ICOLD Conference, pp. 279-315.Materon, B. (2002) “Responding to the Demands of EPC Contracts”, Water Power and Dam Construction, August.
83
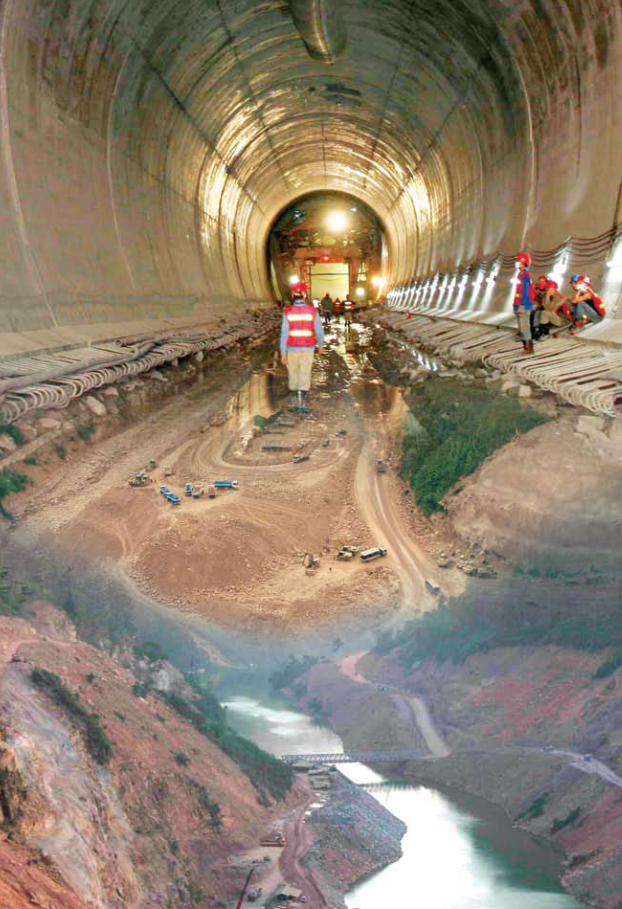
85
Design of Reinforced Concrete Linings of NN2 Headrace Tunnel
Aphichat Sramoon1, Parin Mruetusatorn1, Beni Lekhak2, Rawee Sittipod3
1 Geotechnical and Foundation Engineering Co., Ltd. (A Member of TEAM Group), Thailand2 Ch. Karnchang (Lao) Company Limited, Vientiane, Lao PDR3 Nam Ngum 2 Power Company Limited, Vientiane, Lao PDR
AbstractThe design of the pressure tunnel is illustrated by the example of the headrace
tunnel of Nam Ngum 2 Hydroelectric Power Project (NN2 HPP) in Lao PDR. The required length of steel liner is determined based on Austrian’s confinement require-ment criteria. The analysis and design of reinforced concrete lining is performed ac-cording to the geological conditions and specific loading conditions. The prediction of the water losses due to crack of the lining is performed to verify the acceptation of concrete lining. The slope stability analysis is carried out to ensure the stability of the rock cover and overburden above the headrace tunnel due to water leakage from the concrete lining. The analysis and design results show that the headrace tunnel is safe and meet the requirement for pressure tunnel.
Published in CEAT Journal, Vol. 3, March 2009 Pages 29-34.
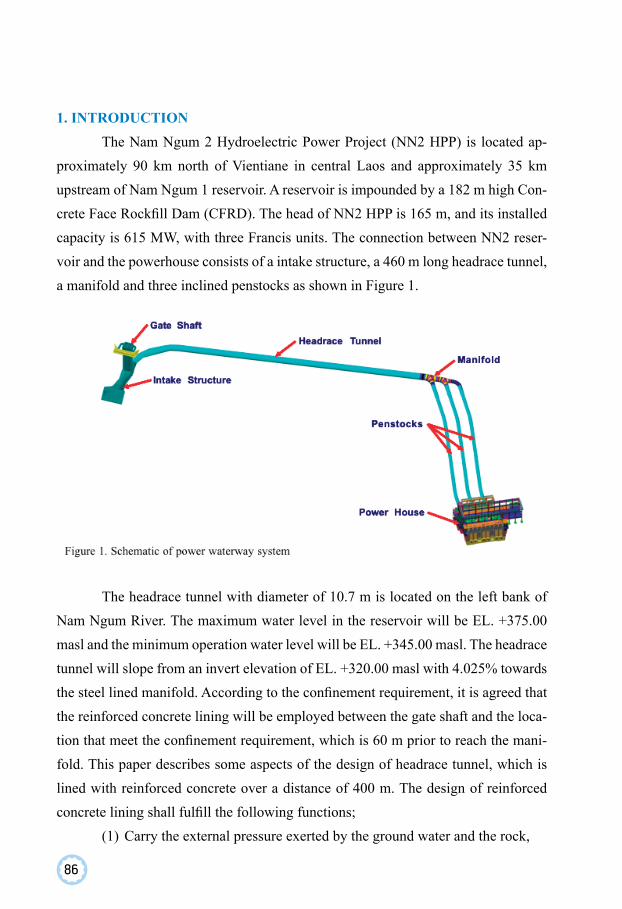
86
1. INTRODUCTIONThe Nam Ngum 2 Hydroelectric Power Project (NN2 HPP) is located ap-
proximately 90 km north of Vientiane in central Laos and approximately 35 km upstream of Nam Ngum 1 reservoir. A reservoir is impounded by a 182 m high Con-crete Face Rockfill Dam (CFRD). The head of NN2 HPP is 165 m, and its installed capacity is 615 MW, with three Francis units. The connection between NN2 reser-voir and the powerhouse consists of a intake structure, a 460 m long headrace tunnel, a manifold and three inclined penstocks as shown in Figure 1.
The headrace tunnel with diameter of 10.7 m is located on the left bank of Nam Ngum River. The maximum water level in the reservoir will be EL. +375.00 masl and the minimum operation water level will be EL. +345.00 masl. The headrace tunnel will slope from an invert elevation of EL. +320.00 masl with 4.025% towards the steel lined manifold. According to the confinement requirement, it is agreed that the reinforced concrete lining will be employed between the gate shaft and the loca-tion that meet the confinement requirement, which is 60 m prior to reach the mani-fold. This paper describes some aspects of the design of headrace tunnel, which is lined with reinforced concrete over a distance of 400 m. The design of reinforced concrete lining shall fulfill the following functions;
(1) Carry the external pressure exerted by the ground water and the rock,
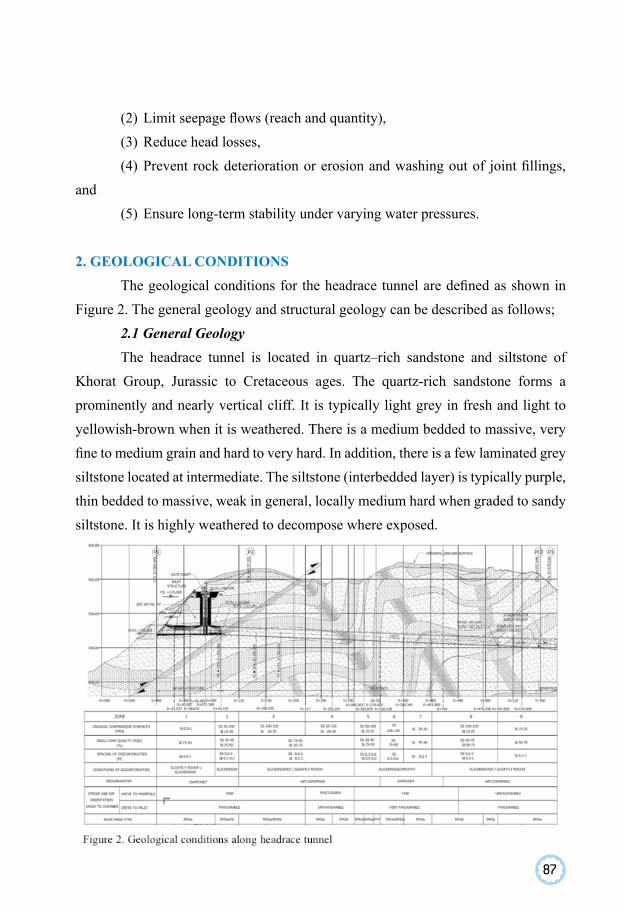
87
(2) Limit seepage flows (reach and quantity),(3) Reduce head losses,(4) Prevent rock deterioration or erosion and washing out of joint fillings,
and(5) Ensure long-term stability under varying water pressures.
2. GEOLOGICAL CONDITIONS The geological conditions for the headrace tunnel are defined as shown in
Figure 2. The general geology and structural geology can be described as follows;2.1 General GeologyThe headrace tunnel is located in quartz–rich sandstone and siltstone of
Khorat Group, Jurassic to Cretaceous ages. The quartz-rich sandstone forms a prominently and nearly vertical cliff. It is typically light grey in fresh and light to yellowish-brown when it is weathered. There is a medium bedded to massive, very fine to medium grain and hard to very hard. In addition, there is a few laminated grey siltstone located at intermediate. The siltstone (interbedded layer) is typically purple, thin bedded to massive, weak in general, locally medium hard when graded to sandy siltstone. It is highly weathered to decompose where exposed.
88
2.2 Structural GeologyThe headrace tunnel is driven through S-form synclinal and anticlinal folds
whose axis is approximately N80°E of trend and nearly perpendicular to the Nam Ngum river channel. The beginning of the headrace tunnel is driven in shear zone. Its plane is approximately N30°W of trend and approximately 35° of plunge to the northeast. The quartz-rich sandstone and siltstone located along the tunnel are in-tensely gentle to steeply joints and their trends are varies. The following length of the tunnel (120-130 m approximately) is driven through the low angle anticline, where the dips of bedding planes are between 0° to 30° to the north-northeast and 0° to 25° to south-southwest. The sandstone located in this location is closely to medium gentle to steep joints. At the middle length of the tunnel (70-80 m approximately) driven though the north limb of the S-form anticline, the dips of bedding plane are from 70° to 85° to the north-northeast. At the end of the headrace tunnel, it is driven in the syncline. The dips are between 0° to 30° to the south-southeast and 0° to 30° to the north-northeast. The strike of bedding plane ranges from east-west to N45° W. Their surfaces are typically cleaned. However, there are some iron-oxide stained, tight, slightly rough to rough, slight undulating and some slickenside surfaces. In ad-dition, there is quartz-rich sandstone and prominent slickenside surface for siltstone. There are two joint sets that appear along the headrace tunnel. The first one is nearly vertical and another is gentle ranging from N45°E to N45°W of trend. The surfaces are typically cleaned or iron-oxide stained, slightly rough to smooth, slightly undu-lating. Furthermore, some joint surfaces are slickenside.
3. CONFINEMENT REQUIREMENTS It is recognized that the rock cover would have to be of sufficient equivalent
weight to sustain the internal pressure of an unlined tunnel. It is also recognized that soil, talus and colluvium deposits should be disregarded in terms of providing a contribution to the confinement, that is, a rock mass to sustain the internal pressure without hydraulic jacking. Hydraulic jacking does take place when the water pres-sure or thin grout pressure acting on a plane exceeds the normal stress across the plane, which can be a prevailing joint, bedding parting or impervious barrier.
89
An Austrian criterion is adopted as the confinement criteria for headrace tun-nel. The minimal radius of rock zone for the static head can be defined as
(1)
where FSs is the safety factor for static head; γw is the unit weight of water; γr is the
unit weight of rock mass; hs is the static head; and k0 is the minimum stress ratio. According to hydrofracturing/hydraulic injection test results, it is found that
the minimum horizontal principal stress is the minimum principal stress. The mini-mum stress ratio (horizontal stress/vertical stress) of 0.5 has been observed ( k0=0.5). Since the static head at the connection between concrete lined and steel lined is 64 m, the required minimum radius of rock cover is 64 m approximately with the safety factor of 1.25.
4. TUNNEL ANALYSIS AND DESIGNThe headrace tunnel is mainly considered as the pressure tunnel. Therefore,
the reinforced concrete lining are used to resist external and internal loads or to pro-tect erodible and to limit the circumferential strains and cracks which develop under operating conditions. In order to design tunnel element economically, the tunnel ele-ment shall design with optimum reinforcement using proper analysis model.
4.1 Beam Spring ModelThe beam spring model is a simple method that gives satisfactory results for
this kind of analysis and design (Duddeck & Erdman, 1982; ITA, 1988; USACE, 1997). The tunnel is modeled with elastic bedded beam element. Whereas, the bed-ding to the rock is considered as non-tension spring, which can only have compres-sion and tension is excluded. The beam spring model used in the analysis is shown in Figure 3.
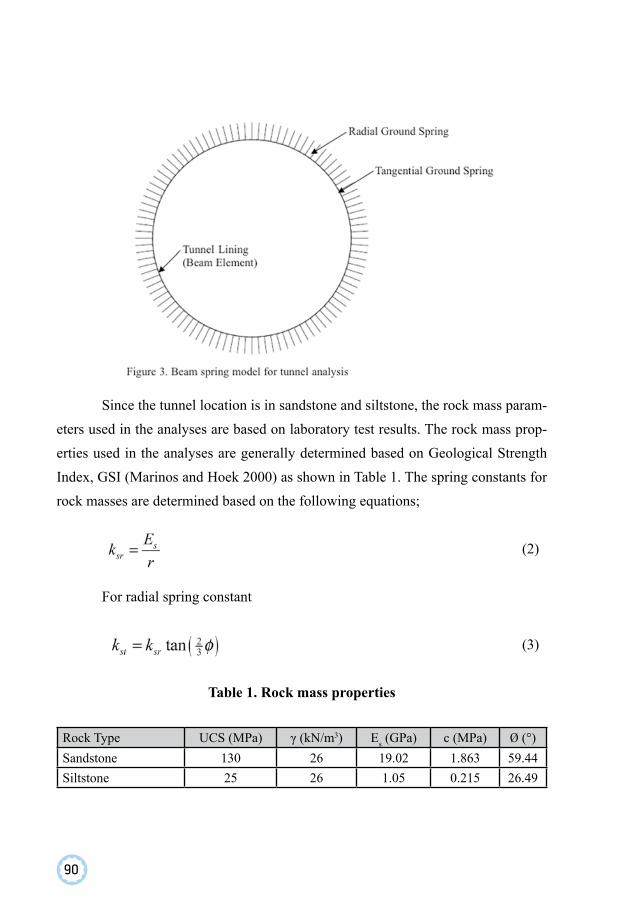
90
Since the tunnel location is in sandstone and siltstone, the rock mass param-eters used in the analyses are based on laboratory test results. The rock mass prop-erties used in the analyses are generally determined based on Geological Strength Index, GSI (Marinos and Hoek 2000) as shown in Table 1. The spring constants for rock masses are determined based on the following equations;
(2)
For radial spring constant
(3)
Table 1. Rock mass properties
Rock Type UCS (MPa) γ (kN/m3) Es (GPa) c (MPa) Ø (°)Sandstone 130 26 19.02 1.863 59.44Siltstone 25 26 1.05 0.215 26.49
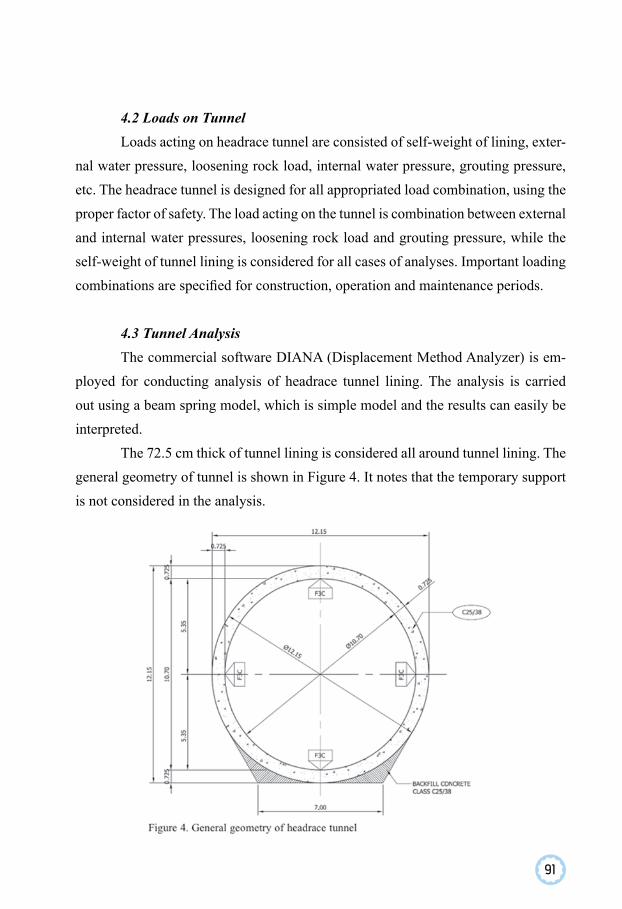
91
4.2 Loads on TunnelLoads acting on headrace tunnel are consisted of self-weight of lining, exter-
nal water pressure, loosening rock load, internal water pressure, grouting pressure, etc. The headrace tunnel is designed for all appropriated load combination, using the proper factor of safety. The load acting on the tunnel is combination between external and internal water pressures, loosening rock load and grouting pressure, while the self-weight of tunnel lining is considered for all cases of analyses. Important loading combinations are specified for construction, operation and maintenance periods.
4.3 Tunnel AnalysisThe commercial software DIANA (Displacement Method Analyzer) is em-
ployed for conducting analysis of headrace tunnel lining. The analysis is carried out using a beam spring model, which is simple model and the results can easily be interpreted.
The 72.5 cm thick of tunnel lining is considered all around tunnel lining. The general geometry of tunnel is shown in Figure 4. It notes that the temporary support is not considered in the analysis.
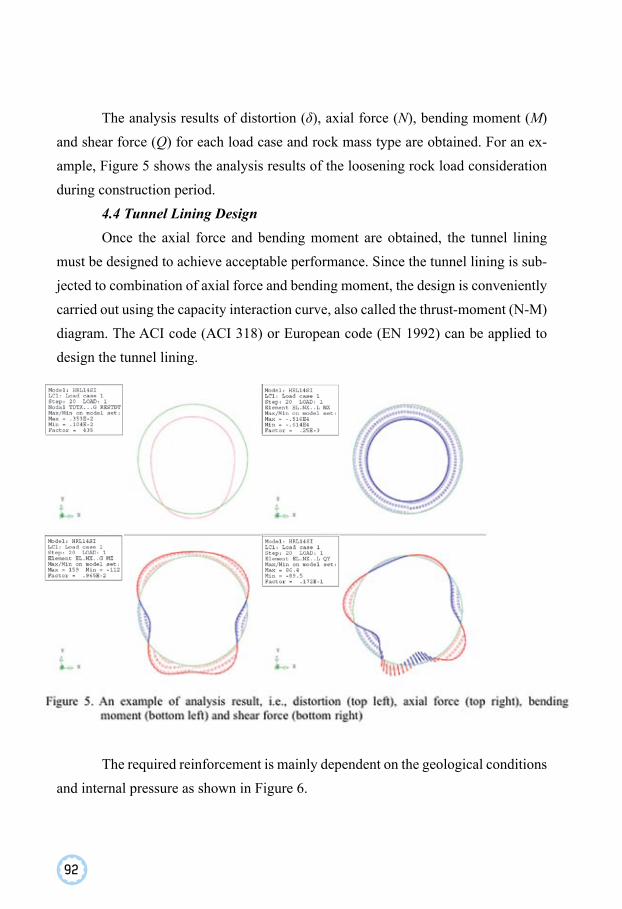
92
The analysis results of distortion (δ), axial force (N), bending moment (M) and shear force (Q) for each load case and rock mass type are obtained. For an ex-ample, Figure 5 shows the analysis results of the loosening rock load consideration during construction period.
4.4 Tunnel Lining DesignOnce the axial force and bending moment are obtained, the tunnel lining
must be designed to achieve acceptable performance. Since the tunnel lining is sub-jected to combination of axial force and bending moment, the design is conveniently carried out using the capacity interaction curve, also called the thrust-moment (N-M) diagram. The ACI code (ACI 318) or European code (EN 1992) can be applied to design the tunnel lining.
The required reinforcement is mainly dependent on the geological conditions and internal pressure as shown in Figure 6.
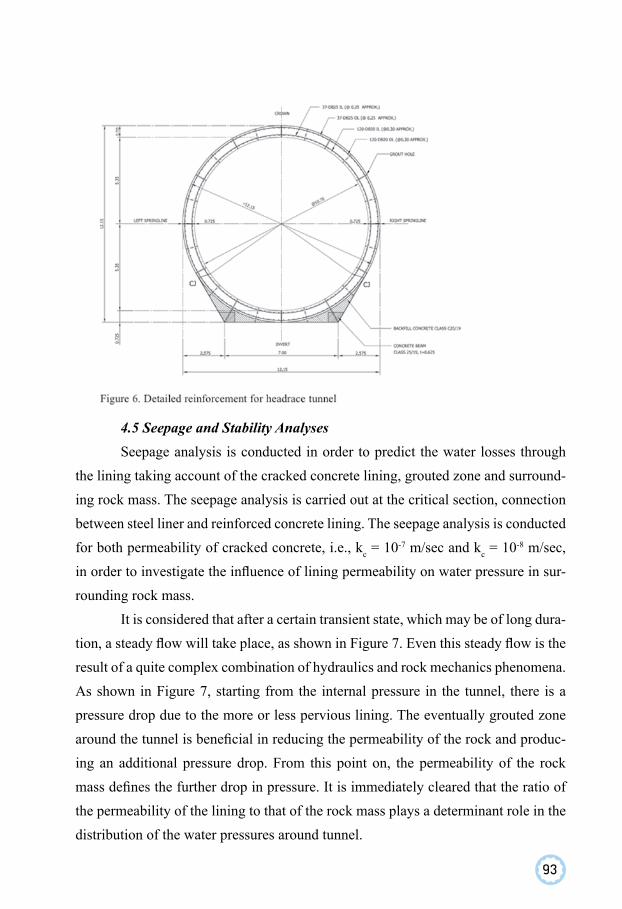
93
4.5 Seepage and Stability AnalysesSeepage analysis is conducted in order to predict the water losses through
the lining taking account of the cracked concrete lining, grouted zone and surround-ing rock mass. The seepage analysis is carried out at the critical section, connection between steel liner and reinforced concrete lining. The seepage analysis is conducted for both permeability of cracked concrete, i.e., kc = 10-7 m/sec and kc = 10-8 m/sec, in order to investigate the influence of lining permeability on water pressure in sur-rounding rock mass.
It is considered that after a certain transient state, which may be of long dura-tion, a steady flow will take place, as shown in Figure 7. Even this steady flow is the result of a quite complex combination of hydraulics and rock mechanics phenomena. As shown in Figure 7, starting from the internal pressure in the tunnel, there is a pressure drop due to the more or less pervious lining. The eventually grouted zone around the tunnel is beneficial in reducing the permeability of the rock and produc-ing an additional pressure drop. From this point on, the permeability of the rock mass defines the further drop in pressure. It is immediately cleared that the ratio of the permeability of the lining to that of the rock mass plays a determinant role in the distribution of the water pressures around tunnel.
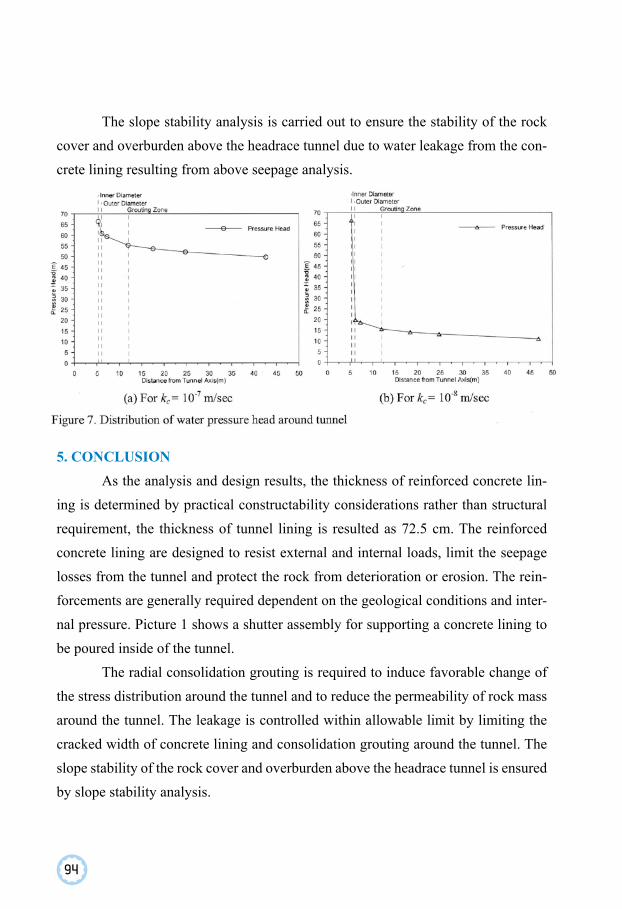
94
The slope stability analysis is carried out to ensure the stability of the rock cover and overburden above the headrace tunnel due to water leakage from the con-crete lining resulting from above seepage analysis.
5. CONCLUSION As the analysis and design results, the thickness of reinforced concrete lin-
ing is determined by practical constructability considerations rather than structural requirement, the thickness of tunnel lining is resulted as 72.5 cm. The reinforced concrete lining are designed to resist external and internal loads, limit the seepage losses from the tunnel and protect the rock from deterioration or erosion. The rein-forcements are generally required dependent on the geological conditions and inter-nal pressure. Picture 1 shows a shutter assembly for supporting a concrete lining to be poured inside of the tunnel.
The radial consolidation grouting is required to induce favorable change of the stress distribution around the tunnel and to reduce the permeability of rock mass around the tunnel. The leakage is controlled within allowable limit by limiting the cracked width of concrete lining and consolidation grouting around the tunnel. The slope stability of the rock cover and overburden above the headrace tunnel is ensured by slope stability analysis.
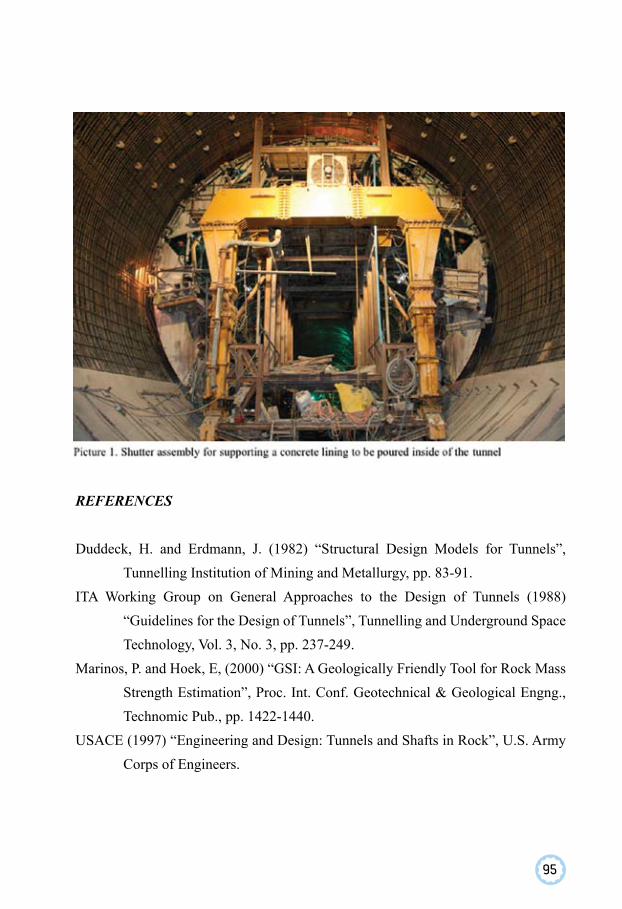
95
REFERENCES
Duddeck, H. and Erdmann, J. (1982) “Structural Design Models for Tunnels”, Tunnelling Institution of Mining and Metallurgy, pp. 83-91.ITA Working Group on General Approaches to the Design of Tunnels (1988) “Guidelines for the Design of Tunnels”, Tunnelling and Underground Space Technology, Vol. 3, No. 3, pp. 237-249.Marinos, P. and Hoek, E, (2000) “GSI: A Geologically Friendly Tool for Rock Mass Strength Estimation”, Proc. Int. Conf. Geotechnical & Geological Engng., Technomic Pub., pp. 1422-1440.USACE (1997) “Engineering and Design: Tunnels and Shafts in Rock”, U.S. Army Corps of Engineers.
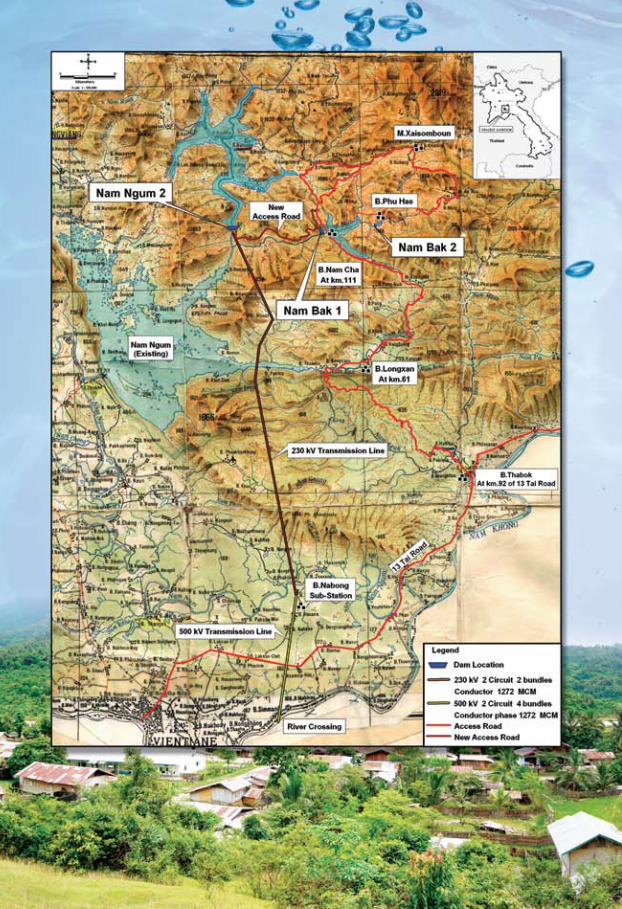
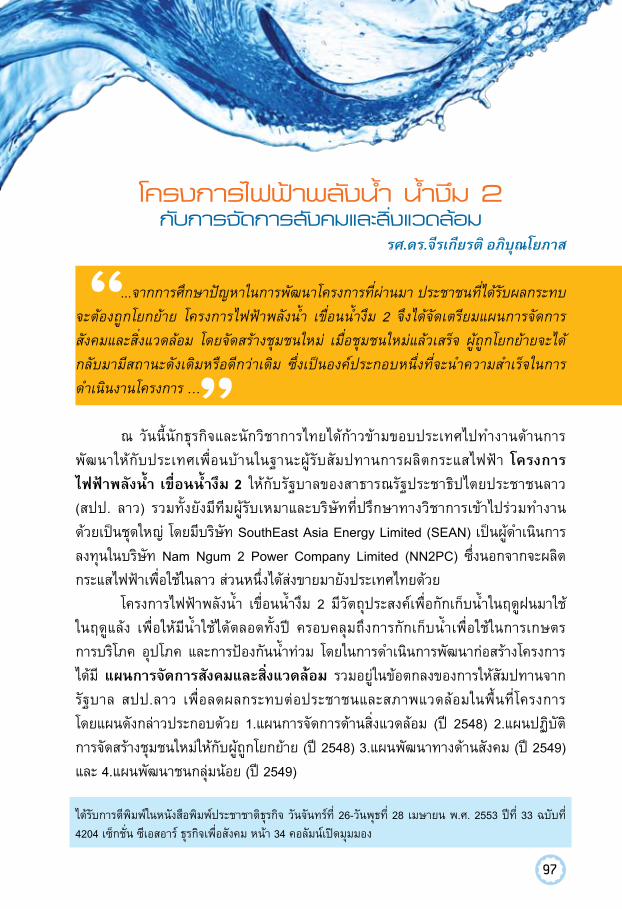
ได้รับการตีพิมพ์ในหนังสือพิมพ์ประชาชาติธุรกิจ วันจันทร์ที่ 26-วันพุธที่ 28 เมษายน พ.ศ. 2553 ปีที่ 33 ฉบับที่ 4204 เซ็กชั่น ซีเอสอาร์ ธุรกิจเพื่อสังคม หน้า 34 คอลัมน์เปิดมุมมอง
97
โครงการไฟฟ้าพลังน้ำ น้ำงึม 2 กับการจัดการสังคมและสิ่งแวดล้อม
รศ.ดร.จีรเกียรติ อภิบุณโยภาส
...จากการศึกษาปัญหาในการพัฒนาโครงการที่ผ่านมา ประชาชนที่ได้รับผลกระทบ
จะต้องถูกโยกย้าย โครงการไฟฟ้าพลังน้ำ เขื่อนน้ำงึม 2 จึงได้จัดเตรียมแผนการจัดการ
สังคมและสิ่งแวดล้อม โดยจัดสร้างชุมชนใหม่ เมื่อชุมชนใหม่แล้วเสร็จ ผู้ถูกโยกย้ายจะได้
กลับมามีสถานะดังเดิมหรือดีกว่าเดิม ซึ่งเป็นองค์ประกอบหนึ่งที่จะนำความสำเร็จในการ
ดำเนินงานโครงการ …
ณ วันนี้นักธุรกิจและนักวิชาการไทยได้ก้าวข้ามขอบประเทศไปทำงานด้านการ
พัฒนาให้กับประเทศเพื่อนบ้านในฐานะผู้รับสัมปทานการผลิตกระแสไฟฟ้า โครงการ
ไฟฟ้าพลังน้ำ เขื่อนน้ำงึม 2 ให้กับรัฐบาลของสาธารณรัฐประชาธิปไตยประชาชนลาว
(สปป. ลาว) รวมทั้งยังมีทีมผู้รับเหมาและบริษัทที่ปรึกษาทางวิชาการเข้าไปร่วมทำงาน
ด้วยเป็นชุดใหญ่ โดยมีบริษัท SouthEast Asia Energy Limited (SEAN) เป็นผู้ดำเนินการ
ลงทุนในบริษัท Nam Ngum 2 Power Company Limited (NN2PC) ซึ่งนอกจากจะผลิต
กระแสไฟฟ้าเพื่อใช้ในลาว ส่วนหนึ่งได้ส่งขายมายังประเทศไทยด้วย
โครงการไฟฟ้าพลังน้ำ เขื่อนน้ำงึม 2 มีวัตถุประสงค์เพื่อกักเก็บน้ำในฤดูฝนมาใช้
ในฤดูแล้ง เพื่อให้มีน้ำใช้ได้ตลอดทั้งปี ครอบคลุมถึงการกักเก็บน้ำเพื่อใช้ในการเกษตร
การบริโภค อุปโภค และการป้องกันน้ำท่วม โดยในการดำเนินการพัฒนาก่อสร้างโครงการ
ได้มี แผนการจัดการสังคมและสิ่งแวดล้อม รวมอยู่ในข้อตกลงของการให้สัมปทานจาก
รัฐบาล สปป.ลาว เพื่อลดผลกระทบต่อประชาชนและสภาพแวดล้อมในพื้นที่โครงการ
โดยแผนดังกล่าวประกอบด้วย 1.แผนการจัดการด้านสิ่งแวดล้อม (ปี 2548) 2.แผนปฏิบัติ
การจัดสร้างชุมชนใหม่ให้กับผู้ถูกโยกย้าย (ปี 2548) 3.แผนพัฒนาทางด้านสังคม (ปี 2549)
และ 4.แผนพัฒนาชนกลุ่มน้อย (ปี 2549)
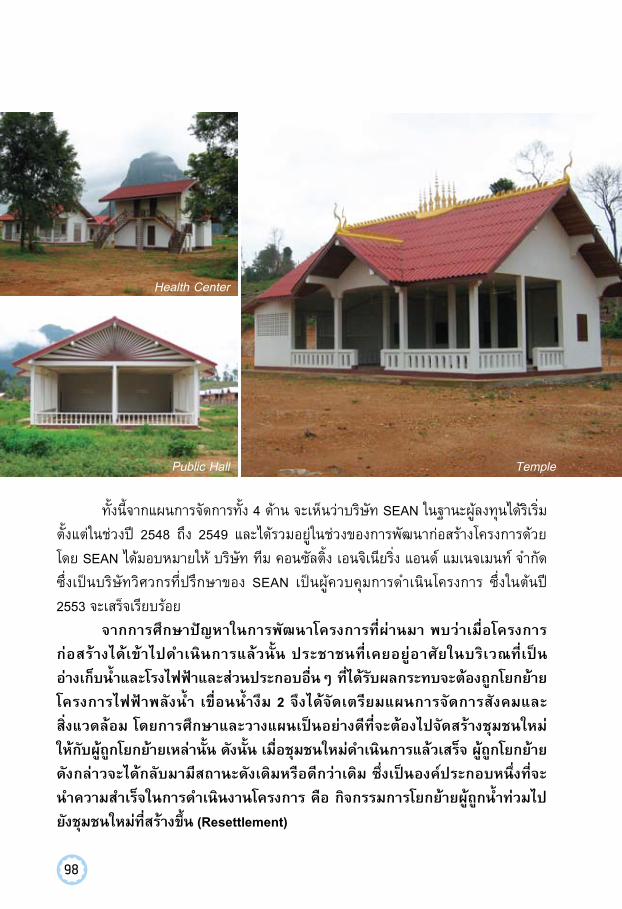
Public Hall Temple
Health Center
98
ทั้งนี้จากแผนการจัดการทั้ง 4 ด้าน จะเห็นว่าบริษัท SEAN ในฐานะผู้ลงทุนได้ริเริ่ม
ตั้งแต่ในช่วงปี 2548 ถึง 2549 และได้รวมอยู่ในช่วงของการพัฒนาก่อสร้างโครงการด้วย
โดย SEAN ได้มอบหมายให้ บริษัท ทีม คอนซัลติ้ง เอนจิเนียริ่ง แอนด์ แมเนจเมนท์ จำกัด
ซึ่งเป็นบริษัทวิศวกรที่ปรึกษาของ SEAN เป็นผู้ควบคุมการดำเนินโครงการ ซึ่งในต้นปี
2553 จะเสร็จเรียบร้อย
จากการศึกษาปัญหาในการพัฒนาโครงการที่ผ่านมา พบว่าเมื่อโครงการ
ก่อสร้างได้เข้าไปดำเนินการแล้วนั้น ประชาชนที่เคยอยู่อาศัยในบริเวณที่เป็น
อ่างเก็บน้ำและโรงไฟฟ้าและส่วนประกอบอื่นๆ ที่ได้รับผลกระทบจะต้องถูกโยกย้าย
โครงการไฟฟ้าพลังน้ำ เขื่อนน้ำงึม 2 จึงได้จัดเตรียมแผนการจัดการสังคมและ
สิ่งแวดล้อม โดยการศึกษาและวางแผนเป็นอย่างดีที่จะต้องไปจัดสร้างชุมชนใหม่
ให้กับผู้ถูกโยกย้ายเหล่านั้น ดังนั้น เมื่อชุมชนใหม่ดำเนินการแล้วเสร็จ ผู้ถูกโยกย้าย
ดังกล่าวจะได้กลับมามีสถานะดังเดิมหรือดีกว่าเดิม ซึ่งเป็นองค์ประกอบหนึ่งที่จะ
นำความสำเร็จในการดำเนินงานโครงการ คือ กิจกรรมการโยกย้ายผู้ถูกน้ำท่วมไป
ยังชุมชนใหม่ที่สร้างขึ้น (Resettlement)
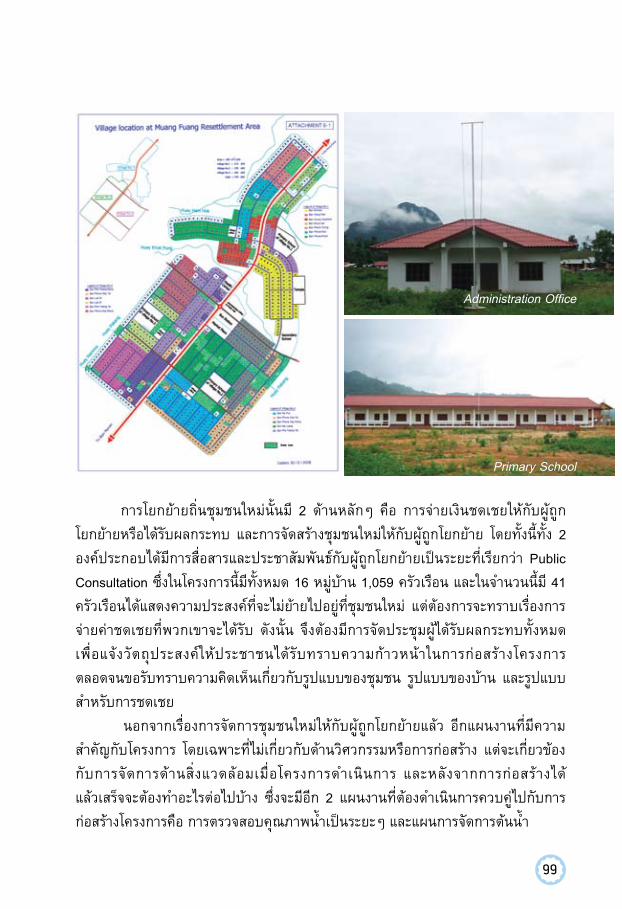
Primary School
Administration Office
99
การโยกย้ายถิ่นชุมชนใหม่นั้นมี 2 ด้านหลักๆ คือ การจ่ายเงินชดเชยให้กับผู้ถูก
โยกย้ายหรือได้รับผลกระทบ และการจัดสร้างชุมชนใหม่ให้กับผู้ถูกโยกย้าย โดยทั้งนี้ทั้ง 2
องค์ประกอบได้มีการสื่อสารและประชาสัมพันธ์กับผู้ถูกโยกย้ายเป็นระยะที่เรียกว่า Public
Consultation ซึ่งในโครงการนี้มีทั้งหมด 16 หมู่บ้าน 1,059 ครัวเรือน และในจำนวนนี้มี 41
ครัวเรือนได้แสดงความประสงค์ที่จะไม่ย้ายไปอยู่ที่ชุมชนใหม่ แต่ต้องการจะทราบเรื่องการ
จ่ายค่าชดเชยที่พวกเขาจะได้รับ ดังนั้น จึงต้องมีการจัดประชุมผู้ได้รับผลกระทบทั้งหมด
เพื่อแจ้งวัตถุประสงค์ให้ประชาชนได้รับทราบความก้าวหน้าในการก่อสร้างโครงการ
ตลอดจนขอรับทราบความคิดเห็นเกี่ยวกับรูปแบบของชุมชน รูปแบบของบ้าน และรูปแบบ
สำหรับการชดเชย
นอกจากเรื่องการจัดการชุมชนใหม่ให้กับผู้ถูกโยกย้ายแล้ว อีกแผนงานที่มีความ
สำคัญกับโครงการ โดยเฉพาะที่ไม่เกี่ยวกับด้านวิศวกรรมหรือการก่อสร้าง แต่จะเกี่ยวข้อง
กับการจัดการด้านสิ่งแวดล้อมเมื่อโครงการดำเนินการ และหลังจากการก่อสร้างได้
แล้วเสร็จจะต้องทำอะไรต่อไปบ้าง ซึ่งจะมีอีก 2 แผนงานที่ต้องดำเนินการควบคู่ไปกับการ
ก่อสร้างโครงการคือ การตรวจสอบคุณภาพน้ำเป็นระยะๆ และแผนการจัดการต้นน้ำ
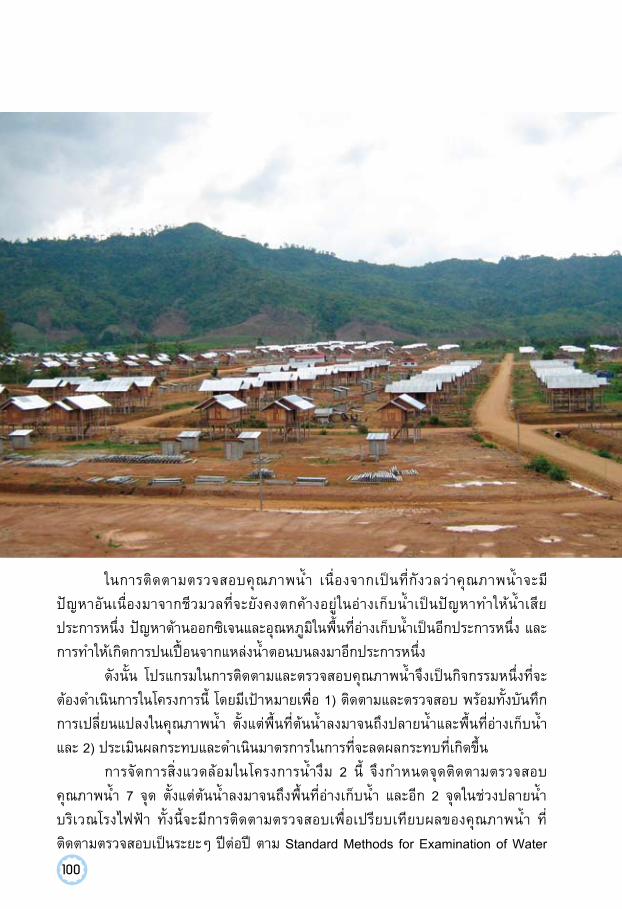
100
ในการติดตามตรวจสอบคุณภาพน้ำ เนื่องจากเป็นที่กังวลว่าคุณภาพน้ำจะมี
ปัญหาอันเนื่องมาจากชีวมวลที่จะยังคงตกค้างอยู่ในอ่างเก็บน้ำเป็นปัญหาทำให้น้ำเสีย
ประการหนึ่ง ปัญหาด้านออกซิเจนและอุณหภูมิในพื้นที่อ่างเก็บน้ำเป็นอีกประการหนึ่ง และ
การทำให้เกิดการปนเปื้อนจากแหล่งน้ำตอนบนลงมาอีกประการหนึ่ง
ดังนั้น โปรแกรมในการติดตามและตรวจสอบคุณภาพน้ำจึงเป็นกิจกรรมหนึ่งที่จะ
ต้องดำเนินการในโครงการนี้ โดยมีเป้าหมายเพื่อ 1) ติดตามและตรวจสอบ พร้อมทั้งบันทึก
การเปลี่ยนแปลงในคุณภาพน้ำ ตั้งแต่พื้นที่ต้นน้ำลงมาจนถึงปลายน้ำและพื้นที่อ่างเก็บน้ำ
และ 2) ประเมินผลกระทบและดำเนินมาตรการในการที่จะลดผลกระทบที่เกิดขึ้น
การจัดการสิ่งแวดล้อมในโครงการน้ำงึม 2 นี้ จึงกำหนดจุดติดตามตรวจสอบ
คุณภาพน้ำ 7 จุด ตั้งแต่ต้นน้ำลงมาจนถึงพื้นที่อ่างเก็บน้ำ และอีก 2 จุดในช่วงปลายน้ำ
บริเวณโรงไฟฟ้า ทั้งนี้จะมีการติดตามตรวจสอบเพื่อเปรียบเทียบผลของคุณภาพน้ำ ที่
ติดตามตรวจสอบเป็นระยะๆ ปีต่อปี ตาม Standard Methods for Examination of Water

101
and Wastewater โดยวัดอุณหภูมิและปริมาณออกซิเจนและจัดเก็บเป็นข้อมูลของแต่ละจุด
หรือสถานีตรวจสอบตามระดับความลึกตั้งแต่ 0.5, 1, 2, 5 และ 10 เมตรของน้ำ ส่วนระดับ
พื้นดินจะตรวจสอบทุกระดับ 10 เมตร
ในการติดตามตรวจสอบคุณภาพน้ำนี้จะต้องมีอย่างน้อย 3 หน่วยงานที่เกี่ยวข้อง
มารับผิดชอบในแต่ละด้านคือ บริษัทผู้รับเหมาก่อสร้างจะเป็นผู้รับผิดชอบในการสนับสนุน
ภาคสนามและการทดสอบในห้องปฎิบัติการ GOL หรือองค์กรของรัฐบาล สปป.ลาว จะเข้า
มาช่วยอำนวยความสะดวกและดูแลความปลอดภัย วิศวกรของ NN2PC จะรับผิดชอบ
ในการดูแลการเก็บตัวอย่างในภาคสนาม การวิเคราะห์ และประเมินผลกระทบพร้อมกับ
รายงานให้ผู้เกี่ยวข้องได้ทราบเป็นระยะ
แผนการติดตามเรื่องคุณภาพน้ำนี้จะดำเนินการตั้งแต่เดือนพฤษภาคม 2553 ถึง
เดือนพฤศจิกายน 2553 ซึ่งคาดว่าโครงการก่อสร้างแล้วเสร็จ และจะดำเนินการต่อไปจนถึง
สิ้นสุดอายุสัมปทานคือปี 2580 หรืออีกประมาณ 27 ปีข้างหน้า
อีกกิจกรรมหนึ่งที่สำคัญคือ การจัดการต้นน้ำ ซึ่งเป็นการที่จะต้องทำเพื่อความ
ยั่งยืนของโครงการไฟฟ้าพลังน้ำ เพราะเป็นเรื่องของน้ำและคุณภาพของน้ำที่จะนำมาลง
สู่อ่างเก็บน้ำ ดังนั้น โครงการหรือโปรแกรมการจัดการต้นน้ำจึงถูกกำหนดขึ้นมาเพื่อยืนยัน
ถึงความยั่งยืนของอ่างเก็บน้ำในโครงการและผู้ที่จะใช้ประโยชน์จากโครงการเขื่อนน้ำงึม 2
แน่นอนการดำเนินการในโครงการนี้มีความจำเป็นที่จะต้องนำประชาชนใน
พื้นที่โครงการเข้ามามีส่วนร่วม เพื่อยืนยันให้เห็นว่าผู้ที่ได้รับผลกระทบทุกคนจะได้
มีส่วนร่วมในทุกๆ ด้านของการลงทุนในโครงการนี้
เช่นเดียวกันกับเรื่องการติดตามตรวจสอบคุณภาพน้ำ หน่วยงานหลักๆ 3 กลุ่ม คือ
ผู้รับเหมาก่อสร้าง หน่วยงานของผู้รับสัมปทาน และหน่วยงานของรัฐบาล สปป.ลาว จะมี
ส่วนเข้ามาสนับสนุนและรับผิดชอบกับการดำเนินการในแผนการจัดการสิ่งแวดล้อม เมื่อ
โครงการกำลังก่อสร้าง และที่จะแล้วเสร็จ ตลอดจนเมื่อไปดำเนินการผลิตกระแสไฟฟ้า
ตลอดอายุสัมปทานที่จะหมดในปี 2580
นับว่า โครงการไฟฟ้าพลังน้ำ เขื่อนน้ำงึม 2 เป็นอีกหนึ่งความภูมิใจที่บริษัท
ธุรกิจผู้รับเหมาก่อสร้าง บริษัทพัฒนาโครงการไฟฟ้าพลังน้ำ และบริษัทวิศวกรที่
ปรึกษาไทยได้มีโอกาสไปทำงานร่วมกับรัฐบาล สปป.ลาว หน่วยงานราชการของ
ลาว และประชาชนชาวลาว ซึ่งต่อไปจะเป็นโครงการตัวอย่างของการพัฒนาทั้งทาง
ด้านเศรษฐกิจ สังคม และสิ่งแวดล้อมร่วมกันอย่างไม่มีพรมแดนอีกตัวอย่างหนึ่ง
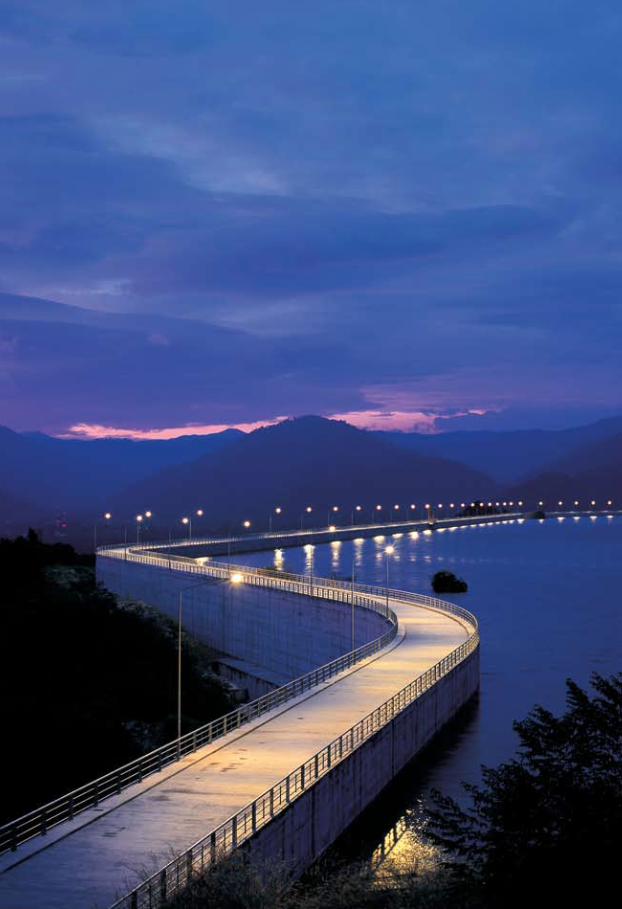

103
ไฟฟ้าพลังงานน้ำ ขุนด่านปราการชล หนึ่งเปอร์เซ็นต์ที่ยั่งยืน
สมมาตร ยืนยิ่ง
...พลังงานไฟฟ้าที่ได้สามารถหล่อเลี้ยงกิจกรรมทั้งหมดของทั้งจังหวัดนครนายก
ช่วยเสริมระบบไฟฟ้าในนครนายกและจังหวัดข้างเคียงให้มีความมั่นคง ทำให้ผู้ใช้ได้ใช้
ไฟฟ้าที่มีคุณภาพดี ลดความสูญเสียในระบบไฟฟ้า ส่งผลให้การใช้ไฟฟ้าโดยรวมของ
ประเทศมีประสิทธิภาพยิ่งขึ้น ...
ประเทศไทยจำเป็นต้องผลิตพลังงานไฟฟ้าเข้ามาหล่อเลี้ยงระบบเศรษฐกิจและวิถี
ชีวิตของคนไทยด้วยกำลังผลิตมากกว่าสองหมื่นเมกะวัตต์ จากสถิติโดยการไฟฟ้าฝ่ายผลิต
แห่งประเทศไทย ได้แสดงข้อมูลเชื้อเพลิงหลักที่ใช้ในการผลิตไฟฟ้า อาทิ ก๊าซธรรมชาติ
ถ่านหินลิกไนต์์ และถ่านหินนำเข้าในสัดส่วนร้อยละ 68.1 ร้อยละ 10.7 และร้อยละ 8.1 ตาม
ลำดับ นั่นคือเกินกว่ากึ่งหนึ่งของเชื้อเพลิงที่ใช้ในการผลิตไฟฟ้าเป็นก๊าซธรรมชาติ และถ้า
รวมก๊าซธรรมชาติกับถ่านหินเข้าด้วยกันจะเป็นร้อยละ 86.9 ที่เหลือจะเป็นเชื้อเพลิงจาก
พลังงานน้ำ น้ำมันเตา และพลังงานอื่นๆ
เป็นที่ทราบกันดีว่าสถานการณ์ราคาของเชื้อเพลิงฟอสซิลประเภทก๊าซธธรมชาติ
ถ่านหิน และน้ำมัน มีความผันผวนและปรับตัวถีบราคาสูงขึ้นอย่างมาก หากลอง
เปรียบเทียบราคาน้ำมันอย่างง่าย ณ ขณะนี้ที่มีราคาเริ่มต้นตั้งแต่ลิตรละ 20 บาท ไปจนถึง
ลิตรละ 40 บาท ทั้งที่ราคาเมื่อประมาณปี 2549 ราคาเชื้อเพลิงฟอสซิลเกือบทุกประเภทมี
ราคาไม่ถึง 20 บาทต่อลิตร นั่นเทียบได้ว่าราคาที่ปรับประมาณการในช่วงวาระเพียง 5 ปีมา
นี้ ราคาเชื้อเพลิงปรับสูงขึ้นมากกว่า 100 เปอร์เซ็นต์เลยทีเดียว และเมื่อพิจารณาประกอบ
กับข่าวในระดับสากลที่มีมีปั่นราคาของพลังงานเชื้อเพลิงของโลกที่มีความไม่แน่นอนกันวัน
ต่อวัน เพียงข้อมูลประกอบอย่างคร่าวๆ เท่านี้ก็พอจะทำให้เราต้องมาฉุกคิดและหาทางออก
ของการพัฒนาด้านพลังงานของประเทศให้มีความมั่นคงกันเสียที
จากการประมาณการสำรวจพลังงานสำรองอันเป็นเชื้อเพลิงหลักที่ใช้ในการผลิต
กระแสไฟฟ้าของโลกในปัจจุบัน พบว่าทรัพยากรประเภทถ่านหินยังมีให้ใช้ได้อีก 220 ปี
ก๊าซธรรมชาติยังเหลือเพียง 62 ปี และอีกไม่ถึง 40 ปี น้ำมันจะไม่มีเหลือให้ใช้อีกแล้ว แต่จะ
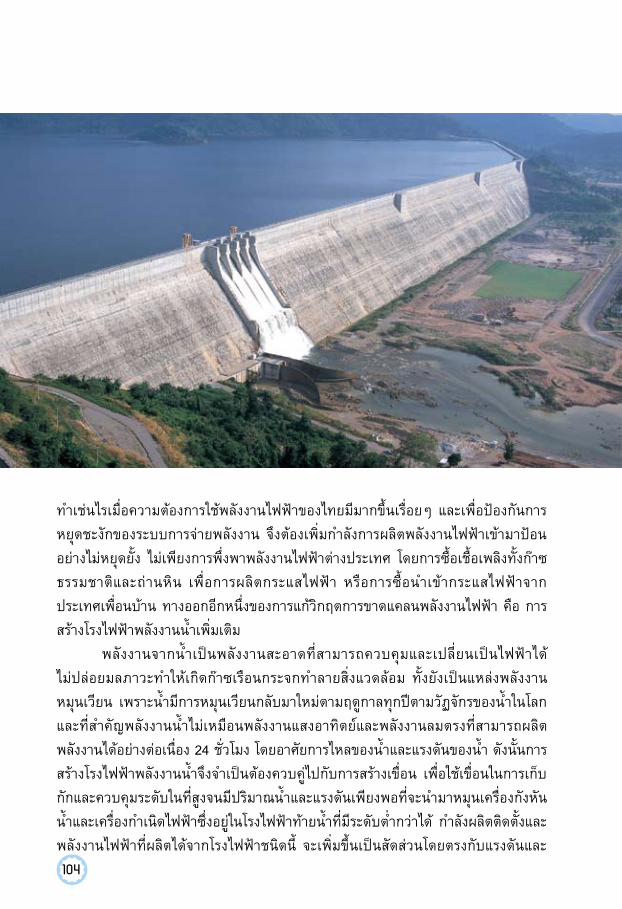
104
ทำเช่นไรเมื่อความต้องการใช้พลังงานไฟฟ้าของไทยมีมากขึ้นเรื่อยๆ และเพื่อป้องกันการ
หยุดชะงักของระบบการจ่ายพลังงาน จึงต้องเพิ่มกำลังการผลิตพลังงานไฟฟ้าเข้ามาป้อน
อย่างไม่หยุดยั้ง ไม่เพียงการพึ่งพาพลังงานไฟฟ้าต่างประเทศ โดยการซื้อเชื้อเพลิงทั้งก๊าซ
ธรรมชาติและถ่านหิน เพื่อการผลิตกระแสไฟฟ้า หรือการซื้อนำเข้ากระแสไฟฟ้าจาก
ประเทศเพื่อนบ้าน ทางออกอีกหนึ่งของการแก้วิกฤตการขาดแคลนพลังงานไฟฟ้า คือ การ
สร้างโรงไฟฟ้าพลังงานน้ำเพิ่มเติม
พลังงานจากน้ำเป็นพลังงานสะอาดที่สามารถควบคุมและเปลี่ยนเป็นไฟฟ้าได้
ไม่ปล่อยมลภาวะทำให้เกิดก๊าซเรือนกระจกทำลายสิ่งแวดล้อม ทั้งยังเป็นแหล่งพลังงาน
หมุนเวียน เพราะน้ำมีการหมุนเวียนกลับมาใหม่ตามฤดูกาลทุกปีตามวัฏจักรของน้ำในโลก
และที่สำคัญพลังงานน้ำไม่เหมือนพลังงานแสงอาทิตย์และพลังงานลมตรงที่สามารถผลิต
พลังงานได้อย่างต่อเนื่อง 24 ชั่วโมง โดยอาศัยการไหลของน้ำและแรงดันของน้ำ ดังนั้นการ
สร้างโรงไฟฟ้าพลังงานน้ำจึงจำเป็นต้องควบคู่ไปกับการสร้างเขื่อน เพื่อใช้เขื่อนในการเก็บ
กักและควบคุมระดับในที่สูงจนมีปริมาณน้ำและแรงดันเพียงพอที่จะนำมาหมุนเครื่องกังหัน
น้ำและเครื่องกำเนิดไฟฟ้าซึ่งอยู่ในโรงไฟฟ้าท้ายน้ำที่มีระดับต่ำกว่าได้ กำลังผลิตติดตั้งและ
พลังงานไฟฟ้าที่ผลิตได้จากโรงไฟฟ้าชนิดนี้ จะเพิ่มขึ้นเป็นสัดส่วนโดยตรงกับแรงดันและ
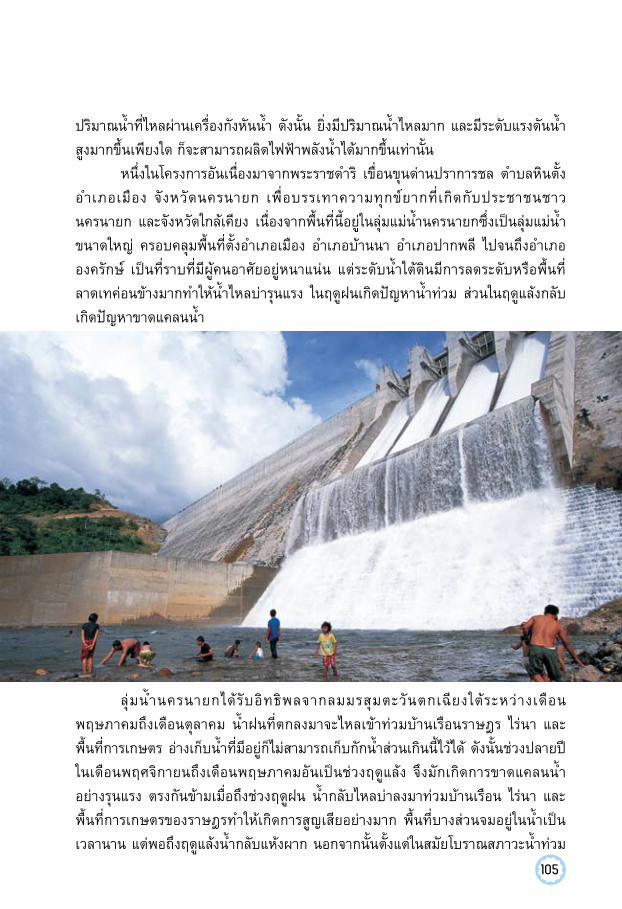
105
ปริมาณน้ำที่ไหลผ่านเครื่องกังหันน้ำ ดังนั้น ยิ่งมีปริมาณน้ำไหลมาก และมีระดับแรงดันน้ำ
สูงมากขึ้นเพียงใด ก็จะสามารถผลิตไฟฟ้าพลังน้ำได้มากขึ้นเท่านั้น
หนึ่งในโครงการอันเนื่องมาจากพระราชดำริ เขื่อนขุนด่านปราการชล ตำบลหินตั้ง
อำเภอเมือง จังหวัดนครนายก เพื่อบรรเทาความทุกข์ยากที่เกิดกับประชาชนชาว
นครนายก และจังหวัดใกล้เคียง เนื่องจากพื้นที่นี้อยู่ในลุ่มแม่น้ำนครนายกซึ่งเป็นลุ่มแม่น้ำ
ขนาดใหญ่ ครอบคลุมพื้นที่ตั้งอำเภอเมือง อำเภอบ้านนา อำเภอปากพลี ไปจนถึงอำเภอ
องครักษ์ เป็นที่ราบที่มีผู้คนอาศัยอยู่หนาแน่น แต่ระดับน้ำใต้ดินมีการลดระดับหรือพื้นที่
ลาดเทค่อนข้างมากทำให้น้ำไหลบ่ารุนแรง ในฤดูฝนเกิดปัญหาน้ำท่วม ส่วนในฤดูแล้งกลับ
เกิดปัญหาขาดแคลนน้ำ
ลุ่มน้ำนครนายกได้รับอิทธิพลจากลมมรสุมตะวันตกเฉียงใต้ระหว่างเดือน
พฤษภาคมถึงเดือนตุลาคม น้ำฝนที่ตกลงมาจะไหลเข้าท่วมบ้านเรือนราษฎร ไร่นา และ
พื้นที่การเกษตร อ่างเก็บน้ำที่มีอยู่ก็ไม่สามารถเก็บกักน้ำส่วนเกินนี้ไว้ได้ ดังนั้นช่วงปลายปี
ในเดือนพฤศจิกายนถึงเดือนพฤษภาคมอันเป็นช่วงฤดูแล้ง จึงมักเกิดการขาดแคลนน้ำ
อย่างรุนแรง ตรงกันข้ามเมื่อถึงช่วงฤดูฝน น้ำกลับไหลบ่าลงมาท่วมบ้านเรือน ไร่นา และ
พื้นที่การเกษตรของราษฎรทำให้เกิดการสูญเสียอย่างมาก พื้นที่บางส่วนจมอยู่ในน้ำเป็น
เวลานาน แต่พอถึงฤดูแล้งน้ำกลับแห้งผาก นอกจากนั้นตั้งแต่ในสมัยโบราณสภาวะน้ำท่วม
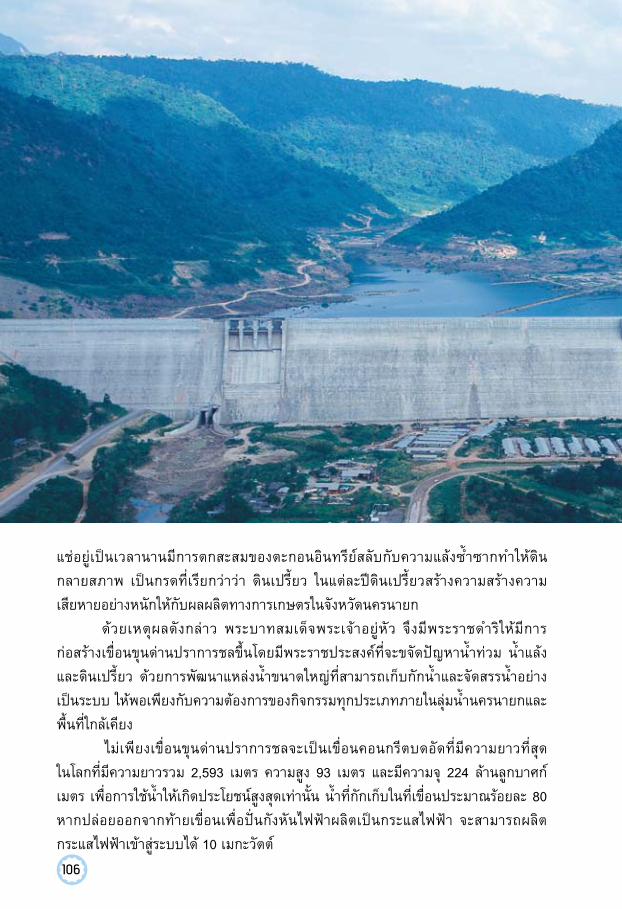
106
แช่อยู่เป็นเวลานานมีการตกสะสมของตะกอนอินทรีย์สลับกับความแล้งซ้ำซากทำให้ดิน
กลายสภาพ เป็นกรดที่เรียกว่าว่า ดินเปรี้ยว ในแต่ละปีดินเปรี้ยวสร้างความสร้างความ
เสียหายอย่างหนักให้กับผลผลิตทางการเกษตรในจังหวัดนครนายก
ด้วยเหตุผลดังกล่าว พระบาทสมเด็จพระเจ้าอยู่หัว จึงมีพระราชดำริให้มีการ
ก่อสร้างเขื่อนขุนด่านปราการชลขึ้นโดยมีพระราชประสงค์ที่จะขจัดปัญหาน้ำท่วม น้ำแล้ง
และดินเปรี้ยว ด้วยการพัฒนาแหล่งน้ำขนาดใหญ่ที่สามารถเก็บกักน้ำและจัดสรรน้ำอย่าง
เป็นระบบ ให้พอเพียงกับความต้องการของกิจกรรมทุกประเภทภายในลุ่มน้ำนครนายกและ
พื้นที่ใกล้เคียง
ไม่เพียงเขื่อนขุนด่านปราการชลจะเป็นเขื่อนคอนกรีตบดอัดที่มีความยาวที่สุด
ในโลกที่มีความยาวรวม 2,593 เมตร ความสูง 93 เมตร และมีความจุ 224 ล้านลูกบาศก์
เมตร เพื่อการใช้น้ำให้เกิดประโยชน์สูงสุดเท่านั้น น้ำที่กักเก็บในที่เขื่อนประมาณร้อยละ 80
หากปล่อยออกจากท้ายเขื่อนเพื่อปั่นกังหันไฟฟ้าผลิตเป็นกระแสไฟฟ้า จะสามารถผลิต
กระแสไฟฟ้าเข้าสู่ระบบได้ 10 เมกะวัตต์
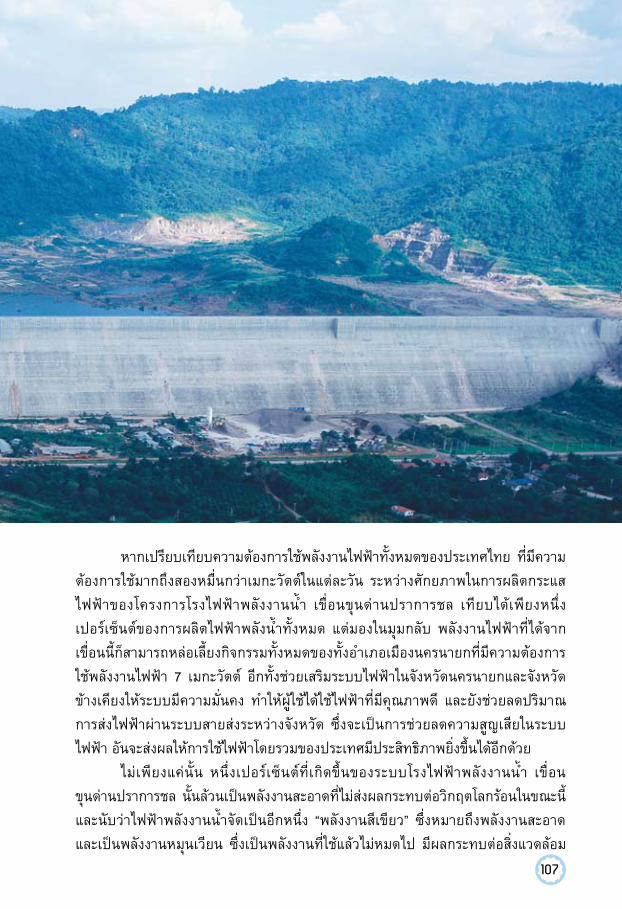
107
หากเปรียบเทียบความต้องการใช้พลังงานไฟฟ้าทั้งหมดของประเทศไทย ที่มีความ
ต้องการใช้มากถึงสองหมื่นกว่าเมกะวัตต์ในแต่ละวัน ระหว่างศักยภาพในการผลิตกระแส
ไฟฟ้าของโครงการโรงไฟฟ้าพลังงานน้ำ เขื่อนขุนด่านปราการชล เทียบได้เพียงหนึ่ง
เปอร์เซ็นต์ของการผลิตไฟฟ้าพลังน้ำทั้งหมด แต่มองในมุมกลับ พลังงานไฟฟ้าที่ได้จาก
เขื่อนนี้ก็สามารถหล่อเลี้ยงกิจกรรมทั้งหมดของทั้งอำเภอเมืองนครนายกที่มีความต้องการ
ใช้พลังงานไฟฟ้า 7 เมกะวัตต์ อีกทั้งช่วยเสริมระบบไฟฟ้าในจังหวัดนครนายกและจังหวัด
ข้างเคียงให้ระบบมีความมั่นคง ทำให้ผู้ใช้ได้ใช้ไฟฟ้าที่มีคุณภาพดี และยังช่วยลดปริมาณ
การส่งไฟฟ้าผ่านระบบสายส่งระหว่างจังหวัด ซึ่งจะเป็นการช่วยลดความสูญเสียในระบบ
ไฟฟ้า อันจะส่งผลให้การใช้ไฟฟ้าโดยรวมของประเทศมีประสิทธิภาพยิ่งขึ้นได้อีกด้วย
ไม่เพียงแค่นั้น หนึ่งเปอร์เซ็นต์ที่เกิดขึ้นของระบบโรงไฟฟ้าพลังงานน้ำ เขื่อน
ขุนด่านปราการชล นั้นล้วนเป็นพลังงานสะอาดที่ไม่ส่งผลกระทบต่อวิกฤตโลกร้อนในขณะนี้
และนับว่าไฟฟ้าพลังงานน้ำจัดเป็นอีกหนึ่ง “พลังงานสีเขียว” ซึ่งหมายถึงพลังงานสะอาด
และเป็นพลังงานหมุนเวียน ซึ่งเป็นพลังงานที่ใช้แล้วไม่หมดไป มีผลกระทบต่อสิ่งแวดล้อม

109
น้อย และไม่สร้างก๊าซเรือนกระจกเพิ่มเติมในชั้นบรรยากาศ และตลอดเวลาที่เราได้พลังงาน
ไฟฟ้าจะเห็นได้ว่าเมื่อลงทุนในอุปกรณ์สำหรับพลังงานเหล่านี้แล้ว เราไม่ต้องเสียเงินซื้อ
เชื้อเพลิงเลย เพราะเป็นสิ่งที่ได้มาฟรีๆ จากธรรมชาติ ซึ่งจะมีการหมุนเวียนเกิดขึ้นใหม่อยู่
ทุกปี โดยมีคุณสมบัติตรงข้ามกับพลังงานที่ใช้แล้วหมดไป คือพลังงานจากเชื้อเพลิงฟอสซิล
ทั้งน้ำมันปิโตรเลียม ถ่านหิน ก๊าซธรรมชาติ ซึ่งทั่วโลกต่างรณรงค์เพื่อพัฒนาโครงการ
พลังงานสีเขียวเพื่อทดแทนการใช้พลังงานเชื้อเพลิงฟอสซิลกัน แม้การลงทุนในโครงการ
เทคโนโลยีเพื่อสิ่งแวดล้อมจะมีมูลค่าโครงการที่สูงมาก แต่หากพิจารณาจากผลที่ได้รับและ
ประโยชน์ต่อสังคมและสิ่งแวดล้อม นับว่าเป็นการลงทุนที่ยั่งยืนทีเดียว
การใช้พลังงานเชื้อเพลิงทั้งน้ำมัน ก๊าซธรรมชาติ และถ่านหิน ย่อมก่อให้เกิดผล
กระทบต่อสิ่งแวดล้อมไม่ทางใดก็ทางหนึ่ง แนวทางที่ดีที่สุด คือ ให้มีการใช้พลังงานอย่าง
ประหยัดและมีประสิทธิภาพ นอกจากนี้ จะต้องมีมาตรการกำกับดูแลการดำเนินการ ให้
เป็นไปตามมาตรฐานทางด้านสิ่งแวดล้อม และการใช้เทคโนโลยีในการควบคุมมลพิษจาก
เชื้อเพลิงให้เข้มงวดมากขึ้น เพื่อให้เกิดผลในทางปฏิบัติอย่างจริงจัง ในขณะเดียวกันก็จะ
ต้องหามาตรการที่เหมาะสม เพื่อลดผลกระทบให้เหลือน้อยที่สุดและอยู่ในระดับที่จะไม่เป็น
อันตรายต่อชุมชนและสภาพแวดล้อม อีกทั้งการพิจารณาเลือกใช้เชื้อเพลิงของประเทศ
จะต้องคำนึงถึงปัจจัยสำคัญๆ คือ การกระจายของแหล่งเชื้อเพลิง ราคาและต้นทุนในการ
ผลิต ความมั่นคงในการจัดหา ผลกระทบที่จะมีต่อสิ่งแวดล้อม และประสิทธิภาพสูงสุด
ในการใช้ทรัพยากรที่มีอยู่อย่างจำกัด
หากพิจารณาด้วยเหตุผลจะพบว่า ในการพัฒนาสิ่งใดก็ตาม ย่อมก่อให้เกิดผล
กระทบหรือการเปลี่ยนแปลง ทั้งในส่วนที่ดีและไม่ดีควบคู่กันไป ซึ่งจะต้องนำทั้งสองส่วน
มาเปรียบเทียบว่า น้ำหนักส่วนใดมากกว่ากัน หากส่วนดีมีมากกว่าก็ควรที่จะส่งเสริมให้มี
การพัฒนาเกิดขึ้น และพยายามหามาตรการในการลดส่วนที่ไม่ดีนั้น ให้มีผลกระทบน้อย
ที่สุด ในการก่อสร้างโรงไฟฟ้าก็เช่นเดียวกัน ย่อมมีทั้งส่วนดีและส่วนไม่ดี แต่เมื่อชั่งน้ำหนัก
แล้วเห็นว่าโครงการพัฒนานั้นจะเป็นประโยชน์ต่อเศรษฐกิจและสังคมโดยรวมก็ควรที่จะ
ส่งเสริมให้มีการดำเนินการต่อไป ในขณะเดียวกันก็จะต้องหามาตรการที่เหมาะสม เพื่อลด
ผลกระทบให้เหลือน้อยที่สุดเช่นกัน
กล่าวได้ว่า เพียงหนึ่งเปอร์เซ็นต์ของไฟฟ้าพลังน้ำที่ได้จากโครงการเขื่อน
ขุนด่านปราการชล อาจเป็นเพียงหนึ่งในร้อยของการพัฒนาโครงการพลังงาน
สีเขียว แต่โครงการดังกล่าวนี้จะเป็นจุดเริ่มต้นของการพัฒนาโครงการที่สามารถ
ทำให้มนุษย์สามารถอยู่ร่วมกับโลกด้วยการพึ่งพาอาศัยกันและกันอย่างยั่งยืน
Hydropower: พลังน้ำกับการผลิตพลังงานไฟฟ้า บทความโดยผู้เชี่ยวชาญ กลุ่มบริษัททีม ปีที่พิมพ์ 2553 กลุ่มบริษัททีม 151 อาคารทีม ถนนนวลจันทร์ แขวงคลองกุ่ม เขตบึงกุ่ม กทม. 10230 โทรศัพท์ 0 2509 9000 โทรสาร 0 2509 9090 www.teamgroup.co.th จัดทำเนื้อหาและควบคุมการผลิตโดย หน่วยธุรกิจน้ำ บริษัท ทีม คอนซัลติ้ง เอนจิเนียริ่ง แอนด์ แมเนจเมนท์ จำกัด ออกแบบและจัดพิมพ์โดย บริษัท ดาวฤกษ์ คอมมูนิเคชั่นส์ จำกัด (หนึ่งในกลุ่มบริษัททีม) โทรศัพท์ 0 2509 9091-2 โทรสาร 0 2944 6260


![Workshop Hydropower and Fish.pptx [Schreibgeschützt] - Workshop Hydropower and Fish... · Workshop Hydropower and Fish Existing hydropower facilities: ... spawning grounds and shelter](https://img.dokumen.tips/doc/110x75/5a8733247f8b9afc5d8da3c5/workshop-hydropower-and-fishpptx-schreibgeschtzt-workshop-hydropower-and-fishworkshop.jpg)