Embed Size (px)
Citation preview
Hydrophobic nanoconfinement suppresses fluctuations in supercooled water
This content has been downloaded from IOPscience. Please scroll down to see the full text.
Download details:
IP Address: 129.64.99.141
This content was downloaded on 30/09/2013 at 00:14
Please note that terms and conditions apply.
2012 J. Phys.: Condens. Matter 24 064111
(http://iopscience.iop.org/0953-8984/24/6/064111)
View the table of contents for this issue, or go to the journal homepage for more
Home Search Collections Journals About Contact us My IOPscience
IOP PUBLISHING JOURNAL OF PHYSICS: CONDENSED MATTER
J. Phys.: Condens. Matter 24 (2012) 064111 (13pp) doi:10.1088/0953-8984/24/6/064111
Hydrophobic nanoconfinement suppressesfluctuations in supercooled water
E G Strekalova1, M G Mazza2, H E Stanley1 and G Franzese3
1 Center for Polymer Studies and Department of Physics, Boston University, Boston, MA 02215, USA2 Stranski-Laboratorium fur Physikalische und Theoretische Chemie, Technische Universitat Berlin,Straße des 17. Juni 135, D-10623 Berlin, Germany3 Departament de Fısica Fonamental, Universitat de Barcelona, Diagonal 645, E-08028 Barcelona, Spain
E-mail: [email protected]
Received 18 May 2011, in final form 13 December 2011Published 25 January 2012Online at stacks.iop.org/JPhysCM/24/064111
AbstractWe perform very efficient Monte Carlo simulations to study the phase diagram of a watermonolayer confined in a fixed disordered matrix of hydrophobic nanoparticles between twohydrophobic plates. We consider different hydrophobic nanoparticle concentrations c. Weadopt a coarse-grained model of water that, for c = 0, displays a first-order liquid–liquid phasetransition (LLPT) line with negative slope in the pressure–temperature (P–T) plane, ending ina liquid–liquid critical point at about 174 K and 0.13 GPa. We show that upon increase of c theliquid–gas spinodal and the temperature of the maximum density line are shifted with respectto the c = 0 case. We also find dramatic changes in the region around the LLPT. In particular,we observe a substantial (more than 90%) decrease of isothermal compressibility, thermalexpansion coefficient and constant-pressure specific heat upon increasing c, consistent withrecent experiments. Moreover, we find that a hydrophobic nanoparticle concentration as smallas c = 2.4% is enough to destroy the LLPT for P ≥ 0.16 GPa. The fluctuations of volumeapparently diverge at P ≈ 0.16 GPa, suggesting that the LLPT line ends in an LL critical pointat 0.16 GPa. Therefore, nanoconfinement reduces the range of P–T where the LLPT isobservable. By increasing the hydrophobic nanoparticle concentration c, the LLPT becomesweaker and its P–T range smaller. The model allows us to explain these phenomena in termsof a proliferation of interfaces among domains with different local order, promoted by thehydrophobic effect of the water–hydrophobic-nanoparticle interfaces.
(Some figures may appear in colour only in the online journal)
1. Introduction
Water is frequently found in nature in its supercooledstate. This fact has stimulated intense experimental andtheoretical research [1–10]. In the deeply supercooled region,however, the direct observation of bulk water is extremelydifficult due to the inevitable crystallization that occurs. Oneway to overcome this experimental difficulty is to confinewater to nanometric distances. Nanoconfined water remainsliquid down to very low temperatures [3], opening thepossibility of exploring the properties of confined water ina temperature range that is inaccessible when the subjectis bulk liquid water. A number of important technologicaland biological applications depend on understanding the
phase diagram of water [4–15]. For example, hydrophobicand hydrophilic interactions are important driving forcesfor the self-assembling of micelles or membranes and arefundamental for protein folding. Water is enclosed in cellmembranes and is a typical solvent for proteins [16]. Thestudy of water confined in carbon nanotubes is openingnew technological perspectives [17], and thus there has beenincreasing interest in studying confined water in variousgeometries, such as nanopores or nanotubes, protein hydrationwater and intracellular water [18–26].
One very peculiar property of supercooled water is thephenomenon of polyamorphism, i.e. the presence of twoor more liquid or glassy states, which was first observedin glassy water [27–29]. There are two different forms of
10953-8984/12/064111+13$33.00 c© 2012 IOP Publishing Ltd Printed in the UK & the USA
J. Phys.: Condens. Matter 24 (2012) 064111 E G Strekalova et al
amorphous glassy water: a low density amorphous form(LDA) and a high density amorphous form (HDA) that areseparated by a first-order phase transition line. Consequently,polyamorphism for liquid water with a low density liquid(LDL) and a high density liquid (HDL) was proposed [30, 31]triggering experimental investigations [32, 33]. A number ofcurrent theories and models predict a first-order liquid–liquidphase transition (LLPT) for bulk water between LDL andHDL below the homogeneous nucleation temperature Tbulk
H ,where bulk water freezes spontaneously [2, 30, 34–45].Recently, Limmer and Chandler performed free energycalculations for the ST2 water model, concluding that thereis no evidence for the LLPT [46]. However, more recentcalculations reach a different conclusion supporting theexistence of the LLPT [47–50].
Recent studies on water in various confined geometries—in which water crystallization is suppressed down to verylow temperatures—have investigated the region in thepressure–temperature (P–T) phase diagram where a first-orderLLPT is predicted. However, no definitive answer hasbeen given regarding the thermodynamic implications ofconfinement and its relevance to the phase diagram ofbulk water. Water differs from most liquids in that thereis an important thermodynamic locus in the P–T phasediagram—the line where, at a given P, the T dependence ofthe density exhibits a maximum, commonly referred to as thetemperature of maximum density (TMD). A shift to lower Tof the TMD line, and its curvature modification, have beenreported for confined water, suggesting important changesin the phase diagram deep in the supercooled region [51,52]. In general, experiments and simulations [53–55] showthat LLPTs in a confined space can differ from those inbulk. Therefore, there are aspects of the thermodynamics ofconfined water that remain open to debate [56, 57].
In computer simulations, one possible approach to thesestudies is to develop atomistic models of water utilizing ageometry such as slits [58–62] or a disordered matrix of discsor spheres [51, 52]. The main difficulty in this approach is thatthese simulations are time-consuming and are usually limitedto only a few hundred water molecules.
Another possible approach is to consider coarse-grainedmodels of water. Coarse graining can be done at differentlevels, i.e. at the level of a single water molecule [34, 63, 64]or a few molecules [65], depending on the properties beingstudied. Here we present results for a water model that iscoarse-grained at the single-molecule level. Molecular detailsare sacrificed for the benefit of computational speed, whichallows more extensive studies, and theoretical simplicity,which allows analytical calculations. Here we ask whether theconfinement in a fixed matrix of hydrophobic nanoparticleschanges the thermodynamics of a water monolayer attemperatures below Tbulk
H .Using Monte Carlo simulations, our results for a
coarse-grained model of a water monolayer [66] show thateven a small presence of hydrophobic nanoparticles candrastically suppress thermodynamic fluctuations and wash outthe coexistence of the two types of liquid supercooled waterat high pressures.
This paper is organized as following. Sections 2–4 outlinedetails of the model and Monte Carlo simulations. Section 5presents the results. Discussion and conclusions are given insection 6.
2. Coarse-grained model of water monolayer
We consider a coarse-grained model for water in twodimensions confined between two smooth hydrophobicplates, whose interaction with water is purely repulsive andrepresented by a steric hard-core exclusion. It has beenpreviously shown that, when the distance between the platesis approximately 0.5 nm, the monolayer of water remains inits liquid phase, while the properties of the confined waterare only weakly dependent on the details of the confiningpotential between smooth walls [67, 68]. We partition a watermonolayer of thickness h ' 0.5 nm and volume V intoN square cells of equal length
√V /N h. We coarse-grain
over the position orthogonal to the walls and consider onlythe projection of water molecules in a plane parallel tothe wall. We further coarse-grain the detailed position ofeach molecule, discretizing it to the resolution given by oursquare partition of the parallel plane, assigning to each cellan occupancy variable ni = 1 if the cell is occupied by awater molecule or ni = 0 if it is occupied by a hydrophobicnanoparticle. We consider the case in which there are noempty cells in the system and hydrophobic nanoparticlescan occupy more than one cell, depending on their size.Hydrophobic nanoparticles are discs of radius R and areapproximated by a set of cells that fall within the πR2
area centered on each hydrophobic nanoparticle (figure 1(a)).Hydrophobic nanoparticles are randomly distributed and forma fixed matrix that mimics a porous system or a rough atomicinterface (figure 1(b)). N ≤ N denotes the total number ofcells occupied by water molecules and V ≤ V denotes theirtotal volume.
In order to implement a constant P ensemble weinclude volume V fluctuations in the model by allowinga global rescaling of the cell length
√V /N h. The
cell length coincides with the distance among nearest-neighbor molecules. Therefore, the volume fluctuationsinduce fluctuations of rij: (i) the distance between any twowater molecules i and j and (ii) the distance between anywater molecule i and any cell j occupied by the nanoparticle.Since a continuous range of possible volume fluctuationsis allowed, the distances change as continuous variables,despite the discrete lattice partition of the space. As aresult, the fluctuations of the cell size and therefore thefluctuations of the volume occupied by a nanoparticle area consequence of the change of the coarse-graining scale.Therefore, it does not imply that the nanoparticle volume isincreasing or decreasing, but that the coarse-graining lengthscale undergoes (small) fluctuations.
The system is described by the Hamiltonian [34–40]
H ≡
∑ij
U(rij)− JNHB − Jσ∑
i
ni
∑(k,`)i
δσik,σi` . (1)
The first term, U(rij) ≡ Uw(rij)+Uh(rij), is given by the sumof the isotropic part of the water–water interaction Uw(rij)
2

J. Phys.: Condens. Matter 24 (2012) 064111 E G Strekalova et al
(a) (b)
Figure 1. (a) Snapshot magnified around the region occupied by the hydrophobic nanoparticle (golden irregular polygon). The size of thehydrophobic nanoparticle is controlled by the number of cells it can occupy, and its shape is approximated by a disc composed of cells thatfall within a radius R. Here the radius of the hydrophobic nanoparticle is R = 1.6 nm. Small cyan spheres are water cells with four bondindices (small squares) with six possible colors, corresponding to the q = 6 possible values of the bonding variables. Only the bond indicesthat participate in the formation of the hydrogen bond are shown here. (b) Snapshot of the monolayer with 2.4% of its volume occupied byhydrophobic nanoparticles (large golden spheres) with R = 1.6 nm. Hydrophobic nanoparticles are randomly placed and form a fixedmatrix. Hydrogen bonds are visualized by different color lines between water cells (small cyan spheres), depending on their relative state.
and the water–nanoparticle interaction Uh(rij). The two pairinteractions are defined as
Uw(r) ≡
∞ for r < r0,
εw
[( r0
r
)12−
( r0
r
)6]
for r ≥ r0,
0 for r > rc
Uh(r) ≡
∞ for r < r0,
εh
[( r0
r
)12]
for r ≥ r0,
0 for r > rc
(2)
where r0 ≡ 2.9 A is the water van der Waals diameter,εw ≡ 5.8 kJ mol−1 is the water–water attraction energy, rc =√
V /h/4 is the cutoff distance. For the water–water casethis term includes the short-range repulsion of the electronclouds and all the isotropic long-range attractive interactions,such as the weak instantaneous induced dipole–dipole(London) interactions between the electron clouds of differentmolecules and the stronger isotropic part of the hydrogenbond [69].
For the water–hydrophobic-nanoparticle case we assumethat the interaction is purely repulsive, with εh ≡ εw
√0.1 =
1.8 kJ mol−1 to soften the repulsive ramp. We observehere that a hydrophobic nanoparticle could also have asmall attractive term in the water–hydrophobic-nanoparticleinteraction, since dispersive van der Waals forces are alwayspresent. However, the repulsive interaction is typically oneorder of magnitude stronger than the attractive term [70].
Our neglect of the attractive water–nanoparticle interactionis, therefore, reasonable at first approximation and has beenadopted by other authors [51].
The second term of equation (1) describes the strongdirectional component of the hydrogen bond (HB) due tothe dipole–dipole interaction between the highly concentratedpositive charge on each H and each of the two excess negativecharges concentrated on the O of another water molecule. Toaccount for the different bonding configurations of each watermolecule, we assign to each cell i four bond variables σij =
1, . . . , q (one for each nearest-neighbor cell j), representingthe orientation of molecule i with respect to molecule j. Acommon assumption is that an HB breaks when OOH > 30
◦
.Therefore, only 1/6 of the orientation range [0◦, 360
◦
] in theOH–O plane is associated with a bonded state. Hence, everymolecule has q4
= 64≡ 1296 possible orientations and by
considering the index σij we account for the entropy lossassociated with the formation of an HB. We say that twomolecules in nearest-neighbor (n.n.) cells form an HB onlyif they are correctly oriented, by definition, δσij,σji ≡ 1 ifσij = σji, δσij,σji ≡ 0 otherwise. The total number of HBs is
NHB ≡∑〈i,j〉
ninjδσij,σji , (3)
where ni ≡ 0 for a nanoparticle and 1 for a water molecule.The notation 〈i, j〉 denotes that the sum is performed over n.n.water molecules i and j, so that each water molecule can formup to four HBs. We consider a bond energy J ≡ 2.9 kJ mol−1,
3
J. Phys.: Condens. Matter 24 (2012) 064111 E G Strekalova et al
as adopted in [38]. Since εw = 2J, the HBs are formed in largenumbers only in the condensed liquid phase.
Hydrophobic nanoparticles are treated as a fixed randomconfining matrix and the bonding variable facing thenanoparticles cannot participate in any hydrogen bond, butcontribute to the entropy of the system and are correlated tothe other three bonding variables of the same water molecule.
Experiments have demonstrated that the formation ofan HB leads to an open, locally tetrahedral, structure thatinduces an increase of volume per molecule within the secondshell [71, 72]. We incorporate this effect by an enthalpyincrease PvHB for each HB, where P is pressure and vHB/v0 =
0.5 is the average volume increase from high density ices VIand VIII to low density ice Ih, and v0 ≡ hr2
0. Then the totalwater volume of the system is defined as
V ≡ V0 + NHBvHB, (4)
where V0 ≥ Nv0 is a continuous variable that changes withpressure in such a way that V follows the water equation ofstate [73]. Note that only the term V0 of the fluctuating volumeis considered for the calculation of distances r appearing inequation (2) for the isotropic interaction U(r), because the HBformation does not imply an increase of molecular distances,but only an increase of the local tetrahedral structure withthe exclusion of interstitial water molecules between the firstand the second shell. This exclusion induces the increase ofvolume per water molecule mimicked by equation (4).
The third term accounts for the experimental fact thatat low T the O–O–O angle distribution in water becomessharper around the tetrahedral value [57], consistent with acooperative behavior among bonds [37] as a consequenceof the many-body interaction of water molecules. We modelthis interaction by including a coupling Jσ ≡ 0.29 kJ mol−1
among the four bonding indices of the same water moleculein the third term of equation (1), where (k, `)i denotes eachof the six different pairs of the four bond indices σij of amolecule i. Since Jσ < J, this term locally drives the HBsformed by a water molecule towards an ordered configuration,mimicking the many-body interaction that induces the locallyordered structure of the HBs.
3. Hydrophobic interaction
Confinement along one dimension inhibits the formation of3D ice at T < Tbulk
H [62] and forces the water moleculesto freeze into a lattice characterized by orientationaldisorder [62]. The characteristics of the lattice are closelyrelated to those of the hydrophobic surface. For example,strong template effects are present for the graphenesurface [74] while the absence of atomic characterization ofthe surface leads to a generic square arrangement [62]. Inany case, the limited space left open to water induces theformation of an almost 2D structure where the translationaldynamics at low T is very limited, while the HB breaking-and-formation dynamics is present also at low T [62].All of these features are reproduced in the coarse-grainedmodel considered here [60]. Moreover, the possibility ofexploring very low temperatures and very high pressures
by means of this coarse-grained water model allows us topredict a phase diagram with a first-order LLPT, betweenan LDL and an HDL, starting at P ' 0.2 GPa for T →0 and ending in a critical point at T ' 174 K and P '0.13 GPa [34–40] (figure 6(a)). Furthermore, in the vicinityof the liquid–liquid critical point, the HB dynamics displaysthe largest heterogeneity, consistent with the presence ofcooperative dynamics [60], and with experiments for a watermonolayer hydrating hemoglobin [75].
In the case considered here, water is also confined byhydrophobic nanoparticles to the two directions parallel to theinfinite flat surfaces. As shown in (2), the water–hydrophobic-nanoparticle interaction is repulsive and leads to interestingphysics at low T . In particular, it has been proposed thatsupercooled water forms highly structured regions in thehydration shell of nonpolar solutes [76], where the hydrogenbond network is weakened only when the size of thehydrophobic nanoparticles is above a characteristic value [77],calculated using free energy analysis to be ≈1 nm [78].Moreover Muller showed that experimental results can beexplained only by assuming enthalpic strengthening of thehydration HBs with a simultaneous entropy increase in thehydration shell [79].
In our model the restructuring effect of hydrophobicnanoparticles on water is incorporated by replacing theparameter J and Jσ in the hydration shell with Jh
= 1.30Jand Jh
σ = 1.30Jσ , following Patel et al [80]. Because bondingindices facing the hydrophobic nanoparticle cannot form HBs,at intermediate T they have a number of accessible stateslarger than those facing water molecules, inducing an increaseof hydration entropy consistent with the description of thehydrophobic effect given by Muller [79] and subsequentlymodified by Lee and Graziano [81].
4. Monte Carlo simulations
We perform Monte Carlo (MC) simulations in two dimensionsfor constant P, T and N. We use the protocol of heatingthe system starting from a completely ordered configuration.We simulate systems with N ≤ 1.6 × 10⁵ within a fixedmatrix of hydrophobic nanoparticles of radius R = 1.6 nm,with hydrophobic nanoparticle concentration c ≡ (N −
N)/N = 2.4% and 25%. We repeat the analysis for R =0.4 nm for a range of concentrations between 0.5% and22.5% for a fixed system size of N = 104. We observethat for the two hydrophobic nanoparticle radii the effect isthe same as long as the amount of hydrophobic interfacein contact with water is the same. Hence, the concentrationc necessary to observe the same effect is larger for thesmaller hydrophobic nanoparticles, the relevant factor beingthe amount of hydrophobic interface. We discuss our resultsin terms of c and R.
In our simulations we update the variables σij using theWolff cluster algorithm [73]. The algorithm is based on anexact mapping of the model studied here to a percolationproblem, following the mapping rules described in [82, 83].The mapping is exact in this case because the system has nofrustration. Bond indices within a water molecule belong to
4
J. Phys.: Condens. Matter 24 (2012) 064111 E G Strekalova et al
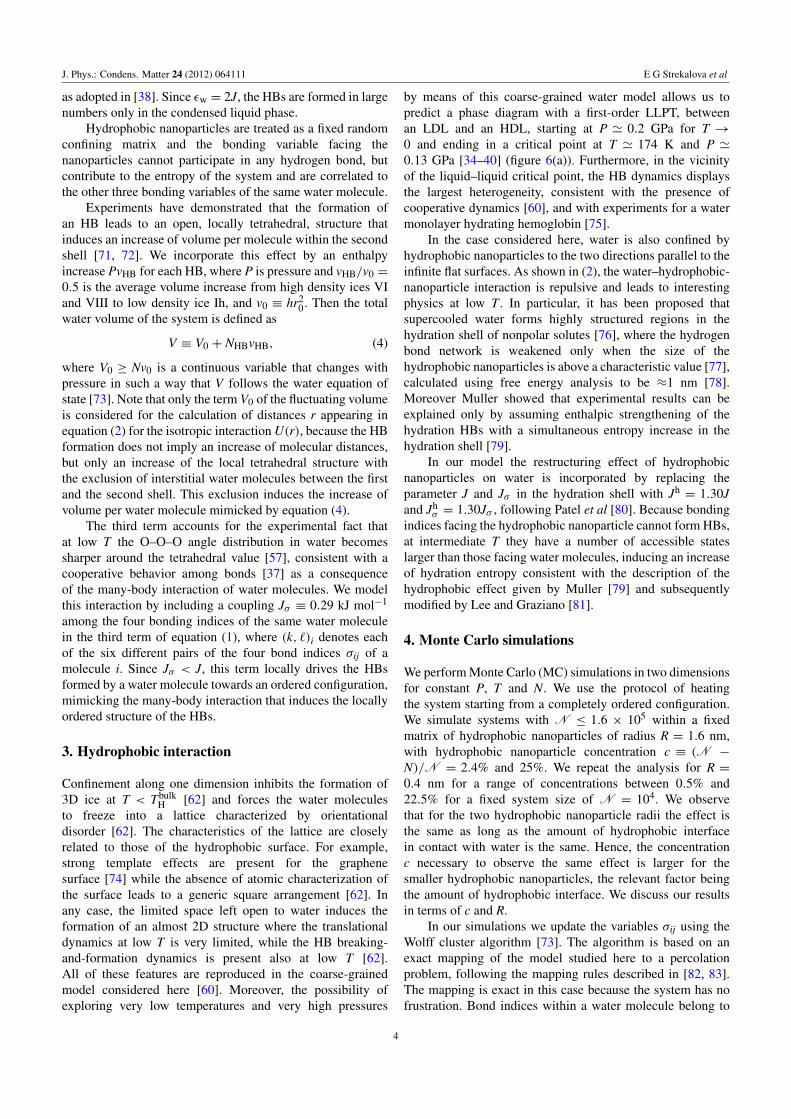
Figure 2. P–T phase diagram for different hydrophobicnanoparticle concentrations c. Open circles mark liquid-to-gasspinodal line, while squares mark TMD line. In this and all otherfigures, where not shown, errors are smaller than the symbol size.Lines are guides for the eyes (dashed for c = 0, dotted for 2.4%, fullfor 25%). The liquid–gas critical point (large full circle) is the same,within the error bar, for c = 0 and 2.4%, while it occurs at lower Pand lower T for c = 25%.
the same cluster with probability psame ≡ 1 − exp[−βJσ ],where β ≡ (kBT)−1 and kB is the Boltzmann constant. Bondindices of nearest-neighbor (n.n.) water molecules belong tothe same cluster with probability pfacing ≡ 1 − exp[−βJ
′
],where J
′
≡ J−PvHB is the HB enthalpy due to the interactionenergy and the HB volume increase. For the interfacial watermolecules, we consider Jh and Jh
σ instead of J and Jσ ,respectively. We study pressures in the interval 0.02 GPa6 P 6 0.2 GPa and we present a detailed scaling analysis forpressures 0.12, 0.14, 0.16 and 0.18 GPa.
5. Results
We first considered how the confinement in a fixedhydrophobic matrix affects the thermodynamics of liquidwater above the melting point. In figure 2 the P–Tphase diagram for different concentrations c of hydrophobicnanoparticles demonstrates a shift to lower T of the liquid–gasspinodal for c > 0. For c = 25% the T change from thec = 0 case is about 55 K at P = 0.02 GPa and about 35 Kat P = 0.14 GPa. The shifts in the TMD for c > 0 withrespect to the c = 0 case is reminiscent of results for othermodels of confined water [51, 62]. We find stronger changesfor increasing c. The changes are not monotonic with pressure.For instance, for c = 25% the TMD exhibits a shift to lowerT of about 35 K at P = 0.02 and 0.14 GPa, whereas atP = 0.19 GPa the TMD increases by about 100 K with respectto the c = 0 case (figure 2).
Relevant properties are associated with the fluctuationsof thermodynamic quantities. For example, the fluctuationsof an order parameter associated with a phase transitionexhibit characteristic behavior when the phase transitionoccurs. Hence, their calculation allows us to locate the
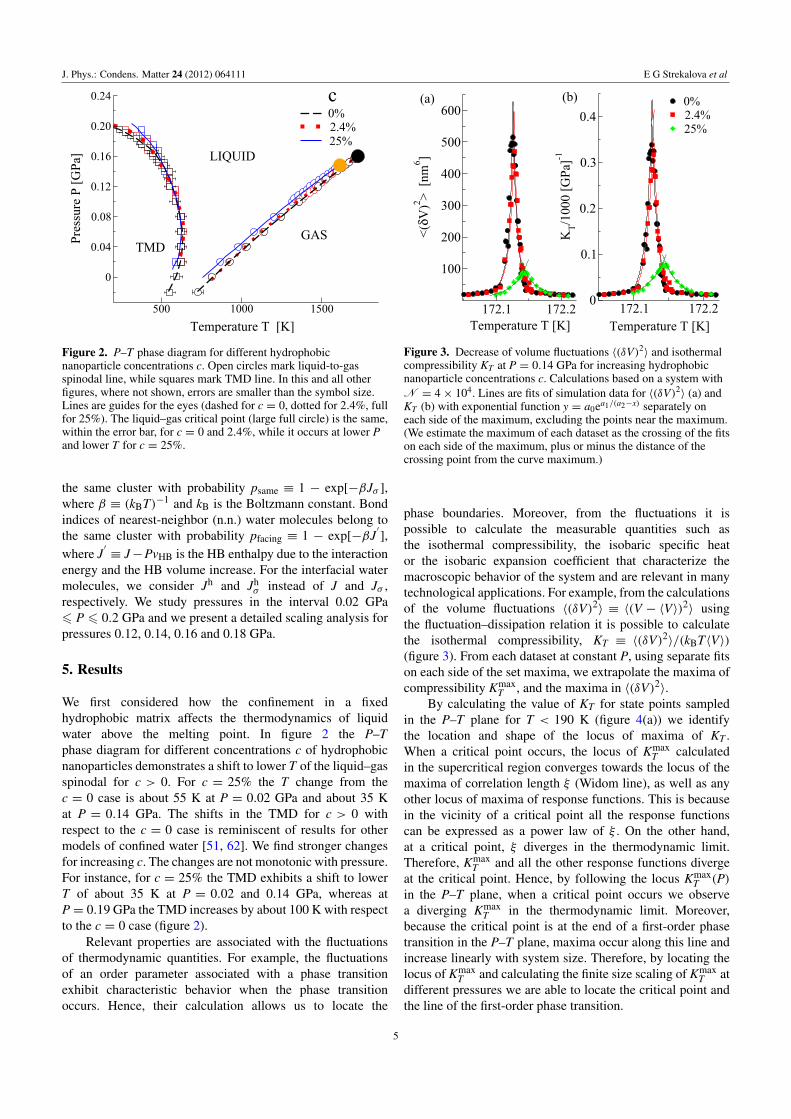
Figure 3. Decrease of volume fluctuations 〈(δV)2〉 and isothermalcompressibility KT at P = 0.14 GPa for increasing hydrophobicnanoparticle concentrations c. Calculations based on a system withN = 4× 10⁴. Lines are fits of simulation data for 〈(δV)2〉 (a) andKT (b) with exponential function y = a0ea1/(a2−x) separately oneach side of the maximum, excluding the points near the maximum.(We estimate the maximum of each dataset as the crossing of the fitson each side of the maximum, plus or minus the distance of thecrossing point from the curve maximum.)
phase boundaries. Moreover, from the fluctuations it ispossible to calculate the measurable quantities such asthe isothermal compressibility, the isobaric specific heator the isobaric expansion coefficient that characterize themacroscopic behavior of the system and are relevant in manytechnological applications. For example, from the calculationsof the volume fluctuations 〈(δV)2〉 ≡ 〈(V − 〈V〉)2〉 usingthe fluctuation–dissipation relation it is possible to calculatethe isothermal compressibility, KT ≡ 〈(δV)2〉/(kBT〈V〉)(figure 3). From each dataset at constant P, using separate fitson each side of the set maxima, we extrapolate the maxima ofcompressibility Kmax
T , and the maxima in 〈(δV)2〉.By calculating the value of KT for state points sampled
in the P–T plane for T < 190 K (figure 4(a)) we identifythe location and shape of the locus of maxima of KT .When a critical point occurs, the locus of Kmax
T calculatedin the supercritical region converges towards the locus of themaxima of correlation length ξ (Widom line), as well as anyother locus of maxima of response functions. This is becausein the vicinity of a critical point all the response functionscan be expressed as a power law of ξ . On the other hand,at a critical point, ξ diverges in the thermodynamic limit.Therefore, Kmax
T and all the other response functions divergeat the critical point. Hence, by following the locus Kmax
T (P)in the P–T plane, when a critical point occurs we observea diverging Kmax
T in the thermodynamic limit. Moreover,because the critical point is at the end of a first-order phasetransition in the P–T plane, maxima occur along this line andincrease linearly with system size. Therefore, by locating thelocus of Kmax
T and calculating the finite size scaling of KmaxT at
different pressures we are able to locate the critical point andthe line of the first-order phase transition.
5
J. Phys.: Condens. Matter 24 (2012) 064111 E G Strekalova et al
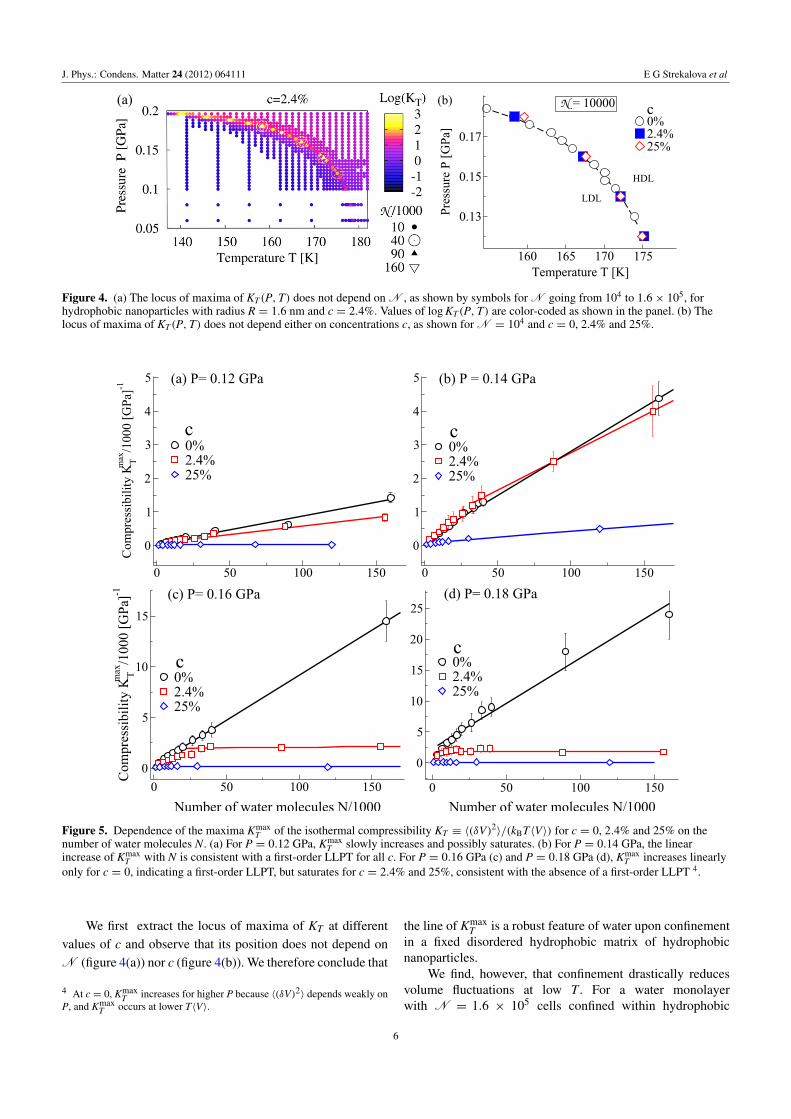
Figure 4. (a) The locus of maxima of KT(P,T) does not depend on N , as shown by symbols for N going from 104 to 1.6× 10⁵, forhydrophobic nanoparticles with radius R = 1.6 nm and c = 2.4%. Values of log KT(P,T) are color-coded as shown in the panel. (b) Thelocus of maxima of KT(P,T) does not depend either on concentrations c, as shown for N = 104 and c = 0, 2.4% and 25%.
Figure 5. Dependence of the maxima KmaxT of the isothermal compressibility KT ≡ 〈(δV)2〉/(kBT〈V〉) for c = 0, 2.4% and 25% on the
number of water molecules N. (a) For P = 0.12 GPa, KmaxT slowly increases and possibly saturates. (b) For P = 0.14 GPa, the linear
increase of KmaxT with N is consistent with a first-order LLPT for all c. For P = 0.16 GPa (c) and P = 0.18 GPa (d), Kmax
T increases linearlyonly for c = 0, indicating a first-order LLPT, but saturates for c = 2.4% and 25%, consistent with the absence of a first-order LLPT 4.
We first extract the locus of maxima of KT at differentvalues of c and observe that its position does not depend onN (figure 4(a)) nor c (figure 4(b)). We therefore conclude that
4 At c = 0, KmaxT increases for higher P because 〈(δV)2〉 depends weakly on
P, and KmaxT occurs at lower T〈V〉.
the line of KmaxT is a robust feature of water upon confinement
in a fixed disordered hydrophobic matrix of hydrophobicnanoparticles.
We find, however, that confinement drastically reducesvolume fluctuations at low T . For a water monolayerwith N = 1.6 × 10⁵ cells confined within hydrophobic
6
J. Phys.: Condens. Matter 24 (2012) 064111 E G Strekalova et al
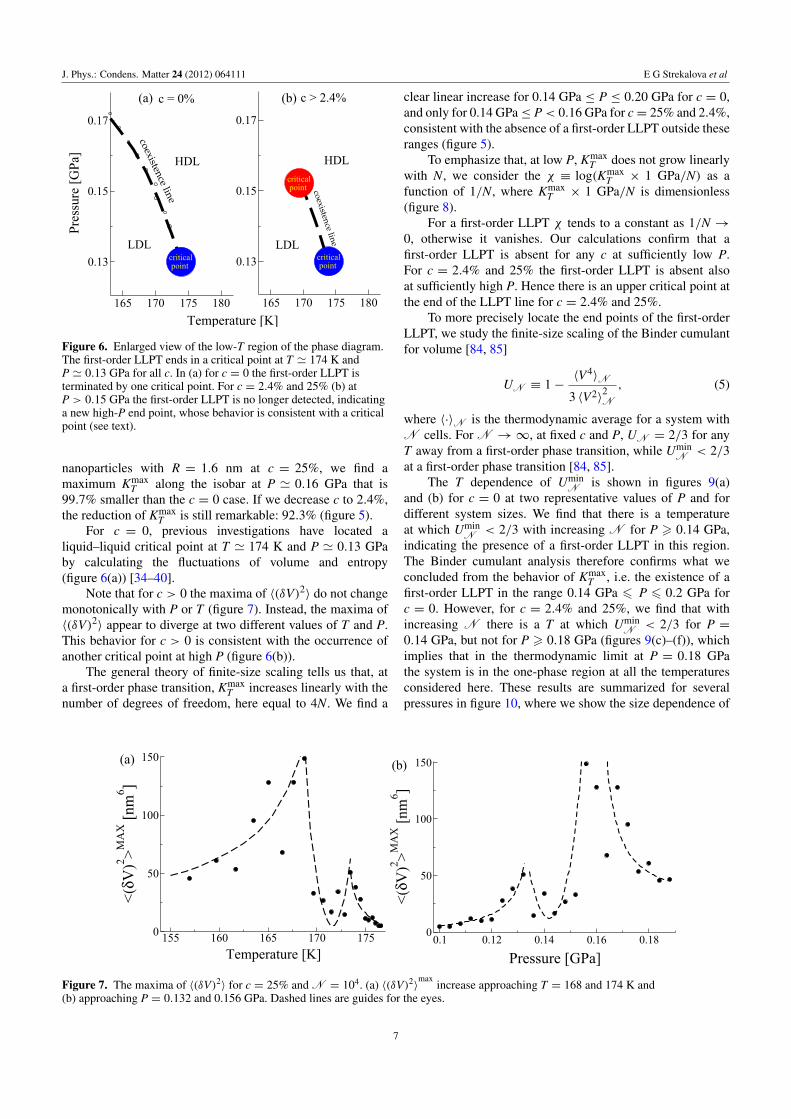
Figure 6. Enlarged view of the low-T region of the phase diagram.The first-order LLPT ends in a critical point at T ' 174 K andP ' 0.13 GPa for all c. In (a) for c = 0 the first-order LLPT isterminated by one critical point. For c = 2.4% and 25% (b) atP > 0.15 GPa the first-order LLPT is no longer detected, indicatinga new high-P end point, whose behavior is consistent with a criticalpoint (see text).
nanoparticles with R = 1.6 nm at c = 25%, we find amaximum Kmax
T along the isobar at P ' 0.16 GPa that is99.7% smaller than the c = 0 case. If we decrease c to 2.4%,the reduction of Kmax
T is still remarkable: 92.3% (figure 5).For c = 0, previous investigations have located a
liquid–liquid critical point at T ' 174 K and P ' 0.13 GPaby calculating the fluctuations of volume and entropy(figure 6(a)) [34–40].
Note that for c > 0 the maxima of 〈(δV)2〉 do not changemonotonically with P or T (figure 7). Instead, the maxima of〈(δV)2〉 appear to diverge at two different values of T and P.This behavior for c > 0 is consistent with the occurrence ofanother critical point at high P (figure 6(b)).
The general theory of finite-size scaling tells us that, ata first-order phase transition, Kmax
T increases linearly with thenumber of degrees of freedom, here equal to 4N. We find a
clear linear increase for 0.14 GPa ≤ P ≤ 0.20 GPa for c = 0,and only for 0.14 GPa ≤ P< 0.16 GPa for c= 25% and 2.4%,consistent with the absence of a first-order LLPT outside theseranges (figure 5).
To emphasize that, at low P, KmaxT does not grow linearly
with N, we consider the χ ≡ log(KmaxT × 1 GPa/N) as a
function of 1/N, where KmaxT × 1 GPa/N is dimensionless
(figure 8).For a first-order LLPT χ tends to a constant as 1/N →
0, otherwise it vanishes. Our calculations confirm that afirst-order LLPT is absent for any c at sufficiently low P.For c = 2.4% and 25% the first-order LLPT is absent alsoat sufficiently high P. Hence there is an upper critical point atthe end of the LLPT line for c = 2.4% and 25%.
To more precisely locate the end points of the first-orderLLPT, we study the finite-size scaling of the Binder cumulantfor volume [84, 85]
UN ≡ 1−〈V4〉N
3 〈V2〉2N
, (5)
where 〈·〉N is the thermodynamic average for a system withN cells. For N →∞, at fixed c and P, UN = 2/3 for anyT away from a first-order phase transition, while Umin
N < 2/3at a first-order phase transition [84, 85].
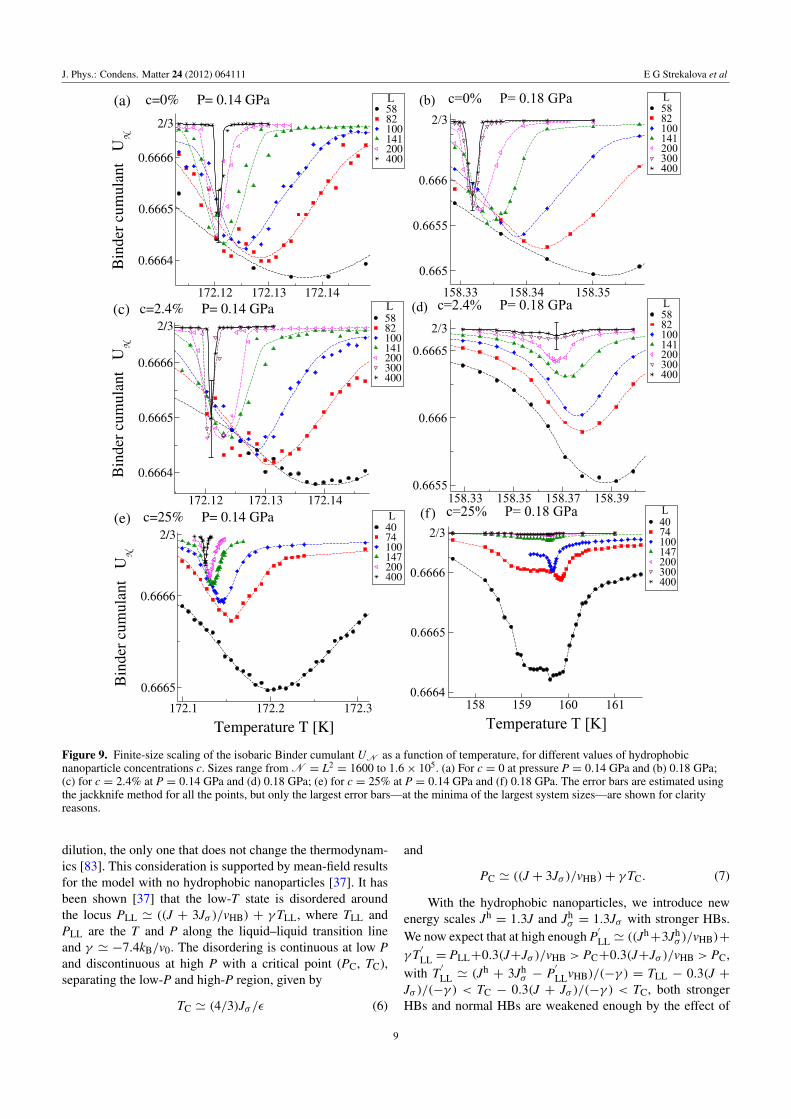
The T dependence of UminN is shown in figures 9(a)
and (b) for c = 0 at two representative values of P and fordifferent system sizes. We find that there is a temperatureat which Umin
N < 2/3 with increasing N for P > 0.14 GPa,indicating the presence of a first-order LLPT in this region.The Binder cumulant analysis therefore confirms what weconcluded from the behavior of Kmax
T , i.e. the existence of afirst-order LLPT in the range 0.14 GPa 6 P 6 0.2 GPa forc = 0. However, for c = 2.4% and 25%, we find that withincreasing N there is a T at which Umin
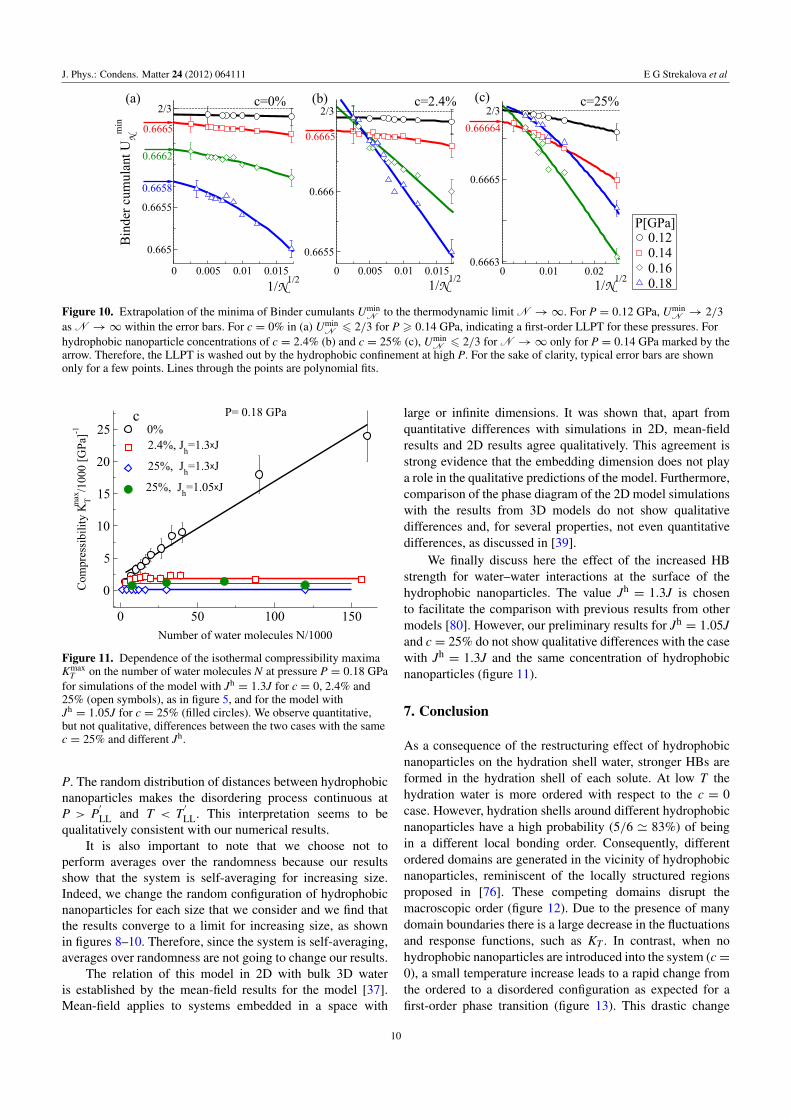
N < 2/3 for P =0.14 GPa, but not for P > 0.18 GPa (figures 9(c)–(f)), whichimplies that in the thermodynamic limit at P = 0.18 GPathe system is in the one-phase region at all the temperaturesconsidered here. These results are summarized for severalpressures in figure 10, where we show the size dependence of
Figure 7. The maxima of 〈(δV)2〉 for c = 25% and N = 104. (a) 〈(δV)2〉max
increase approaching T = 168 and 174 K and(b) approaching P = 0.132 and 0.156 GPa. Dashed lines are guides for the eyes.
7

J. Phys.: Condens. Matter 24 (2012) 064111 E G Strekalova et al
Figure 8. Size dependence of compressibility maxima KmaxT for several pressures and (a) c = 0, (b) c = 2.4% and (c) c = 25%. The
dimensionless quantity χ ≡ Log(KmaxT × 1 GPa/N) has a clear decrease for c = 0 only for very low P, indicating the absence of a first-order
LLPT. At fixed P, by increasing c, the value of KmaxT /N decreases of orders of magnitude. For c = 25% the values of χ are not monotonic
with P, with maxima at P = 0.16 GPa, showing that the upper end point for c = 25% is between P = 0.16 and 0.14 GPa.
the minima of the Binder cumulant at different P for the threeconcentrations studied. For c = 2.4% and 25% we find thatUmin
N tends to a value less than 2/3, consistent with a first-orderLLPT only for P at about 0.14 GPa. Therefore, consistentwith what has already been indicated by the analysis of Kmax
Tand 〈(δV)2〉 (figures 5 and 7) for c = 2.4% and 25%, thefirst-order LLPT occurs only in a limited range of pressuresaround 0.14 GPa, with two end points: one at ≈0.15 GPa andthe other at ≈0.13 GPa (figure 6(b)).
6. Discussion
We adopt density as the relevant order parameter for theliquid–liquid phase transition. In the model the densitydepends on the number of accessible configurations (entropy)and energy of the system via the number of HBs NHB, andtheir specific volume vHB. Therefore, our order parameterincludes by definition contributions coming from entropyand energy, as is, in general, the case for fluid–fluid phasetransitions [86].
It is interesting to compare our results with other casesin which the effect of quenched disorder on phase transitionsin 2D has been considered, including membranes [87–89] orquenched filler particles [90]. In particular, we are interestedin the comparison with the case of random-field (RF)quenched disorder. In the RF case, phase transitions arealways destroyed in two dimensions [91–93]. To clarify whattype of quenched disorder do the hydrophobic nanoparticlesrepresent in the case considered here, we observe thefollowing. For RF quenched disorder two conditions musthold: (i) the RF couples with the order parameter and (ii) theRF destroys the ground state by frustrating it. While in our
model the first condition (i) holds, the second one (ii) doesnot, as we discuss in the following. Hence, our system cannotbe modeled as an RF.
The RF destroys the ground state, because it locallyforces the degrees of freedom to assume states that are notconsistent with the ground state. In other words, the RF forcesthe creation of interfaces. This is not true in our model,where the ground state is not modified by the presence ofthe hydrophobic nanoparticles. By starting from a completelyordered configuration (one of the q ground states), we heatup the sample and observe that the stronger water–waterhydrogen bond (HB) interactions near the hydrophobicnanoparticles make the ground state as stable as the casewithout the hydrophobic nanoparticles, as shown in figure 4,where the locus of the maxima of KT(P,T) does not dependon concentration c.
We understand our results in terms of dilution-quencheddisorder, for which the disorder effects are mild and donot destroy phase transitions in 2D. In particular, byincluding hydrophobic nanoparticles, we delete water–waterinteractions in the region occupied by the hydrophobicnanoparticles and make the water–water interaction strongerfor the first shell of water molecules hydrating thehydrophobic nanoparticles. The procedure reminds us of theone performed in the Kasteleyn–Fortuin dilution that, ascan be analytically demonstrated [82], does not change thethermodynamics of the Ising model or any Potts model. Thuswe believe that our model cannot be described as an RF modeland the results for RF models do not apply to our case.
However, in our case, at high P the phase diagramchanges. We believe that this effect could be a consequence ofthe fact that we do not follow the rules of Kasteleyn–Fortuin
8
J. Phys.: Condens. Matter 24 (2012) 064111 E G Strekalova et al
Figure 9. Finite-size scaling of the isobaric Binder cumulant UN as a function of temperature, for different values of hydrophobicnanoparticle concentrations c. Sizes range from N = L2
= 1600 to 1.6× 10⁵. (a) For c = 0 at pressure P = 0.14 GPa and (b) 0.18 GPa;(c) for c = 2.4% at P = 0.14 GPa and (d) 0.18 GPa; (e) for c = 25% at P = 0.14 GPa and (f) 0.18 GPa. The error bars are estimated usingthe jackknife method for all the points, but only the largest error bars—at the minima of the largest system sizes—are shown for clarityreasons.
dilution, the only one that does not change the thermodynam-ics [83]. This consideration is supported by mean-field resultsfor the model with no hydrophobic nanoparticles [37]. It hasbeen shown [37] that the low-T state is disordered aroundthe locus PLL ' ((J + 3Jσ )/vHB) + γTLL, where TLL andPLL are the T and P along the liquid–liquid transition lineand γ ' −7.4kB/v0. The disordering is continuous at low Pand discontinuous at high P with a critical point (PC, TC),separating the low-P and high-P region, given by
TC ' (4/3)Jσ /ε (6)
and
PC ' ((J + 3Jσ )/vHB)+ γTC. (7)
With the hydrophobic nanoparticles, we introduce newenergy scales Jh
= 1.3J and Jhσ = 1.3Jσ with stronger HBs.
We now expect that at high enough P′
LL ' ((Jh+3Jh
σ )/vHB)+
γT′
LL = PLL+0.3(J+Jσ )/vHB > PC+0.3(J+Jσ )/vHB > PC,with T
′
LL ' (Jh+ 3Jh
σ − P′
LLvHB)/(−γ ) = TLL − 0.3(J +Jσ )/(−γ ) < TC − 0.3(J + Jσ )/(−γ ) < TC, both strongerHBs and normal HBs are weakened enough by the effect of
9
J. Phys.: Condens. Matter 24 (2012) 064111 E G Strekalova et al
Figure 10. Extrapolation of the minima of Binder cumulants UminN to the thermodynamic limit N →∞. For P = 0.12 GPa, Umin
N → 2/3as N →∞ within the error bars. For c = 0% in (a) Umin
N 6 2/3 for P > 0.14 GPa, indicating a first-order LLPT for these pressures. Forhydrophobic nanoparticle concentrations of c = 2.4% (b) and c = 25% (c), Umin
N 6 2/3 for N →∞ only for P = 0.14 GPa marked by thearrow. Therefore, the LLPT is washed out by the hydrophobic confinement at high P. For the sake of clarity, typical error bars are shownonly for a few points. Lines through the points are polynomial fits.
Figure 11. Dependence of the isothermal compressibility maximaKmax
T on the number of water molecules N at pressure P = 0.18 GPafor simulations of the model with Jh
= 1.3J for c = 0, 2.4% and25% (open symbols), as in figure 5, and for the model withJh= 1.05J for c = 25% (filled circles). We observe quantitative,
but not qualitative, differences between the two cases with the samec = 25% and different Jh.
P. The random distribution of distances between hydrophobicnanoparticles makes the disordering process continuous atP > P
′
LL and T < T′
LL. This interpretation seems to bequalitatively consistent with our numerical results.
It is also important to note that we choose not toperform averages over the randomness because our resultsshow that the system is self-averaging for increasing size.Indeed, we change the random configuration of hydrophobicnanoparticles for each size that we consider and we find thatthe results converge to a limit for increasing size, as shownin figures 8–10. Therefore, since the system is self-averaging,averages over randomness are not going to change our results.
The relation of this model in 2D with bulk 3D wateris established by the mean-field results for the model [37].Mean-field applies to systems embedded in a space with
large or infinite dimensions. It was shown that, apart fromquantitative differences with simulations in 2D, mean-fieldresults and 2D results agree qualitatively. This agreement isstrong evidence that the embedding dimension does not playa role in the qualitative predictions of the model. Furthermore,comparison of the phase diagram of the 2D model simulationswith the results from 3D models do not show qualitativedifferences and, for several properties, not even quantitativedifferences, as discussed in [39].
We finally discuss here the effect of the increased HBstrength for water–water interactions at the surface of thehydrophobic nanoparticles. The value Jh
= 1.3J is chosento facilitate the comparison with previous results from othermodels [80]. However, our preliminary results for Jh
= 1.05Jand c = 25% do not show qualitative differences with the casewith Jh
= 1.3J and the same concentration of hydrophobicnanoparticles (figure 11).
7. Conclusion
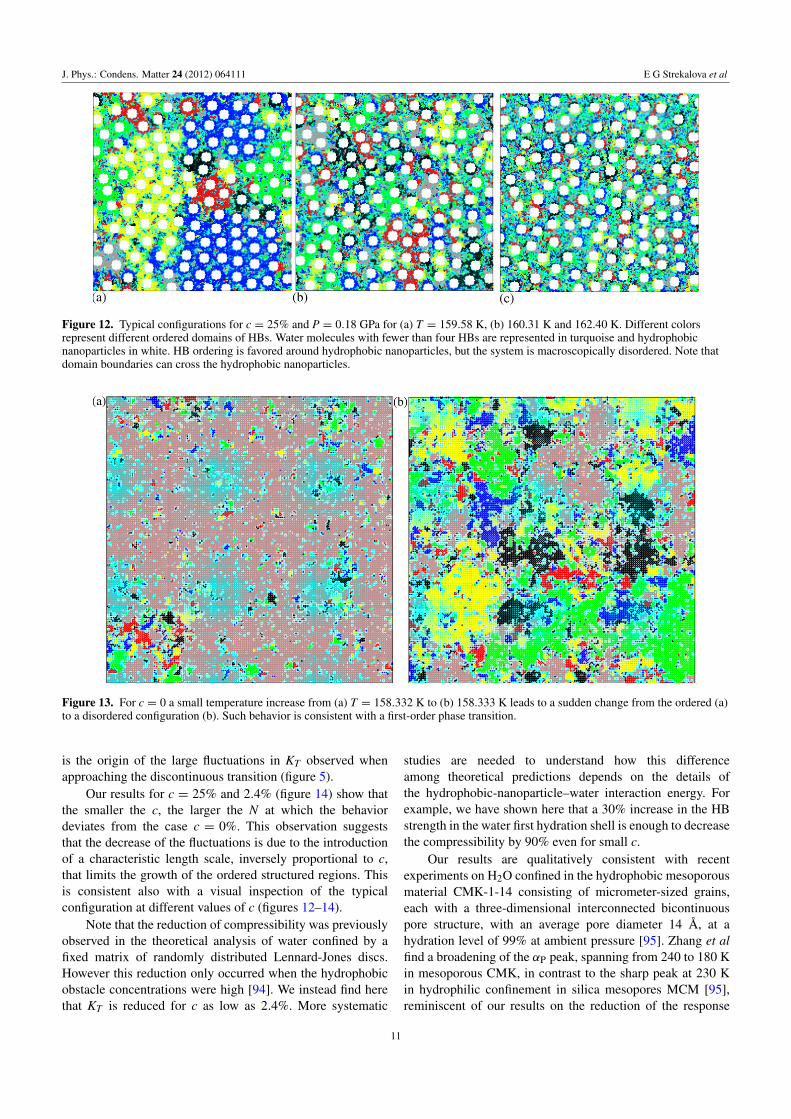
As a consequence of the restructuring effect of hydrophobicnanoparticles on the hydration shell water, stronger HBs areformed in the hydration shell of each solute. At low T thehydration water is more ordered with respect to the c = 0case. However, hydration shells around different hydrophobicnanoparticles have a high probability (5/6 ' 83%) of beingin a different local bonding order. Consequently, differentordered domains are generated in the vicinity of hydrophobicnanoparticles, reminiscent of the locally structured regionsproposed in [76]. These competing domains disrupt themacroscopic order (figure 12). Due to the presence of manydomain boundaries there is a large decrease in the fluctuationsand response functions, such as KT . In contrast, when nohydrophobic nanoparticles are introduced into the system (c=0), a small temperature increase leads to a rapid change fromthe ordered to a disordered configuration as expected for afirst-order phase transition (figure 13). This drastic change
10
J. Phys.: Condens. Matter 24 (2012) 064111 E G Strekalova et al
Figure 12. Typical configurations for c = 25% and P = 0.18 GPa for (a) T = 159.58 K, (b) 160.31 K and 162.40 K. Different colorsrepresent different ordered domains of HBs. Water molecules with fewer than four HBs are represented in turquoise and hydrophobicnanoparticles in white. HB ordering is favored around hydrophobic nanoparticles, but the system is macroscopically disordered. Note thatdomain boundaries can cross the hydrophobic nanoparticles.
Figure 13. For c = 0 a small temperature increase from (a) T = 158.332 K to (b) 158.333 K leads to a sudden change from the ordered (a)to a disordered configuration (b). Such behavior is consistent with a first-order phase transition.
is the origin of the large fluctuations in KT observed whenapproaching the discontinuous transition (figure 5).
Our results for c = 25% and 2.4% (figure 14) show thatthe smaller the c, the larger the N at which the behaviordeviates from the case c = 0%. This observation suggeststhat the decrease of the fluctuations is due to the introductionof a characteristic length scale, inversely proportional to c,that limits the growth of the ordered structured regions. Thisis consistent also with a visual inspection of the typicalconfiguration at different values of c (figures 12–14).
Note that the reduction of compressibility was previouslyobserved in the theoretical analysis of water confined by afixed matrix of randomly distributed Lennard-Jones discs.However this reduction only occurred when the hydrophobicobstacle concentrations were high [94]. We instead find herethat KT is reduced for c as low as 2.4%. More systematic
studies are needed to understand how this differenceamong theoretical predictions depends on the details ofthe hydrophobic-nanoparticle–water interaction energy. Forexample, we have shown here that a 30% increase in the HBstrength in the water first hydration shell is enough to decreasethe compressibility by 90% even for small c.
Our results are qualitatively consistent with recentexperiments on H2O confined in the hydrophobic mesoporousmaterial CMK-1-14 consisting of micrometer-sized grains,each with a three-dimensional interconnected bicontinuouspore structure, with an average pore diameter 14 A, at ahydration level of 99% at ambient pressure [95]. Zhang et alfind a broadening of the αP peak, spanning from 240 to 180 Kin mesoporous CMK, in contrast to the sharp peak at 230 Kin hydrophilic confinement in silica mesopores MCM [95],reminiscent of our results on the reduction of the response
11

J. Phys.: Condens. Matter 24 (2012) 064111 E G Strekalova et al
Figure 14. Configuration for c = 2.4% for T = 158.36 K. Thehydrophobic nanoparticles contribute to the continuous growth ofthe ordered domains, where the largest ordered domain is visualizedin red.
functions with respect to the c = 0 case. In addition, Zhanget al demonstrate the TMD downshift by 17 K in hydrophobicCMK with respect to the hydrophilic MCM, which is similarto our observed temperature downshift of TMD for lowpressures.
Recent results for small-angle x-ray scattering foraqueous solutions of amphiphilic tetraalkyl-ammonium atambient conditions suggest that the strengthening of thestructure of hydration water is present only for solutes withradius smaller than ≈0.44 nm [96]. We therefore repeatour analysis for small hydrophobic nanoparticles with R =0.4 nm and find that our results are robust if the amount ofhydrophobic interface in contact with water is kept constantwith respect to the case of R = 1.6 nm. We conclude that theobserved thermodynamic shifts and reductions of the responsefunctions are due to the water–hydrophobic-nanoparticleinteractions. In particular, they are directly related to thestrength of the HBs in the hydration shell. As a consequence,by keeping a constant amount of water molecules in directcontact with the hydrophobic nanoparticles, we reproduceconsistent shifts in spinodal, TMD and high-P, and thedisappearance of the LLPT for both R = 1.6 and 0.4 nmhydrophobic nanoparticles.
It was previously shown for c= 0 that the dynamics of theWolff cluster algorithm are very efficient and allow the systemto fully equilibrate even in a low temperature region [73].The dynamics of the c > 0 systems are still under detailedinvestigation. However, our preliminary results demonstratethat introducing a hydrophobic confinement with restructuringeffect does not slow down the equilibration process. At thepresent time more detailed study of the correlation times isneeded.
In conclusion, we predict that a water monolayerconfined in a hydrophobic fixed matrix of hydrophobicnanoparticles at concentration c displays significant changesin the thermodynamics and important reductions in theresponse functions with respect to the c = 0 case. Moreover,at c as small as 2.4% a first-order LLPT at highP is no longer detected. As a consequence, even asmall number of hydrophobic nanoparticles can make thedetection of the LLPT difficult. These findings may haveimportant applications in fields related to conservation atcryogenic temperatures (around−100 ◦C), for example, in thepreservation of stem cells, blood or food products.
Acknowledgments
We thank S V Buldyrev, P Ch Ivanov and K Stokelyfor useful discussions and NSF grants CHE0908218 andCHE0911389, and MICINN grant FIS2009-10210 (FEDER)and the European Union FP7 grant NMP4-SL-2011-266737for support.
References
[1] Mallamace F, Branca C, Corsaro C, Leone N, Spooren J,Chen S-H and Stanley H E 2010 Proc. Natl Acad. Sci.107 22457
[2] Franzese G, Hernando-Martinez A, Kumar P, Mazza M G,Stokely K, Strekalova E G, de los Santos F andStanley H E 2010 J. Phys.: Condens. Matter 22 284103
[3] Chen S-H and Loong C-K 2006 Nucl. Eng. Technol. 38 201[4] Bellissent-Funel M-C, Chen S H and Zanotti J-M 1995 Phys.
Rev. E 51 4558[5] Swenson J, Jansson H and Bergman R 2006 Phys. Rev. Lett.
96 247802[6] Mallamace F, Broccio M, Corsaro C, Faraone A,
Wanderlingh U, Liu L, Mou C-Y and Chen S H 2006J. Chem. Phys. 124 161102
[7] Chen S-H, Mallamace F, Mou C-Y, Broccio M, Corsaro C andFaraone A 2006 Proc. Natl Acad. Sci. USA 103 12974
[8] Liu D, Zhang Y, Chen C-C, Mou C-Y, Poole P-H andChen S-H 2007 Proc. Natl Acad. Sci. USA 104 9570
[9] Findenegg G H, Jahnert S, Akcakayiran D and Schreiber A2008 ChemPhysChem 9 2651
[10] Angell C A 2008 Science 319 582[11] Mancinelli R, Bruni F and Ricci M A 2010 J. Phys. Chem.
Lett. 1 1277[12] Lervik A, Bresme F, Kjelstrup S, Bedeaux D and Rubi J M
2010 Phys. Chem. Chem. Phys. 12 1610[13] Lervik A, Bresme F and Kjelstrup S 2009 Soft Matter 5 2407[14] Bresme F, Chacon E, Tarazona P and Tay K 2008 Phys. Rev.
Lett. 101 056102[15] Bresme F, Chacon E and Tarazona P 2008 Phys. Chem. Chem.
Phys. 10 4704[16] Ball P 2008 Chem. Rev. 108 74[17] Granick S and Bae S C 2008 Science 322 1477[18] Liu D, Zhang Y, Liu Y, Wu J, Chen C-C, Mou C-Y and
Chen S-H 2008 J. Phys. Chem. B 112 4309[19] Mallamace F, Broccio M, Corsaro C, Faraone A, Liu L,
Mou C-Y and Chen S-H 2006 J. Phys.: Condens. Matter18 S2285
[20] Mallamace F, Broccio M, Corsaro C, Faraone A, Majolino D,Venuti V, Liu L, Mou C-Y and Chen S-H 2007 Proc. NatlAcad. Sci. USA 104 424
[21] Han S, Kumar P and Stanley H E 2008 Phys. Rev. E77 030201(R)
12
J. Phys.: Condens. Matter 24 (2012) 064111 E G Strekalova et al
[22] Giovambattista N, Rossky P J and Debenedetti P 2006 Phys.Rev. E 73 041604
[23] Giovambattista N, Debenedetti P and Rossky P J 2007 J. Phys.Chem. B 111 9581
[24] Majumder M, Chopra N, Andrews R and Hinds B J 2005Nature 438 44
[25] Joseph S and Aluru N R 2008 Phys. Rev. Lett. 101 064502[26] Gallo P, Rovere M and Chen S-H 2010 J. Phys. Chem. Lett.
1 729[27] Mishima O, Calvert L D and Whalley E 1984 Nature 310 393[28] Mishima O, Calvert L D and Whalley E 1985 Nature 314 76[29] Mishima O and Stanley H E 1998 Nature 396 329[30] Poole P H, Sciortino F, Essmann U and Stanley H E 1992
Nature 360 324[31] Poole P H, Essmann U, Sciortino F and Stanley H E 1993
Phys. Rev. E 48 4605Harrington S, Poole P H, Sciortino F and Stanley H E 1997
J. Chem. Phys. 107 7443[32] Mishima O and Stanley H E 1998 Nature 392 164[33] Mishima O 2010 J. Chem. Phys. 133 144503[34] Franzese G and Stanley H E 2002 J. Phys.: Condens. Matter
14 2201Franzese G and Stanley H E 2007 J. Phys.: Condens. Matter
19 205126[35] Franzese G, Marques M I and Stanley H E 2003 Phys. Rev. E
67 011103[36] Kumar P, Franzese G and Stanley H E 2008 Phys. Rev. Lett.
100 105701[37] Stokely K, Mazza M G, Stanley H E and Franzese G 2010
Proc. Natl Acad. Sci. USA 107 1301[38] Mazza M G, Stokely K, Pagnotta S E, Bruni F,
Stanley H E and Franzese G 2011 Proc. Natl Acad. Sci.USA 108 19873
Kumar P, Yan Z, Xu L, Mazza M G, Buldyrev S V, Chen S H,Sastry S and Stanley H E 2006 Phys. Rev. Lett. 97 177802
Sciortino F, Poole P, Stanley H E and Havlin S 1990 Phys.Rev. Lett. 64 1686–9
[39] de los Santos F and Franzese G 2011 J. Phys. Chem. B115 14311
[40] Franzese G, Stokely K, Chu X-Q, Kumar P, Mazza M G,Chen S-H and Stanley H E 2008 J. Phys.: Condens. Matter20 494210
[41] Paschek D 2004 J. Chem. Phys. 120 10605[42] Poole P H, Saika-Voivod I and Sciortino F 2005 J. Phys.:
Condens. Matter 17 L431[43] Liu Y, Panagiotopoulos A Z and Debenedetti P G 2009
J. Chem. Phys. 131 104508[44] Abascal J L F and Vega C 2005 J. Chem. Phys. 123 234505[45] Xu L, Kumar P, Buldyrev S V, Chen S-H, Poole P H,
Sciortino F and Stanley H E 2005 Proc. Natl Acad. Sci.USA 102 16558
[46] Limmer D T and Chandler D 2011 J. Chem. Phys. 135 134503[47] Poole P H, Becker S R, Sciortino F and Starr F W 2011
J. Phys. Chem. B 115 14176[48] Sciortino F, Saika-Voivod I and Poole P 2011 Phys. Chem.
Chem. Phys. 13 19759[49] Kesselring T A, Franzese G, Buldyrev S V, Herrmann H J and
Stanley H E 2011 Nanoscale dynamics of phase flipping inwater near its hypothesized liquid–liquid critical pointarXiv:1112.2186
[50] Debenedetti P G 2011 private communication[51] Gallo P and Rovere M 2007 Phys. Rev. E 76 061202[52] Corradini D, Gallo P and Rovere M 2008 J. Chem. Phys.
128 244508[53] Kurita R and Tanaka H 2007 Phys. Rev. Lett. 98 235701[54] De Sanctis Lucentini P G and Pellicane G 2008 Phys. Rev.
Lett. 101 246101
[55] Fisher M E and Nakanishi H 1981 J. Chem. Phys. 75 5857[56] Soper A K 2008 Mol. Phys. 106 2053[57] Ricci M A, Bruni F and Giuliani A 2009 Faraday Discuss.
141 347[58] Koga K, Tanaka H and Zeng X C 2000 Nature 408 564[59] Giovambattista N, Lopez C F, Rossky P J and
Debenedetti P G 2008 Proc. Natl Acad. Sci. USA 105 2274[60] Franzese G and de los Santos F 2009 J. Phys.: Condens.
Matter 21 504107[61] Truskett T M and Debenedetti P G 2001 J. Chem. Phys.
114 2401[62] Kumar P, Buldyrev S V, Starr F W, Giovambattista N and
Stanley H E 2005 Phys. Rev. E 72 051503Starr F W, Nielsen J K and Stanley H E 1999 Phys. Rev. Lett.
82 2294[63] Sastry S, Debenedetti P, Sciortino F and Stanley H E 1996
Phys. Rev. E 53 6144Stanley H E 1979 J. Phys. A: Math Gen. 12 L329
[64] Franzese G and Stanley H E 2002 Physica A 314 508[65] Yesylevskyy S O, Schafer L V, Sengupta D and
Marrink S J 2010 PLoS Comput. Biol. 6 e1000810[66] Strekalova E G, Mazza M G, Stanley H E and
Franzese G 2011 Phys. Rev Lett. 106 145701[67] Kumar P, Starr F W, Buldyrev S V and Stanley H E 2007
Phys. Rev. E 75 011202[68] Zangi R and Mark A E 2003 Phys. Rev. Lett. 91 025502[69] Pendas A M, Blanco M A and Francisco E 2006 J. Chem.
Phys. 125 184112[70] Israelachvili J and Pashley R 1982 Nature 300 341[71] Debenedetti P G 2003 J. Phys.: Condens. Matter 15 R1669[72] Soper A K and Ricci M A 2000 Phys. Rev. Lett. 84 2881[73] Mazza M G, Stokely K, Strekalova E G, Stanley H E and
Franzese G 2009 Comput. Phys. Commun. 180 497[74] Cicero G, Grossman J C, Schwegler E, Gygi F and Galli G
2008 J. Am. Chem. Soc. 130 1871[75] Doster W and Gutberlet T 2010 Biochim. Biophys. Acta 1804 3[76] Frank H S and Evans M W 1945 J. Chem. Phys. 13 507[77] Stillinger F H 1973 J. Solut. Chem. 2 141[78] Chandler D 2005 Nature 437 640[79] Muller N 1990 Acc. Chem. Res. 23 23[80] Patel B A, Debenedetti P G, Stillinger F H and Rossky P J
2007 Biophys. J. 93 4116[81] Lee B and Graziano G 1996 J. Am. Chem. Soc. 118 5163[82] Coniglio A and Peruggi F 1982 J. Phys. A: Math Gen. 15 1873[83] Cataudella V, Franzese G, Nicodemi M, Scala A and
Coniglio A 1996 Phys. Rev. E 54 175[84] Binder K 1981 Phys. Rev. Lett. 47 693[85] Vollmayr K, Reger J D, Scheucher M and Binder K 1993
Z. Phys. B 91 113[86] Bertrand C E and Anisimov M A 2011 J. Phys. Chem. B
115 14099[87] Machta B B, Papanikolaou S, Sethna J P and Veatch S L 2011
Biophys. J. 100 1668[88] Ehrig J, Petrov E P and Schwille P 2011 New J. Phys.
13 045019[89] Fischer T and Vink R L C 2011 J. Chem. Phys. 134 055106[90] Laradji M and MacNevin G 2003 J. Chem. Phys. 119 2275[91] Imry Y and Ma S K 1975 Phys. Rev. Lett. 35 1399[92] Imry Y and Wortis M 1979 Phys. Rev. B 19 3580[93] Aizenman M and Wehr J 1989 Phys. Rev. Lett. 62 2503s[94] Urbic T, Vlachy V, Pizio O and Dill K A 2004 J. Mol. Liq.
112 71[95] Zhang Y, Liu K-H, Lagi M, Liu D, Littrell K C, Mou C-Y and
Chen S-H 2009 J. Phys. Chem. B 113 5007Franzese G and Coniglio A 1998 Phys. Rev. E 58 2753
[96] Huang N, Nordlung D, Huang C, Tyliszczak T, Weiss T M,Acremann Y, Pettersson L G M and Nilsson A 2012J. Chem. Phys. submitted
13