Embed Size (px)
Citation preview

Nueces Estuary Hydrology, Hydrodynamics & Salinity
Texas Water Development Board
Bays & Estuaries Program
Carla G. Guthrie, Ph.D.
June 24, 2011
Corpus Christi Bay
Nueces Bay
Oso Bay
Nueces River
Oso Creek
Gulf of Mexico
Aransas Bay
Laguna Madre
Entrance Channel
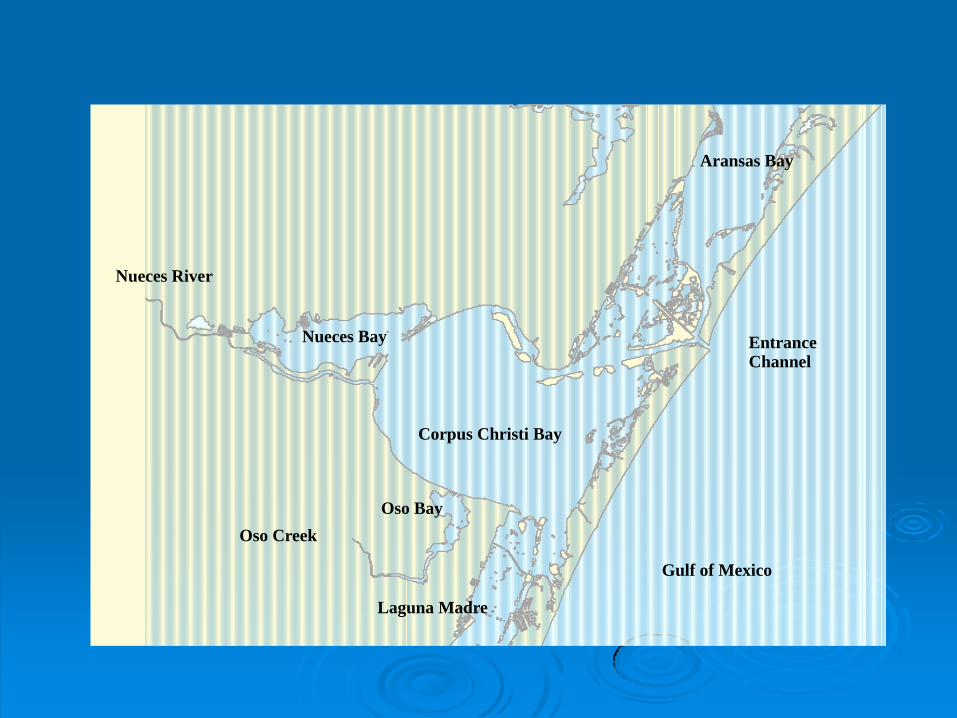
Gaged
+ Modeled
+ Return
- Diversion
= Surface Inflow
Coastal Hydrology
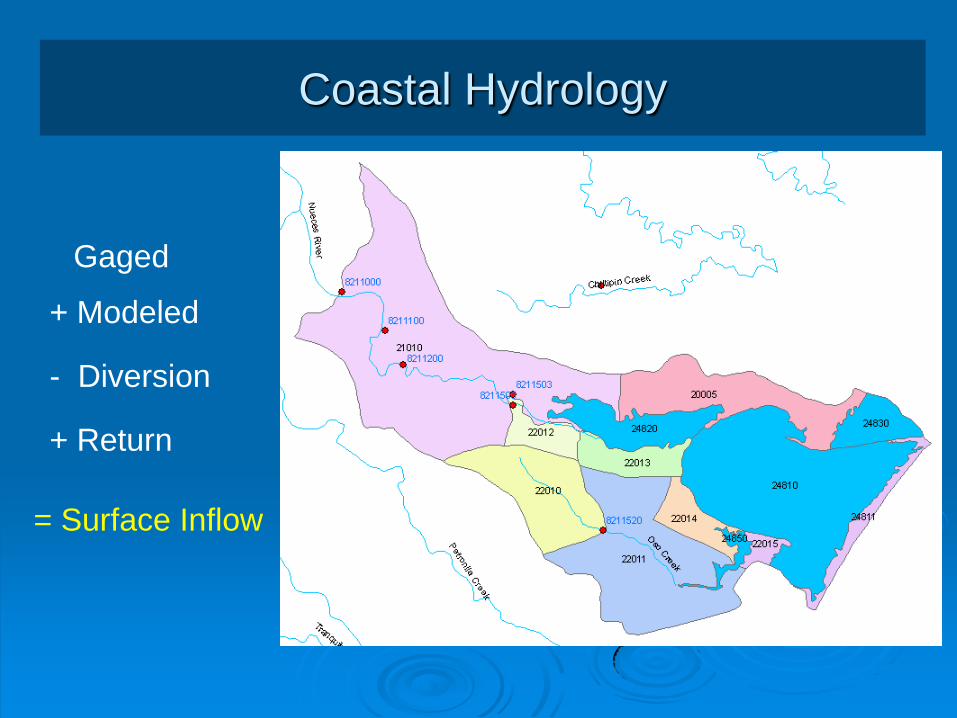
Version Date
Range
Gaged
Flows
Ungaged
Flows Diversions Returns
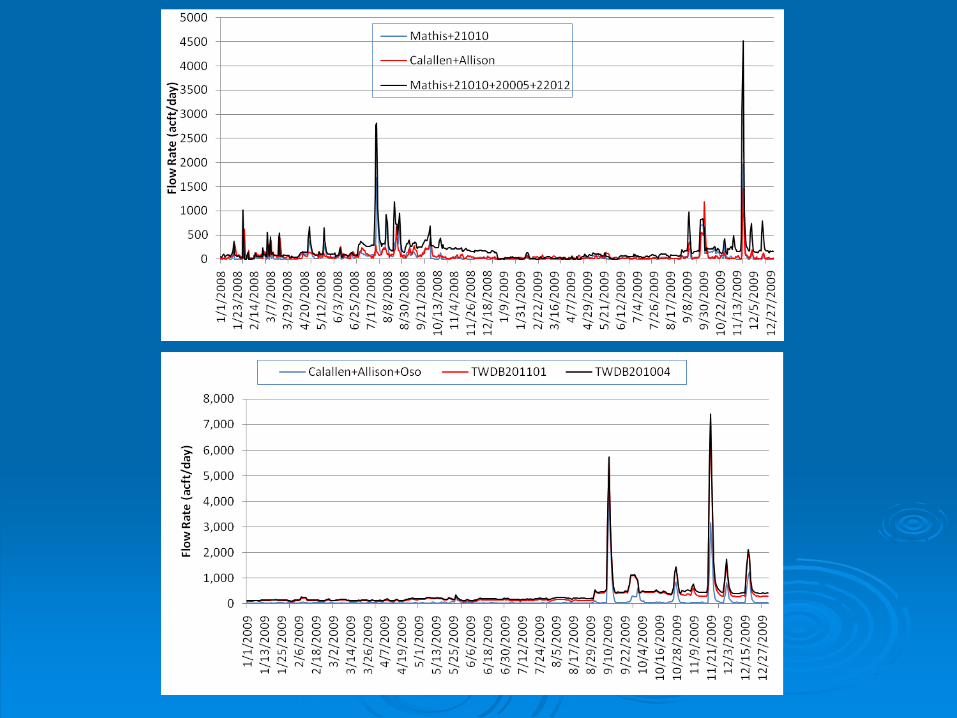
TWDB201004 1941-2009 1941-2009 1941-2009
1941-2009
*Missing data for
11/2005 – 12/2006
1941-2009
TWDB201101 1941-2009 1941-2009 1941-2009
1941-2009
*addtl’ NRA/HDR
2000-2009
1941-2009
*addtl’ NRA/HDR
2000-2009
Appendix A, Page 17 – Nueces Hydrology Report
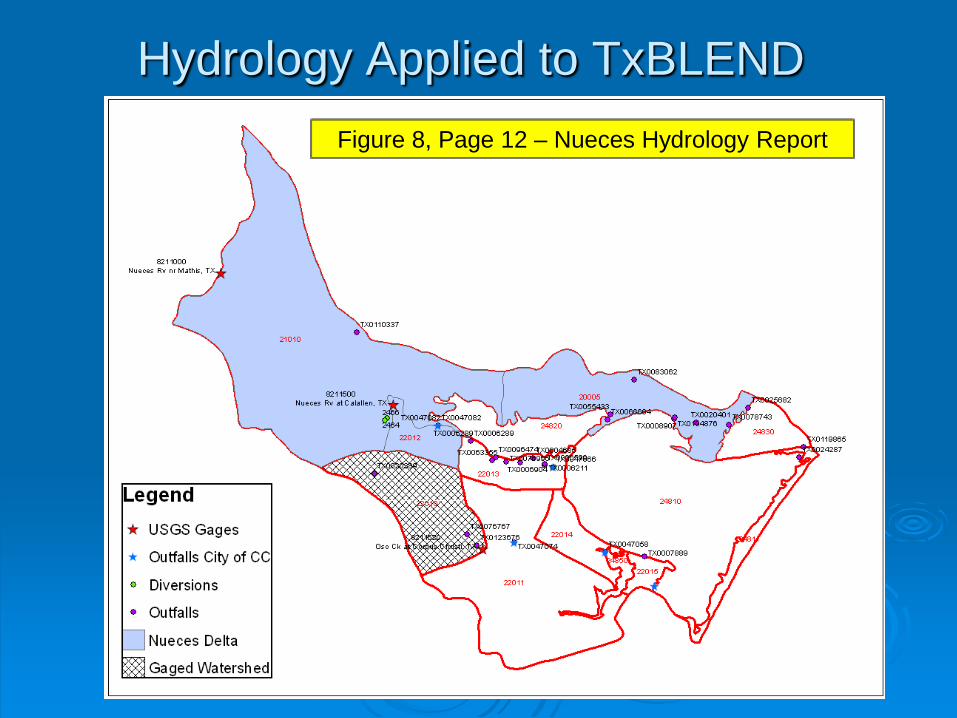
Hydrology Applied to TxBLEND
Figure 8, Page 12 – Nueces Hydrology Report
Copano Bay
Gulf of Mexico
Aransas Bay
Nueces Bay
CorpusChristi Bay
Oso Bay
LagunaMadre
Baffin Bay
NuecesRiver
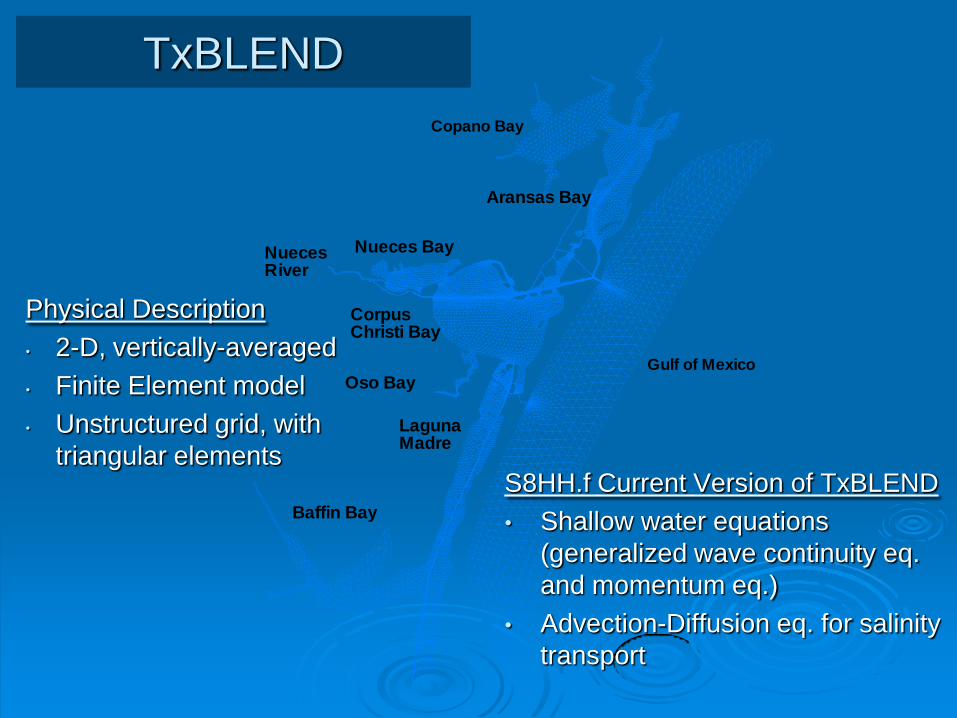
Physical Description
• 2-D, vertically-averaged
• Finite Element model
• Unstructured grid, with
triangular elements
S8HH.f Current Version of TxBLEND
• Shallow water equations
(generalized wave continuity eq.
and momentum eq.)
• Advection-Diffusion eq. for salinity
transport
TxBLEND
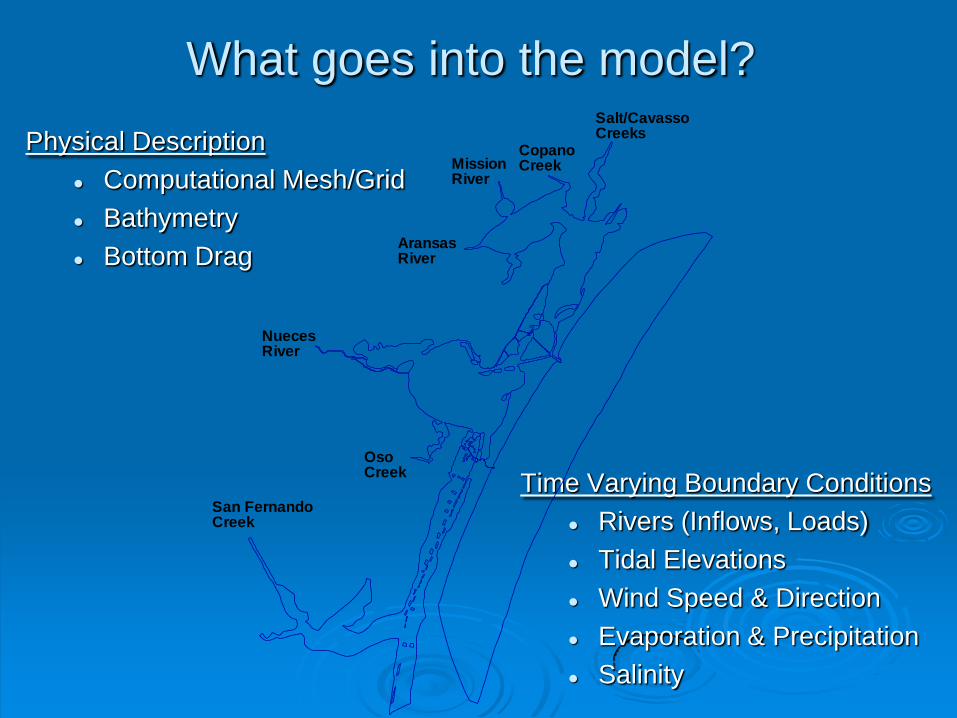
What goes into the model?
Physical Description
Computational Mesh/Grid
Bathymetry
Bottom Drag
Time Varying Boundary Conditions
Rivers (Inflows, Loads)
Tidal Elevations
Wind Speed & Direction
Evaporation & Precipitation
Salinity
Salt/CavassoCreeks
CopanoCreekMission
River
AransasRiver
NuecesRiver
OsoCreek
San FernandoCreek
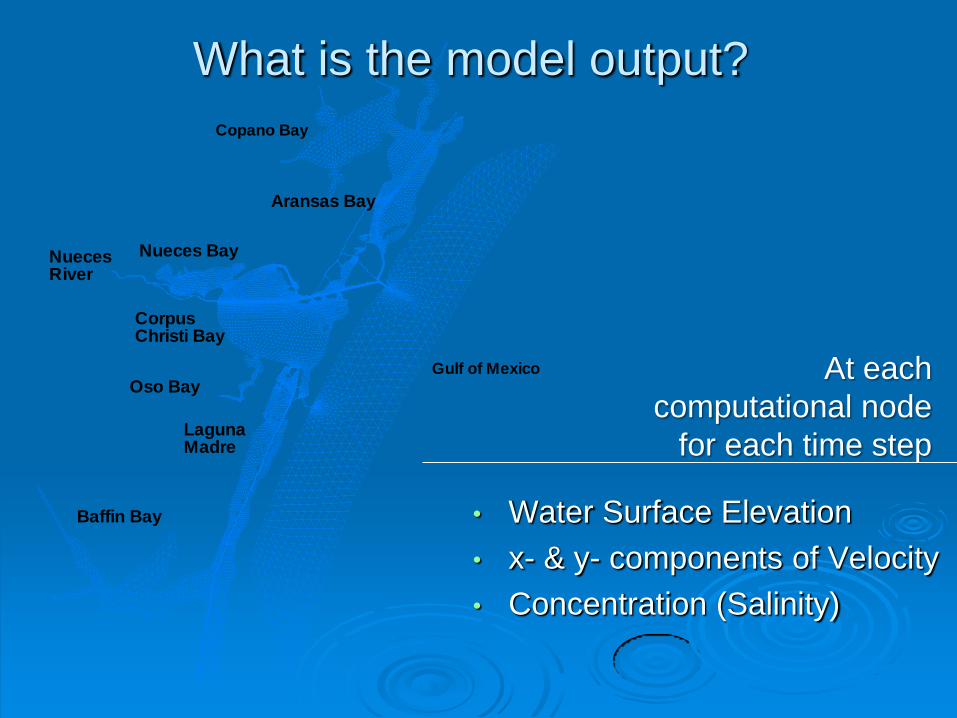
• Water Surface Elevation
• x- & y- components of Velocity
• Concentration (Salinity)
At each
computational node
for each time step
Copano Bay
Gulf of Mexico
Aransas Bay
Nueces Bay
CorpusChristi Bay
Oso Bay
LagunaMadre
Baffin Bay
NuecesRiver
What is the model output?
TxBLEND Nueces Estuary Model
Model Calibration
Velocity and Discharge: 1994, 1995, 2000
Salinity: 4 locations, variable periods between 1987 - 2004
CC ShipChannelnear B&R
HumbleChannel
GIWW nearJFK Causeway
Habor Bridge
Oso Bay at Bridge
Nueces Causewayin channel
GIWW nearBird Island
GIWW nearPita Island
Nueces Causewayoff channelNueces Causewayoff channel
CC Channelnear Ingleside
Lydia AnnChannel
AransasChannel
EntranceChannelnear UTMSI
Point ofMustang
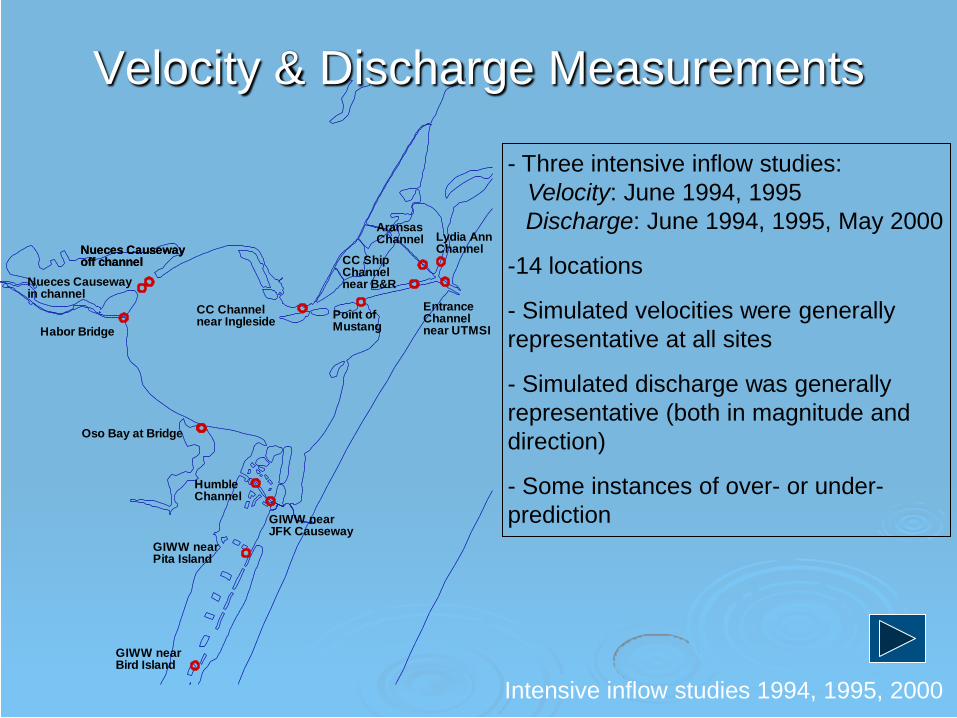
Velocity & Discharge Measurements
Intensive inflow studies 1994, 1995, 2000
- Three intensive inflow studies:
Velocity: June 1994, 1995
Discharge: June 1994, 1995, May 2000
-14 locations
- Simulated velocities were generally
representative at all sites
- Simulated discharge was generally
representative (both in magnitude and
direction)
- Some instances of over- or under-
prediction
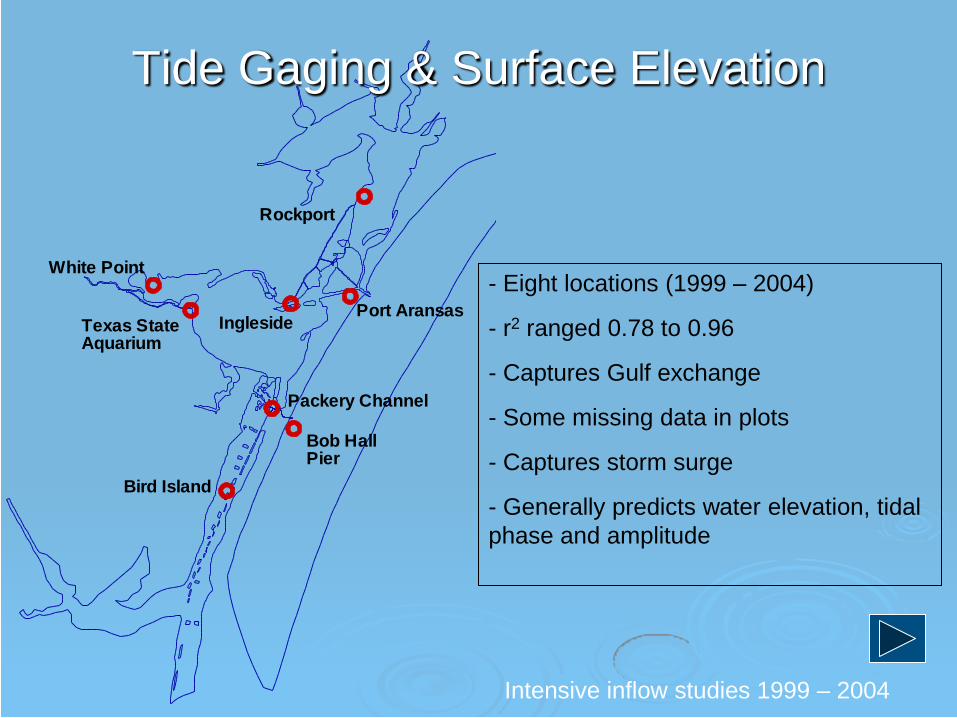
Intensive inflow studies 1999 – 2004
Rockport
Packery Channel
White Point
Port Aransas
Bird Island
Texas StateAquarium
Ingleside
Bob HallPier
Tide Gaging & Surface Elevation
- Eight locations (1999 – 2004)
- r2 ranged 0.78 to 0.96
- Captures Gulf exchange
- Some missing data in plots
- Captures storm surge
- Generally predicts water elevation, tidal
phase and amplitude
Aransas Bay
GIWW nearJFK Causeway
Nueces Bay
CorpusChristi Bay
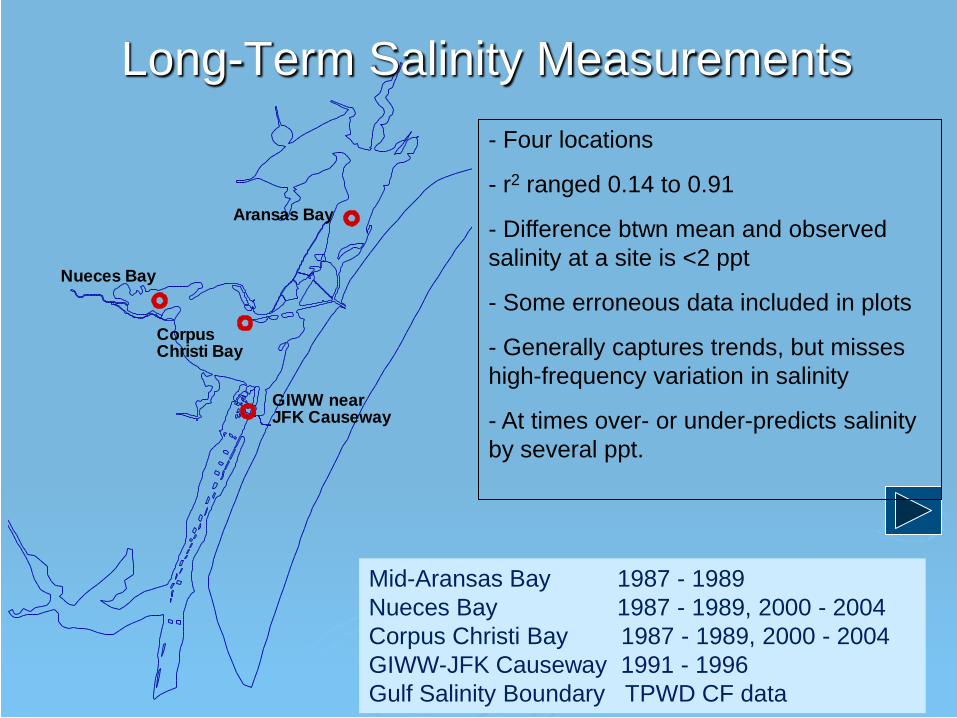
Mid-Aransas Bay 1987 - 1989
Nueces Bay 1987 - 1989, 2000 - 2004
Corpus Christi Bay 1987 - 1989, 2000 - 2004
GIWW-JFK Causeway 1991 - 1996
Gulf Salinity Boundary TPWD CF data
Long-Term Salinity Measurements
- Four locations
- r2 ranged 0.14 to 0.91
- Difference btwn mean and observed
salinity at a site is <2 ppt
- Some erroneous data included in plots
- Generally captures trends, but misses
high-frequency variation in salinity
- At times over- or under-predicts salinity
by several ppt.
Observed Daily Salinity (ppt)S
imu
late
dD
aily
Sa
lin
ity
(pp
t)
0 10 20 30 400
10
20
30
40
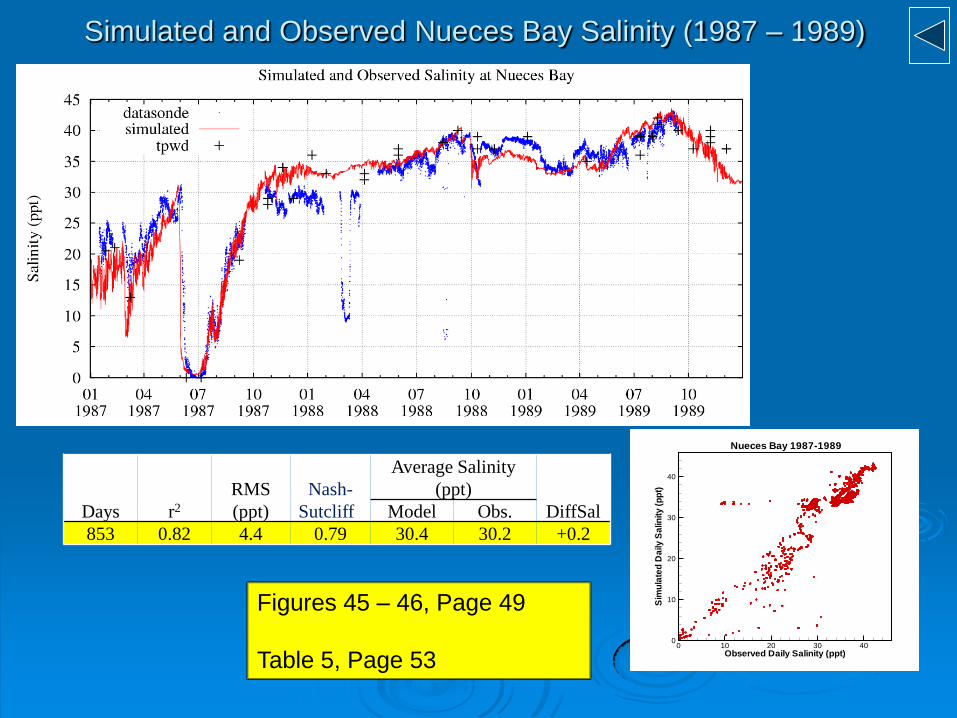
Nueces Bay 1987-1989
Simulated and Observed Nueces Bay Salinity (1987 – 1989)
Days r2
RMS
(ppt)
Nash-
Sutcliffe
Average Salinity
(ppt)
DiffSal Model Obs.
853 0.82 4.4 0.79 30.4 30.2 +0.2
Figures 45 – 46, Page 49
Table 5, Page 53
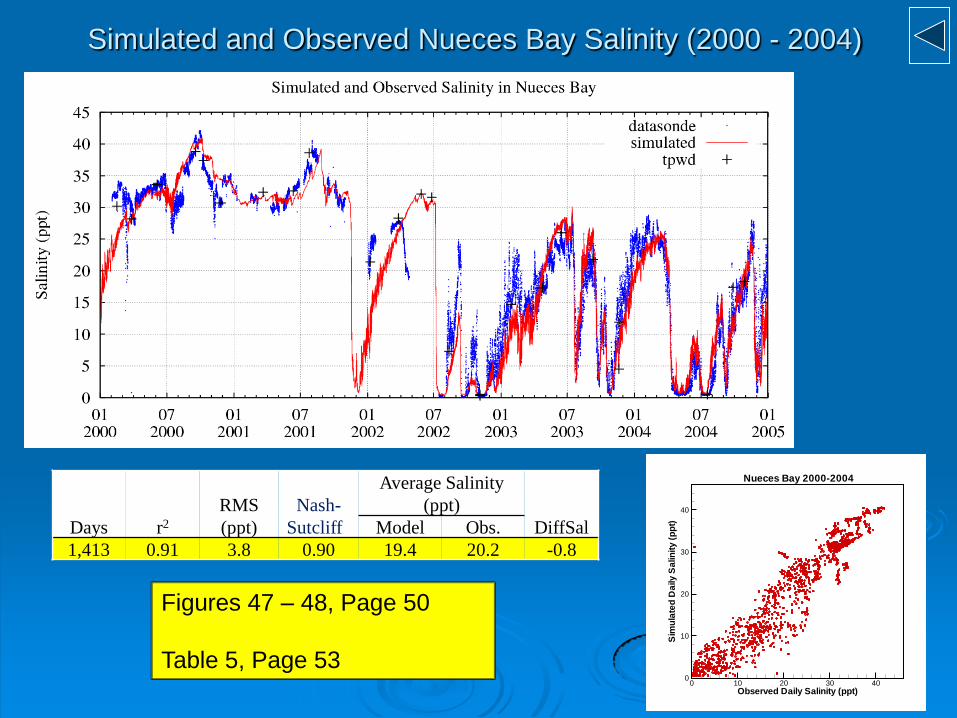
Simulated and Observed Nueces Bay Salinity (2000 - 2004)
Days r2
RMS
(ppt)
Nash-
Sutcliffe
Average Salinity
(ppt)
DiffSal Model Obs.
1,413 0.91 3.8 0.90 19.4 20.2 -0.8
Figures 47 – 48, Page 50
Table 5, Page 53 Observed Daily Salinity (ppt)
Sim
ula
ted
Da
ily
Sa
lin
ity
(pp
t)
0 10 20 30 400
10
20
30
40
Nueces Bay 2000-2004
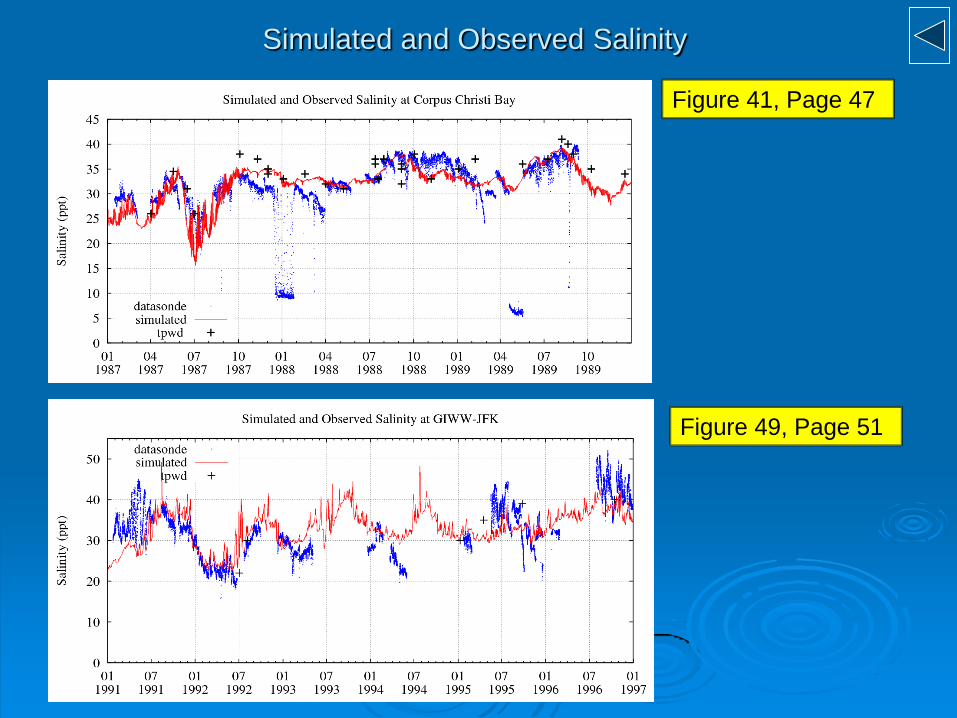
Simulated and Observed Salinity
Figure 41, Page 47
Figure 49, Page 51
TxBLEND Nueces Estuary Model
Model Validation
Salinity: 4 locations, variable periods between 1994 - 2009
Aransas Bay
GIWW nearJFK Causeway
Nueces Bay
CorpusChristi Bay
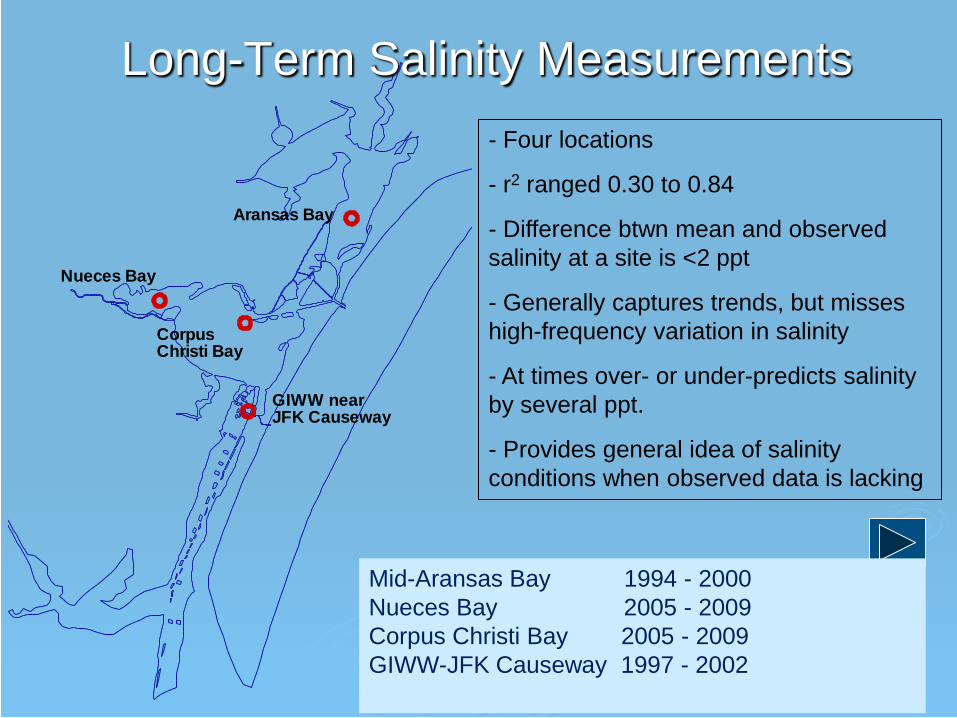
Mid-Aransas Bay 1994 - 2000
Nueces Bay 2005 - 2009
Corpus Christi Bay 2005 - 2009
GIWW-JFK Causeway 1997 - 2002
Long-Term Salinity Measurements
- Four locations
- r2 ranged 0.30 to 0.84
- Difference btwn mean and observed
salinity at a site is <2 ppt
- Generally captures trends, but misses
high-frequency variation in salinity
- At times over- or under-predicts salinity
by several ppt.
- Provides general idea of salinity
conditions when observed data is lacking
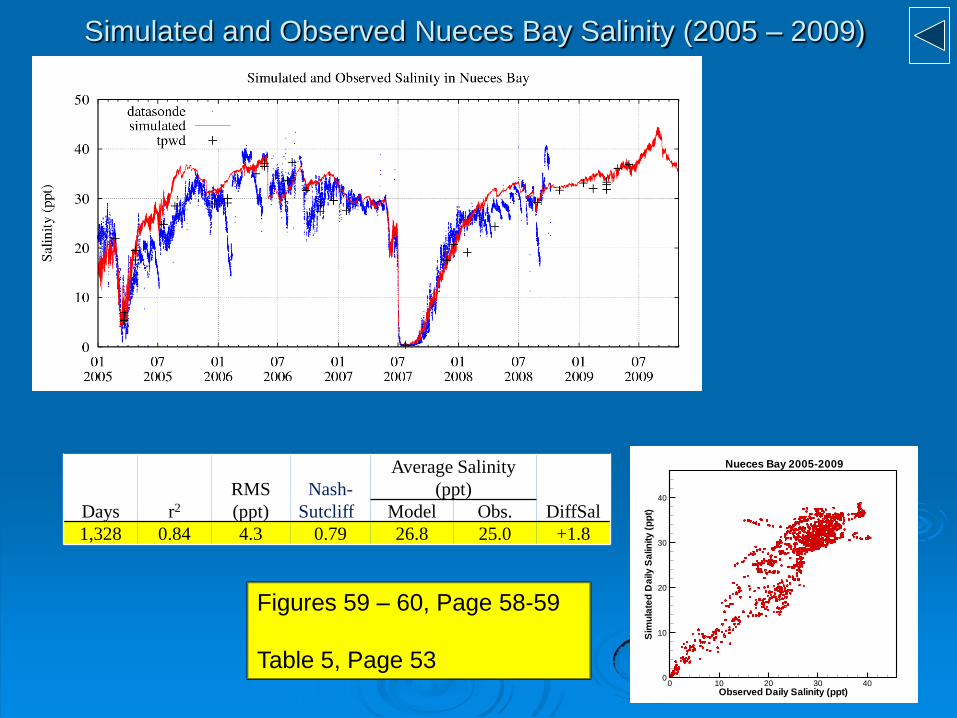
Simulated and Observed Nueces Bay Salinity (2005 – 2009)
Days r2
RMS
(ppt)
Nash-
Sutcliffe
Average Salinity
(ppt)
DiffSal Model Obs.
1,328 0.84 4.3 0.79 26.8 25.0 +1.8
Figures 59 – 60, Page 58-59
Table 5, Page 53 Observed Daily Salinity (ppt)
Sim
ula
ted
Da
ily
Sa
lin
ity
(pp
t)
0 10 20 30 400
10
20
30
40
Nueces Bay 2005-2009

spare slides

Hydrodynamic & Salinity Transport Model
(TxBLEND)
Purpose
Provide simulation and representation of water currents and
salinity distribution throughout the bays
Why?
Allows for modeling scenarios of changing inflows, climate, or
physical geometry to predict effects on salinity and circulation
patterns within the bay
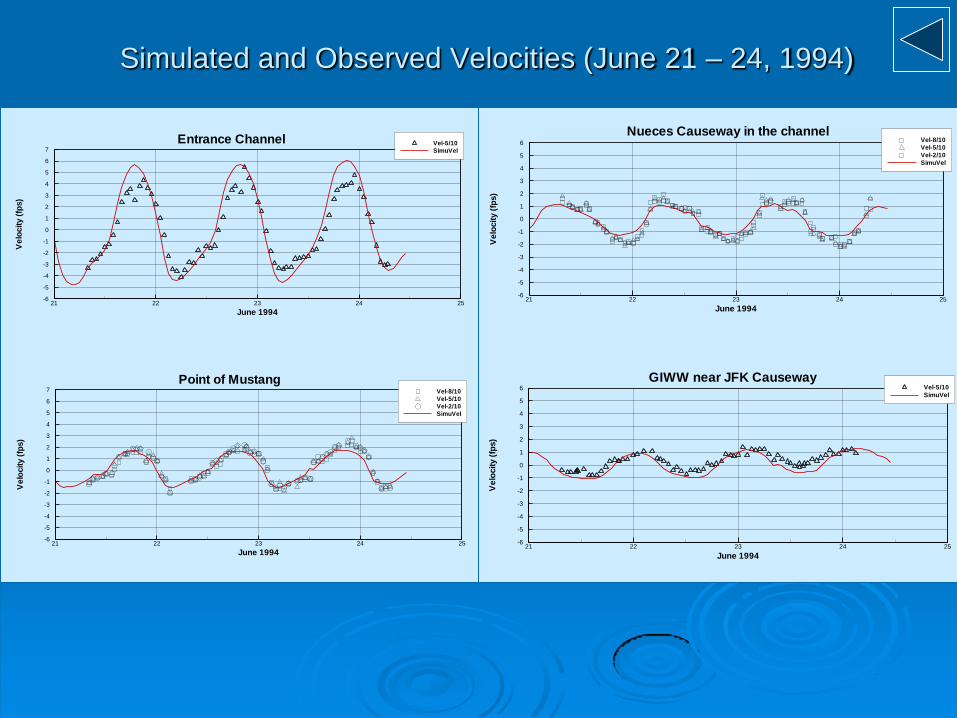
Simulated and Observed Velocities (June 21 – 24, 1994)
June 1994
Ve
locity
(fp
s)
21 22 23 24 25-6
-5
-4
-3
-2
-1
0
1
2
3
4
5
6
7Vel-5/10
SimuVel
Entrance Channel
June 1994
Ve
locity
(fp
s)
21 22 23 24 25-6
-5
-4
-3
-2
-1
0
1
2
3
4
5
6
7Vel-5/10
SimuVel
C C Channel near B&R
June 1994
Ve
locit
y(f
ps)
21 22 23 24 25-6
-5
-4
-3
-2
-1
0
1
2
3
4
5
6
7 Vel-8/10
Vel-5/10
Vel-2/10
SimuVel
Point of Mustang
June 1994
Ve
locity
(fp
s)
21 22 23 24 25-6
-5
-4
-3
-2
-1
0
1
2
3
4
5
6
7Vel-5/10
SimuVel
Entrance Channel
June 1994
Ve
locity
(fp
s)
21 22 23 24 25-6
-5
-4
-3
-2
-1
0
1
2
3
4
5
6
7Vel-5/10
SimuVel
C C Channel near B&R
June 1994
Ve
locit
y(f
ps)
21 22 23 24 25-6
-5
-4
-3
-2
-1
0
1
2
3
4
5
6
7 Vel-8/10
Vel-5/10
Vel-2/10
SimuVel
Point of Mustang
June 1994
Ve
locity
(fp
s)
21 22 23 24 25-6
-5
-4
-3
-2
-1
0
1
2
3
4
5
6 Vel-8/10
Vel-5/10
Vel-2/10
SimuVel
C C Channel near Ingleside
June 1994
Ve
locity
(fp
s)
21 22 23 24 25-6
-5
-4
-3
-2
-1
0
1
2
3
4
5
6Vel-8/10
Vel-5/10
Vel-2/10
SimuVel
Nueces Causeway in the channel
June 1994
Ve
locit
y(f
ps)
21 22 23 24 25-6
-5
-4
-3
-2
-1
0
1
2
3
4
5
6Vel-8/10
Vel-5/10
Vel-2/10
SimuVel
Nueces Causeway off the channel
June 1994
Ve
locity
(fp
s)
21 22 23 24 25-6
-5
-4
-3
-2
-1
0
1
2
3
4
5
6 Vel-5/10
SimuVel
GIWW near JFK Causeway
June 1994
Ve
locity
(fp
s)
21 22 23 24 25-6
-5
-4
-3
-2
-1
0
1
2
3
4
5
6 Vel-5/10
SimuVel
Humble Channel
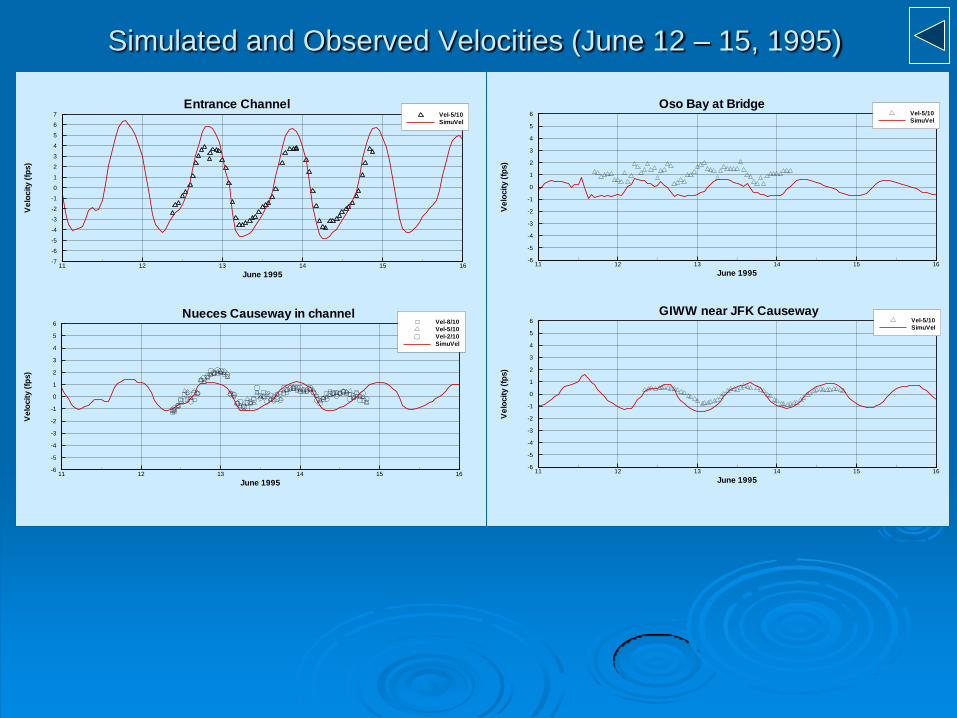
Simulated and Observed Velocities (June 12 – 15, 1995)
June 1995
Ve
locit
y(f
ps)
11 12 13 14 15 16-6
-5
-4
-3
-2
-1
0
1
2
3
4
5
6 Vel-5/10
SimuVel
Lydia Ann Channel
June 1995
Ve
locity
(fp
s)
11 12 13 14 15 16-7
-6
-5
-4
-3
-2
-1
0
1
2
3
4
5
6
7 Vel-5/10
SimuVel
Entrance Channel
June 1995
Ve
locit
y(f
ps)
11 12 13 14 15 16-7
-6
-5
-4
-3
-2
-1
0
1
2
3
4
5
6
7 Vel-5/10
SimuVel
C C Channel near B&R
June 1995
Ve
locity
(fp
s)
11 12 13 14 15 16-6
-5
-4
-3
-2
-1
0
1
2
3
4
5
6 Vel-5/10
SimuVel
Aransas Channel
June 1995
Ve
locity
(fp
s)
11 12 13 14 15 16-6
-5
-4
-3
-2
-1
0
1
2
3
4
5
6 Vel-5/10
SimuVel
Nueces Causeway off channel
June 1995
Ve
locity
(fp
s)
11 12 13 14 15 16-6
-5
-4
-3
-2
-1
0
1
2
3
4
5
6 Vel-8/10
Vel-5/10
Vel-2/10
SimuVel
Nueces Causeway in channel
June 1995
Ve
locit
y(f
ps)
11 12 13 14 15 16-6
-5
-4
-3
-2
-1
0
1
2
3
4
5
6 Vel-5/10
SimuVel
Oso Bay at Bridge
June 1995
Ve
locity
(fp
s)
11 12 13 14 15 16-6
-5
-4
-3
-2
-1
0
1
2
3
4
5
6 Vel-5/10
SimuVel
GIWW near JFK Causeway
June 1995
Ve
locit
y(f
ps)
11 12 13 14 15 16-6
-5
-4
-3
-2
-1
0
1
2
3
4
5
6 Vel-5/10
SimuVel
Humble Channel
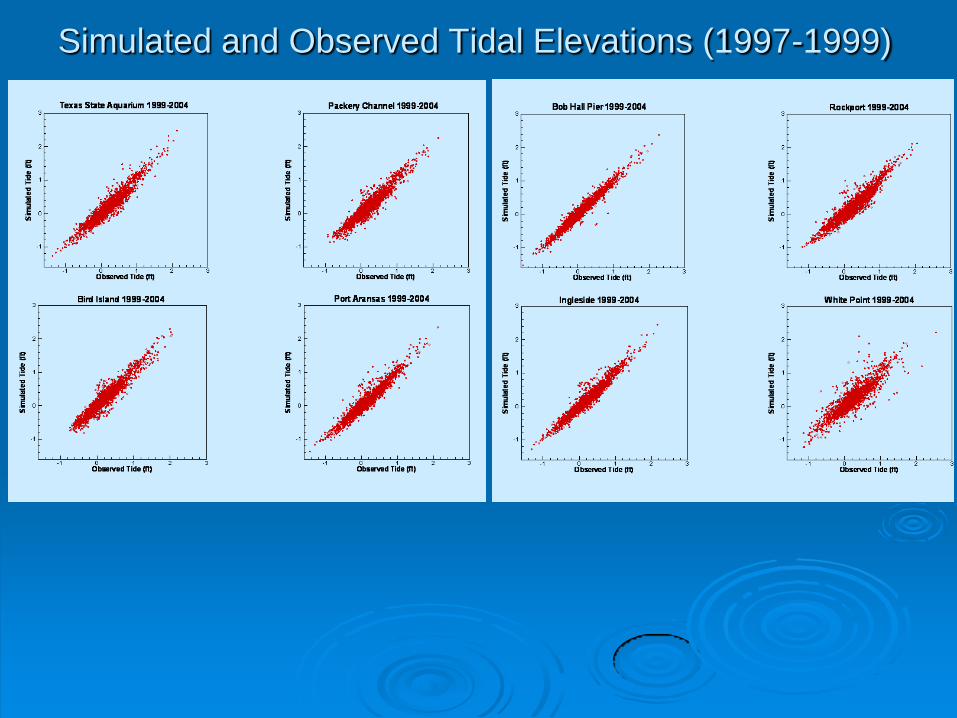
Simulated and Observed Tidal Elevations (1997-1999)
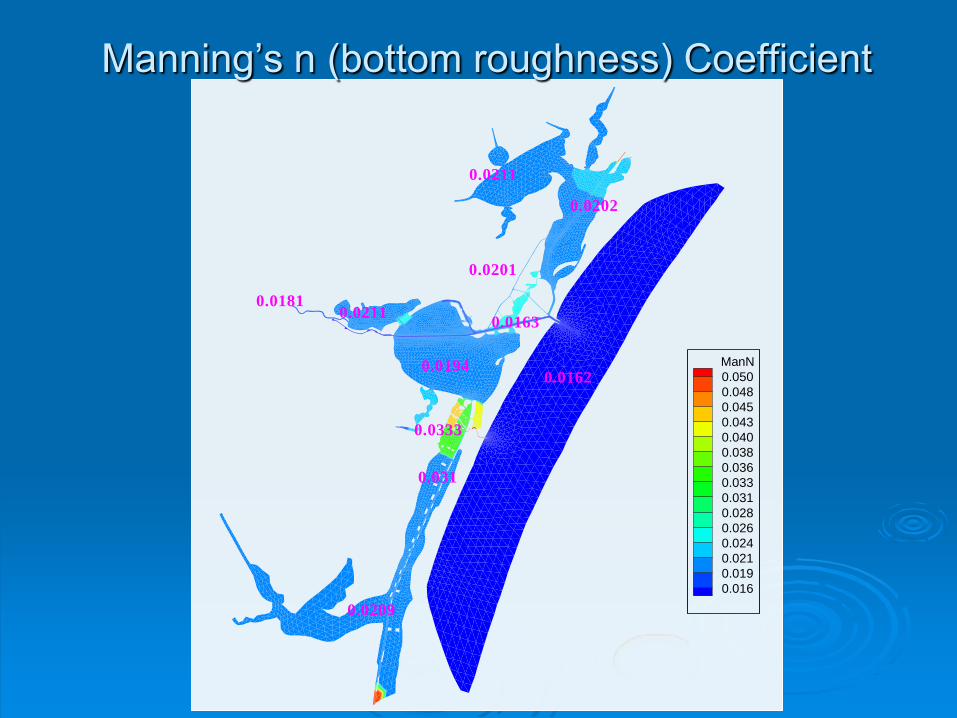
Manning’s n (bottom roughness) Coefficient
ManN
0.050
0.048
0.045
0.043
0.040
0.038
0.036
0.033
0.031
0.028
0.026
0.024
0.021
0.019
0.016
0.0209
0.0202
0.0211
0.0333
0.031
0.0162
0.0201
0.0181
0.0211
0.0163
0.0194
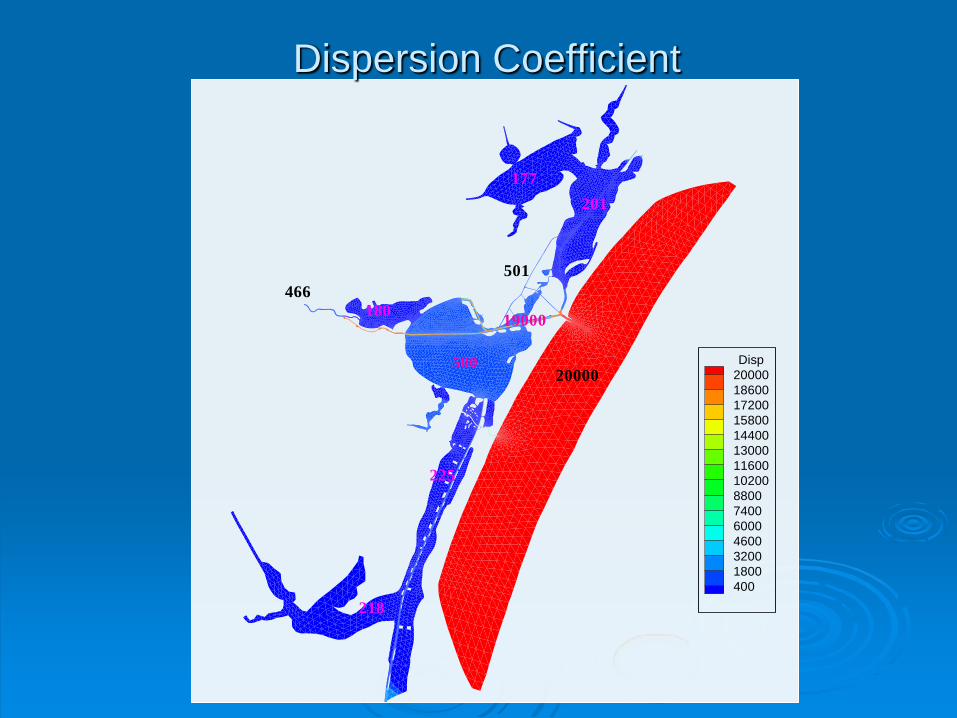
Dispersion Coefficient
Disp
20000
18600
17200
15800
14400
13000
11600
10200
8800
7400
6000
4600
3200
1800
400
218
201
180
225
20000
501
466
177
19000
500