Embed Size (px)
Citation preview
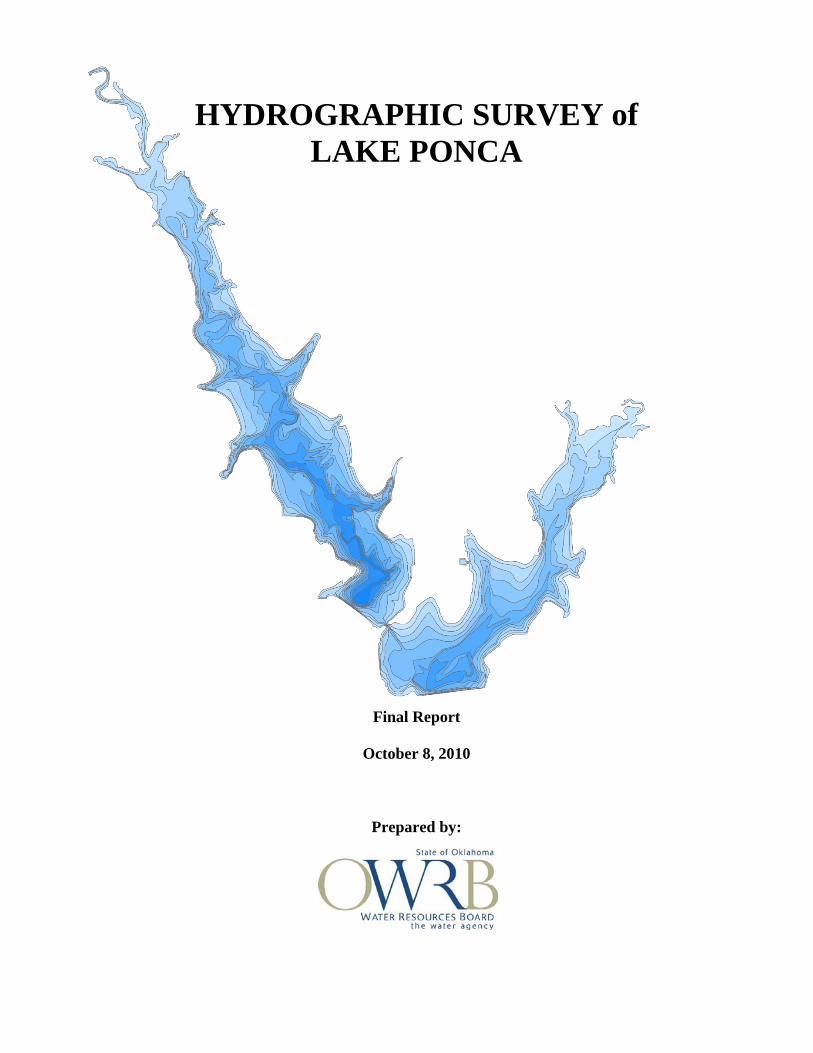
HYDROGRAPHIC SURVEY of LAKE PONCA
Final Report
October 8, 2010
Prepared by:
2
TABLE OF CONTENTS TABLE OF CONTENTS .......................................................................................................... 2 TABLE OF FIGURES .............................................................................................................. 3 TABLE OF TABLES ................................................................................................................ 3 INTRODUCTION .................................................................................................................... 4 LAKE BACKGROUND ........................................................................................................... 4 HYDROGRAPHIC SURVEYING PROCEDURES ................................................................ 6
Pre-survey Planning .......................................................................................................... 6 Boundary File ................................................................................................................ 6 Set-up ............................................................................................................................ 6
Field Survey ...................................................................................................................... 6 Lake Elevation Acquisition ........................................................................................... 6 Method .......................................................................................................................... 7 Technology .................................................................................................................... 7 Survey ........................................................................................................................... 7 Quality Control/Quality Assurance ............................................................................... 7
Data Processing ................................................................................................................. 9 GIS Application .............................................................................................................. 10
RESULTS ............................................................................................................................... 10 SUMMARY and COMPARISON .......................................................................................... 11 REFERENCES ........................................................................................................................ 12 APPENDIX A: Area-Capacity Data ...................................................................................... 13 APPENDIX B: Lake Ponca Maps ......................................................................................... 19

3
TABLE OF FIGURES Figure 1: Location map for Lake Ponca. .................................................................................. 5 Figure A. 1. Area-Capacity Curve for Lake Ponca ................................................................. 17 Figure B. 1: Lake Ponca Bathymetric Map with 5-foot Contour Intervals. ............................ 20 Figure B. 2: Lake Ponca Shaded Relief Bathymetric Map. .................................................... 21 Figure B. 3: Lake Ponca Collected Data Points. ..................................................................... 22 TABLE OF TABLES Table 1: Area and Volume Comparisons of Lake Ponca. ...................................................... 11 Table A. 1: Lake Ponca Capacity/Area by 0.1-ft Increments. ................................................ 14 Table A. 2: Lake Ponca Capacity/Area by 0.1-ft Increments (cont). ...................................... 15 Table A. 3: Lake Ponca Capacity/Area by 0.1-ft Increments (cont) ………………………...16

4
LAKE PONCA
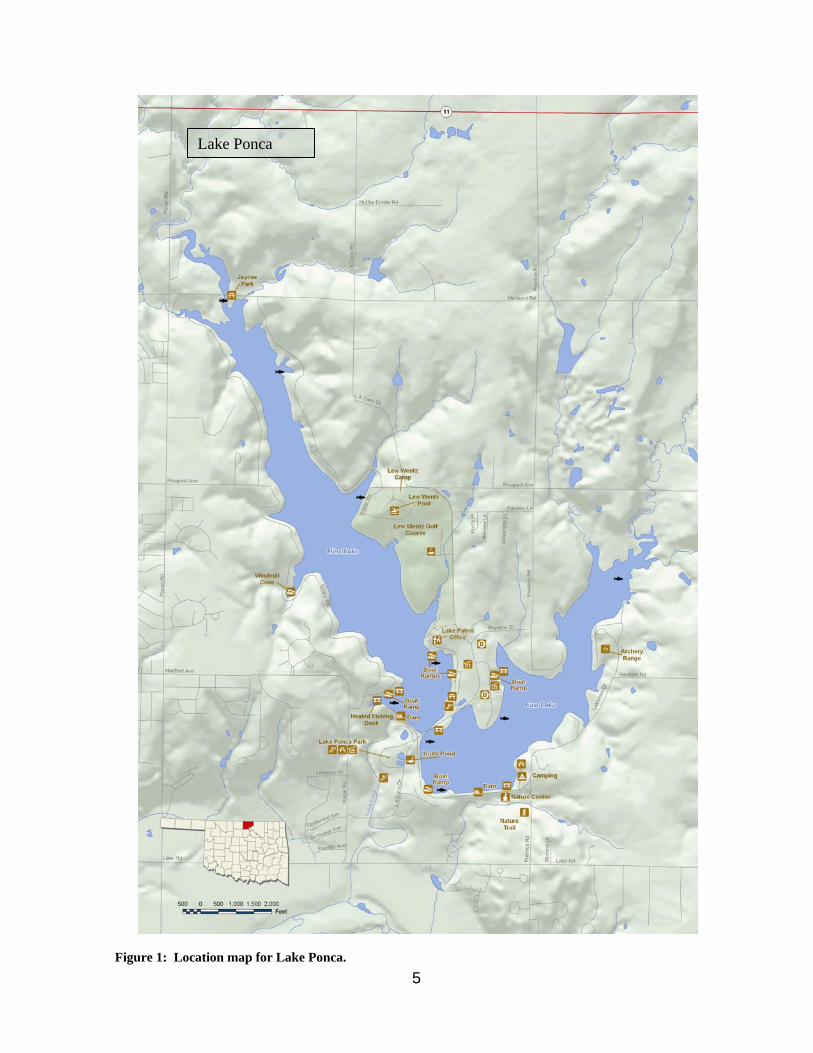
HYDROGRAPHIC SURVEY REPORT INTRODUCTION The Oklahoma Water Resources Board (OWRB) conducted a hydrographic survey of Lake Ponca in April 2010. The purpose of this survey was to collect hydrographic data of the lake and convert this information into an elevation-area-capacity table. This project was funded by the OWRB’s Dam Safety Program. LAKE BACKGROUND Lake Ponca is located on Turkey Creek in Kay County (Figure 1). It was built in 1935. Its original purposes were water supply, flood control, and recreation. In 1943, the embankment was raised and the spillway was modified. The dam is located in Sec. 20-T26N-R3E. The dam on this reservoir is classified as a high hazard dam. The “high hazard” classification means that dam failure, if it occurred, may cause loss of life, serious damage to homes, industrial or commercial buildings, important public utilities, main highways or railroads. This classification does not mean that it is likely to fail.
5
Lake Ponca
Figure 1: Location map for Lake Ponca.
6
HYDROGRAPHIC SURVEYING PROCEDURES The process of surveying a reservoir uses a combination of Geographic Positioning System (GPS) and acoustic depth sounding technologies that are incorporated into a hydrographic survey vessel. As the survey vessel travels across the lake’s surface, the echosounder gathers multiple depth readings every second. The depth readings are stored on the survey vessel’s on-board computer along with the positional data generated from the vessel’s GPS receiver. The collected data files are downloaded daily from the computer and brought to the office for editing. During editing, data “noise” is removed or corrected, and average depths are converted to elevation readings based on the daily-recorded lake level elevation on the day the survey was performed. Accurate estimates of area-capacity can then be determined for the lake by building a 3-D model of the reservoir from the corrected data. The process of completing a hydrographic survey includes four steps: pre-survey planning, field survey, data processing, and GIS application. Pre-survey Planning Boundary File The boundary file for Lake Ponca was on-screen digitized from the 2006 color digital orthoimagery quarter quadrangle (DOQQ) mosaic of Kay County, Oklahoma. The screen scale was set to 1:1,500. A line was created to represent the shoreline as closely as possible. Due to the photography being a summer photo, it was difficult to determine the actual shoreline when there are trees and other vegetation hanging over the lake. The 2008 and 2003 DOQQs of the lakes were used as background reference. The reservoir boundaries were digitized in NAD 1983 State Plane Coordinates (Oklahoma North-3501). Set-up HYPACK software from Hypack, Inc. was used to assign geodetic parameters, import background files, and create virtual track lines (transects). The geodetic parameters assigned were State Plane NAD 83 Zone OK-3501 Oklahoma North with distance units and depth as US Survey Feet. The survey transects were spaced according to the accuracy required for the project. The survey transects within the digitized reservoir boundary were at 300 ft increments and ran perpendicular to the original stream channels and tributaries. Approximately 73 virtual transects were created for the Lake Ponca. Field Survey Lake Elevation Acquisition The lake elevation for Lake Ponca was obtained by collecting positional data over a period of 271 minutes with a survey-grade Global Positioning System (GPS) receiver. The receiver was placed over the water’s surface. A measurement was taken from the antenna to the surface of the water. The collected data and antenna height was then uploaded to the On-line Positioning Users Service (OPUS) website. The National Geodetic Survey (NGS) operates OPUS as a means to provide GPS users easier access to the National Spatial Reference System (NSRS). OPUS allows users to submit their GPS data files to NGS, where the data is processed to determine a position using NGS computers and software. Calculated coordinates are averaged from three independent single-baseline solutions computed by double-differenced, carrier-phase measurements between the collected data file and 3 surrounding
7
Continuously Operating Reference Stations (CORS). Under ideal conditions, OPUS can easily resolve most positions to within centimeter accuracy. A report containing the newly calculated positional data was electronically returned via email. This report contained the elevation of the surface of the water corrected for the antenna height. Method The procedures followed by the OWRB during the hydrographic survey adhere to U.S. Army Corps of Engineers (USACE) standards (USACE, 2002). The quality control and quality assurance procedures for equipment calibration and operation, field survey, data processing, and accuracy standards are presented in the following sections. Technology The Hydro-survey vessel is an 18-ft aluminum Silverstreak hull with cabin, powered by a single 115-Horsepower Mercury outboard motor. Equipment used to conduct the survey included: a ruggedized notebook computer; Syqwest Bathy 1500 Echo Sounder, with a depth resolution of 0.1 ft; Trimble Navigation, Inc. Pro XR GPS receiver with differential global positioning system (DGPS) correction; and an Odom Hydrographics, Inc, DIGIBAR-Pro Profiling Sound Velocimeter. The software used was HYPACK. Survey A two-man survey crew was used during the project. Data collection for Lake Ponca occurred in April of 2010. The water level elevation for Lake Ponca was 987.69 ft Geodetic Vertical Datum (NGVD). Data collection began at the dam and moved upstream. The survey crew followed the parallel transects created during the pre-survey planning while collecting depth soundings and positional data. Data was also collected along a path parallel to the shoreline at a distance that was determined by the depth of the water and the draft of the boat – generally, two to three feet deep. Areas with depths less than this were avoided. Quality Control/Quality Assurance While on board the Hydro-survey vessel, the Syqwest Bathy 1500 Echo Sounder was calibrated using A DIGIBAR-Pro Profiling Sound Velocimeter, by Odom Hydrographics. The sound velocimeter measures the speed of sound at incremental depths throughout the water column. The factors that influence the speed of sound—depth, temperature, and salinity—are all taken into account. Deploying the unit involved lowering the probe, which measures the speed of sound, into the water to the calibration depth mark to allow for acclimation and calibration of the depth sensor. The unit was then gradually lowered at a controlled speed to a depth just above the lake bottom, and then was raised to the surface. The unit collected sound velocity measurements in feet/seconds (ft/sec) at 1 ft increments on both the deployment and retrieval phases. The data was then reviewed for any erroneous readings, which were then edited out of the sample. The sound velocity corrections were then applied to the to the raw depth readings. The average speed of sound in the water column was 4810.10 ft/sec during the Lake Ponca survey. A quality assurance cross-line check was performed on intersecting transect lines and channel track lines to assess the estimated accuracy of the survey measurements. The overall accuracy of an observed bottom elevation or depth reading is dependent on random and systematic errors that are present in the measurement process. Depth measurements contain both random
errors and systematic bias. Biases are often referred to as systematic errors and are often due to observational errors. Examples of bias include a bar check calibration error, tidal errors, or incorrect squat corrections. Bias, however, does not affect the repeatability, or precision, of results. The precision of depth readings is affected by random errors. These are errors present in the measurement system that cannot be easily reduced by further calibration. Examples of random error include uneven bottom topography, bottom vegetation, positioning error, extreme listing of survey vessel, and speed of sound variation in the water column. An assessment of the accuracy of an individual depth or bottom elevation must fully consider all the error components contained in the observations that were used to determine that measurement. Therefore, the ultimate accuracy must be estimated (thus the use of the term “estimated accuracy”) using statistical estimating measures (USACE, 2002). The depth accuracy estimate is determined by comparing depth readings taken at the intersection of two lines and computing the difference. This is done on multiple intersections. The mean difference of all intersection points is used to calculate the mean difference (MD). The mean difference represents the bias present in the survey. The standard deviation (SD), representing the random error in the survey, is also calculated. The mean difference and the standard deviation are then used to calculate the Root Mean Square (RMS) error. The RMS error estimate is used to compare relative accuracies of estimates that differ substantially in bias and precision (USACE, 2002). According the USACE standards, the RMS at the 95% confidence level should not exceed a tolerance of ± 2.0 ft for this type of survey. This simply means that on average, 19 of every 20 observed depths will fall within the specified accuracy tolerance. HYPACK Cross Statistics program was used to assess vertical accuracy and confidence measures of acoustically recorded depths. The program computes the sounding difference between intersecting lines of single beam data. The program provides a report that shows the standard deviation and mean difference. A total of 257 cross-sections points at Lake Ponca were used to compute error estimates. A mean difference of 0.03 ft and a standard deviation of 0.27 ft were computed from intersections. The following formulas were used to determine the depth accuracy at the 95% confidence level. BiaserrorRandomRMS 22 σσ += where: Random error = Standard deviation Bias = Mean difference RMS = root mean square error (68% confidence level) and: %)68(96.1%)95( RMSaccuracydepthRMS ×= An RMS of ± 0.53 ft with a 95% confidence level is less than the USACE’s minimum performance standard of ± 2.0 ft for this type of survey. A mean difference, or bias, of 0.03 ft
8
9
is well below the USACE’s standard maximum allowable bias of ± 0.5 ft for this type of survey.
The GPS system is an advanced high performance geographic data-acquisition tool that uses DGPS to provide sub-meter positional accuracy on a second-by-second basis. Potential errors are reduced with differential GPS because additional data from a reference GPS receiver at a known position are used to correct positions obtained during the survey. Before the survey, Trimble’s Pathfinder Controller software was used to configure the GPS receiver. To maximize the accuracy of the horizontal positioning, the horizontal mask setting was set to 15 degrees and the Position Dilution of Precision (PDOP) limit was set to 6. The position interval was set to 1 second and the Signal to Noise Ratio (SNR) mask was set to 4. The United States Coast Guard reference station used in the survey is located near Sallisaw, Oklahoma. A latency test was performed to determine the fixed delay time between the GPS and single beam echo sounder. The timing delay was determined by running reciprocal survey lines over a channel bank. The raw data files were downloaded into HYPACK - LATENCY TEST program. The program varies the time delay to determine the “best fit” setting. A position latency of 0.4 seconds was produced and adjustments were applied to the raw data in the EDIT program. Data Processing The collected data was transferred from the field computer onto an OWRB desktop computer. After downloading the data, each raw data file was reviewed using the EDIT program within HYPACK. The EDIT program allowed the user to assign transducer offsets, latency corrections, tide corrections, display the raw data profile, and review/edit all raw depth information. Raw data files are checked for gross inaccuracies that occur during data collection. Offset correction values of 3.2 ft. starboard, 6.6 ft. forward, and -1.1 ft. vertical were applied to all raw data along with a latency correction factor of 0.4 seconds. The speed of sound corrections were applied during editing of raw data. A correction file was produced using the HYPACK TIDES program to account for the variance in lake elevation at the time of data collection. Within the EDIT program, the corrected depths were subtracted from the elevation reading to convert the depth in feet to an elevation. The average elevation of the lake during the survey was 987.69 ft (NGVD). After editing the data for errors and correcting the spatial attributes (offsets and tide corrections), a data reduction scheme was needed due to the large quantity of collected data.. To accomplish this, the corrected data was resampled spatially at a 5 ft interval using the Sounding Selection program in HYPACK. The resultant data was saved and exported out as a xyz.txt file. The HYPACK raw and corrected data files for Lake Ponca are located on the DVD entitled FEMA 2010 HYPACK/GIS Metadata Disk 2.
10
GIS Application Geographic Information System (GIS) software was used to process the edited XYZ data collected from the survey. The GIS software used was ArcGIS Desktop and ArcMap, version 9.3.1, from Environmental System Research Institute (ESRI). All of the GIS datasets created are in Oklahoma State Plane North Coordinate System referenced to the North American Datum 1983. Horizontal and vertical units are in feet. The edited data points in XYZ text file format were converted into ArcMap point coverage format. The point coverage contains the X and Y horizontal coordinates and the elevation and depth values associated with each collected point. Volumetric and area calculations were derived using a Triangulated Irregular Network (TIN) surface model. The TIN model was created in ArcMap, using the collected survey data points and the lake boundary inputs. The TIN consists of connected data points that form a network of triangles representing the bottom surface of the lake. The lake volume was calculated by slicing the TIN horizontally into planes 0.1 ft thick. The cumulative volume and area of each slice are shown in APPENDIX A: Area-Capacity Data. Contours, depth ranges, and the shaded relief map were derived from a constructed digital elevation model grid. This grid was created using the ArcMap Topo to Raster Tool and had a spatial resolution of five feet. A low pass 3x3 filter was run to lightly smooth the grid to improve contour generation. The contours were created at a 5-ft interval using the ArcMap Contour Tool. The contour lines were edited to allow for polygon topology and to improve accuracy and general smoothness of the lines. The contours were then converted to a polygon coverage and attributed to show 5-ft depth ranges across the lake. The bathymetric maps of the lakes are shown with 5-ft contour intervals in APPENDIX B: Lake Ponca Maps. All geographic datasets derived from the survey contain Federal Geographic Data Committee (FGDC) compliant metadata documentation. The metadata describes the procedures and commands used to create the datasets. The GIS metadata file for both lakes is located at on the DVD entitled FEMA 2010 HYPACK/GIS Metadata Disk 2. RESULTS Results from the 2010 OWRB survey indicate that Lake Ponca encompasses 778 acres and contains a cumulative capacity of 13,577 ac-ft at the normal pool elevation (987.5 ft NGVD). The average depth for Lake Ponca was 17.5 ft.

11
SUMMARY and COMPARISON Table 1 is a comparison of area and volume changes of Lake Ponca at the normal pool elevation. Based on the design specifications, Lake Ponca had an area of 835 acres and cumulative volume of 15,000 acre-feet of water at normal pool elevation (987.5 ft NGVD). The surface area of the lake has had a decrease of 57 acres or approximately 7%. The 2010 survey shows that Lake Ponca has an apparent decrease in capacity of 9.5% or approximately 1,423 acre-feet. Caution should be used when directly comparing between the design specifications and the 2010 survey conducted by the OWRB because different methods were used to collect the data and extrapolate capacity and area figures. It is the recommendation of the OWRB that another survey using the same method used in the 2010 survey be conducted in 10-15 years. By using the 2010 survey figures as a baseline, a future survey would allow an accurate sedimentation rate to be obtained. Table 1: Area and Volume Comparisons of Lake Ponca at normal pool (987.5 ft NGVD).
Feature Survey Year
1935/1943 Design Specifications 2010
Area (acres) 835 778 Cumulative Volume (acre-feet) 15,000 13,577
Average depth (ft) 17.96 17.5 Maximum Depth (ft) -- 24.22

12
REFERENCES U.S. Army Corps of Engineers (USACE). 2002. Engineering and Design - Hydrographic Surveying, Publication EM 1110-2-1003, 3rd version. Oklahoma Water Resources Board (OWRB). 2007. Oklahoma Water Atlas. Oklahoma Water Resources Board (OWRB). 1979. Phase 1 Inspection Report; National Dam Safety Program.

13
APPENDIX A: Area-Capacity Data
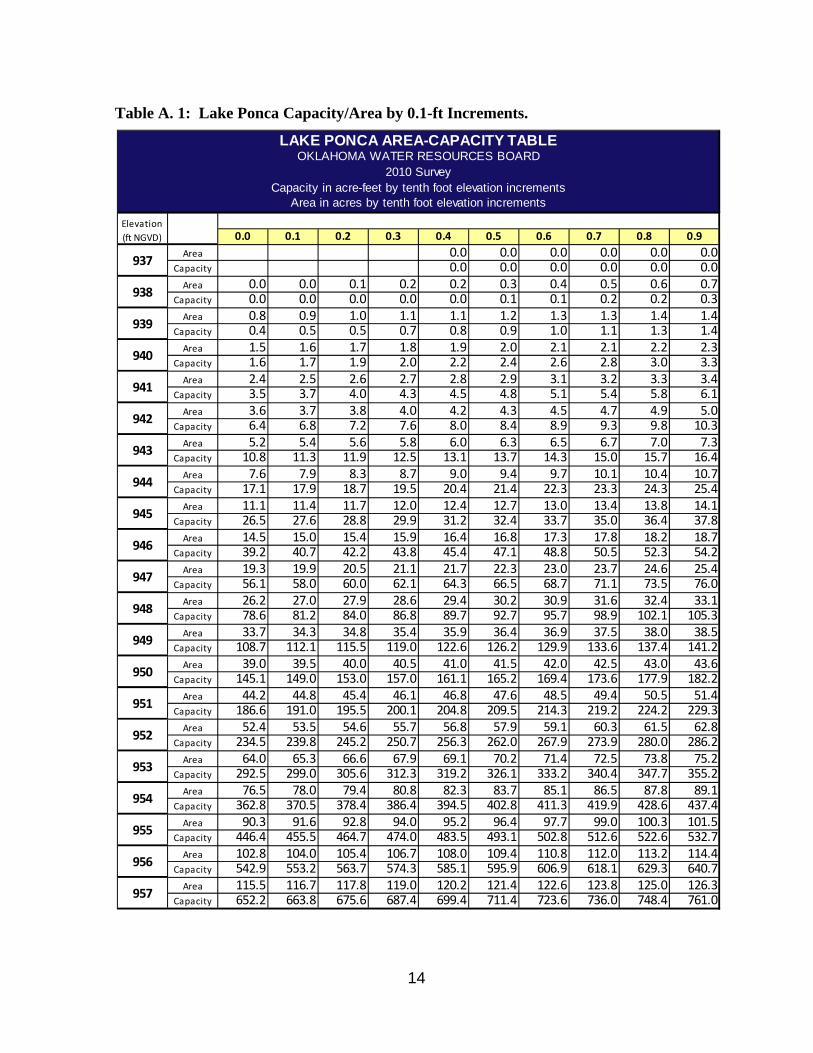
Table A. 1: Lake Ponca Capacity/Area by 0.1-ft Increments.
0.0 0.1 0.2 0.3 0.4 0.5 0.6 0.7 0.8 0.9Area 0.0 0.0 0.0 0.0 0.0 0.0
Capacity 0.0 0.0 0.0 0.0 0.0 0.0Area 0.0 0.0 0.1 0.2 0.2 0.3 0.4 0.5 0.6 0.7
Capacity 0.0 0.0 0.0 0.0 0.0 0.1 0.1 0.2 0.2 0.3Area 0.8 0.9 1.0 1.1 1.1 1.2 1.3 1.3 1.4 1.4
Capacity 0.4 0.5 0.5 0.7 0.8 0.9 1.0 1.1 1.3 1.4Area 1.5 1.6 1.7 1.8 1.9 2.0 2.1 2.1 2.2 2.3
Capacity 1.6 1.7 1.9 2.0 2.2 2.4 2.6 2.8 3.0 3.3Area 2.4 2.5 2.6 2.7 2.8 2.9 3.1 3.2 3.3 3.4
Capacity 3.5 3.7 4.0 4.3 4.5 4.8 5.1 5.4 5.8 6.1Area 3.6 3.7 3.8 4.0 4.2 4.3 4.5 4.7 4.9 5.0
Capacity 6.4 6.8 7.2 7.6 8.0 8.4 8.9 9.3 9.8 10.3Area 5.2 5.4 5.6 5.8 6.0 6.3 6.5 6.7 7.0 7.3
Capacity 10.8 11.3 11.9 12.5 13.1 13.7 14.3 15.0 15.7 16.4Area 7.6 7.9 8.3 8.7 9.0 9.4 9.7 10.1 10.4 10.7
Capacity 17.1 17.9 18.7 19.5 20.4 21.4 22.3 23.3 24.3 25.4Area 11.1 11.4 11.7 12.0 12.4 12.7 13.0 13.4 13.8 14.1
Capacity 26.5 27.6 28.8 29.9 31.2 32.4 33.7 35.0 36.4 37.8Area 14.5 15.0 15.4 15.9 16.4 16.8 17.3 17.8 18.2 18.7
Capacity 39.2 40.7 42.2 43.8 45.4 47.1 48.8 50.5 52.3 54.2Area 19.3 19.9 20.5 21.1 21.7 22.3 23.0 23.7 24.6 25.4
Capacity 56.1 58.0 60.0 62.1 64.3 66.5 68.7 71.1 73.5 76.0Area 26.2 27.0 27.9 28.6 29.4 30.2 30.9 31.6 32.4 33.1
Capacity 78.6 81.2 84.0 86.8 89.7 92.7 95.7 98.9 102.1 105.3Area 33.7 34.3 34.8 35.4 35.9 36.4 36.9 37.5 38.0 38.5
Capacity 108.7 112.1 115.5 119.0 122.6 126.2 129.9 133.6 137.4 141.2Area 39.0 39.5 40.0 40.5 41.0 41.5 42.0 42.5 43.0 43.6
Capacity 145.1 149.0 153.0 157.0 161.1 165.2 169.4 173.6 177.9 182.2Area 44.2 44.8 45.4 46.1 46.8 47.6 48.5 49.4 50.5 51.4
Capacity 186.6 191.0 195.5 200.1 204.8 209.5 214.3 219.2 224.2 229.3Area 52.4 53.5 54.6 55.7 56.8 57.9 59.1 60.3 61.5 62.8
Capacity 234.5 239.8 245.2 250.7 256.3 262.0 267.9 273.9 280.0 286.2Area 64.0 65.3 66.6 67.9 69.1 70.2 71.4 72.5 73.8 75.2
Capacity 292.5 299.0 305.6 312.3 319.2 326.1 333.2 340.4 347.7 355.2Area 76.5 78.0 79.4 80.8 82.3 83.7 85.1 86.5 87.8 89.1
Capacity 362.8 370.5 378.4 386.4 394.5 402.8 411.3 419.9 428.6 437.4Area 90.3 91.6 92.8 94.0 95.2 96.4 97.7 99.0 100.3 101.5
Capacity 446.4 455.5 464.7 474.0 483.5 493.1 502.8 512.6 522.6 532.7Area 102.8 104.0 105.4 106.7 108.0 109.4 110.8 112.0 113.2 114.4
Capacity 542.9 553.2 563.7 574.3 585.1 595.9 606.9 618.1 629.3 640.7Area 115.5 116.7 117.8 119.0 120.2 121.4 122.6 123.8 125.0 126.3
Capacity 652.2 663.8 675.6 687.4 699.4 711.4 723.6 736.0 748.4 761.0
LAKE PONCA AREA-CAPACITY TABLEOKLAHOMA WATER RESOURCES BOARD
2010 SurveyCapacity in acre-feet by tenth foot elevation increments
Area in acres by tenth foot elevation increments
Elevation (ft NGVD)
937
947
946
938
940
939
957
956
955
954
953
952
943
942
941
945
944
951
950
949
948
14
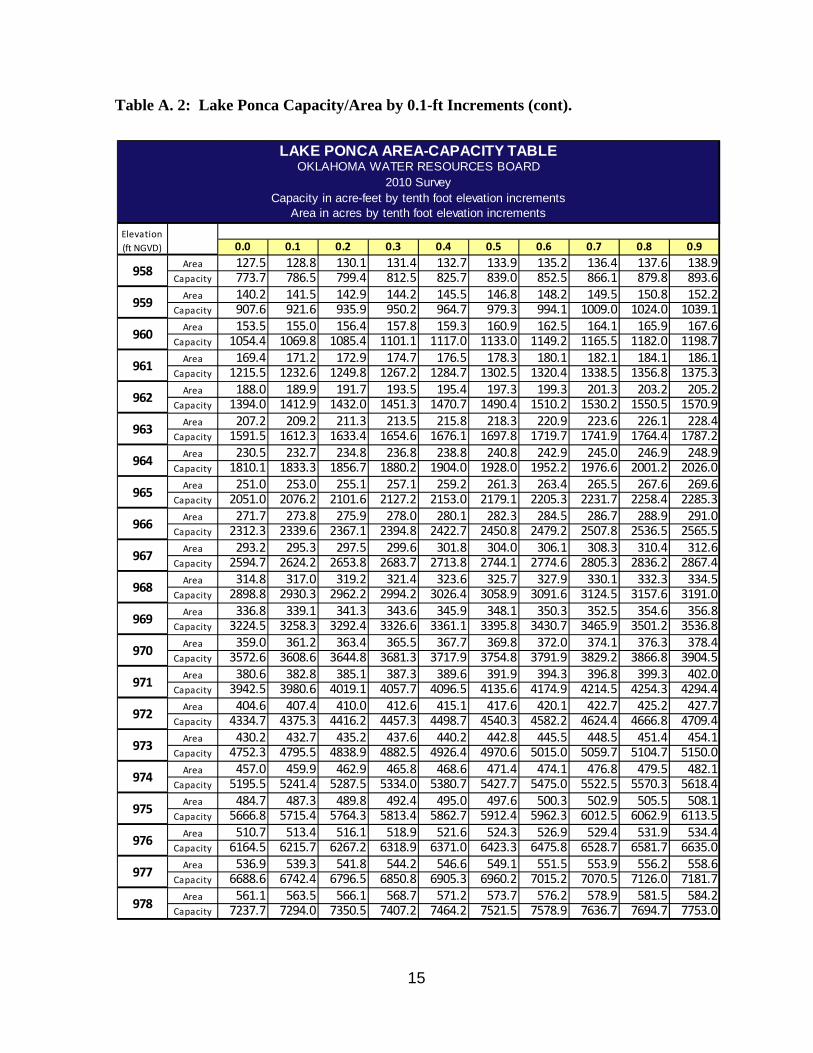
Table A. 2: Lake Ponca Capacity/Area by 0.1-ft Increments (cont).
0.0 0.1 0.2 0.3 0.4 0.5 0.6 0.7 0.8 0.9Area 127.5 128.8 130.1 131.4 132.7 133.9 135.2 136.4 137.6 138.9
Capacity 773.7 786.5 799.4 812.5 825.7 839.0 852.5 866.1 879.8 893.6Area 140.2 141.5 142.9 144.2 145.5 146.8 148.2 149.5 150.8 152.2
Capacity 907.6 921.6 935.9 950.2 964.7 979.3 994.1 1009.0 1024.0 1039.1Area 153.5 155.0 156.4 157.8 159.3 160.9 162.5 164.1 165.9 167.6
Capacity 1054.4 1069.8 1085.4 1101.1 1117.0 1133.0 1149.2 1165.5 1182.0 1198.7Area 169.4 171.2 172.9 174.7 176.5 178.3 180.1 182.1 184.1 186.1
Capacity 1215.5 1232.6 1249.8 1267.2 1284.7 1302.5 1320.4 1338.5 1356.8 1375.3Area 188.0 189.9 191.7 193.5 195.4 197.3 199.3 201.3 203.2 205.2
Capacity 1394.0 1412.9 1432.0 1451.3 1470.7 1490.4 1510.2 1530.2 1550.5 1570.9Area 207.2 209.2 211.3 213.5 215.8 218.3 220.9 223.6 226.1 228.4
Capacity 1591.5 1612.3 1633.4 1654.6 1676.1 1697.8 1719.7 1741.9 1764.4 1787.2Area 230.5 232.7 234.8 236.8 238.8 240.8 242.9 245.0 246.9 248.9
Capacity 1810.1 1833.3 1856.7 1880.2 1904.0 1928.0 1952.2 1976.6 2001.2 2026.0Area 251.0 253.0 255.1 257.1 259.2 261.3 263.4 265.5 267.6 269.6
Capacity 2051.0 2076.2 2101.6 2127.2 2153.0 2179.1 2205.3 2231.7 2258.4 2285.3Area 271.7 273.8 275.9 278.0 280.1 282.3 284.5 286.7 288.9 291.0
Capacity 2312.3 2339.6 2367.1 2394.8 2422.7 2450.8 2479.2 2507.8 2536.5 2565.5Area 293.2 295.3 297.5 299.6 301.8 304.0 306.1 308.3 310.4 312.6
Capacity 2594.7 2624.2 2653.8 2683.7 2713.8 2744.1 2774.6 2805.3 2836.2 2867.4Area 314.8 317.0 319.2 321.4 323.6 325.7 327.9 330.1 332.3 334.5
Capacity 2898.8 2930.3 2962.2 2994.2 3026.4 3058.9 3091.6 3124.5 3157.6 3191.0Area 336.8 339.1 341.3 343.6 345.9 348.1 350.3 352.5 354.6 356.8
Capacity 3224.5 3258.3 3292.4 3326.6 3361.1 3395.8 3430.7 3465.9 3501.2 3536.8Area 359.0 361.2 363.4 365.5 367.7 369.8 372.0 374.1 376.3 378.4
Capacity 3572.6 3608.6 3644.8 3681.3 3717.9 3754.8 3791.9 3829.2 3866.8 3904.5Area 380.6 382.8 385.1 387.3 389.6 391.9 394.3 396.8 399.3 402.0
Capacity 3942.5 3980.6 4019.1 4057.7 4096.5 4135.6 4174.9 4214.5 4254.3 4294.4Area 404.6 407.4 410.0 412.6 415.1 417.6 420.1 422.7 425.2 427.7
Capacity 4334.7 4375.3 4416.2 4457.3 4498.7 4540.3 4582.2 4624.4 4666.8 4709.4Area 430.2 432.7 435.2 437.6 440.2 442.8 445.5 448.5 451.4 454.1
Capacity 4752.3 4795.5 4838.9 4882.5 4926.4 4970.6 5015.0 5059.7 5104.7 5150.0Area 457.0 459.9 462.9 465.8 468.6 471.4 474.1 476.8 479.5 482.1
Capacity 5195.5 5241.4 5287.5 5334.0 5380.7 5427.7 5475.0 5522.5 5570.3 5618.4Area 484.7 487.3 489.8 492.4 495.0 497.6 500.3 502.9 505.5 508.1
Capacity 5666.8 5715.4 5764.3 5813.4 5862.7 5912.4 5962.3 6012.5 6062.9 6113.5Area 510.7 513.4 516.1 518.9 521.6 524.3 526.9 529.4 531.9 534.4
Capacity 6164.5 6215.7 6267.2 6318.9 6371.0 6423.3 6475.8 6528.7 6581.7 6635.0Area 536.9 539.3 541.8 544.2 546.6 549.1 551.5 553.9 556.2 558.6
Capacity 6688.6 6742.4 6796.5 6850.8 6905.3 6960.2 7015.2 7070.5 7126.0 7181.7Area 561.1 563.5 566.1 568.7 571.2 573.7 576.2 578.9 581.5 584.2
Capacity 7237.7 7294.0 7350.5 7407.2 7464.2 7521.5 7578.9 7636.7 7694.7 7753.0
OKLAHOMA WATER RESOURCES BOARD2010 Survey
965
976
975
974
973
972
971
978
977
958
964
LAKE PONCA AREA-CAPACITY TABLE
968
967
966
Capacity in acre-feet by tenth foot elevation incrementsArea in acres by tenth foot elevation increments
Elevation (ft NGVD)
963
962
961
960
959
970
969
15
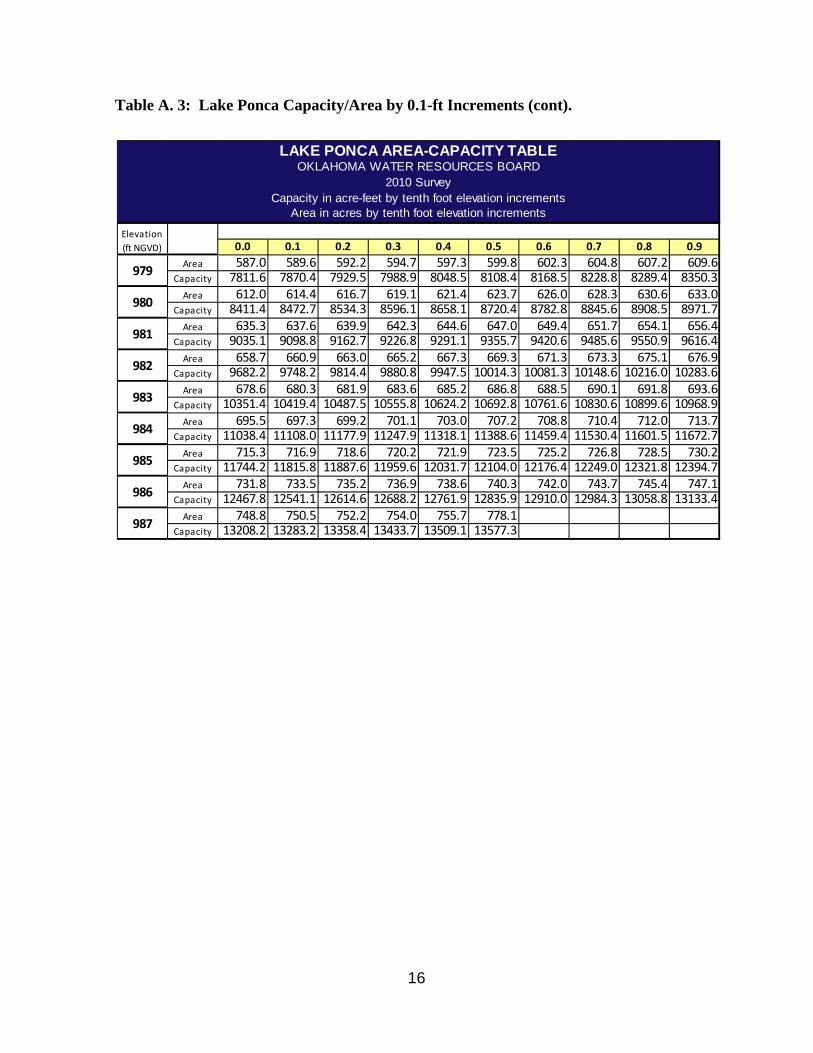
Table A. 3: Lake Ponca Capacity/Area by 0.1-ft Increments (cont).
0.0 0.1 0.2 0.3 0.4 0.5 0.6 0.7 0.8 0.9Area 587.0 589.6 592.2 594.7 597.3 599.8 602.3 604.8 607.2 609.6
Capacity 7811.6 7870.4 7929.5 7988.9 8048.5 8108.4 8168.5 8228.8 8289.4 8350.3Area 612.0 614.4 616.7 619.1 621.4 623.7 626.0 628.3 630.6 633.0
Capacity 8411.4 8472.7 8534.3 8596.1 8658.1 8720.4 8782.8 8845.6 8908.5 8971.7Area 635.3 637.6 639.9 642.3 644.6 647.0 649.4 651.7 654.1 656.4
Capacity 9035.1 9098.8 9162.7 9226.8 9291.1 9355.7 9420.6 9485.6 9550.9 9616.4Area 658.7 660.9 663.0 665.2 667.3 669.3 671.3 673.3 675.1 676.9
Capacity 9682.2 9748.2 9814.4 9880.8 9947.5 10014.3 10081.3 10148.6 10216.0 10283.6Area 678.6 680.3 681.9 683.6 685.2 686.8 688.5 690.1 691.8 693.6
Capacity 10351.4 10419.4 10487.5 10555.8 10624.2 10692.8 10761.6 10830.6 10899.6 10968.9Area 695.5 697.3 699.2 701.1 703.0 707.2 708.8 710.4 712.0 713.7
Capacity 11038.4 11108.0 11177.9 11247.9 11318.1 11388.6 11459.4 11530.4 11601.5 11672.7Area 715.3 716.9 718.6 720.2 721.9 723.5 725.2 726.8 728.5 730.2
Capacity 11744.2 11815.8 11887.6 11959.6 12031.7 12104.0 12176.4 12249.0 12321.8 12394.7Area 731.8 733.5 735.2 736.9 738.6 740.3 742.0 743.7 745.4 747.1
Capacity 12467.8 12541.1 12614.6 12688.2 12761.9 12835.9 12910.0 12984.3 13058.8 13133.4Area 748.8 750.5 752.2 754.0 755.7 778.1
Capacity 13208.2 13283.2 13358.4 13433.7 13509.1 13577.3
983
987
986
985
984
LAKE PONCA AREA-CAPACITY TABLEOKLAHOMA WATER RESOURCES BOARD
2010 SurveyCapacity in acre-feet by tenth foot elevation increments
Area in acres by tenth foot elevation increments
Elevation (ft NGVD)
982
981
980
979
16
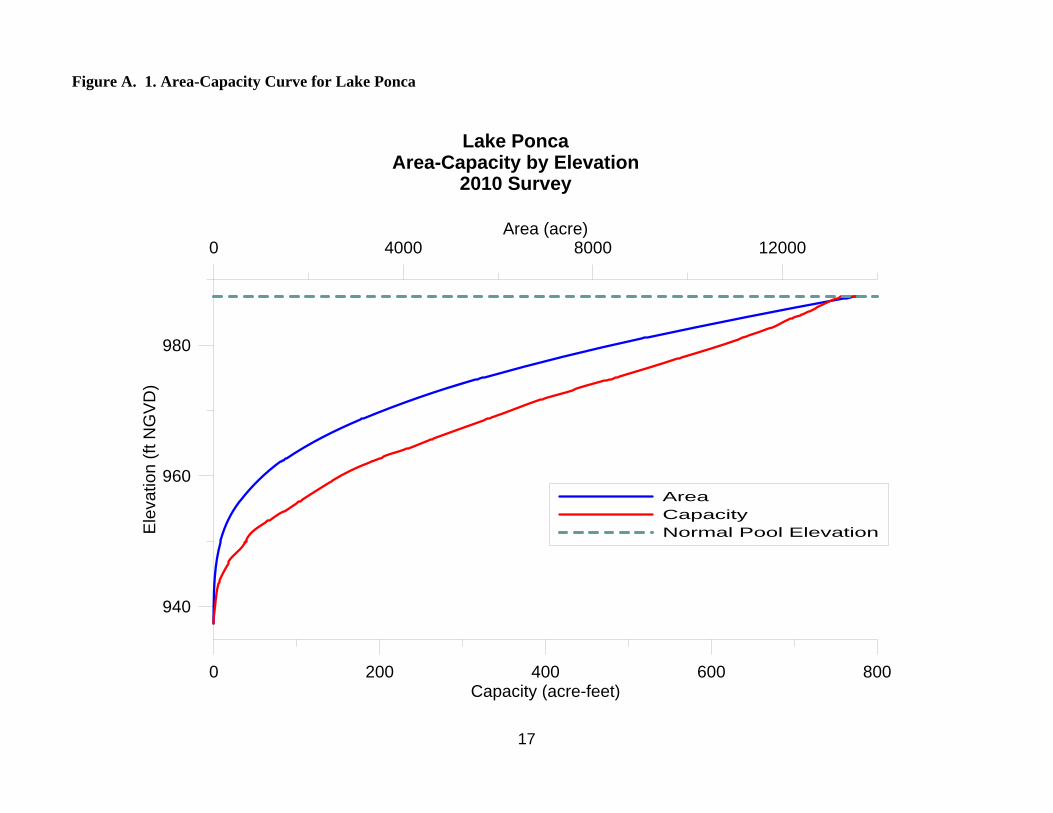
Figure A. 1. Area-Capacity Curve for Lake Ponca
0 200 400 600 800Capacity (acre-feet)
940
960
980
Ele
vatio
n (ft
NG
VD
)
0 4000 8000 12000Area (acre)
AreaCapacityNormal Pool Elevation
Lake PoncaArea-Capacity by Elevation
2010 Survey
17


APPENDIX B: Lake Ponca Maps
19
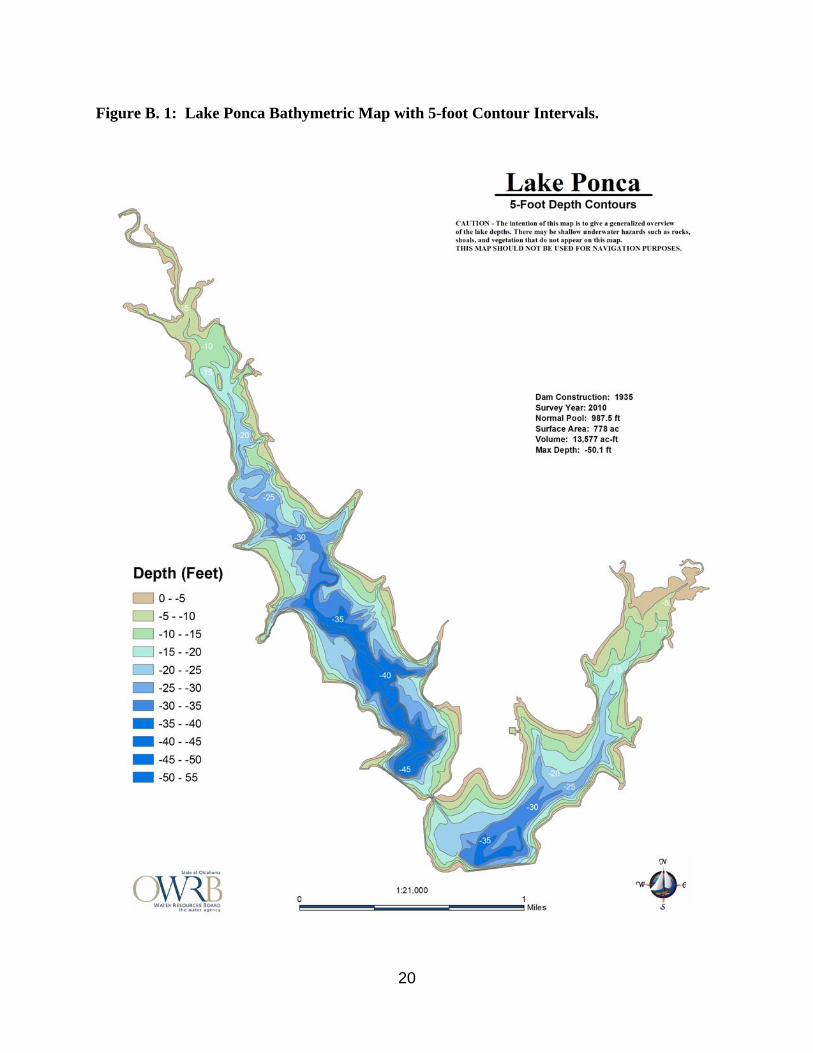
Figure B. 1: Lake Ponca Bathymetric Map with 5-foot Contour Intervals.
20
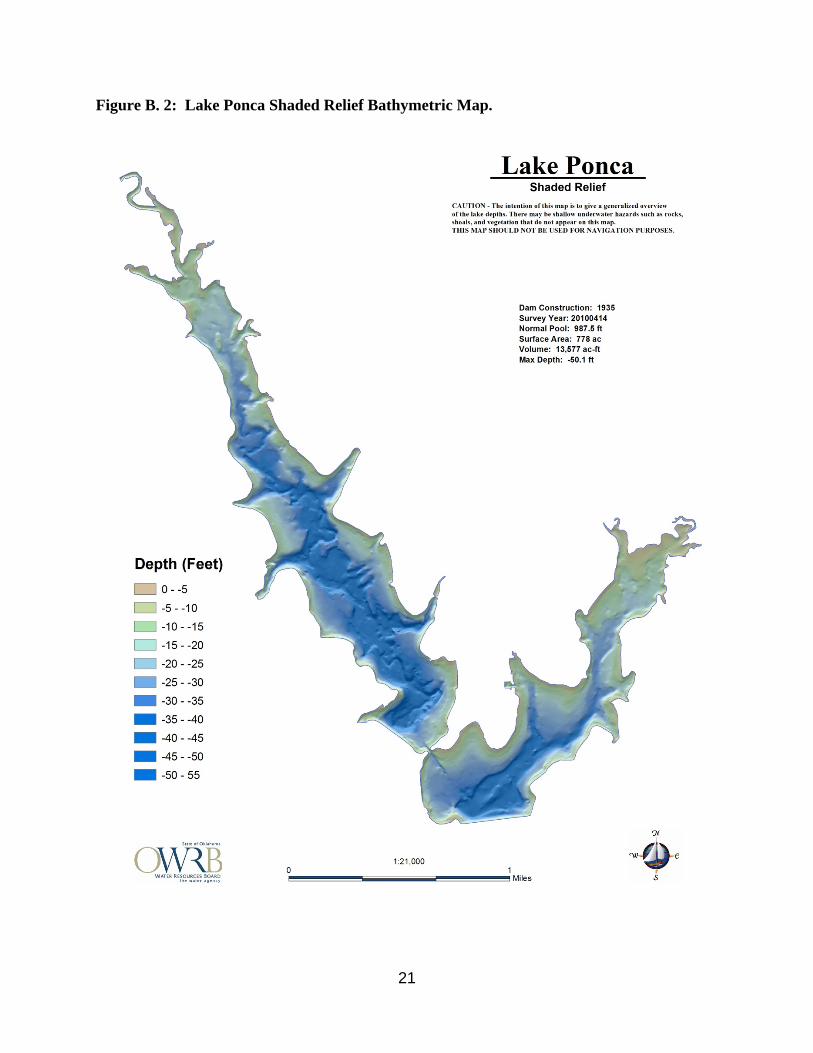
Figure B. 2: Lake Ponca Shaded Relief Bathymetric Map.
21
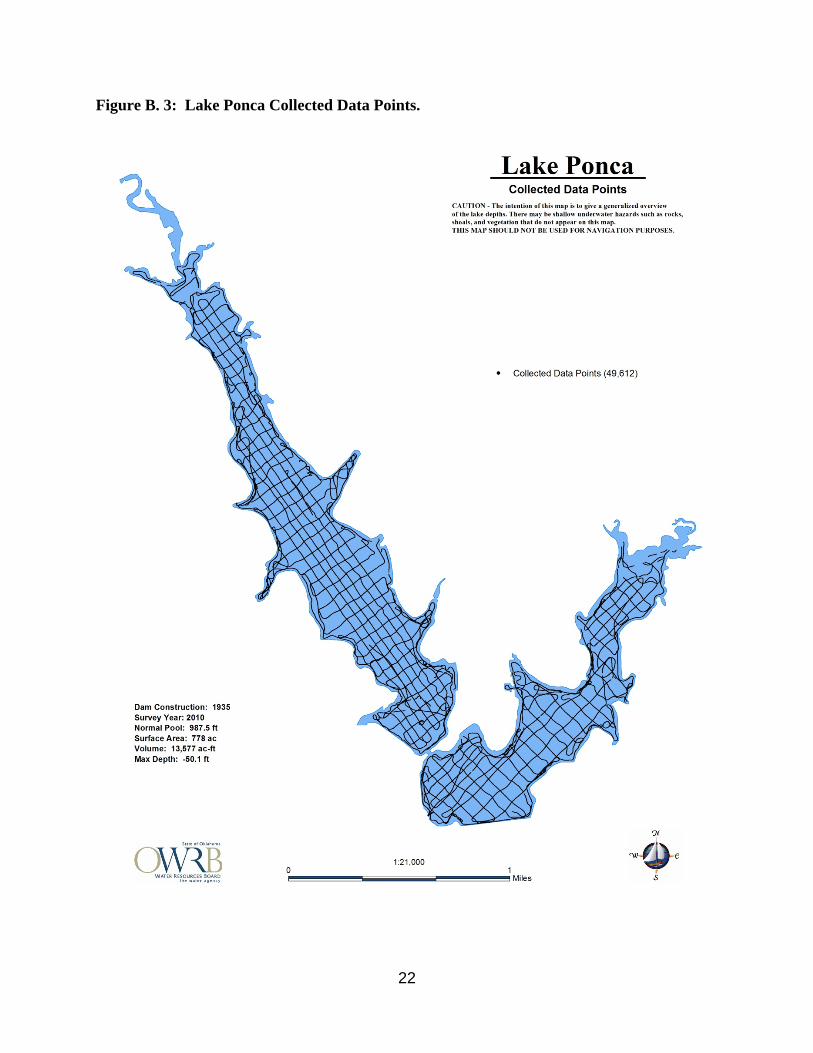
Figure B. 3: Lake Ponca Collected Data Points.
22