Embed Size (px)
Citation preview
· FISH ASSEMBLAGES IN MURUM HYDROELECTRIC RESERVOIR AND PLIERAN RIVER, BELAGA, SARAWAK
Kirollina Klsun
Bachelor of Science with Honours QL (Aquatic Resource Science and Management)639.1 2015 K46 2015

I
ACKNOWLEDGMENT
I would like to give thanks to God Almighty for helping me in the process of
writing this report. Never indeed He leaves me even before, during and after the whole
process. I would also like to express my whole gratitude to my supervisor, Prof. Dr. Lee
Nyanti for the endless guidance throughout the project and in writing the report.
I am also grateful for the helps from laboratory assistants of the Department of
Aquatic Science, FRST for the numerous assistance, especially Mr. Zaidi Ibrahim, Mr.
Mustafa Kamal, Mr. Richard Toh, Mr. Nasri Latib, Mr. Mohd Nor Azlan and Mdm. Lucy
Daru during the field works and at the laboratory.
Besides, I am also thankful to the postgraduates’ students who advised, guided and
help me during the field works and at the laboratory, especially to Ms. Angie Sapis, Ms.
Nur Ezaimah and Ms. Hafida Bolhen.
To my father, Mr. Yordanus Kisun Patong and my mother, Mdm. Lindy Alung, I
am so blessed to receive their never-ending support throughout the progress of my final
year project. I would also like to thank all of my friends who helped me in the laboratory
and report writing, especially to Juliana Sambai Sibat, Nur Ezzaty Nazarudin, Noor
Iskandar Noor Azhar, Goh Hao Chin, Jerome Japok, Danial Nakhaie and Krisn Sumeet
Prasad. Without their help, I would certainly never be able to complete my final year
project.
Last but not least, I would like to thank Sarawak Energy Berhad for the grant, GL
(F07)/SEB/4A/2013 (24)), that enables me to do my final year project.

II
DECLARATION
I hereby declare that no portion of this dissertation has been submitted in support of an
application for another degree of qualification of this or any other university or institution
of higher learning.
__________________________
KIROLLINA KISUN
Aquatic Resource Science and Management
Department of Aquatic Science
Faculty of Resource Science and Technology
Universiti Malaysia Sarawak

III
The project entitled “Fish Assemblages in Murum Hydroelectric Reservoir and Plieran
River, Belaga, Sarawak” was prepared by Kirollina Kisun and submitted to the Faculty of
Resource Science and Technology in partial fulfillment of the requirements for the Degree
of Bachelor of Science (Honours) in Aquatic Science and Resource Management.
Received for examination by:
________________________
Date:
________________________
IV
TABLE OF CONTENTS
PAGE
Acknowledgement …………………………………………………………………
Declaration ……….…..…………………………………………………………….
I
II
Table of Contents ………………………………………………………………….. IV
List of Abbreviations ……………………………………………………………… VII
List of Tables ………………………………………………………………………
List of Figures ……………………………………………………………………...
List of Apendices …………………………………………………………………..
VIII
IX
X
Abstract …………………………………………………………………………..... 1
1.0 INTRODUCTION ............................................................................................ 2
2.0 LITERATURE REVIEW ……………………………………………………
2.1 Freshwater Ecosystems .………………………………………………..
2.1.1 Reservoirs and Dams ………………………………………...
2.1.2 Rivers ………………………………………………………...
2.2 Freshwater Fish ………………………………………………………...
2.3 Alterations in Natural River Environment ……………………………..
2.4 Length-Weight Relationship (LWR) …………………………………..
2.5 Food and Feeding Habit ……………………………………………….
2.6 Water Quality and its Parameters ……………………………………...
2.6.1 Temperature ………………………………………………….
2.6.2 Total Suspended Solids (TSS) ……………………………….
2.6.3 Chlorophyll a (Chl a) ..………………………………………
2.6.4 Turbidity ……………………………………………………..
2.6.5 Dissolved Oxygen (DO) ……………………………………..
2.6.6 Biological Oxygen Demand (BOD5) ………………………..
2.6.7 pH ……………………………………………………………
4
4
4
5
6
7
8
9
9
9
10
10
11
11
11
12
V
3.0 METHODOLOGY …………………………………………………………...
3.1 Study Site ………………………………………………………………
3.2 Study Methods …………………………………………………………
3.2.1 Fish Sampling ………………………………………………..
3.2.2 Fish Identification ……………………………………………
3.2.3 Fish Measurement ……………………………………………
3.2.4 Length-Weight Relationship (LWR) ………………………...
3.2.5 Stomach Content Analyses …………………………………..
3.2.6 Fish Preservation ……………………………………………..
3.2.7 Indices ………………………………………………………..
3.2.8 Water Quality Parameter …………………………………….
3.2.8.1 Sampling of water ………………………………….
3.2.8.2 Chlorophyll a ………………………………………
3.2.8.3 Total Suspended Solids …………………………….
3.2.8.4 Biological Oxygen Demand (BOD5) ………………
3.3 Water Quality Analysis ………………………………………………...
4.0 RESULTS ……………………………………………………………………..
4.1 Fish Composition ………………………………………………………
4.2 Length-Weight Relationship (LWR) …………………………………..
4.3 Stomach Content Analysis ……………………………………………..
4.4 Indices ………………………………………………………………….
4.5 In situ Parameters ………………………………………………………
4.5.1 Water depth and transparency ………………………………….
4.5.2 Dissolved oxygen (DO) ………………………………………..
4.5.3 Temperature ……………………………………………………
4.5.4 pH ………………………………………………………………
4.5.5 Turbidity ……………………………………………………….
4.6 Ex situ Parameters ……………………………………………………...
4.6.1 Chlorophyll a (Chl a) …………………………………………..
12
12
15
15
15
15
15
16
17
18
18
19
19
20
21
21
22
22
24
28
29
30
30
31
32
33
34
35
35

VI
4.6.2 Total Suspended Solids (TSS) …………………………………
4.6.3 Biological Oxygen Demand (BOD5) …………………………..
4.7 Correlation in Principle Component Analysis …………………………
5.0 DISCUSSION …………………………………………………………………
6.0 CONCLUSION ……………………………………………………………….
7.0 REFERENCE …………………………………………………………………
8.0 APPENDIX ……………………………………………………………………
36
37
37
39
44
45
50

VII
LIST OF ABBREVIATIONS
TL Total Length
SL Standard Length
BW Body Weight
TSS Total Suspended Solids
H’ Shannon-Weaver’s Diversity
Index
D Margalef’s Species Richness
Index
J’ Pielou’s Evenness Index
DO Dissolved Oxygen
LWR Length-Weight Relationship
NTU Nephelometric Turbidity Units
mg/L Milligram per Litre
Chl-a Chlorophyll-a
MW Mega Watt
VIII
LIST OF TABLES
Title Page
Table 1 Stations with coordinates and net (mesh sizes) with coordinates.
15
Table 2 Family, species, number of fish caught and percentage in July
2014 (dry season).
25
Table 3 Family, species and number of fish caught in February 2015
(wet season).
26
Table 4 Length-weight relationship and condition factor for fish species
in two sampling periods (season).
30
Table 5 Frequency of occurrence, volumetric analysis index and
Importance Index.
31
Table 6 Species Diversity, Species Richness and Species Evenness in
two sampling periods (season).
32
Table 7 Depth and transparency for both samplings in July 2014 and
February 2015.
33
Table 8 Percentage of variance with three components in July 2014 and
in February 2015.
40
Table 9 Correlation of selected water quality parameters with fish
abundance in July 2014 and February 2015 with 3 components
with three components.
41
IX
LIST OF FIGURES
Title Page
Figure 1 Map of Murum Dam and Plieran River.
14
Figure 2 Length-weight relationship of Barbodes binotatus July 2014.
27
Figure 3 Length-weight relationship of Oreochromis niloticus in July
2014.
27
Figure 4 Length-weight relationship of Lobocheilos bo in July 2014.
28
Figure 5 Length-weight relationship of Hampala bimaculata in February
2015.
28
Figure 6 Length-weight relationship of Barbonymus schwanenfeldii in
February 2015.
29
Figure 7 Length-weight relationship of Oreochromis niloticus in
February 2015.
29
Figure 8 Dissolved oxygen values in July 2014 (dry season) and in
February 2015 (wet season).
34
Figure 9 Temperature values in dry season (July 2014) and wet season
(February 2015).
35
Figure 10 pH values in dry season (July 2014) and wet season (February
2015).
36
Figure 11 Turbidity values in dry season (July 2014) and wet season
(February 2015).
37
Figure 12
Chlorophyll a values in July 2014 (dry season) and February
2015 (wet season).
38
Figure 13 TSS values in July 2014 (dry season) and February 2015 (wet
season).
39
Figure 14 BOD5 values in July 2014 (dry season) and February 2015
(wet season).
39

X
LIST OF APPENDICES
Title Page
Appendix 1 Detritus in stomach content
50
Appendix 2 Insect parts in content content
50
Appendix 3 Fish found in stomach content
50
1
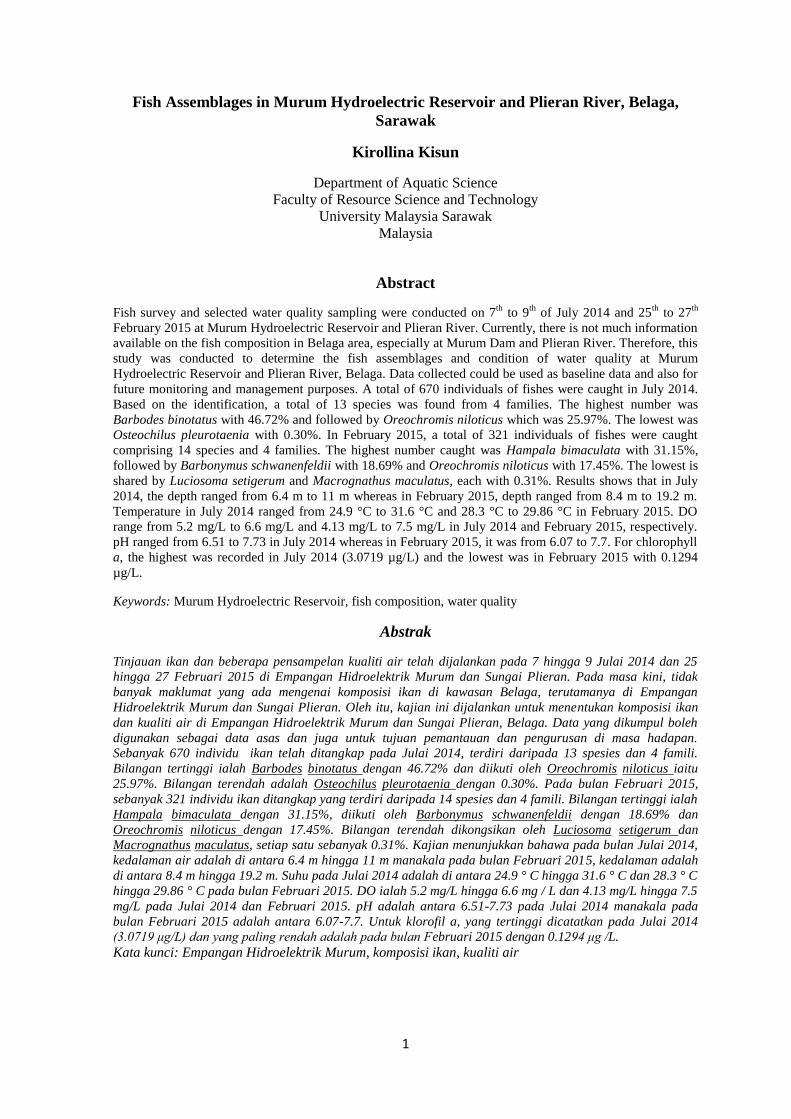
Fish Assemblages in Murum Hydroelectric Reservoir and Plieran River, Belaga,
Sarawak
Kirollina Kisun
Department of Aquatic Science
Faculty of Resource Science and Technology
University Malaysia Sarawak
Malaysia
Abstract
Fish survey and selected water quality sampling were conducted on 7th
to 9th
of July 2014 and 25th
to 27th
February 2015 at Murum Hydroelectric Reservoir and Plieran River. Currently, there is not much information
available on the fish composition in Belaga area, especially at Murum Dam and Plieran River. Therefore, this
study was conducted to determine the fish assemblages and condition of water quality at Murum
Hydroelectric Reservoir and Plieran River, Belaga. Data collected could be used as baseline data and also for
future monitoring and management purposes. A total of 670 individuals of fishes were caught in July 2014.
Based on the identification, a total of 13 species was found from 4 families. The highest number was
Barbodes binotatus with 46.72% and followed by Oreochromis niloticus which was 25.97%. The lowest was
Osteochilus pleurotaenia with 0.30%. In February 2015, a total of 321 individuals of fishes were caught
comprising 14 species and 4 families. The highest number caught was Hampala bimaculata with 31.15%,
followed by Barbonymus schwanenfeldii with 18.69% and Oreochromis niloticus with 17.45%. The lowest is
shared by Luciosoma setigerum and Macrognathus maculatus, each with 0.31%. Results shows that in July
2014, the depth ranged from 6.4 m to 11 m whereas in February 2015, depth ranged from 8.4 m to 19.2 m.
Temperature in July 2014 ranged from 24.9 °C to 31.6 °C and 28.3 °C to 29.86 °C in February 2015. DO
range from 5.2 mg/L to 6.6 mg/L and 4.13 mg/L to 7.5 mg/L in July 2014 and February 2015, respectively.
pH ranged from 6.51 to 7.73 in July 2014 whereas in February 2015, it was from 6.07 to 7.7. For chlorophyll
a, the highest was recorded in July 2014 (3.0719 µg/L) and the lowest was in February 2015 with 0.1294
µg/L.
Keywords: Murum Hydroelectric Reservoir, fish composition, water quality
Abstrak
Tinjauan ikan dan beberapa pensampelan kualiti air telah dijalankan pada 7 hingga 9 Julai 2014 dan 25
hingga 27 Februari 2015 di Empangan Hidroelektrik Murum dan Sungai Plieran. Pada masa kini, tidak
banyak maklumat yang ada mengenai komposisi ikan di kawasan Belaga, terutamanya di Empangan
Hidroelektrik Murum dan Sungai Plieran. Oleh itu, kajian ini dijalankan untuk menentukan komposisi ikan
dan kualiti air di Empangan Hidroelektrik Murum dan Sungai Plieran, Belaga. Data yang dikumpul boleh
digunakan sebagai data asas dan juga untuk tujuan pemantauan dan pengurusan di masa hadapan.
Sebanyak 670 individu ikan telah ditangkap pada Julai 2014, terdiri daripada 13 spesies dan 4 famili.
Bilangan tertinggi ialah Barbodes binotatus dengan 46.72% dan diikuti oleh Oreochromis niloticus iaitu
25.97%. Bilangan terendah adalah Osteochilus pleurotaenia dengan 0.30%. Pada bulan Februari 2015,
sebanyak 321 individu ikan ditangkap yang terdiri daripada 14 spesies dan 4 famili. Bilangan tertinggi ialah
Hampala bimaculata dengan 31.15%, diikuti oleh Barbonymus schwanenfeldii dengan 18.69% dan
Oreochromis niloticus dengan 17.45%. Bilangan terendah dikongsikan oleh Luciosoma setigerum dan
Macrognathus maculatus, setiap satu sebanyak 0.31%. Kajian menunjukkan bahawa pada bulan Julai 2014,
kedalaman air adalah di antara 6.4 m hingga 11 m manakala pada bulan Februari 2015, kedalaman adalah
di antara 8.4 m hingga 19.2 m. Suhu pada Julai 2014 adalah di antara 24.9 ° C hingga 31.6 ° C dan 28.3 ° C
hingga 29.86 ° C pada bulan Februari 2015. DO ialah 5.2 mg/L hingga 6.6 mg / L dan 4.13 mg/L hingga 7.5
mg/L pada Julai 2014 dan Februari 2015. pH adalah antara 6.51-7.73 pada Julai 2014 manakala pada
bulan Februari 2015 adalah antara 6.07-7.7. Untuk klorofil a, yang tertinggi dicatatkan pada Julai 2014
(3.0719 μg/L) dan yang paling rendah adalah pada bulan Februari 2015 dengan 0.1294 μg /L.
Kata kunci: Empangan Hidroelektrik Murum, komposisi ikan, kualiti air
2
1.0 Introduction
Murum Hydroelectric Dam is the third proposed dam-building project after Batang Ai
Hydroelectric Dam and Bakun Dam in Sarawak. The dam is located about 70 kilometers
upstream of Bakun Hydroelectric Dam and is designed to accommodate four sets of 236
MW Francis turbine generating units with total installed capacity of 944 MW (Sinohydro
Bureau, 2009). A total of 1,415 people are directly affected by the proposed Murum Dam
Project, comprised of Penan and Kenyah Badeng. These communities of people rely on
fisheries and hunter-gatherer at the river and forest nearby (Sarawak Energy, n. d.).
According to Matthews (1998), an understanding of the dramatic changes towards the
environment affecting community structure is a major focus of aquatic ecology. Among the
most enormous and drastic disturbances is damming of rivers for hydroelectric power
generation, flood control, recreational uses and water storage (Brooker, 1981; Benke, 1990;
Collier et al., 1996). Hydroelectric dam operation and water extractions for irrigation of
agriculture activities have been broadly stated as alterations to natural flow regimes of
riverine ecosystem (Ward & Stanford, 1983; Petts, 1984; Poof & Allan, 1997; Magilligan
& Nislow, 2005; Jorde et al., 2008). As reported by Quinn and Kwak (2003), the
impoundment of dam had changed freshwater fish assemblage considerably even in short
period of time.
According to Ahmad and Khairul Adha (2007), freshwater fishes of Malaysia are diverse
and some species are endemic. Some researches done have shown that more than 100 and
200 species were reported in Sabah and Sarawak respectively. However, the figures are
believed to be underestimated as the exact number is actually poorly inventoried. Records
of freshwater fish fauna have been documented in certain area in Sarawak such as in lower
Baram River (Watson & Balon, 1984) and Bario, Kelabit Highlands (Nyanti et al., 1999).
3
However, in the newly formed Murum Hydroelectric Reservoir, fish composition has not
been studied.
Therefore, this study was conducted to document the fish community in Murum
Hydroelectric Reservoir and Plieran River.
Thus, the objectives of this study were to:
i. Document the fish composition in Murum Hydroelectric Reservoir and
Plieran River,
ii. Record the selected water quality parameters in Murum Hydroelectric
Reservoir and Plieran River, and
iii. Provide a baseline data on fish composition with selected water quality
parameters in Murum Hydroelectric Reservoir and Plieran River.
4
2.0 Literature review
2.1 Freshwater Ecosystems
2.1.1 Reservoirs and Dams
According to Soewardi et al. (1987), rivers, swamps and lakes are natural water bodies
whereas reservoirs are known as artificial water bodies or man-made lake. Based on the
original flow of water, there are two types of reservoirs which are riverine reservoirs (from
a river) and flood-plain lakes (from a swamp). Basically, reservoirs that serve human
purposes came from the riverine reservoirs.
Small reservoirs or known as single-purpose reservoirs are made to serve for water supply
(irrigation) whereas larger reservoirs (multi-purpose reservoirs) are made not only for
irrigation but also for flood control, hydroelectric power generation as well as water supply
for industries and human settlement (Soewardi et al., 1987).
According to Morrow and Fischenich (2000), lentic habitats include natural lakes, small
impoundments and parts of most mainstream reservoirs, some low-gradient natural
streams, and some canals. A lentic habitat is one in which water does not have a regular
and measurable flow. Unlike lotic habitats, the water column in most lentic habitats
thermally stratifies. The interaction of stratified water column and water quality, especially
dissolved oxygen has profound effects on fish community (Morrow & Fischenich, 2000).
However, Richter et al. (1997) and Rosenberg et al. (1997) stated that reservoirs are the
vital threats to aquatic biodiversity at global and regional scales.
Basically, about 39,000 large dams (≥ 15 m in height) has been built worldwide to provide
agricultural, hydropower, flood control and recreational benefits (Dynesius and Nilsson,
1994; Rosenberg et al., 2000). For the past 20 years, reservoir constructions have
decreased (Postel et al., 1996; Rosenberg et al., 2000). However, projects such as the Three
5
Gorges development in China and various small projects in northern Canada indicate
continued interest in reservoir construction (Rosenberg et al., 1997).
Lots of studies have been done to investigate effects of impoundments towards lotic
environments (Agostinho et al., 2008). Through their purposes, reservoirs contribute to the
development of local and regional economy. However, the process of building up a
reservoir has a huge impact towards the aquatic ecosystem of the area (Agostinho et al.,
2008). In order to build a dam, the area should be cleared and deforestation takes place and
this eventually disturbs the natural fish habitat. Agostinho et al. (2008) claimed that dams
promote discharge control which then alters the seasonal cycles of floods and thus,
influence fish composition and assemblages. Besides that, they also stated that among all
human activities in the basin, dams have been the most destructive because they modify the
regime flow of rivers throughout the region. An avoidable effect is the change in fish
composition and abundance and this will eventually increase certain species while
decreases others or even cut off the species.
2.1.2 Rivers
Freshwater ecosystems occupy approximately 0.8% of the Earth’ surface (Gleick, 1996).
According to Ng (2011), the main geographical distribution of freshwater ecosystems
consists of lakes, rivers, streams and ponds, which house most of the freshwater fish
species. River is a natural water body where it is also known as lotic waters or running
waters (Arrignon, 1999). Arrignon (1999) also states that development in lotic waters is
dependent on their quality, productivity and ability to provide suitable conditions for fish
life where all these parameters are interdependent. Thus, the hydrographic network
comprising streams and small rivers is certainly the most fragile.
6
2.2 Freshwater fish
‘Freshwater fish’ is defined as fish species that spend their adult lives and breed in
freshwater beyond tidal influence (Lim & Tan, 2002). Generally, habitats for most
freshwater fish are fast flowing water with partially or well-shaded, substrate consists of
mud, sand, silt and rocky bottom. According to Agostinho et al. (2008), the estimated
number of freshwater fish worldwide is 13,000, where most species of freshwater fishes
live in tropical regions. Freshwater fish comprised of 42 % among vertebrates which is
about 8275 species (Marshall, 2000).
It is believed that the Sunda River which is situated in Indonesia, incorporated all or nearly
all of the drainage area of eastern and southwestern Malay Peninsula, northern Sumatra,
western and southwestern Borneo and northeastern Java. Mohsin and Ambak (1983) stated
that the Sunda River Basin has been populated by the most diverse composition of largely
endemic ichthyofauna. Thus, it has been a vital place for lots of fish groups, most notably
the ostariophysan family Cyprinidae, Gyrinocheilidae, Homalopteridae, Cobitidae,
Bagridae, Pangasiidae and Siluridae, and the non-ostariophysan suborder Anabantoidea.
The beginning of ichthyology work on freshwater fish in Borneo was by Pieter Bleeker
from 1851 until 1860 which documented almost all the fish found in Borneo (Inger &
Chin, 1990). Malaysia has among the highest distribution of freshwater fish. Khan et al.
(1996) recorded about 380 fishes whereas Inger & Chin (1962), Roberts (1989) and
Kottelat et al. (1993) documented about 300 freshwater fishes. Kottelat et al. (1993) stated
that 249 are found inhabiting inland water of Sarawak and Brunei.
Several works on documenting freshwater fish in Sarawak has been done. Watson & Balon
(1984) have reported that 57 species of fish are found in Baram Basin. About 66% species
are dominated by Cyprinidae family in upper rivers of Rajang Basin (Nyanti et al., 1995)
7
and Leh (2000) has done the checklist for Lanjak-Entimau Wildlife Sanctuary, which
reported the presence of 56 species of fishes from 10 families are found. About 24 species
from 7 families and 9 genera was recorded in Loagan Bunut (Nyanti et al., 2004) and 33
species from 23 families was recorded at Lutong River, Miri (Nyanti et al., 2012).
Other studies include the Kelabit-Bario Highland River (Nyanti et al., 1998), Katibas River
(Rachmatika et al., 1998), Layar River and Spak River, Betong (Kelvin et al., 2002), and
Ba’ Kelalan Highland (Kelvin et al., 2003a). Besides that, checklists have also been done
at Bakong River (Kelvin et al., 2003b), Lemanak River, Engkilili (Lee, 2004) and Batang
Kerang, Balai Ringin (Khairul Adha et al., 2009).
2.3 Alterations in Natural River Environment
Damming of river creates a new ecosystem with different biodiversity and new structure
(Agostinho et al., 2008). Thus, the impoundment creates an impact towards the natural
river flows. Though describing a single hydrological attribute, water flow represents the
main force behind freshwater ecosystems, and it is responsible for their
geological/hydrological structure, productive dynamics (matter and energy), nutrient
cycling and the distribution and evolution of the biota (Poff et al., 1997).
According to Nilsson et al. (2005), the consequence of losing the natural river flows has
high impact due to the alterations being made to the hydrological ecosystems, historical
patterns of biological production, distribution of biodiversity in spatial and temporal
elements, and changes in functions of aquatic ecosystems. Agostinho et al. (2008) stated
that due to the impoundment, fish diversity will be greatly reduced as some species are
locally eliminated and others become dominant and numerous. In addition, rivers that have
been dammed would trap populations within segments with inadequate conditions for
development, feeding and recruitment, thus promoting local extinctions. The alterations on
8
natural river flow affect aquatic habitat and also disturbs the biodiversity of organisms of
the area (Agostinho et al., 2008).
2.4 Length-Weight Relationship (LWR)
Study on the length-weight relationship is important in fish biology as a tool to indicate
fatness, well-being, gonadal development with relation to the environment and fluviatile
condition of their habitat (Kohler et al., 1995). Krause et al. (1998) stated that LWR can be
used to estimate the length and age, and the dynamic in a population. The growth rate and
mortality rates can also be derived from LWR (Kohler et al., 1995). According to
Anderson & Gutreuter (1983) and Gayanilo et al. (1997), the biomass from length
frequency distribution can be recorded from LWR. Besides that, fish conditions (Petrakis
& Stergiou, 1995), stock assessment (Abowei et al., 2009), management of population of
fish and estimating standing stock biomass, and comparing the development history of fish
community from different regions can also be derived (Petrakis & Stergiou, 1995).
From the LWR, the well-being of the fish can be recorded (Le Cren, 1951). Thus, it reflects
the condition of fish in its habitat; the heavier the fish, the better the psychological
condition, which means that fish in the area feeds more (Bagenal & Tesch, 1978). Besides
that, from the coefficient values derived from LWR data, it shows the index in
understanding lifecycle of fish (Schneider et al., 2000). Both biotic and abiotic factors
affect condition factor of fish. Thus, this parameter can be used to determine the level of
condition of the aquatic ecosystem; whether it is good or bad (Anene, 2005).
The relationship between the weight and length of a fish can be expressed by the equation
W = aLb
(Ricker, 1973). Then, a logarithmic formula will be used to obtain a linear
expression. The b value indicated the type of growth of fish, b = 3 (isometric or normal
growth rate), b > 3 (positive allometric or over growth rate) and b < 3 (negative allometric
9
or poor growth rate). A formula, K = 100 W/L3 will be used to determine the Fulton’s
condition factor (K). According to the metric indicator, the higher the value of K, condition
of fish will be better.
2.5 Food and Feeding Habit
According to Hartley (1948) when one species of fish dominates an area, the other
members of the community in which that species live are considered chiefly as predators or
as potential foods. Schrader (1989) divides fish into 4 categories based on the diet of the
fish; invertivores, herbivores, omnivores and piscivores. Invertivores are fish that consume
mostly invertebrates, whereas omnivores consume invertebrates, fish and plant. Herbivores
consume mostly plants, whereas piscivores consume mostly fish.
2.6 Water Quality and its Parameters
Rivers frequently act as conduits for pollutants by collecting and carrying waste water from
catchments and ultimately discharging it into the ocean. Water quality is closely linked to
the surrounding environment and land use. Other than in its vapor form, water is never
pure and is affected by community uses such as agriculture, urban and industrial use, and
recreation. The modification of natural stream flows by dams and weirs can also affect
water quality (Kumar & Dubey, 2006). In addition, low abundance and types of fish
species may be a result of water quality and habitat that can be affected by the surrounding
land use (Deacon & Mize, 1997).
2.6.1 Temperature
Deacon and Mize (1997) stated that water temperature is inversely related to elevation in
the basin; as elevation decreases, water temperature increases. According to Arrignon
(1999), the temperature of water affects its density and viscosity, the solubility of gases,
especially oxygen, and the rate of chemical and biochemical reactions. Its variations may

10
destroy certain aquatic species but also be favorable for the development of other species,
resulting in an ecological imbalance. Each species, in order to exist, can do so only within
a certain temperature range and is otherwise likely to disappear. It has its thermal
preference that corresponds to the temperature zone in which it finds the easiest to exist
(Arrignon, 1999). An increase in temperature, for example, 10 ºC, will eventually cause the
biological and chemical reactions rate to double or triple.
2.6.2 Total Suspended Solids (TSS)
Water carries small particles of solid matter in suspension that can be assessed. The
amount of tiny particles (normally tiny particles of eroded soil or small organic matters)
held in water can be totaled up and recorded. TSS comprised of degraded dead leaves,
detritus and sewage which have been broken down into small particle of organic matters
and soil particles. According to Ali and Murtedza (1999), the measurement of total
suspended solids (TSS) is used to determine soil erosion in the area.
As long as it can be filtered by using filter paper, it is called suspended solids
(Cheremisinoff, 1993). High value of TSS means that the area involves in high erosion
where it blocks light from reaching the lower parts of the water body. As some aquatic
vegetation needs photosynthesis process in order to make its own food, high TSS can affect
the process greatly, causing less production of oxygen in the area.
2.6.3 Chlorophyll a (Chl a)
Chlorophyll a is the green pigment/ color found on most plants, be it terrestrial or aquatic.
For the aquatic ecosystems, especially for the phytoplankton organisms, this pigment is
essential for photosynthesis process. They are the producers that make up the base of food
11
web in an aquatic ecosystem. Zooplankton will feed on them and the fishes will feed on the
zooplankton. Certain studies reported that the abundance of fish in an area is related to the
concentration of chlorophyll a.
In order to measure the chlorophyll-a concentration in the water column, a standard method
of APHA (2000) will be used. The analysis should be conducted in subdued light to avoid
degradation because chlorophyll-a will degrade faster under the presence of light.
2.6.4 Turbidity
According to Lawson (1995), high turbidity due to suspended solids is very harmful to the
fish as it may clog the gills of small fish and settle onto the smother the fish egg and cover
food organisms.
2.6.5 Dissolved Oxygen (DO)
Ambak & Jalal (2006) suggested that when the values of dissolved oxygen at a certain
reservoir are high, there are photosynthesis activities occurring at the reservoir that
increased the concentration of dissolved oxygen. Besides that, another factor that may
increase the amount of dissolved oxygen is low temperature (Mustapha, 2008; Khare &
Jadhav, 2008). According to Turyk et al. (2007), when the DO is high, it means that the
reservoir is suitable habitat for fish because the fish will be greatly affected when DO value
is below 5 mg/L.
2.6.6 Biological Oxygen Demand (BOD5)
BOD readings are related to the amount of dissolved oxygen. When the value of DO is
significantly lower, it means that the BOD reading is high. This is due to the high density
of fish that used up oxygen for respiration and high decomposition of organic matter from
fish wastes and uneaten pellets (Namrata, 2010).
12
2.6.7 pH
According to Trivedi and Gurdeep (1992), carbon dioxide is the main producer of weak
carbonic acid which results in acidity in unpolluted water. During the decaying process of
organic matters, organic acids are released and thus, will result in the acidity of water.
Organic acids also contribute to low pH values (Allan, 1995).
3.0 METHODOLOGY
3.1 Study Site
This study was carried out at Murum Hydroelectric Reservoir, Belaga, Sarawak. Two
sampling periods were carried out on 7th
to 9th
July 2014 and 25th
to 27th
February 2015.
Murum Hydroelectric Reservoir is situated at Murum River, which is the upper catchment
of Balui River, upper river of the Bakun Dam, Belaga District, Kapit Division, Sarawak as
shown in Figure 1. It is located at 2º 38’ 48” to the north and 114º 21’ 57” to the east.
Plieran River is one of the tributaries that flow into Murum River. It is located upstream of
the Murum Dam. Seven stations were selected as sampling sites, situated from upstream of
Plieran River towards Murum Reservoir. For the second period of sampling, only 6 stations
were sampled (station 1 to station 6) because downstream of Station 7 was blocked by
fallen trees and debris.
13
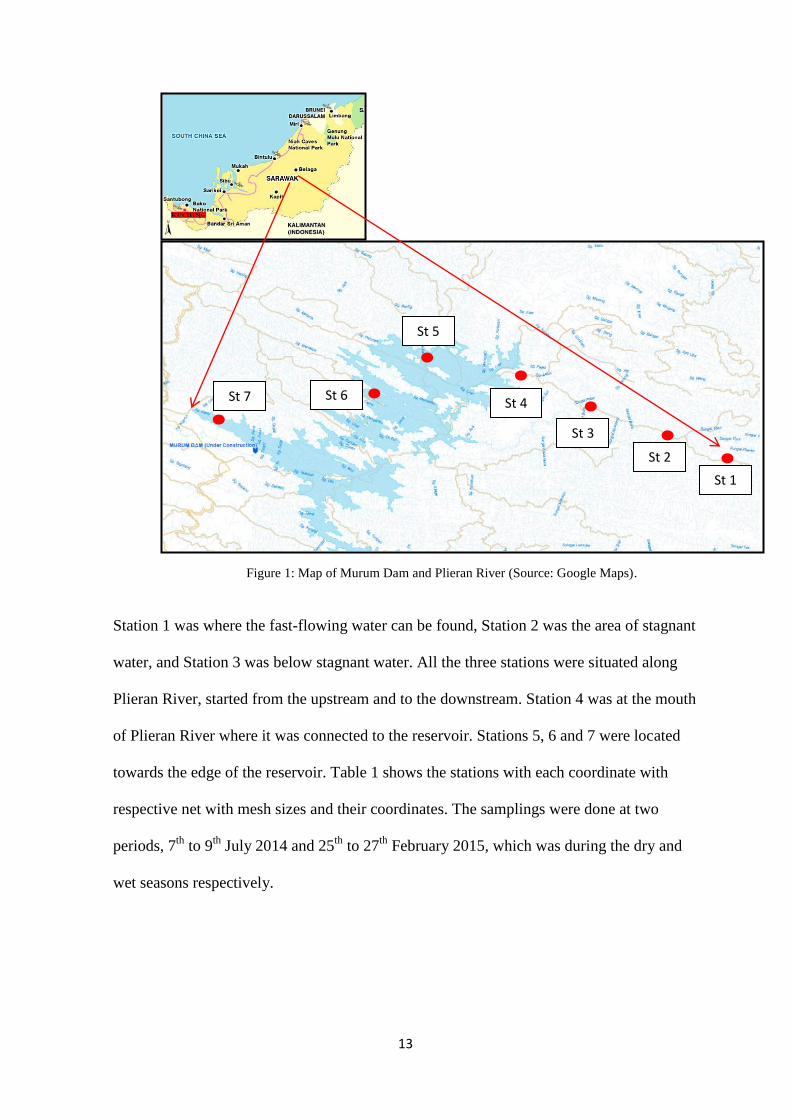
Station 1 was where the fast-flowing water can be found, Station 2 was the area of stagnant
water, and Station 3 was below stagnant water. All the three stations were situated along
Plieran River, started from the upstream and to the downstream. Station 4 was at the mouth
of Plieran River where it was connected to the reservoir. Stations 5, 6 and 7 were located
towards the edge of the reservoir. Table 1 shows the stations with each coordinate with
respective net with mesh sizes and their coordinates. The samplings were done at two
periods, 7th
to 9th
July 2014 and 25th
to 27th
February 2015, which was during the dry and
wet seasons respectively.
St 2
St 3
St 4
St 5
St 6 St 7
Figure 1: Map of Murum Dam and Plieran River (Source: Google Maps).
St 1