Embed Size (px)
Citation preview
HVCB Market InsightsKaua‘i Visitors Bureau Membership Meeting
October 14, 2015
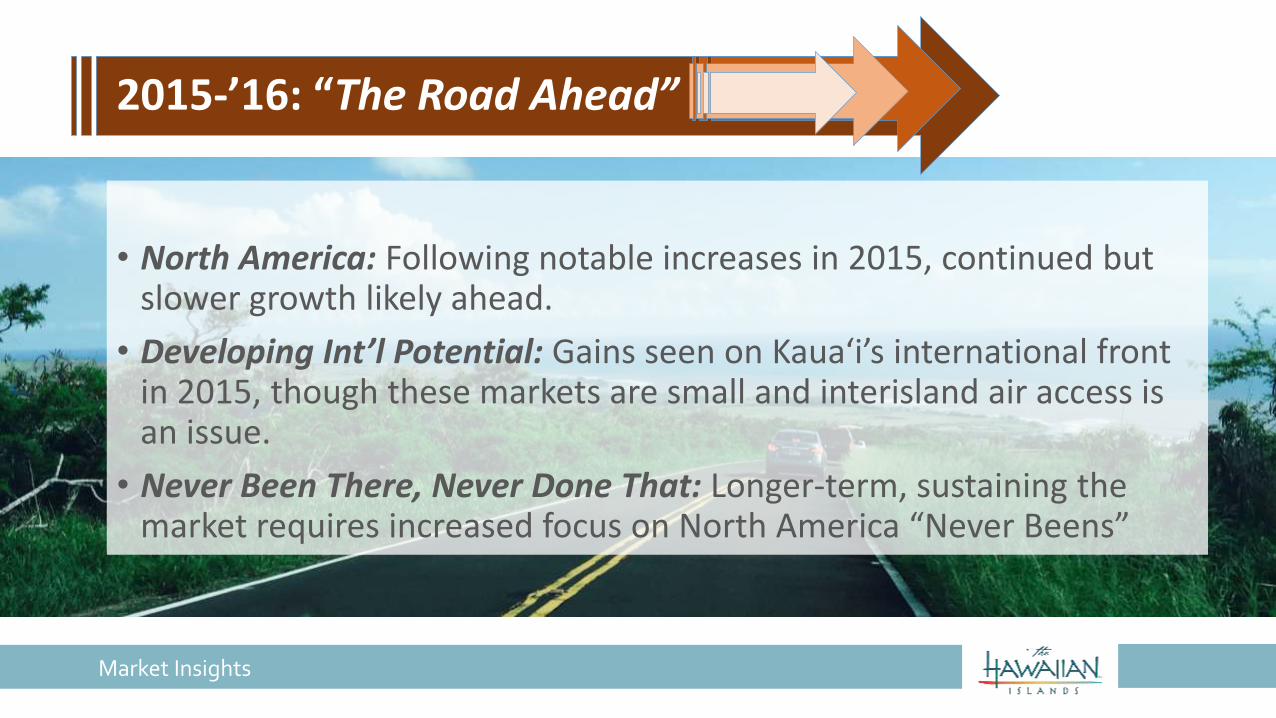
2015-’16: “The Road Ahead”
• North America: Following notable increases in 2015, continued but slower growth likely ahead.
• Developing Int’l Potential: Gains seen on Kaua‘i’s international front in 2015, though these markets are small and interisland air access is an issue.
• Never Been There, Never Done That: Longer-term, sustaining the market requires increased focus on North America “Never Beens”
Market Insights
Market Insights
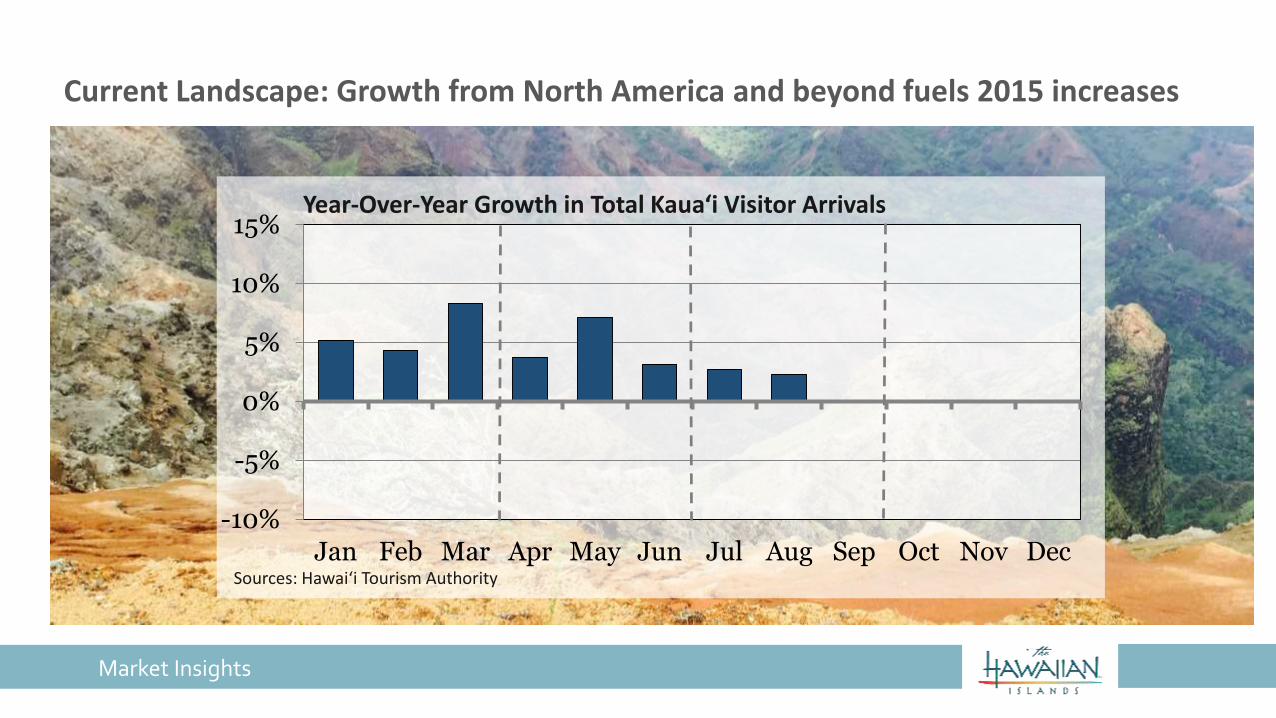
Current Landscape: Growth from North America and beyond fuels 2015 increases
-10%
-5%
0%
5%
10%
15%
Jan Feb Mar Apr May Jun Jul Aug Sep Oct Nov DecSources: Hawai‘i Tourism Authority
Year-Over-Year Growth in Total Kaua‘i Visitor Arrivals
Market Insights
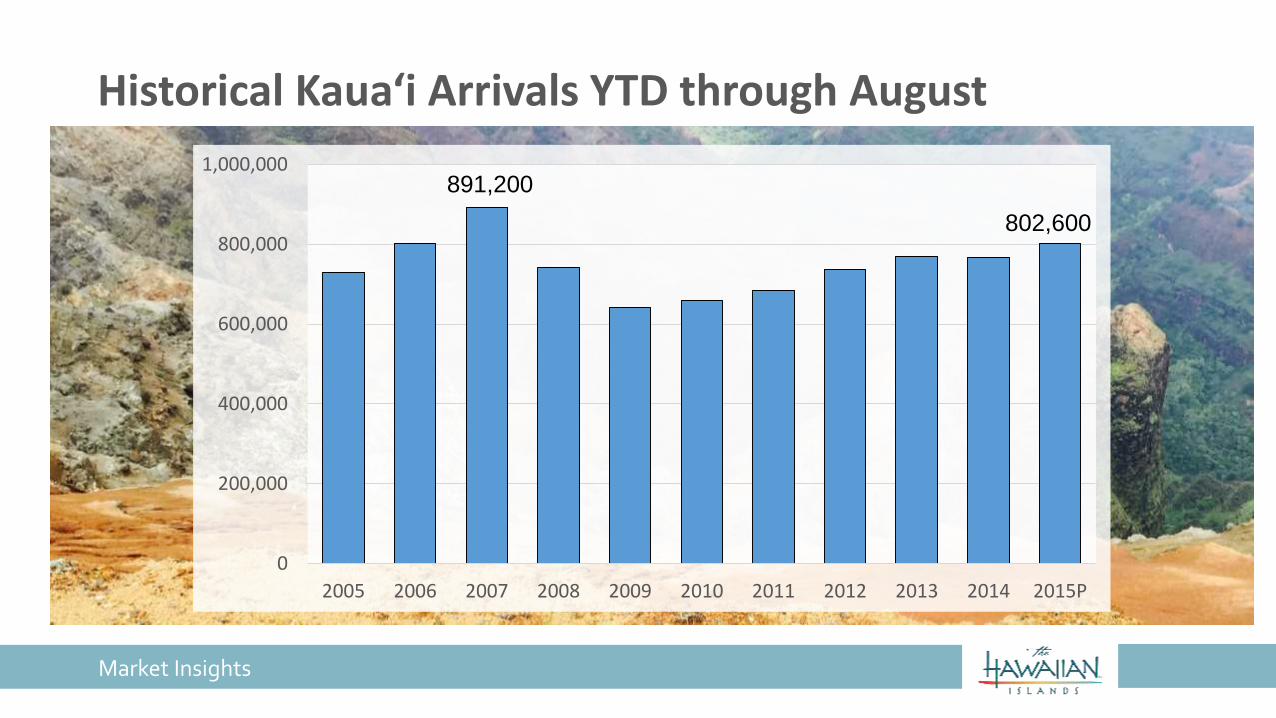
Historical Kaua‘i Arrivals YTD through August
0
200,000
400,000
600,000
800,000
1,000,000
2005 2006 2007 2008 2009 2010 2011 2012 2013 2014 2015P
891,200
802,600
Continued Growth
Strong market conditions point to continued, but slower growth heading into 2016
Market Insights
Market Insights
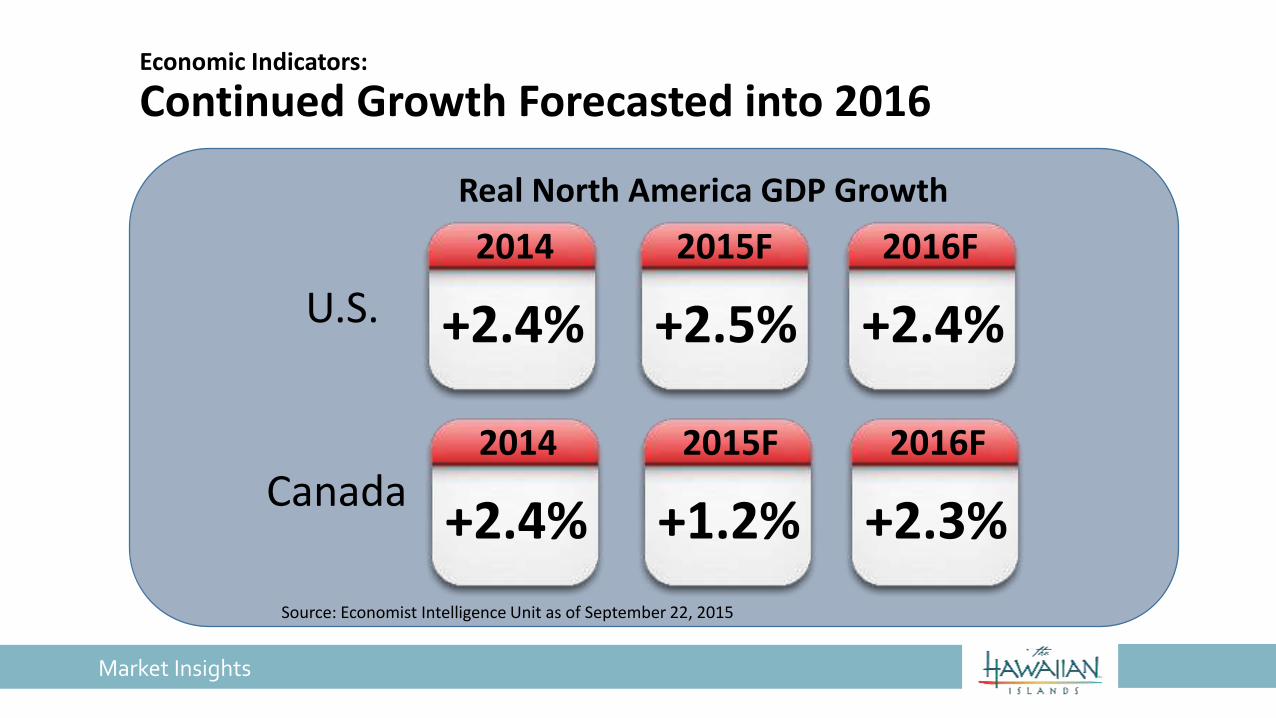
Economic Indicators:
Continued Growth Forecasted into 2016
Source: Economist Intelligence Unit as of September 22, 2015
2014
+2.4%
Real North America GDP Growth
2015F
+2.5%
2016F
+2.4%
2014
+2.4%
2015F
+1.2%
2016F
+2.3%
U.S.
Canada

Market Insights
North America Leisure Travel Demand:
Continued Growth Forecasted into 2016
Sources: US Travel Association as of July 2015, Conference Board of Canada as of August 2015
2014
+2.7%
North America Leisure Person Trips
2015F
+2.0%
2016F
+1.8%
2014
-0.8%
2015F
-4.8%
2016F
+2.3%
U.S.
Canada
Market Insights
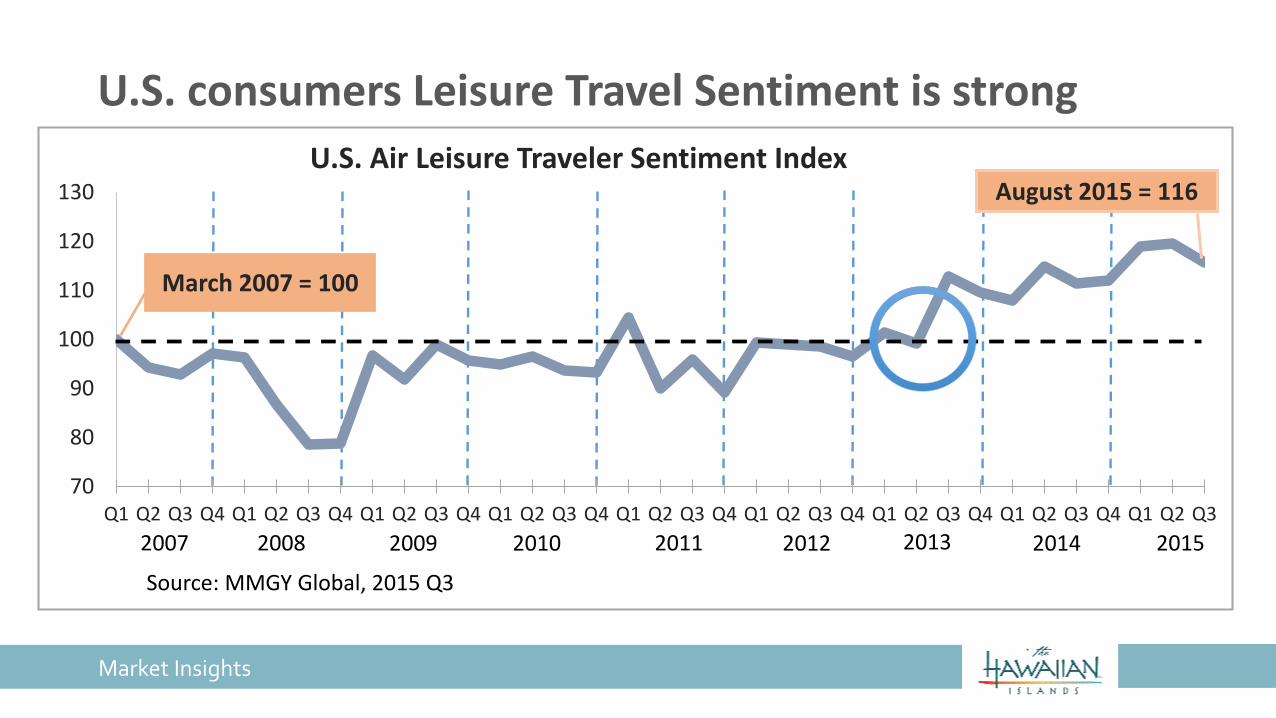
U.S. consumers Leisure Travel Sentiment is strong
70
80
90
100
110
120
130
Q1 Q2 Q3 Q4 Q1 Q2 Q3 Q4 Q1 Q2 Q3 Q4 Q1 Q2 Q3 Q4 Q1 Q2 Q3 Q4 Q1 Q2 Q3 Q4 Q1 Q2 Q3 Q4 Q1 Q2 Q3 Q4 Q1 Q2 Q3
U.S. Air Leisure Traveler Sentiment Index
2007 2008 2009
March 2007 = 100
August 2015 = 116
2010 2011 2012 2013 2014
Source: MMGY Global, 2015 Q3
2015
Market Insights
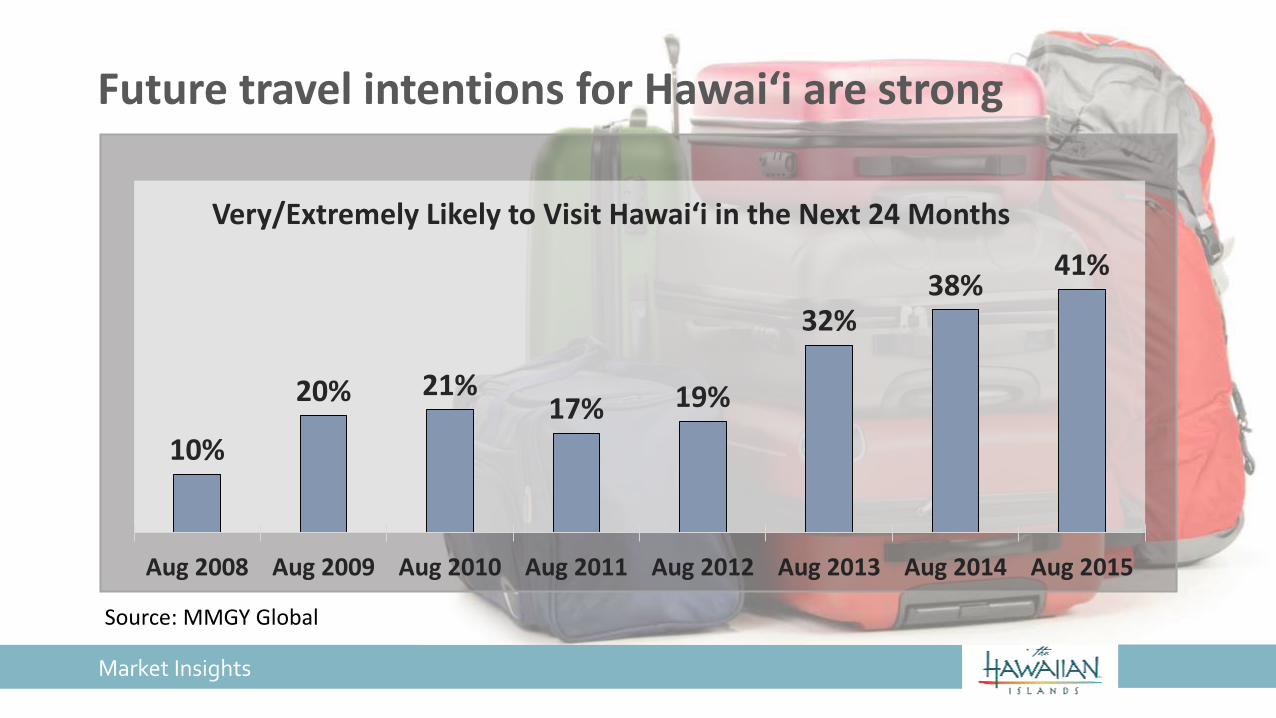
10%
20% 21%17% 19%
32%38%
41%
Aug 2008 Aug 2009 Aug 2010 Aug 2011 Aug 2012 Aug 2013 Aug 2014 Aug 2015
Very/Extremely Likely to Visit Hawai‘i in the Next 24 Months
Future travel intentions for Hawai‘i are strong
Source: MMGY Global
Market Insights
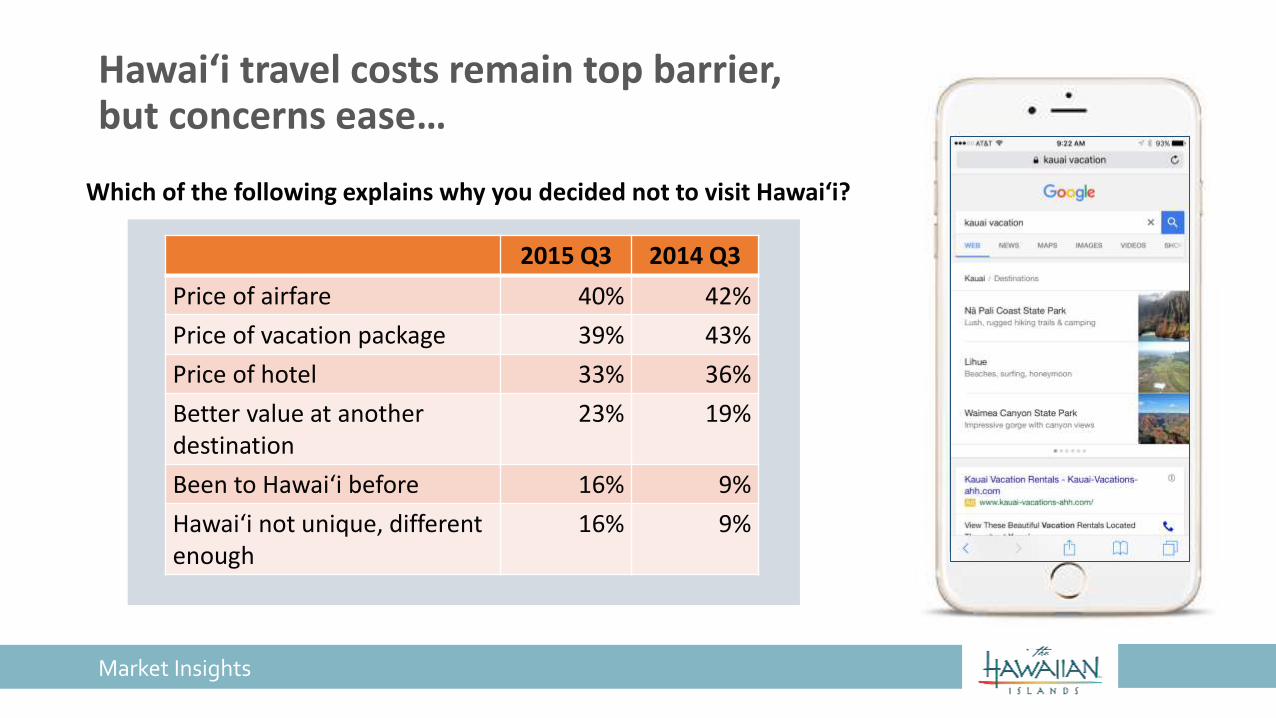
Hawai‘i travel costs remain top barrier,but concerns ease…
2015 Q3 2014 Q3
Price of airfare 40% 42%
Price of vacation package 39% 43%
Price of hotel 33% 36%
Better value at another destination
23% 19%
Been to Hawai‘i before 16% 9%
Hawai‘i not unique, different enough
16% 9%
Which of the following explains why you decided not to visit Hawai‘i?
Market Insights
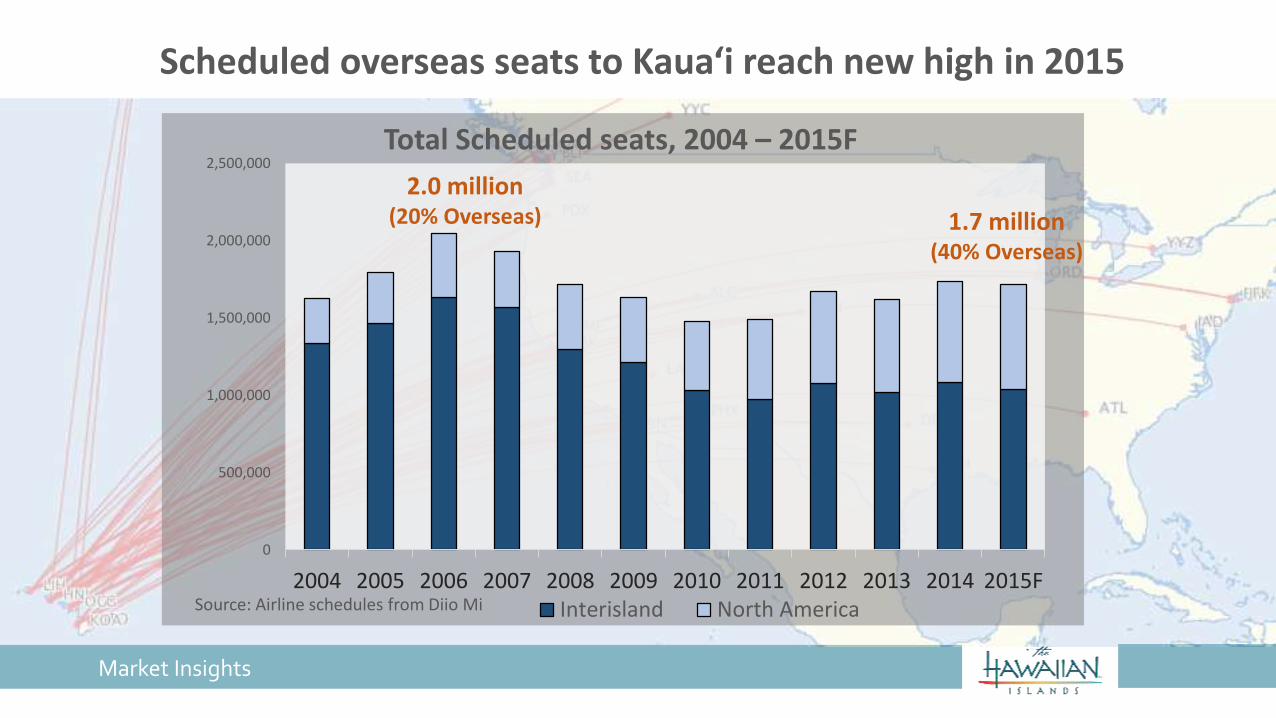
0
500,000
1,000,000
1,500,000
2,000,000
2,500,000
2004 2005 2006 2007 2008 2009 2010 2011 2012 2013 2014 2015FInterisland North America
Scheduled overseas seats to Kaua‘i reach new high in 2015
Total Scheduled seats, 2004 – 2015F
Source: Airline schedules from Diio Mi
2.0 million(20% Overseas) 1.7 million
(40% Overseas)
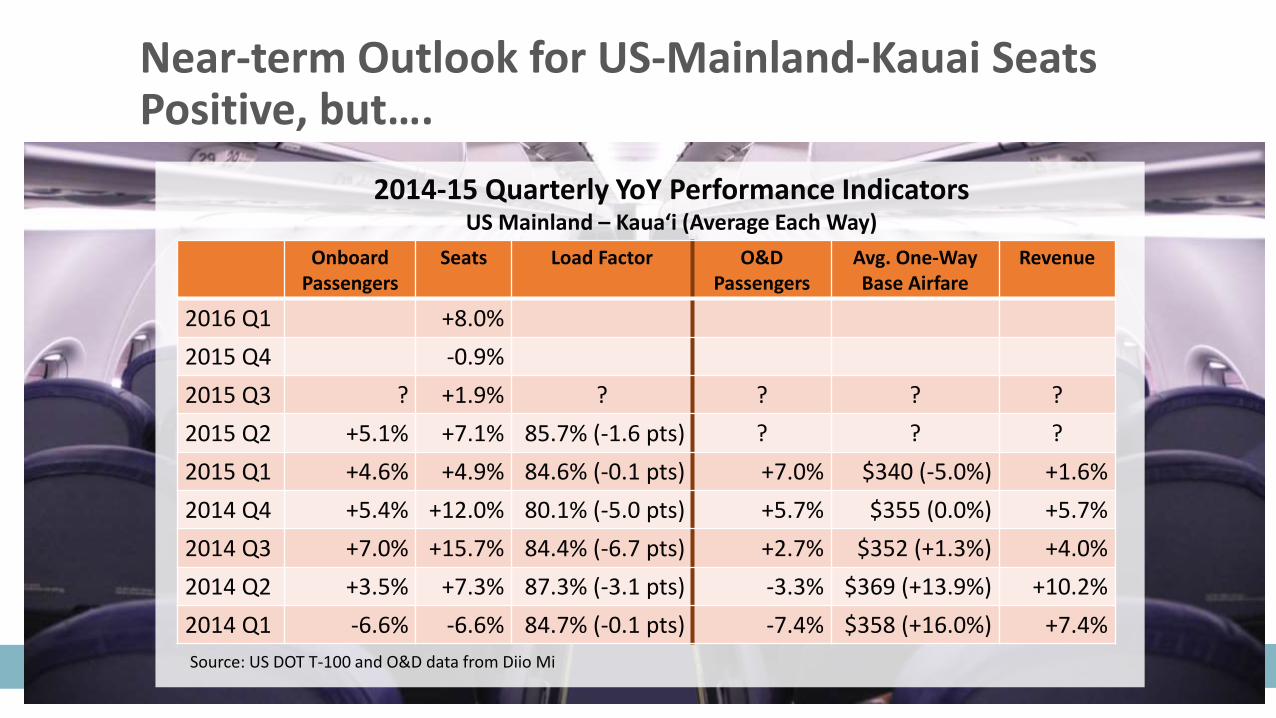
Near-term Outlook for US-Mainland-Kauai Seats Positive, but….
12
Source: UD DOT T-100 and O&D data from Diio Mi
OnboardPassengers
Seats Load Factor O&DPassengers
Avg. One-Way Base Airfare
Revenue
2016 Q1 +8.0%
2015 Q4 -0.9%
2015 Q3 ? +1.9% ? ? ? ?
2015 Q2 +5.1% +7.1% 85.7% (-1.6 pts) ? ? ?
2015 Q1 +4.6% +4.9% 84.6% (-0.1 pts) +7.0% $340 (-5.0%) +1.6%
2014 Q4 +5.4% +12.0% 80.1% (-5.0 pts) +5.7% $355 (0.0%) +5.7%
2014 Q3 +7.0% +15.7% 84.4% (-6.7 pts) +2.7% $352 (+1.3%) +4.0%
2014 Q2 +3.5% +7.3% 87.3% (-3.1 pts) -3.3% $369 (+13.9%) +10.2%
2014 Q1 -6.6% -6.6% 84.7% (-0.1 pts) -7.4% $358 (+16.0%) +7.4%
2014-15 Quarterly YoY Performance IndicatorsUS Mainland – Kaua‘i (Average Each Way)
Source: US DOT T-100 and O&D data from Diio Mi
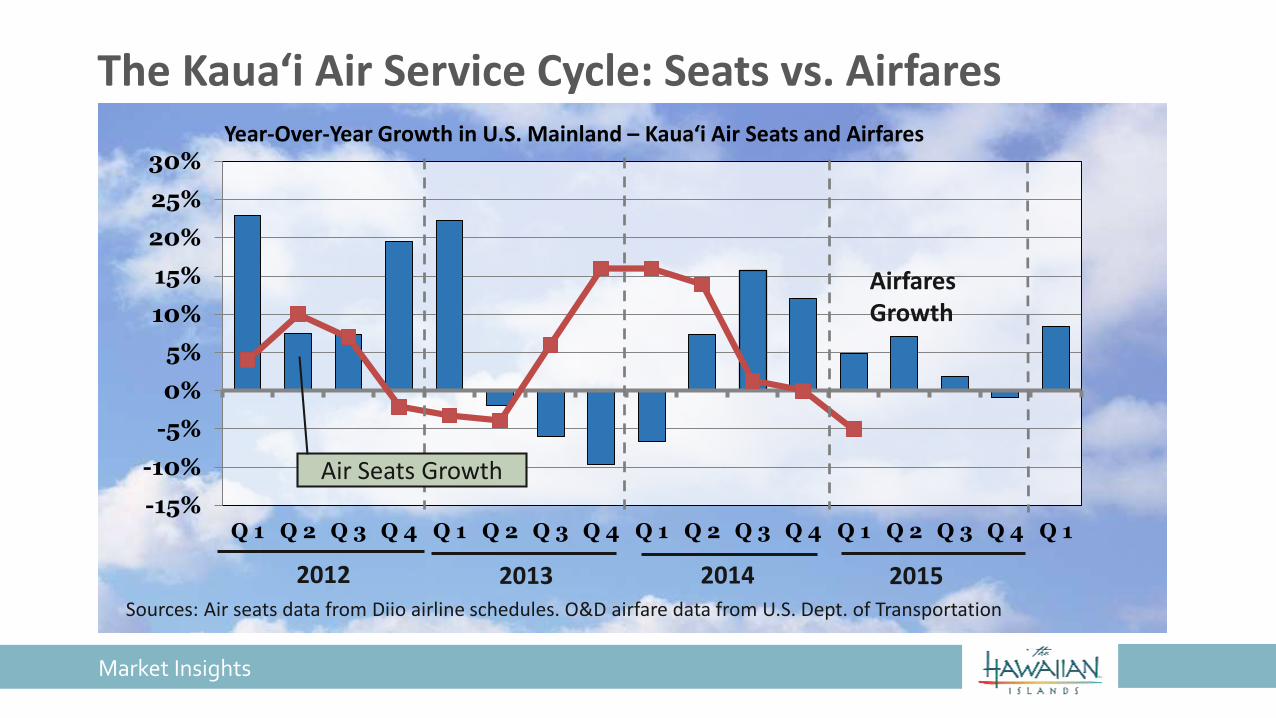
The Kaua‘i Air Service Cycle: Seats vs. Airfares
Market Insights
Sources: Air seats data from Diio airline schedules. O&D airfare data from U.S. Dept. of Transportation
-15%
-10%
-5%
0%
5%
10%
15%
20%
25%
30%
Q 1 Q 2 Q 3 Q 4 Q 1 Q 2 Q 3 Q 4 Q 1 Q 2 Q 3 Q 4 Q 1 Q 2 Q 3 Q 4 Q 1
Airfares Growth
Air Seats Growth
2012 20152013 2014
Year-Over-Year Growth in U.S. Mainland – Kaua‘i Air Seats and Airfares

Oil Change: Lower prices forecasted to continue
$53$60
$0
$20
$40
$60
$80
$100
$120
2010 2011 2012 2013 2014 2015F 2016F 2017F 2018F 2019F
Oil (US$/barrel; Brent)
Source: Economist Intelligence Unit, Global Forecasting Service as of September 22 2015
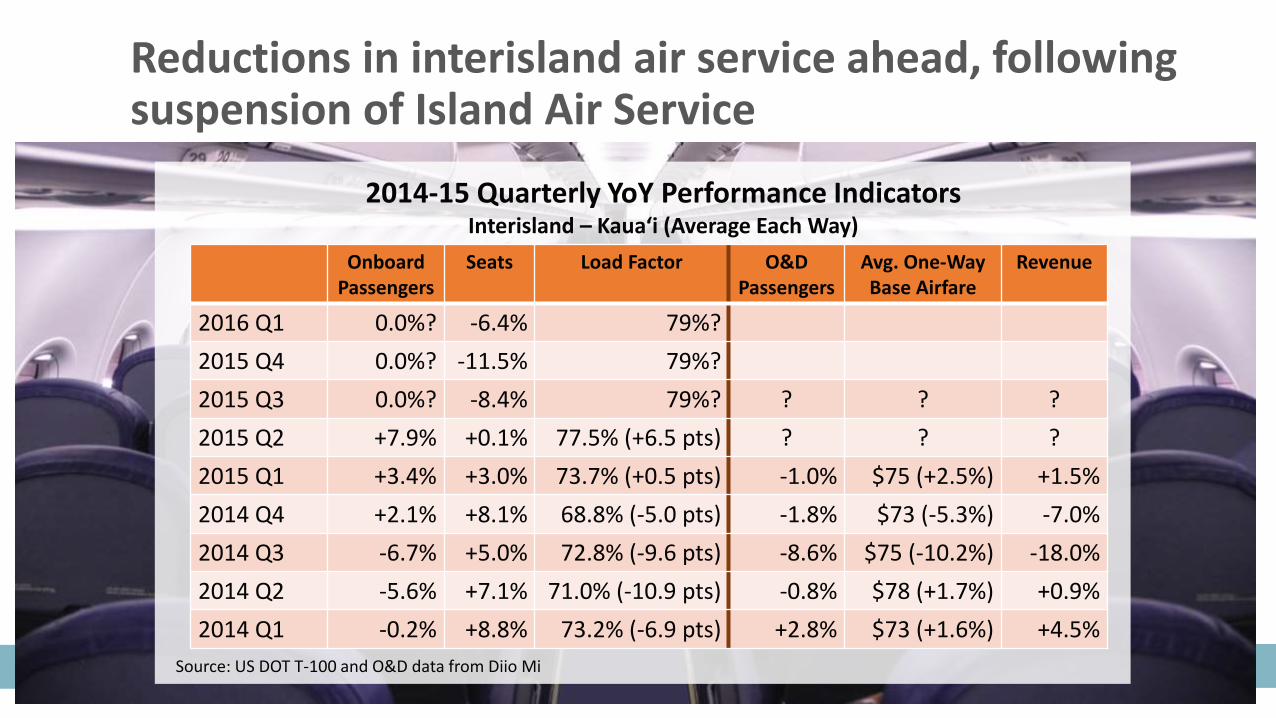
Reductions in interisland air service ahead, following suspension of Island Air Service
15
Source: UD DOT T-100 and O&D data from Diio Mi
OnboardPassengers
Seats Load Factor O&DPassengers
Avg. One-Way Base Airfare
Revenue
2016 Q1 0.0%? -6.4% 79%?
2015 Q4 0.0%? -11.5% 79%?
2015 Q3 0.0%? -8.4% 79%? ? ? ?
2015 Q2 +7.9% +0.1% 77.5% (+6.5 pts) ? ? ?
2015 Q1 +3.4% +3.0% 73.7% (+0.5 pts) -1.0% $75 (+2.5%) +1.5%
2014 Q4 +2.1% +8.1% 68.8% (-5.0 pts) -1.8% $73 (-5.3%) -7.0%
2014 Q3 -6.7% +5.0% 72.8% (-9.6 pts) -8.6% $75 (-10.2%) -18.0%
2014 Q2 -5.6% +7.1% 71.0% (-10.9 pts) -0.8% $78 (+1.7%) +0.9%
2014 Q1 -0.2% +8.8% 73.2% (-6.9 pts) +2.8% $73 (+1.6%) +4.5%
2014-15 Quarterly YoY Performance IndicatorsInterisland – Kaua‘i (Average Each Way)
Source: US DOT T-100 and O&D data from Diio Mi

Market Insights
Source: US DOT and IATA/ARC O&D passenger data from DiioMi, 12-month period ending March 2015
North America & Non-North America % Flying Nonstop to Neighbor IslandsThe vast majority of passengers traveling between North America and the Neighbor Islands travel aboard nonstop flights, rather than via interisland connections
93%
0%
73%
0%
75%
0%
North America Non-NA North America Non-NA North America Non-NA
Maui Kaua‘i Hawai‘i Island
Nearly three-quarters of Kaua‘i Travelers fly nonstop
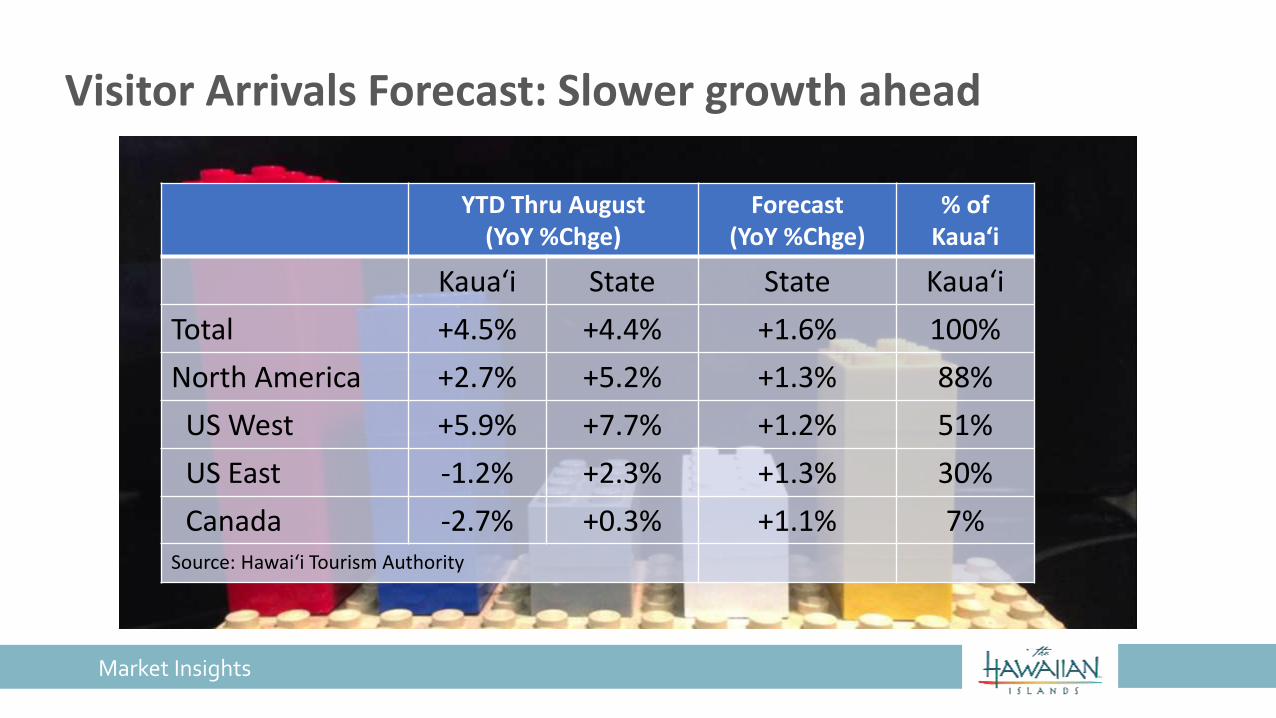
Visitor Arrivals Forecast: Slower growth ahead
Market Insights
YTD Thru August(YoY %Chge)
Forecast(YoY %Chge)
% of Kaua‘i
Kaua‘i State State Kaua‘i
Total +4.5% +4.4% +1.6% 100%
North America +2.7% +5.2% +1.3% 88%
US West +5.9% +7.7% +1.2% 51%
US East -1.2% +2.3% +1.3% 30%
Canada -2.7% +0.3% +1.1% 7%Source: Hawai‘i Tourism Authority
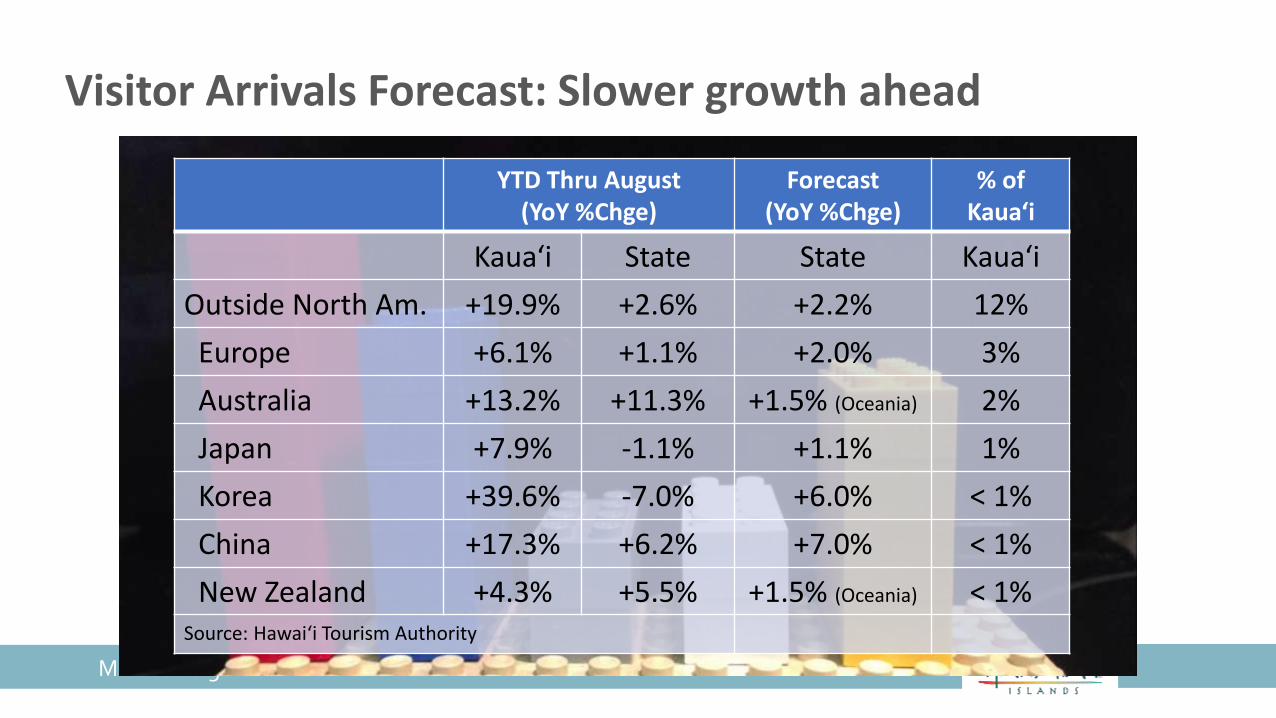
Visitor Arrivals Forecast: Slower growth ahead
Market Insights
YTD Thru August(YoY %Chge)
Forecast(YoY %Chge)
% of Kaua‘i
Kaua‘i State State Kaua‘i
Outside North Am. +19.9% +2.6% +2.2% 12%
Europe +6.1% +1.1% +2.0% 3%
Australia +13.2% +11.3% +1.5% (Oceania) 2%
Japan +7.9% -1.1% +1.1% 1%
Korea +39.6% -7.0% +6.0% < 1%
China +17.3% +6.2% +7.0% < 1%
New Zealand +4.3% +5.5% +1.5% (Oceania) < 1%Source: Hawai‘i Tourism Authority

Never Been There, Never Done That
Longer-term, keeping the market growing requires increased focus on “Never Beens”
Market Insights
Market Insights
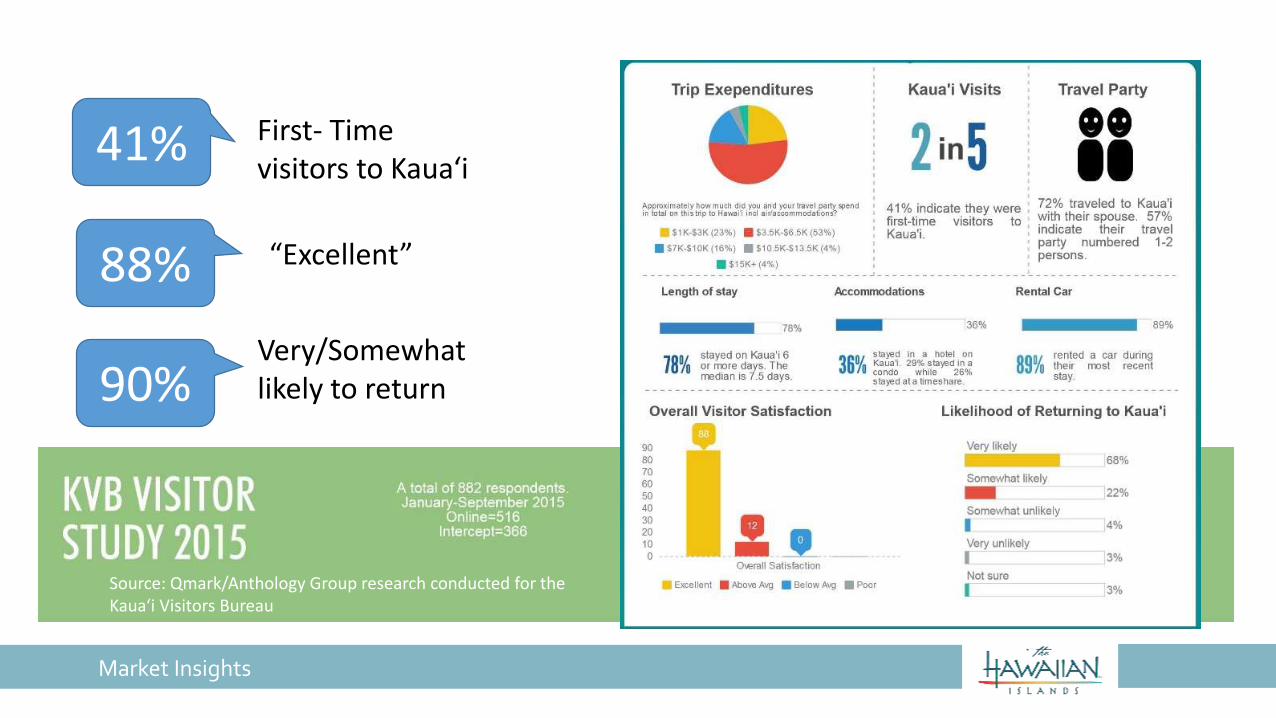
Source: Qmark/Anthology Group research conducted for the Kaua‘i Visitors Bureau
First- Time visitors to Kaua‘i
“Excellent”
Very/Somewhat likely to return
41%
88%
90%
Market Insights
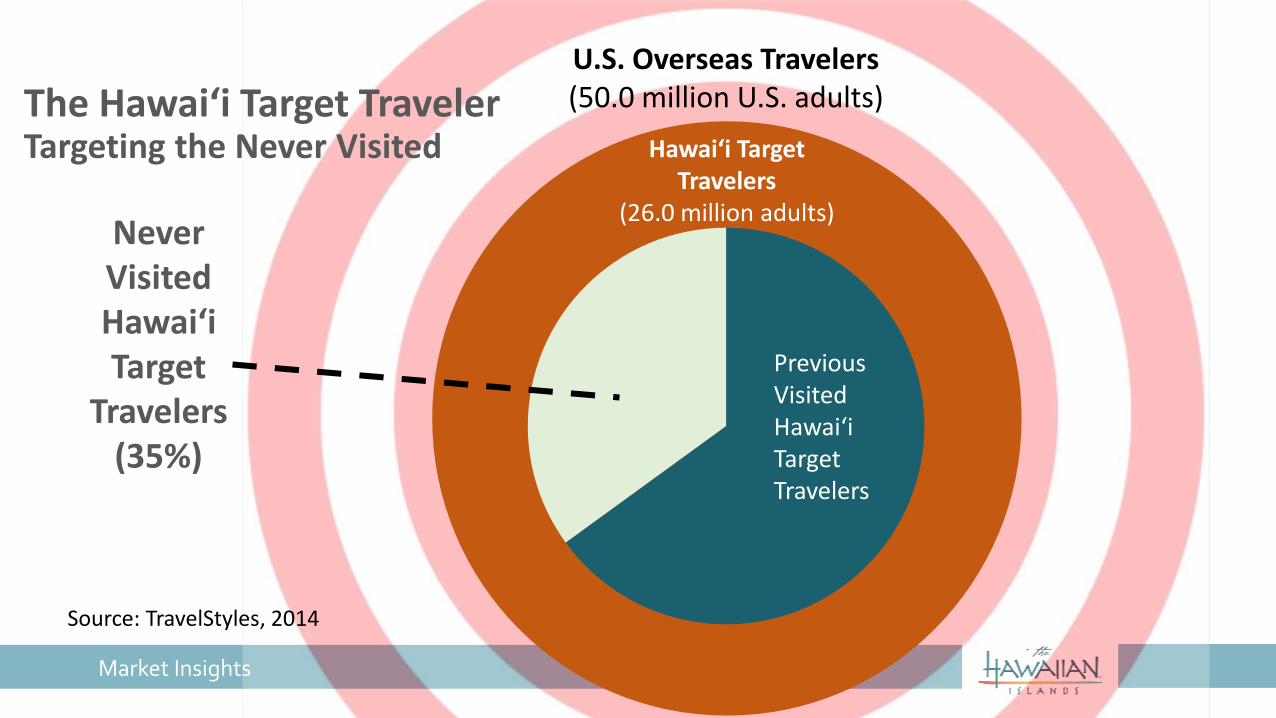
The Hawai‘i Target Traveler Targeting the Never Visited
Never Visited Hawai‘i Target
Travelers (35%)
Hawai‘i Target Travelers
(26.0 million adults)
U.S. Overseas Travelers(50.0 million U.S. adults)
Source: TravelStyles, 2014
Previous Visited Hawai‘i Target Travelers
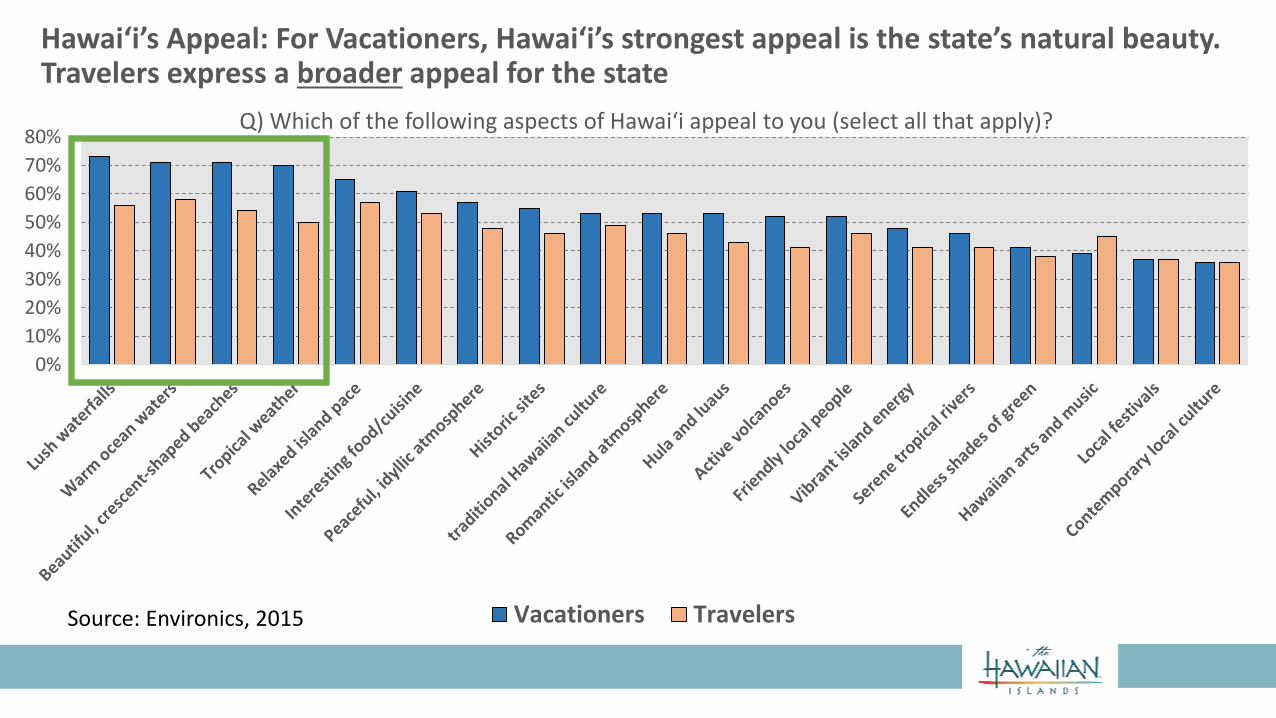
Hawai‘i’s Appeal: For Vacationers, Hawai‘i’s strongest appeal is the state’s natural beauty. Travelers express a broader appeal for the state
0%
10%
20%
30%
40%
50%
60%
70%
80%Q) Which of the following aspects of Hawai‘i appeal to you (select all that apply)?
Vacationers TravelersSource: Environics, 2015
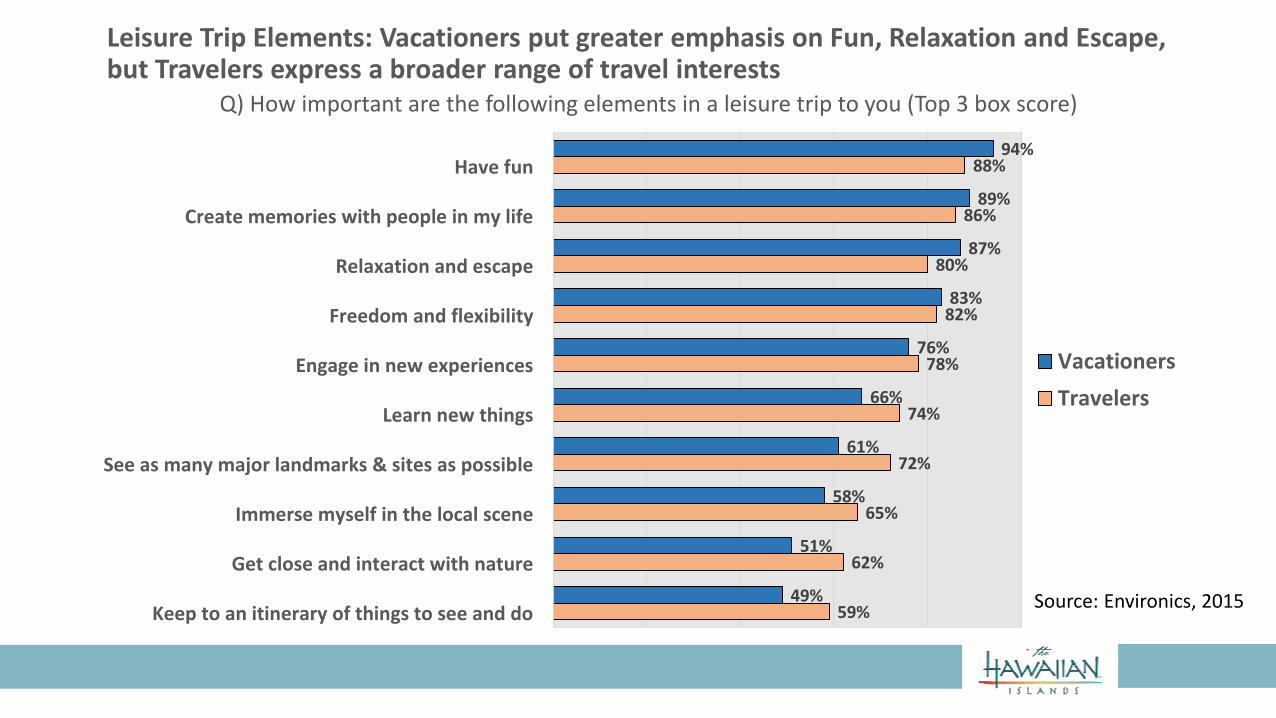
Leisure Trip Elements: Vacationers put greater emphasis on Fun, Relaxation and Escape, but Travelers express a broader range of travel interests
59%
62%
65%
72%
74%
78%
82%
80%
86%
88%
49%
51%
58%
61%
66%
76%
83%
87%
89%
94%
Keep to an itinerary of things to see and do
Get close and interact with nature
Immerse myself in the local scene
See as many major landmarks & sites as possible
Learn new things
Engage in new experiences
Freedom and flexibility
Relaxation and escape
Create memories with people in my life
Have fun
Q) How important are the following elements in a leisure trip to you (Top 3 box score)
Vacationers
Travelers
Source: Environics, 2015
Market Insights
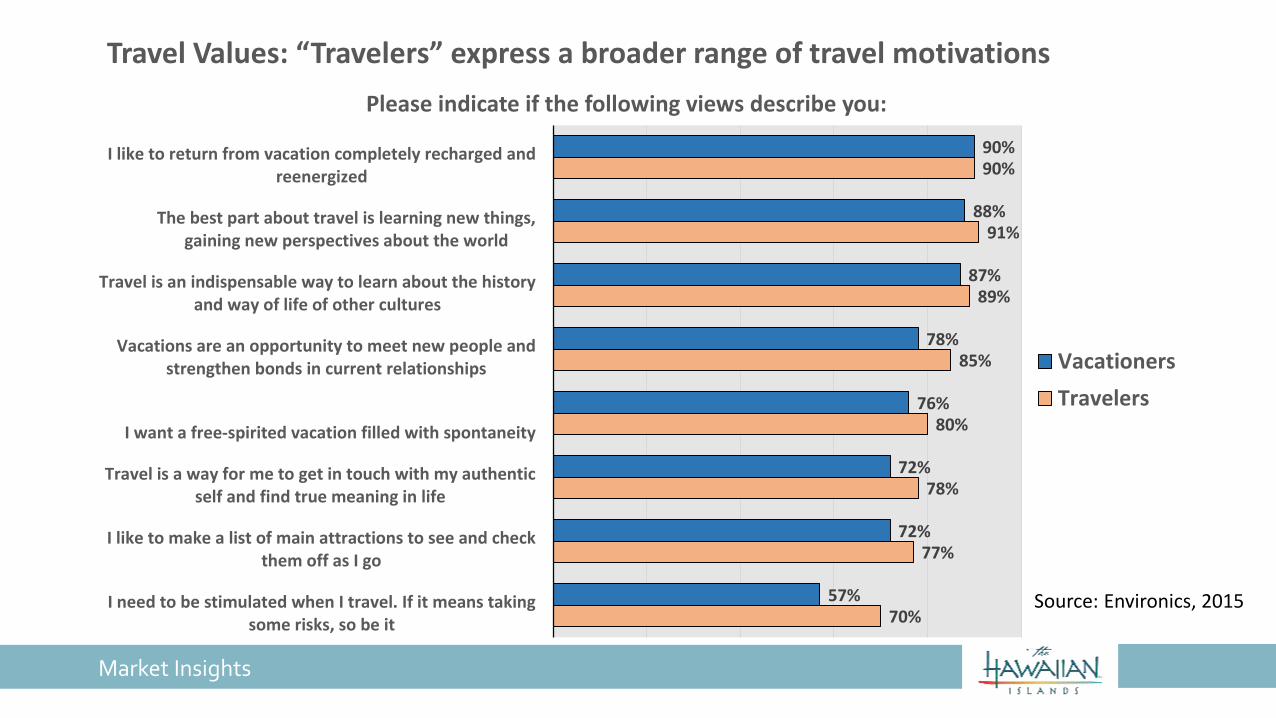
Travel Values: “Travelers” express a broader range of travel motivations
70%
77%
78%
80%
85%
89%
91%
90%
57%
72%
72%
76%
78%
87%
88%
90%
I need to be stimulated when I travel. If it means takingsome risks, so be it
I like to make a list of main attractions to see and checkthem off as I go
Travel is a way for me to get in touch with my authenticself and find true meaning in life
I want a free-spirited vacation filled with spontaneity
Vacations are an opportunity to meet new people andstrengthen bonds in current relationships
Travel is an indispensable way to learn about the historyand way of life of other cultures
The best part about travel is learning new things,gaining new perspectives about the world
I like to return from vacation completely recharged andreenergized
Please indicate if the following views describe you:
Vacationers
Travelers
Source: Environics, 2015


Market Insights
#LetHawaiiHappen – Kaua‘i
Much/Slightly more favorable impression of Kaua‘i
Extremely/Very likely to visit Kaua‘i
78%
71%
Among Avid Travelers who recall seeing the Kaua‘i television commercial:
What do Avid Travelers think the Kaua‘itelevision commercial is saying?:
"Enjoy yourself on Kauai, make new friends -- WaimeaCanyon, Waimea Plantation."
"Hawaii is a place where spontaneity is a constant, where moments become memorable, where a passerby acquaintance can become a lifetime friend."
Source: TNS, 2015
Market Insights
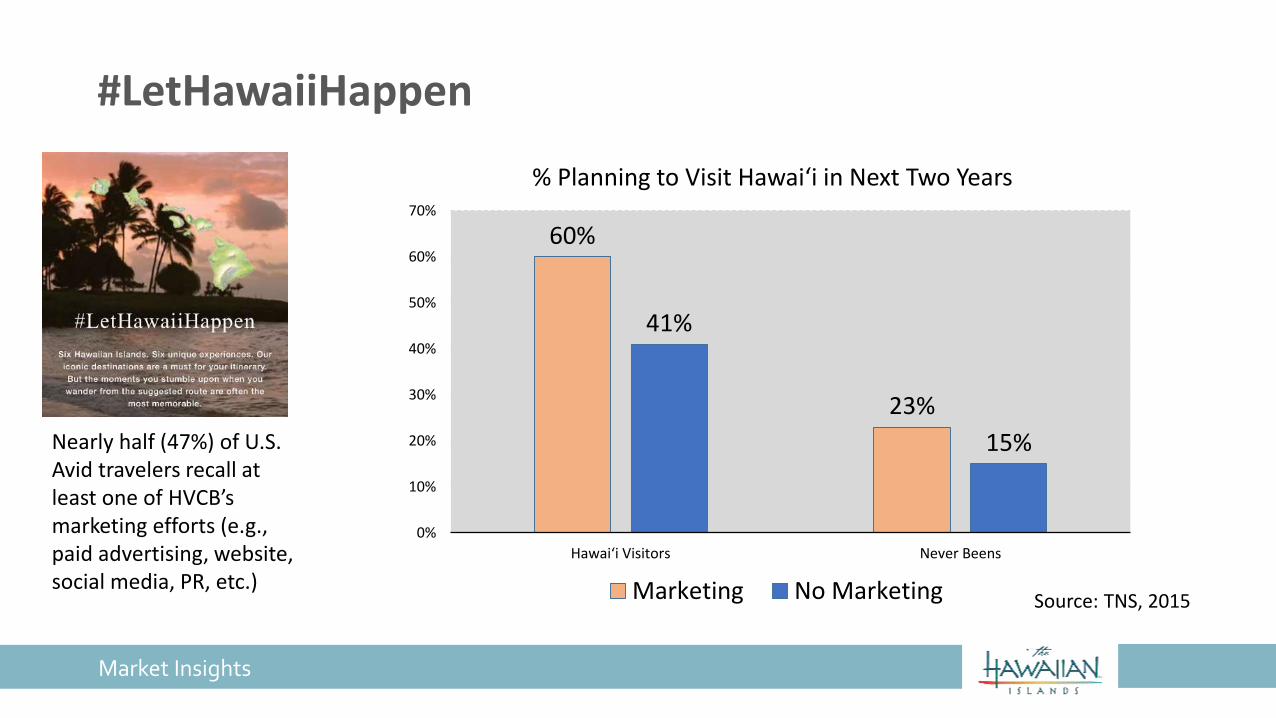
#LetHawaiiHappen
60%
23%
41%
15%
0%
10%
20%
30%
40%
50%
60%
70%
Hawai‘i Visitors Never Beens
% Planning to Visit Hawai‘i in Next Two Years
Marketing No Marketing
Nearly half (47%) of U.S. Avid travelers recall at least one of HVCB’s marketing efforts (e.g., paid advertising, website, social media, PR, etc.)
Source: TNS, 2015
2015-’16: “The Road Ahead”
• Continued Growth Ahead: Stable market conditions point to continued, but slower growth heading into 2016
• Never Been There, Never Done That: Longer-term, sustaining the market requires an increased focus on North America “Never Beens”
Market Insights