Embed Size (px)
Citation preview
Human self-protein CD81 T-cell epitopes are bothpositively and negatively selected
Michal Almani�1, Shai Raffaeli�1, Tal Vider-Shalit�1, Lea Tsaban1,
Vered Fishbain2 and Yoram Louzoun1
1 Math Department and Gonda Brain Research Center, Bar Ilan University, Ramat Gan, Israel2 Department of Molecular Genetics and Biotechnology, Faculty of Medicine, The Hebrew
University of Jerusalem, Jerusalem, Israel
The cellular immune system recognizes self-epitopes in the context of MHC-I molecules.
The immunological general view presumes that these self-epitopes are just a background,
both positively and negatively selecting T cells. We here estimate the number of epitopes
in each human protein for many frequent HLA alleles, and a score representing over or
under presentation of epitopes on these proteins. We further show that there is a clear
selection for the presentation of specific self-protein types. Proteins presenting many
epitopes include, for example, autoimmune regulator (AIRE) upregulated tissue-specific
antigens, immune system receptors and proteins with a high expression level. On the
other hand, proteins that may be considered less ‘‘useful’’ for the immune system, such as
low expression level proteins, are under-presented. We combine our epitope estimate with
single nucleotide polymorphism (SNP) measures to show that this selection can be directly
observed through the fraction of non-synonymous SNP (replacement fraction), which is
significantly higher inside epitopes than outside.
Key words: Autoimmunity . Bioinformatics . CD8 T cells . Self/non-self-discrimination
Introduction
The innate immune system uses germline-encoded receptors as a
frontline response to most pathogens. These receptors are limited
in their capacity to recognize pathogens that have rapidly evolved
to avoid being detected by them. This limitation is balanced by
the adaptive immune system that adapts itself to new pathogens
using a large receptor repertoire, obtained through random
V(D)J rearrangement [1, 2], randomization of the junction
between these genes [3] and point mutations during B cells
somatic hypermutations.
Theoretically, the randomly rearranged receptors of the
adaptive immune system could respond equally to self- and non-
self-epitopes. However, cells reacting to self-epitopes are believed
to be deleted [4] or edited [5] during T cells’ thymic education
and the parallel education of B cells in the bone marrow [6].
Thus, according to the self/non-self-selection theory, any T cell
with a high affinity receptor for self-epitopes should be removed
from the T-cell repertoire. This basic dogma has now been refined
to include more complex tolerance mechanisms, such as Tregs
and priming of dendritic cells [7, 8]. However, these more
complex theories are mostly focused on CD41 T cells. In the
context of CD81 T cells (CTL), the mechanisms of peripheral self-
reactive T-cell regulation are still debated. If indeed self-reactive
CD81 T cells are deleted, CD81 T-cell self-epitopes should not be
different form any other nonamer in the same gene, since they
would not be recognized by CD81 T cells (no CD81 T cells
present). Thus, the epitope number should be similar to the one
expected from the statistical properties of the sequence. If this is
indeed the case, all self-proteins should have a similar number of
�These authors contributed equally to this work.Correspondence: Dr. Yoram Louzoune-mail: [email protected]
& 2009 WILEY-VCH Verlag GmbH & Co. KGaA, Weinheim www.eji-journal.eu
DOI 10.1002/eji.200838353 Eur. J. Immunol. 2009. 39: 1056–1065Michal Almani et al.1056

epitopes (taking into account their length and random fluctua-
tions) and there should be no large differences in the number of
epitopes between self-protein groups. We here show that such
large differences do exist.
CTL recognize (through their TCR) antigens only in the
context of MHC class I molecules. MHC molecules can bind 8–10
amino acid long peptides and present them to the cellular
immune system [9]. The limited repertoire allows us to apply
bioinformatics tools to the human genome and compute a part of
the CTL epitope repertoire in detail. Using this repertoire, we
compute the number of epitopes presented in different human
proteins and show that specific proteins are selected to express a
high number of epitopes, while others are selected to express
fewer. We further show that the proteins selected to express a
high number of epitopes are the one most ‘‘useful’’ for the
immune system, leading to the conclusion that self-epitopes are
not ignored, but are actually used by the immune system.
Although the definition of ‘‘useful’’ is vague, we propose a few
examples to show the elements selecting the number of epitopes
presented in different proteins.
In general, CTL epitopes originate from short peptides cleaved
by the proteasome [10] and transferred through TAP [11] that can
associate non-covalently with the groove of the MHC-I molecules
[9]. A cleaved nonamer is presented on an MHC-I molecule only if
its affinity for the MHC molecule is high enough. This affinity is
determined by the peptide’s length and by its anchor and helping
residues. In recent years the anchor residues for many human
MHC-I alleles have been determined experimentally [12, 13]. We
here apply MHC binding, TAP transfer and cleavage prediction
algorithms to the human genome to compute the human CTL
epitope repertoire. There are currently dozens of algorithms for the
prediction of the different stages of epitope processing (e.g.
NetMHC [14], IEDB [15], BIMAS [13], NetChop [16–19], ProPred
and Pcleavage [16, 20] and many others). We have tested many of
them and chose the algorithms to use based on their sensitivity,
specificity as well as the availability of the scoring matrices
allowing us to perform a large-scale genomic analysis.
Specifically, we predict, using bioinformatical tools in
all the coding regions of each known human gene, all the
nonamers that are cleaved by the proteasome, that pass through
the TAP channel and that are bound to (at least) one of the major
HLA alleles and defined those as epitopes [21]. We then compute
for each protein the number of epitopes presented per HLA allele
(Fig. 1). Note that not all epitopes pass the simple process
described here. Some of the epitopes are octamers or decamers.
Some of them use a TAP-independent pathway or result from a
cross-talk between the MHC-II and MHC-I presentation path-
ways. Not all epitopes are the direct result of proteasomal clea-
vage. Many occur, for example, through trimming of existing
larger cleavage products. Still, the majority of epitopes are
nonamers processed in the classical TAP-dependent and protea-
somal cleavage pathways. Furthermore, we are interested only in
a comparison between different protein groups, and in the
absence of selection and specific biases, the number of such
epitopes should be uniform among the different protein groups.
Results
Epitope prediction
In order to produce an estimated library of the self-epitope repertoire,
we scanned 33677 known genes from the human genome (predicted
by the ENSEMBL database) [22] and 31 different class I HLA
molecules, most of them being HLA-A and -B (Table 1). Each gene
was divided into all possible nonamers, and a score was computed
for each nonamer, representing the probability that it should be
cleaved in both C- and N-termini and not in its center [21, 23, 24].
For all high score peptides (i.e. peptides expected to be properly
cleaved), the probability that they should pass TAP was computed
[25], and for those successfully binding TAP, the probability to bind a
given MHC-I molecule was estimated (Fig. 1) [13]. Nonamers
passing all stages above threshold were defined as predicted epitopes.
The cleavage and MHC binding prediction algorithms were validated
to have low error levels (Fig. 2 and Table 1).
Size of immune repertoire score
The size of immune repertoire (SIR) score is defined as the ratio of
the computed CTL epitope number (predicted epitopes) to the
epitope number expected within the same number of random
nonamers and a similar amino acid distribution (taking into account
the correlation between the frequencies of neighboring amino acids).
This expected epitope fraction was computed by extracting
the number of nonamers predicted to be epitope from a random
1� e6 amino acid sequence (999 992 overlapping nonamers). If
such a sequence has 10 000 predicted epitopes on HLA B�2703,
then the epitope fraction of B�2703 would be approximately 0.01
Figure 1. Algorithm for SIR score computation. Each human protein isdivided into all nonamers and the appropriate flanking regions (a). Foreach nonamer a cleavage score is computed (b). We compute for allnonamers with a positive cleavage score a TAP binding and chooseonly supra-threshold peptides (c). The MHC binding score of all TAPbinding and cleaved nonamers is computed (d). Nonamers passing allthese stages are defined as epitopes. We then compute the number ofepitopes per protein per HLA allele (e).
Eur. J. Immunol. 2009. 39: 1056–1065 Immunomodulation 1057
& 2009 WILEY-VCH Verlag GmbH & Co. KGaA, Weinheim www.eji-journal.eu

(10 000/999 992). If a given 408 amino acid long protein has 10
predicted HLA B�2703 epitopes, then its SIR score for the same
allele would be 10/(0.01�400) 5 2.5 (i.e. 10 computed epitopes
divided by 4 expected epitopes).
The SIR score of a protein in a population is defined
as the average SIR score over all available HLA, weighted
by the HLA frequency in the entire human population [26, 27].
The random sequence used to compute the random epitopes
was matched to the human genome amino acid pair frequency.
This matching was produced using a Markov model for the
transition from one amino acid to the next trained on all human
sequences.
The SIR score represents a large, albeit not full, subgroup of
all epitopes. It misses, for example, 8- and 10-mers as well as
TAP-independent epitopes. However, the ratio of expected to
observed epitopes, based on the same algorithms, should not be
affected by the partiality of the list.
Viral versus human SIR score
The first observation resulting from the SIR score list is that,
although the global average SIR score of human sequences is close
to 1, the SIR score of a random sequence based on viral amino acid
frequencies (based on the average of over 1000 different fully
sequenced most non-human viruses) is 19% higher than its human
counterpart (22% higher for frequent HLA and 14% higher for rare
HLA) and the actual average SIR score of all viral sequences (not
including viruses infecting humans) is 20% higher than the one of
human proteins. Even within the human sequences, significant
differences can be observed. The SIR score of all human proteins for
frequent HLA alleles is higher than 1, while for rare HLA alleles it is
in general slightly lower than 1 (Fig. 3) (r 5 0.47, p 5 0.02). This
significant SIR score difference between frequent and rare alleles
hints that, in average, there is a weak selection on the MHC
molecules to increase the number of presented human epitopes. This
selection probably occurs only on the frequent alleles and not on the
rare alleles. Note also that selection in the context of HLA can occur
rapidly even for weak traits, through the selection in the population
of people carrying a given HLA.
The very large difference between the number of viral and
human epitopes presented shows a much more significant pressure
to present viral epitopes. Considering the classical role of the
immune system, this is not a surprising result. Moreover, focusing on
the SIR scores of viruses, human viruses have a much lower SIR score
than their non-human counterparts [28]. From the evolution point
of view this is also a reasonable result. The SIR score represents the
relationship between the human immune system and its pathogens.
The evasion of human viruses from the immune system is reflected
by the lower SIR score of such viruses versus non-human ones. This
simply represents the fact that each specific human virus evolves
faster than its human host.
Two possible evolutionary selection mechanisms can operate
on epitope presentation on the MHC molecules: either the
evolution of the MHC molecules or the direct evolution of the
epitopes. The first explanation is much simpler from an
evolutionary point of view. It is easier to optimize the limited
MHC locus than the entire genome. Furthermore, the MHC locus
is the locus with the fastest evolution rate. It would be thus
most natural to guess that the MHC locus has evolved and
not the remaining parts of the genome. We here show that
although the first explanation may still be partially valid, there
are multiple evidences for specific selection of epitopes on
proteins.
Selection of epitopes in human protein groups
We first test the specific selection of epitopes on a protein set
most related to thymic education. A group of proteins directly
Table 1. List of HLA alleles, allele frequencies normalized to 1, fractionof falsely predicted epitope and fraction of measured epitopenot predicted by the different algorithmsa)
Allele Normalized
frequency
False
positives
False
negative
A_2402 1.29E�01 2.87E�02 1.82E�01
A_0201 1.07E�01 6.16E�03 3.69E�01
Cw_0702 9.66E�02 2.52E�02 1.16E�01
Cw_0401 8.26E�02 1.99E�02 1.23E�01
A_1101 7.52E�02 5.90E�03 6.77E�02
B_4001 5.31E�02 1.89E�03 0.00E100
Cw_0602 5.09E�02 2.09E�02 0.00E100
A_0101 4.50E�02 3.38E�02 4.15E�01
A_0301 3.69E�02 2.36E�02 2.32E�01
B_0702 3.61E�02 1.64E�02 1.39E�01
B_3501 3.24E�02 1.56E�02 5.65E�02
B_5101 3.24E�02 7.85E�03 0.00E100
B_0801 2.95E�02 1.87E�02 3.76E�01
B_5801 2.65E�02 3.36E�03 0.00E100
A_3101 2.43E�02 7.45E�03 2.18E�01
B_4403 2.21E�02 8.77E�03 9.36E�02
B_1501 2.06E�02 3.78E�02 3.70E�02
A_6801 1.77E�02 7.68E�03 2.80E�01
B_3901 1.77E�02 1.01E�02 0.00E100
B_0401 1.55E�02 5.95E�03 3.77E�01
B_2705 1.11E�02 6.61E�03 1.55E�01
A_0205 8.85E�03 1.18E�02 2.45E�01
B_5201 8.85E�03 7.26E�03 3.30E�01
B_3801 6.64E�03 1.04E�03 0.00E100
B_4006 5.16E�03 7.18E�03 0.00E100
B_3701 4.42E�03 1.57E�02 0.00E100
B_5102 2.21E�03 3.60E�03 5.56E�02
B_2702 1.47E�03 3.50E�03 2.45E�02
A_3302 1.00E�03 1.37E�03 0.00E100
B_40 1.00E�03 5.31E�03 4.95E�01
B_5103 1.00E�03 9.98E�03 0.00E100
a) False positive values were computed using 100 000 random epitopes,while false negative values were computed using measured epitopes.False negative values of 0 were usually obtained when the number ofobserved epitopes was limited.
Eur. J. Immunol. 2009. 39: 1056–1065Michal Almani et al.1058
& 2009 WILEY-VCH Verlag GmbH & Co. KGaA, Weinheim www.eji-journal.eu
known to be modulated for their presentation to the immune
system are tissue-specific antigens (TSA) upregulated by auto-
immune regulator (AIRE) in thymic medullary epithelial cells.
These are tissue-specific proteins expressed in various thymic
cells [29–31]. AIRE itself is upregulated in medullary thymic
epithelial cells, and it induces the presentation of TSA in the
thymus. An important goal of TSA presentation is thymic
education of T cells [30]. TSA are not known to have any other
functional role in the thymus. The SIR score of TSA in medullary
thymic epithelial cells as defined by Gotter et al. [29] is
significantly higher than all other human proteins (1.13 versus 1,
T-test – po1� e�50, Fig. 4, last column). This result is consistent
over most alleles. The over-presentation of epitopes on TSA cannot
be due to the properties of the MHC binding cleft or to the specific
anchor residues, since TSA in general have no known sequence
similarity between themselves. A similar result is obtained on TSA
regulated by AIRE in monocyte-derived dendritic cells, as detailed by
Sillanpaa et al. [31] (Fig. 4). The difference in SIR score between
TSA and all other human proteins can be explained either as a
selection of TSA antigens, in general, or as the selection of the ones
regulated by AIRE. The later explanation would make sense, given
their role in immune regulation.
A protein group expected to have a lesser impact on the
cellular immune system is secreted proteins. Proteins can be
presented to CTL only if they are cleaved within the cytosol [10].
The resulting peptides can then be transferred to the ER and
presented on MHC-I molecules. Secreted molecules have a higher
probability than other proteins of being transferred to secretory
compartments before their cleavage. Once in such compartments
they are more likely to affect CD41 T cells through the MHC-II
pathway, and not CD81 T cells through the MHC-I pathway [32].
These proteins thus do not present all their potential copy to
MHC molecules, are thus slightly, yet systematically of a lesser
use (on average) for the cellular immune system. These proteins
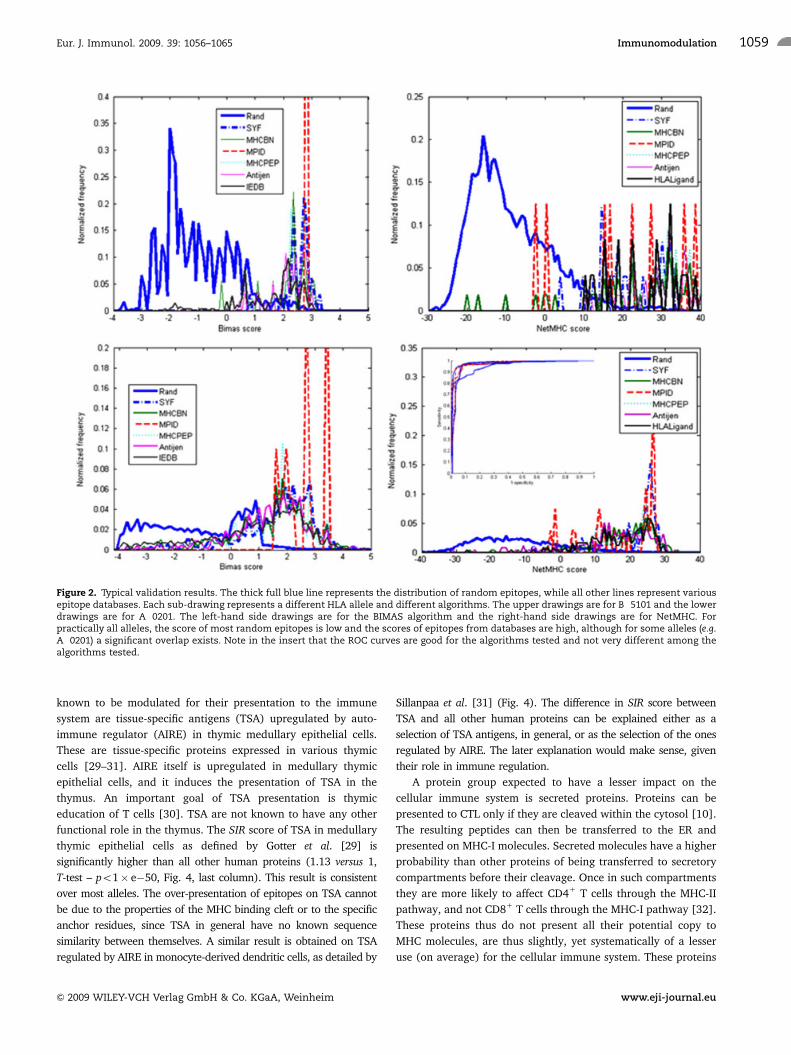
Figure 2. Typical validation results. The thick full blue line represents the distribution of random epitopes, while all other lines represent variousepitope databases. Each sub-drawing represents a different HLA allele and different algorithms. The upper drawings are for B�5101 and the lowerdrawings are for A�0201. The left-hand side drawings are for the BIMAS algorithm and the right-hand side drawings are for NetMHC. Forpractically all alleles, the score of most random epitopes is low and the scores of epitopes from databases are high, although for some alleles (e.g.A�0201) a significant overlap exists. Note in the insert that the ROC curves are good for the algorithms tested and not very different among thealgorithms tested.
Eur. J. Immunol. 2009. 39: 1056–1065 Immunomodulation 1059
& 2009 WILEY-VCH Verlag GmbH & Co. KGaA, Weinheim www.eji-journal.eu
are expected to present (on average) less epitopes. Assigning
each protein its subcellular location in the GeneCards [33], we
can measure the SIR score of all proteins classified as secreted.
Indeed, the secreted proteins’ average SIR score is significantly
lower than the average SIR of all other proteins (0.93 versus 1,
po1� e�40) (Fig. 4). This result is again consistent over
most HLA alleles, demonstrating that selection is systematic and
not due to the binding pattern of a specific MHC molecule.
These two examples show both positive and negative selections.
Proteins selected for presentation to the immune system
have a higher epitope number, while proteins with no significant
importance for the immune system have a lower one. Note again
that ‘‘importance’’ can be at many levels ranging from
thymic selection to the activation of peripheral T cells. The SIR
score differences can be either due to a different amino acid
usage in different protein groups or due to a direct selection for
or against epitopes. In order to check the origin of the SIR
score differences, we repeated the analysis, using as a back-
ground random proteins with an amino acid usage similar to
either TSA or secreted proteins, respectively. The new SIR scores
are much closer to 1 (1.06 for TSA and 0.96 for secreted
proteins), but still statistically different from 1 for both groups
(T-test, po0.05). One can thus conclude that the selection for or
against epitope can either be at the level of the amino acid MHC
molecules tend to bind or at the specific level of epitopes within
the proteins.
Correlation of SIR score and RNA expression level
The total amount of epitopes presented from a protein is a
combination of its transcription level (not necessarily its
concentration, since a protein rapidly degraded has a low
concentration, but can present many epitopes on MHC mole-
cules) and the number of different potential epitopes in the
protein (as measured by the SIR score).
A protein with a low RNA expression level produces a small
total amount of epitopes. Even if these epitopes have a high
affinity for the MHC molecule, the mere low expression level of
the protein limits their amount. Such epitopes are thus less
‘‘important’’ for CTL. Thus, as a first-order approximation, a
protein with a low RNA expression level is expected to be less
‘‘useful’’ for the immune system than one with a high RNA
expression level, both at the level of thymic education and at the
level of peripheral activation. If indeed specific proteins are
selected for the presentation of epitopes, we expect the SIR score
of a protein to be correlated with its RNA expression level. The
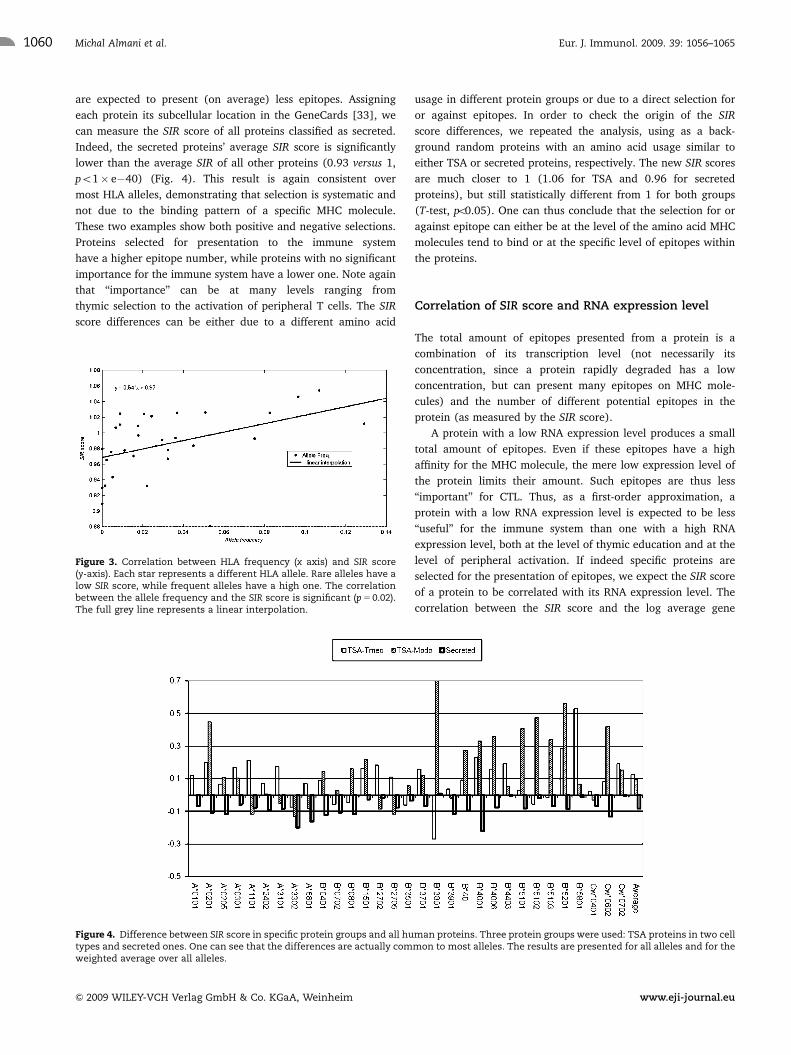
correlation between the SIR score and the log average gene
Figure 4. Difference between SIR score in specific protein groups and all human proteins. Three protein groups were used: TSA proteins in two celltypes and secreted ones. One can see that the differences are actually common to most alleles. The results are presented for all alleles and for theweighted average over all alleles.
Figure 3. Correlation between HLA frequency (x axis) and SIR score(y-axis). Each star represents a different HLA allele. Rare alleles have alow SIR score, while frequent alleles have a high one. The correlationbetween the allele frequency and the SIR score is significant (p 5 0.02).The full grey line represents a linear interpolation.
Eur. J. Immunol. 2009. 39: 1056–1065Michal Almani et al.1060
& 2009 WILEY-VCH Verlag GmbH & Co. KGaA, Weinheim www.eji-journal.eu
expression based on either GeneNote gene expression profiles or
Electronic Northern Expression is indeed positive and significant
(Pearson correlation – r 5 0.076, po1� e-14 and r 5 0.038,
po1� e�7, respectively). A similar correlation was obtained
between the SIR score and the maximal expression level (among
all organs tested). This positive correlation extends to the vast
majority of organs and alleles (Fig. 5). Namely, the RNA
expression in most organs is positively correlated with the SIR
score of most alleles (e.g. the RNA expression in the liver is
significantly and positively correlated with the SIR score of most
HLA alleles). Note that although the correlation itself is not very
strong, it is highly significant. The mere presence of a correlation
is very surprising when one considers the large number of factors
affecting the RNA expression level, and that we looked only at the
number of epitopes and not their characteristics. In addition, for
MHC class I molecules, translation rather than transcription
correlates with presentation. In the absence of such data, we
compared the SIR score to the RNA expression level. One would
suspect that removing all confounders and using protein trans-
lation rates, the correlation would be even more significant,
although this needs further work.
The previous example cannot exclude the possibility that a
third confounder raises both the epitope number and the
protein expression in various situations. In order to directly
test if epitopes are modulated, we looked for selection
of point mutations in epitopes. We cannot directly measure
mutations in the human genome, but we can measure the
polymorphism they induce by looking at single nucleotide
polymorphisms (SNP).
SNP within epitopes
The correlation between epitopes and SNP is measured by dividing
the 156 019 SNP currently mapped in human genes in the Ensembl
genome (33 677 genes) [22] into SNP that are within an epitope
and SNP that are outside epitopes for the eight most highly
expressed HLA alleles (A�0101, A�0201, A�1101, A�2402,
B�4001, B�0702, Cw�0702 and Cw�0401). For example, if a
protein has two epitopes for HLA A�0101, all SNP outside
these two epitopes and their first flanking residue are characterized
as external and all the SNP within at least one of the two
epitopes are characterized as internal. Since we do not know the
HLA haplotype of the population carrying each SNP, we
analyze only the most frequent HLA alleles to maximize the
probability that an SNP is within a person carrying these MHC
alleles. The fraction of non- synonymous SNP (replacement
fraction) is 8% higher in average inside epitopes than outside
epitopes (Chi-square test, po1� e�100) and is consistently higher
in epitopes among all tested MHC alleles. Actually the fraction of
mutations in epitopes is also slightly higher than outside epitopes
(1.6%, Chi-square, po1� e�5), but this result is not consistent
over alleles.
Proteins with high or low SIR score
To summarize, we observe a clear selection of the epitope
number in proteins at the specific protein level, as well as clear
evidence for the mechanism behind this selection. One can now
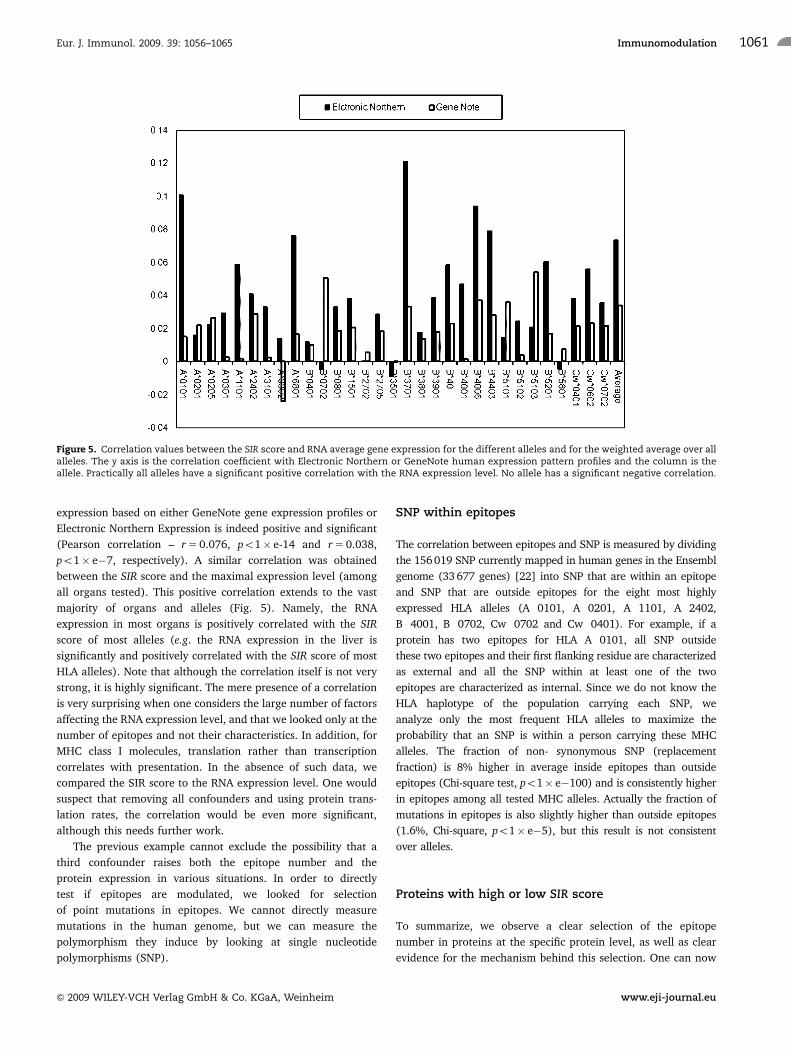
Figure 5. Correlation values between the SIR score and RNA average gene expression for the different alleles and for the weighted average over allalleles. The y axis is the correlation coefficient with Electronic Northern or GeneNote human expression pattern profiles and the column is theallele. Practically all alleles have a significant positive correlation with the RNA expression level. No allele has a significant negative correlation.
Eur. J. Immunol. 2009. 39: 1056–1065 Immunomodulation 1061
& 2009 WILEY-VCH Verlag GmbH & Co. KGaA, Weinheim www.eji-journal.eu
compute which specific proteins are the most up- or down-
regulated. We rank all proteins according to the Chi-square score
of the SIR score. The resulting list (detailed in http://peptibase.
cs.biu.ac.il:64080/SIR_51.html) shows that the high SIR protein
list contains most inflammation response proteins as well as those
related to virus detection. For example, all TLR, but two (TLR1
and TLR6) are in the list of most highly presented proteins, as
well as many transport proteins. Note that the sequence
homology between TLR is minimal. The number of epitopes
expressed by TLR is thus the result of selection for their function
and not of specific sequences. A possible explanation for the
selection of TLR is that TLR are upregulated, in the presence of an
intra-cellular threat, and serve as an additional marker of
infection for the immune system. On the other hand, most
structural proteins, such as those related to bone structure, have a
low SIR score. Thus, again one can see that the average number
of self-epitopes expressed per proteins is in some self-proteins is
adapted to the needs of the immune system. We have shown only
the most obvious elements that can affect epitope selection. Yet
the full list of factors that can make a protein ‘‘useful’’ for the
immune system is very large and requires a careful analysis to be
defined more precisely.
Discussion
We have here shown that the cellular part of the adaptive
immune system is not fully adaptive in the sense that
it has evolved to detect the amino acid distribution of
viruses versus the one of self-proteins. Even within human
proteins, the epitope distribution is not random. Not all proteins
express the same amount of epitopes. Some well-defined
proteins with some significance for the immune system, such as
those highly over expressed in the thymus or inflammation-
related proteins and TLR, express much more epitopes than
others. The epitope repertoire obviously still contains a large
random component. The adaptive immune system produces
random receptors, but many of these receptors targets
(epitopes on the MHC molecules) are found out to be selected.
Interestingly, the selection of target proteins is obtained
not only through the evolution of the immune system itself but
also through specific mutations in the target proteins, as is
evidenced by the high fraction of replacement mutations inside
epitopes. The common over/under-presentation of proteins
groups is not due to a sequence similarity. We have compared
the sequences of the different groups. These sequences contain no
significant homology, specific amino acid usage or length
distribution. This difference is thus probably purely immunolo-
gical. The evolutionary driving force of epitope selection can
occur either at the level of positive and negative selection in the
thymus or in the periphery. In the first case the goal of the
repertoire modulations would be to better train the immune
system. In the second case, the repertoire modulation could affect
either the regulatory function of T cells or their proposed ‘‘house-
keeping’’ functions. CTL have indeed been proposed to have a
regulatory function (parallel to the CD251 CD41 regulatory
T cells) [34, 35].
The current analysis was focused on the CTL response. The
CTL response is the simplest to analyze from a bioinformatics
point of view. Most CTL epitopes are nonamers [35, 36] and the
probability to pass each of the classical TAP-dependent pathway
processing stages can be well estimated by a linear function of the
nonamer sequence. Finally, there are very large databases of
experimentally measured epitopes allowing us to test the preci-
sion of the different algorithms. The error levels of the currently
used algorithms are relatively low. However, the signal we are
measuring still contains a significant amount of noise. Given the
noise level, the presence of such a clear selection and non-
synonymous SNP frequency hints that the observed selection
would have been much stronger in the absence of the noise
induced from the algorithms imprecision. An important caveat of
this work is the assumption that there is no bias for the classical
pathway in one group of protein or the other. However, there is
currently no known group of proteins known to be processed
specifically in one pathway or the other. If indeed such a bias
existed it would show by itself that self-proteins modulate the
way they are expressed to the self-immune system.
The limited number of CTL epitopes (approximately one per
gene per HLA allele in average) makes this part of the immune
system the most prone for selection. One cannot directly apply
the conclusions from the effector part of the cellular immune
system to the other parts of the adaptive immune system (CD41
T cells and B cells). The question of how specific the other parts of
the immune system are still remains open.
Materials and methods
Genomic data
Human protein sequences were used for this analysis. The human
sequences were obtained from the Ensembl database [22]. All
human predicted protein coding regions (exons) were used.
Gene classification
The list of the proteins upregulated by AIRE was extracted from
published in vitro experiments of human cells [29, 31]. The
secreted and membrane proteins were identified by the automatic
extraction of the sub-cellular location of each protein from the
information contained within GeneCards [33], and the subse-
quent categorization of proteins according to their location. All
protein names were translated from their HUGO name (Gene-
Cards) to the appropriate Ensembl entry in order to analyze their
amino acid sequences. The conversion was made according to the
GeneCards. In many cases a protein had several Ensembl
transcripts. When this happened we used the Ensembl transcript
containing the longest sequence.
Eur. J. Immunol. 2009. 39: 1056–1065Michal Almani et al.1062
& 2009 WILEY-VCH Verlag GmbH & Co. KGaA, Weinheim www.eji-journal.eu
Cleavage score
Given a peptide and its two flanking regions FN-P1yPn-FC, the
following score was defined:
SðpeptideÞ ¼ S1ðFNÞ þ S2ðP1Þ þXn�1
i¼2
S3ðPiÞ þ S4ðPnÞ þ S5ðFCÞ
where FN and FC are the N- and C-termini flanking regions, while Pi
are the residues within the peptide. A peptide with a high score, S,
has a high probability of being produced, while a low score has a low
creation probability. The appropriate values for S1–S5 were learned
using a simulated annealing process [37]. Two learning sets were
used. The positive learning set (containing 645 peptides) was
composed of peptides observed to be produced in a variety of
cleavage experiments. The negative learning set (containing 560
peptides) was composed of peptides observed to be either
cleaved in their center or not cleaved at their extremities in the
same cleavage experiments. Extra sub-units are added to the
proteasome in the presence of interferon-g, changing its cleavage
properties. Since our main interest was in the production of peptides
presented on MHC-I, we incorporated results from both the standard
and so-called ‘‘immunoproteasome’’ in our analysis. The algorithm
was validated to have less than 16% false positives and 10% false
negatives ([24] and http://peptibase.cs.biu.ac.il:64080/PepClea-
ve_I/). This methodology takes into account N-terminal cleavage,
which is not necessary for all peptide, but it prevents the bias of
epitopes selected for analysis that may occur in epitope-based
cleavage algorithms.
TAP binding score
The probability that a peptide binds the TAP machinery is mainly
a function of the residues at the first three N-term and the last
C-term positions. Moreover it can be estimated through a linear
combination of the binding energies of each residue. Multiple
algorithms for TAP binding were checked. The score computed by
Peters et al. [25] gave the best differentiation between presented
and random epitopes.
MHC binding motifs
Each gene was divided into all possible nonamers using a sliding
window (e.g. a 300 amino acid protein was divided into 292
nonamers: position 1–9, position 2–10 and so on). For each
nonamer, we computed the MHC binding energy of 31
different HLA class I molecules, most of them being HLA-A and
-B. The affinity of a candidate peptide for each HLA allele was
estimated using the binding coefficients predicted by Parker in
the BIMAS software [13] (http://bimas.cit.nih.gov/.). These
matrices estimate the contribution of each amino acid at each
position to the total binding strength. Anchor residues have a
high contribution, while neutral residues have a value of 1. The
overall binding strength is the product of the binding strength of
the amino acids at each of the nine positions. Although
BIMAS is an old algorithm, it has many advantages
over newer ones. Its main advantage is that most existing
algorithms were learnt on published epitopes, limiting
our possibility of performing an independent validation
of their quality, while BIMAS was learnt using a regression
on measured epitopes offrates [13]. Moreover, BIMAS
provides the raw matrices for a large number of alleles and all
the frequent ones. We have tested other algorithms, but the
error level of much more modern algorithms, such as NetMHC,
was not significantly better than that of BIMAS (Fig. 2)
and they seem to classify a much smaller number of epitopes,
which given the other processing stages lead to no epitope for
most proteins.
HLA frequency and weighted average
The number of currently known different HLA alleles ranges from
hundreds to thousands for HLA-A, -B and -C (A – 527, B – 911,
C – 283, http://www.ebi.ac.uk/imgt/hla/stats.html) [38]. Most
individuals are heterozygous for HLA-A, HLA-B and HLA-C and
express three different heterozygous MHC-I molecules. Different
MHC-I molecules have different racial distributions [39].
The repertoire was computed for 31 alleles maximizing the
population coverage (for the average human HLA distribution
frequency). We used 9 HLA-A (60.8%), 19 HLA-B (44.2%) and 3
HLA-C (31.2%). In order to compute the properties of the
repertoire in a given population, we used a weighted average of
the SIR score on the available HLA, based on the HLA frequency
in the average human population. The average was done on
HLA-A, -B and -C separately, and the weighted score over HLA-A,
-B and -C was averaged with equal weight for A, B and C.
Validation
In order to validate the algorithms used, we checked the score of
peptides present in seven different databases: IEDB [40, 41],
SYFPEITHI [36] – www.syfpeithi.de, MHCBN [42] – http://
www.imtech.res.in/raghava/mhcbn/, MPID [43] – surya.bic.nu-
s.edu.sg/mpid/, MHCPEP [35] – http://www3.oup.co.uk/nar/
database/, AntiJen – http://www.jenner.ac.uk/AntiJen/ and
HLALigand [27] – http://hlaligand.ouhsc.edu/LigandDB).
Assuming that most peptides in the various databases are correct,
we computed the threshold that would maximize the number of
presented peptides from the positive databases, and minimize the
number of peptides in a neutral set of 1 000 000 peptides using
various amino acid distributions. We have checked for each HLA
allele the level of type-I and type-II errors (e.g. Fig. 2) and
attempted to find a cutoff minimizing both. For most alleles we
found cutoffs leading to low errors. A precise list of the false
positive and false negative rates of the algorithms used can be
found in http://peptibase.cs.biu.ac.il/peptibase/validation.htm.
Eur. J. Immunol. 2009. 39: 1056–1065 Immunomodulation 1063
& 2009 WILEY-VCH Verlag GmbH & Co. KGaA, Weinheim www.eji-journal.eu

SNP
The SNP analysis was performed over 33 677 human genes from
the 2005 version of the Ensembl. Given an HLA allele and an
epitope within a gene, we divided the regions within and
surrounding the epitope into four regions: (A) The nucleotides
flanking the C- and N-termini of the epitope (noted as positions 0,
10). (B) The first and last nucleotides in the epitope (noted as
positions 1, 9). (C) The nucleotides in the center of the epitope
(noted as positions 2–8). (D)All nucleotides outside the epitope
that are not directly flanking it.
Each SNP was assigned to one of these four groups according
to its position. The regions’ size obviously varies between HLA
alleles as each HLA has different epitopes. The Replacement fraction
(R/(R1S) ratio) is defined as the fraction of non-synonymous
mutations, where a synonymous mutation is a nucleotide mutation
not leading to an amino acid change (e.g. CGG to CGC, which is at
the amino acid level a R to R), and a non-synonymous mutation is a
nucleotide mutation leading to an amino acid mutation (e.g. CCC to
CAC, which is at the amino acid level a P to H). This fraction is
directly related to the selection level operating on a gene. The R/R1S
ratio of the SNP was computed for each SNP and the R/R1S ratio in
the center of the epitopes (position 2–8) was compared with the R/R
1S ratio outside epitopes, in residues not flanking the epitope. We
ignored at this stage the cleavage sites (positions 0, 1, 9 and 10), as
they may be selected for reasons unrelated to MHC presentation, but
including the cleavage sites does not significantly change the results.
RNA levels
The RNA expression levels of the different proteins used in the
current analysis were extracted from the GeneNote normal tissue
human expression profile [44–46]. For each gene in the
GeneCards database, all the probe-sets representing a single
gene were used. The RNA expression pattern used is the average
expression over these probe-sets.
A second source of expression patterns was from electronic
northern. The NCBI’s Unigene dataset was mined for information
about the number of unique clones per gene per tissue. Clones
were assigned to particular tissues by applying data-mining
heuristics to Unigene’s library information file (Hs.lib.info).
Electronic expression results were calculated by dividing the
number of clones per gene by the number of clones per tissue.
They were then normalized by multiplying by 1 000 000. We used
the average expression over all tissues and the maximal expres-
sion supplied by the Genecards [33, 46].
Statistical analysis
The statistical measurement of selection was performed using
various tests. When comparing two continuous variables, a
Pearson correlation coefficient was used, and we tested the
significance of this correlation. Such a test was used for the RNA
expression level, and the correlation between the allele frequency
and the SIR score. When comparing a few groups of proteins, a two
tail unpaired T-test was used on all the proteins in the groups. This
was used in the comparison of TSA, secreted proteins and all
proteins. When comparing the expected and computed number of
SNP in epitopes or when comparing the number of viral epitopes
compared with their expected number, a Chi-square test was used.
Acknowledgements: The work of Y.L., M.A., S.R., T.V.-S., L.T.
and V.F. was covered by NIH grant: 1 R01 AI61062-01. The work
of T.V.-S. was also covered by a scholarship of Yeshaia Hororwitz
foundation.
Conflict of interest: The authors declare no financial or
commercial conflict of interest.
References
1 Hozumi, N. and Tonegawa, S., Evidence for somatic rearrangement of
immunoglobulin genes coding for variable and constant regions. Proc.
Natl. Acad. Sci. USA 1976. 73: 3628–3632.
2 Early, P., Huang, H., Davis, M., Calame, K. and Hood, L., An immunoglo-
bulin heavy chain variable region gene is generated from three segments
of DNA: VH, D and JH. Cell 1980. 19: 981–992.
3 Weigert, M., Perry, R., Kelley, D., Hunkapiller, T., Schilling, J. and Hood, L.,
The joining of V and J gene segments creates antibody diversity. Nature
1980. 283: 497–499.
4 Nemazee, D., Russell, D., Arnold, B., Haemmerling, G., Allison, J., Miller,
J. F., Morahan, G. and Buerki, K., Clonal deletion of autospecific
B lymphocytes. Immunol. Rev. 1991. 122: 117–132.
5 Prak, E. L. and Weigert, M., Light chain replacement: a new model for
antibody gene rearrangement. J. Exp. Med. 1995. 182: 541–548.
6 Miller, J. F., Self-nonself discrimination and tolerance in T and
B lymphocytes. Immunol. Res. 1993. 12: 115–130.
7 Cope, A. P., Schulze-Koops, H. and Aringer, M., The central role
of T cells in rheumatoid arthritis. Clin. Exp. Rheumatol. 2007. 25:
S4–S11.
8 Wilczynski, J. R., Kalinka, J. and Radwan, M., The role of T-regulatory cells
in pregnancy and cancer. Front. Biosci. 2008. 13: 2275–2289.
9 Williams, A., Peh, C. A. and Elliott, T., The cell biology of MHC class I
antigen presentation. Tissue Antigens 2002. 59: 3–17.
10 Rock, K. L., York, I. A., Saric, T. and Goldberg, A. L., Protein degradation
and the generation of MHC class I-presented peptides. Adv. Immunol.
2002. 80: 1–70.
11 Uebel, S. and Tampe, R., Specificity of the proteasome and the TAP
transporter. Curr. Opin. Immunol. 1999. 11: 203–208.
12 Rammensee, H. G., Bachmann, J. and Stevanovic, S. S., MHC Ligands and
Peptide Motifs, Austin Texas, USA 1997.
13 Parker, K. C., Bednarek, M. A., Hull, L. K., Utz, U., Cunningham, B.,
Zweerink, H. J., Biddison, W. E. and Coligan, J. E., Sequence motifs
important for peptide binding to the human MHC class I molecule, HLA-
A2. J. Immunol. 1992. 149: 3580–3587.
Eur. J. Immunol. 2009. 39: 1056–1065Michal Almani et al.1064
& 2009 WILEY-VCH Verlag GmbH & Co. KGaA, Weinheim www.eji-journal.eu
14 Buus, S., Lauemoller, S. L., Worning, P., Kesmir, C., Frimurer, T.,
Corbet, S., Fomsgaard, A. et al., Sensitive quantitative predictions of
peptide-MHC binding by a ‘Query by Committee’ artificial neural network
approach. Tissue Antigens 2003. 62: 378–384.
15 Bui, H. H., Sidney, J., Peters, B., Sathiamurthy, M., Sinichi, A., Purton,
K. A., Mothe, B. R. et al., Automated generation and evaluation of specific
MHC binding predictive tools: ARB matrix applications. Immunogenetics
2005. 57: 304–314.
16 Bhasin, M. and Raghava, G. P., Pcleavage: an SVM based method for
prediction of constitutive proteasome and immunoproteasome cleavage
sites in antigenic sequences. Nucleic Acids Res. 2005. 33: W202–W207.
17 Saxova, P., Buus, S., Brunak, S. and Kesmir, C., Predicting proteasomal
cleavage sites: a comparison of available methods. Int. Immunol. 2003. 15:
781–787.
18 Kesmir, C., Nussbaum, A. K., Schild, H., Detours, V. and Brunak, S.,
Prediction of proteasome cleavage motifs by neural networks. Protein Eng.
2002. 15: 287–296.
19 Nielsen, M., Lundegaard, C., Lund, O. and Kesmir, C., The role of the
proteasome in generating cytotoxic T-cell epitopes: insights obtained
from improved predictions of proteasomal cleavage. Immunogenetics 2005.
57: 33–41.
20 Singh, H. and Raghava, G. P., ProPred: prediction of HLA-DR binding sites.
Bioinformatics 2001. 17: 1236–1237.
21 Louzoun, Y., Vider, T. and Weigert, M., T-cell epitope repertoire as
predicted from human and viral genomes. Mol. Immunol. 2006. 43:
559–569.
22 Birney, E., Andrews, T. D., Bevan, P., Caccamo, M., Chen, Y., Clarke, L.,
Coates, G. et al., An overview of ensembl, Ensembl 2004. Genome Res. 2004.
14: 925–928.
23 Louzoun, Y. and Vider, T., Score for proteasomal peptide production
probability. Immunology 2004. 1.
24 Ginodi, I., Vider-Shalit, T., Tsaban, L. and Louzoun, Y., Precise score for
the prediction of peptides cleaved by the proteasome. Bioinformatics 2008.
24: 477–483.
25 Peters, B., Bulik, S., Tampe, R., Endert, P. M. V. and Holzhutter, H. G.,
Identifying MHC class I epitopes by predicting the TAP transport
efficiency of epitope precursors. J. Immunol. 2003. 171: 1741–1749.
26 Parham, P. and Ohta, T., Population biology of antigen presentation by
MHC class I molecules. Science 1996. 272: 67–74.
27 Sathiamurthy, M., Hickman, H. D., Cavett, J. W., Zahoor, A., Prilliman, K.,
Metcalf, S., Fernandez Vina, M. and Hildebrand, W. H., Population of the
HLA ligand database. Tissue Antigens 2003. 61: 12–19.
28 Vider-Shalit, T., Fishbain, V., Raffaeli, S. and Louzoun, Y., Phase
dependent immune evasion of Herpesviruses. J. Virol. 2007. 81: 9536–9545.
29 Gotter, J., Brors, B., Hergenhahn, M. and Kyewski, B., Medullary epithelial
cells of the human thymus express a highly diverse selection of tissue-
specific genes colocalized in chromosomal clusters. J. Exp. Med. 2004. 199:
155–166.
30 Kont, V., Laan, M., Kisand, K., Merits, A., Scott, H. S. and Peterson, P.,
Modulation of Aire regulates the expression of tissue-restricted antigens.
Mol. Immunol. 2007. 45: 25–33.
31 Sillanpaa, N., Magureanu, C. G., Murumagi, A., Reinikainen, A., West, A.,
Manninen, A., Lahti, M. et al., Autoimmune regulator induced changes in
the gene expression profile of human monocyte-dendritic cell-lineage.
Mol. Immunol. 2004. 41: 1185–1198.
32 Rush, C., Mitchell, T. and Garside, P., Efficient priming of CD41 and CD81
T cells by DNA vaccination depends on appropriate targeting of sufficient
levels of immunologically relevant antigen to appropriate processing
pathways. J. Immunol. 2002. 169: 4951–4960.
33 Rebhan, M., Chalifa-Caspi, V., Prilusky, J. and Lancet, D., GeneCards:
Encyclopedia for Genes, Proteins and Diseases, Weizmann Institute of
Science, Bioinformatics Unit and Genome Center, Rehovot, Israel 1997.
34 Dhodapkar, M. V. and Steinman, R. M., Antigen-bearing immature
dendritic cells induce peptide-specific CD8(1) regulatory T cells in vivo
in humans. Blood 2002. 100: 174–177.
35 Brusic, V., Rudy, G. and Harrison, L. C., MHCPEP, a database of MHC-
binding peptides: update 1997. Nucleic Acids Res. 1998. 26: 368–371.
36 Rammensee, H., Bachmann, J., Emmerich, N. P., Bachor, O. A. and
Stevanovic, S., SYFPEITHI: database for MHC ligands and peptide motifs.
Immunogenetics 1999. 50: 213–219.
37 Kirkpatrick, S., Gelatt, C. D. and Vecchi, M. P., Optimization by Simulated
Annealing. Science 1983. 220: 671–680.
38 Robinson, J., Waller, M. J., Parham, P., Bodmer, J. G. and Marsh, S. G. E.,
IMGT/HLA Database – a sequence database for the human major
histocompatibility complex. Nucleic Acids Res. 2001. 29: 210–213.
39 Marsh, S. G. E., Parham, P. and Barber, L. D., The HLA Facts Book. Academic
Press, London, UK 2000.
40 Peters, B., Sidney, J., Bourne, P., Bui, H. H., Buus, S., Doh, G., Fleri, W. et al.,
The immune epitope database and analysis resource: from vision to
blueprint. PLoS Biol. 2005. 3: e91.
41 Sathiamurthy, M., Peters, B., Bui, H. H., Sidney, J., Mokili, J., Wilson, S. S., Fleri,
W. et al., An ontology for immune epitopes: application to the design of a
broad scope database of immune reactivities. Immunome Res. 2005. 1: 2.
42 Bhasin, M., Singh, H. and Raghava, G. P., MHCBN: a comprehensive
database of MHC binding and non-binding peptides. Bioinformatics 2003.
19: 665–666.
43 Govindarajan, K. R., Kangueane, P., Tan, T. W. and Ranganathan, S.,
MPID: MHC-Peptide Interaction Database for sequence-structure-func-
tion information on peptides binding to MHC molecules. Bioinformatics
2003. 19: 309–310.
44 Chalifa-Caspi, V., Shmueli, O., Benjamin-Rodrig, H., Rosen, N., Shmoish, M.,
Yanai, I., Ophir, R. et al., GeneAnnot: interfacing GeneCards with high-
throughput gene expression compendia. Brief Bioinform. 2003. 4: 349–360.
45 Shmueli, O., Horn-Saban, S., Chalifa-Caspi, V., Shmoish, M., Ophir, R.,
Benjamin-Rodrig, H., Safran, M. et al., GeneNote: whole genome expres-
sion profiles in normal human tissues. C. R. Biol. 2003. 326: 1067–1072.
46 Yanai, I., Benjamin, H., Shmoish, M., Chalifa-Caspi, V., Shklar, M.,
Ophir, R., Bar-Even, A. et al., Genome-wide midrange transcription
profiles reveal expression level relationships in human tissue specifica-
tion. Bioinformatics 2005. 21: 650–659.
Abbreviations: AIRE: autoimmune regulator � SIR: size of immune
repertoire � SNP: single nucleotide polymorphisms � TSA: tissue-
specific antigens
Full correspondence: Dr. Yoram Louzoun, Math department and Gonda
Brain research center, Bar Ilan University, Ramat Gan 52900, Israel
Fax: +972-3-738-4057
e-mail: [email protected]
Received: 19/3/2008
Revised: 17/11/2008
Accepted: 19/12/2008
Eur. J. Immunol. 2009. 39: 1056–1065 Immunomodulation 1065
& 2009 WILEY-VCH Verlag GmbH & Co. KGaA, Weinheim www.eji-journal.eu