Embed Size (px)
Citation preview
SAPS TOGETHER SQUEEZING CRIME to ZEROSAPS Members, My Family - Together Pushing Back The Frontiers Of Evil
ANNUAL REPORT 2010/2011SOUTH AFRICAN POLICE SERVICE
193
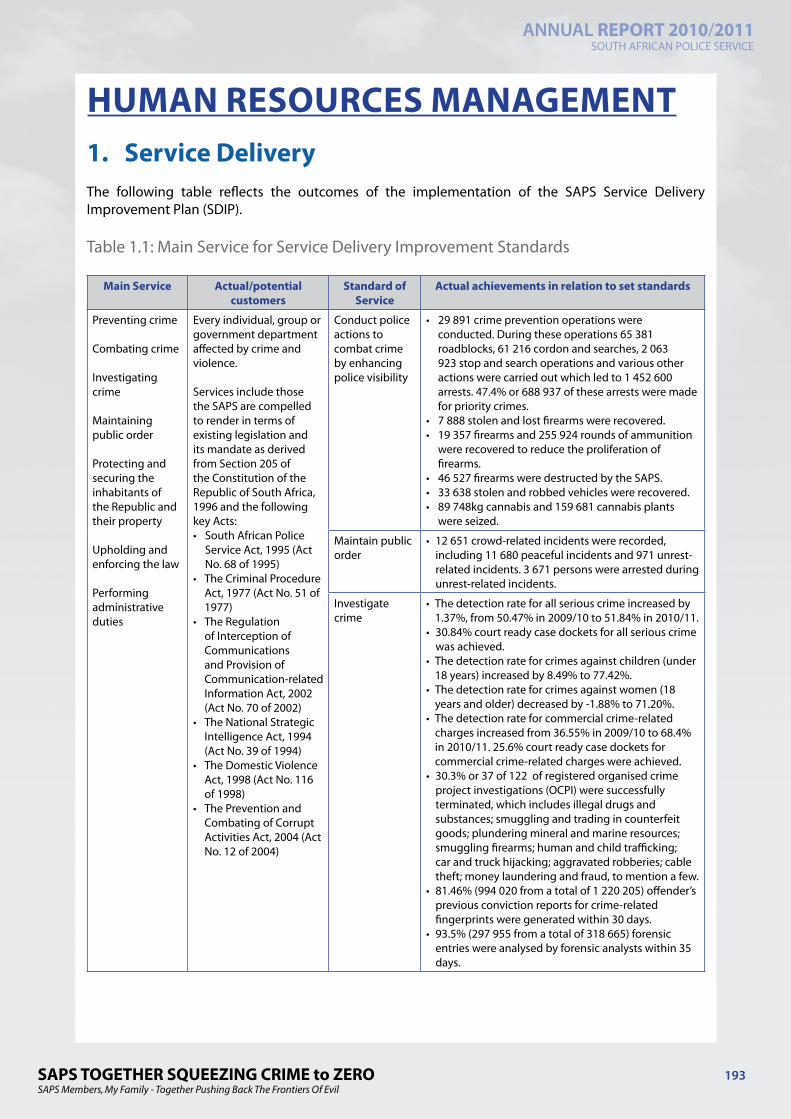
HUMAN RESOURCES MANAGEMENT1. Service DeliveryThe following table reflects the outcomes of the implementation of the SAPS Service Delivery Improvement Plan (SDIP).
Table 1.1: Main Service for Service Delivery Improvement Standards
Main Service Actual/potential customers
Standard of Service
Actual achievements in relation to set standards
Preventing crime
Combating crime
Investigating crime
Maintaining public order
Protecting and securing the inhabitants of the Republic and their property
Upholding and enforcing the law
Performing administrative duties
Every individual, group or government department affected by crime and violence.
Services include those the SAPS are compelled to render in terms of existing legislation and its mandate as derived from Section 205 of the Constitution of the Republic of South Africa, 1996 and the following key Acts:• South African Police
Service Act, 1995 (Act No. 68 of 1995)
• The Criminal Procedure Act, 1977 (Act No. 51 of 1977)
• The Regulation of Interception of Communications and Provision of Communication-related Information Act, 2002 (Act No. 70 of 2002)
• The National Strategic Intelligence Act, 1994 (Act No. 39 of 1994)
• The Domestic Violence Act, 1998 (Act No. 116 of 1998)
• The Prevention and Combating of Corrupt Activities Act, 2004 (Act No. 12 of 2004)
Conduct police actions to combat crime by enhancing police visibility
• 29 891 crime prevention operations were conducted. During these operations 65 381 roadblocks, 61 216 cordon and searches, 2 063 923 stop and search operations and various other actions were carried out which led to 1 452 600 arrests. 47.4% or 688 937 of these arrests were made for priority crimes.
• 7 888 stolen and lost firearms were recovered.• 19 357 firearms and 255 924 rounds of ammunition
were recovered to reduce the proliferation of firearms.
• 46 527 firearms were destructed by the SAPS.• 33 638 stolen and robbed vehicles were recovered.• 89 748kg cannabis and 159 681 cannabis plants
were seized.
Maintain public order
• 12 651 crowd-related incidents were recorded, including 11 680 peaceful incidents and 971 unrest-related incidents. 3 671 persons were arrested during unrest-related incidents.
Investigate crime
• The detection rate for all serious crime increased by 1.37%, from 50.47% in 2009/10 to 51.84% in 2010/11.
• 30.84% court ready case dockets for all serious crime was achieved.
• The detection rate for crimes against children (under 18 years) increased by 8.49% to 77.42%.
• The detection rate for crimes against women (18 years and older) decreased by -1.88% to 71.20%.
• The detection rate for commercial crime-related charges increased from 36.55% in 2009/10 to 68.4% in 2010/11. 25.6% court ready case dockets for commercial crime-related charges were achieved.
• 30.3% or 37 of 122 of registered organised crime project investigations (OCPI) were successfully terminated, which includes illegal drugs and substances; smuggling and trading in counterfeit goods; plundering mineral and marine resources; smuggling firearms; human and child trafficking; car and truck hijacking; aggravated robberies; cable theft; money laundering and fraud, to mention a few.
• 81.46% (994 020 from a total of 1 220 205) offender’s previous conviction reports for crime-related fingerprints were generated within 30 days.
• 93.5% (297 955 from a total of 318 665) forensic entries were analysed by forensic analysts within 35 days.

SAPS TOGETHER SQUEEZING CRIME to ZEROSAPS Members, My Family - Together Pushing Back The Frontiers Of Evil
ANNUAL REPORT 2010/2011SOUTH AFRICAN POLICE SERVICE
194
Table 1.2: Consultation arrangements with clients
The aim when creating consultation arrangements with clients is to: deepen partnerships with communities, and promote inter-departmental, national and international events through communication projects.
Type of arrangement Clients Actual achievements
Awareness campaigns General public, including children, youth and vulnerable groups
Various awareness campaigns were conducted in communities, giving attention to the specific needs regarding crimes prevalent in their area such as gender-based violence, the reduction of violent crimes, drug awareness, and promotion of community involvement in crime prevention.
Rural Safety Rural community A comprehensive Rural Safety Strategy to enhance safety and security, accessibility to policing and service delivery to the rural community was approved by the Minister of Police. The aim of the strategy is to address rural safety as part of an integrated and holistic day-to-day crime prevention approach based on the principles of sector policing, to addresses the needs of the entire rural community, including the farming community.
School Safety School-going children The SAPS engaged in a partnership with the Department of Basic Education to link police stations to schools; establish Safe School Committees, implement joint social crime prevention programmes and to mobilise communities to take ownership. 9 000 public schools established Safe School Committees.
1 001 schools with 174 248 learners were visited to discuss drug and substance abuse, safety when crossing the road and crime-related issues.
Crime Prevention The general public Recognising that the Department of Police alone cannot prevent crime, necessitates the engagement of the SAPS in partnerships to prevent crime and in mobilising communities and specific sectors to address crimes that affect them. During 2010/11 the SAPS:• Received 168 560 calls and 686 web tips at its Crime Stop
call centre which led to 226 positive cases.• Received 1 257 SMS tips and 632 web tips as a result of
the partnership between the Primedia group and the SAPS which led to 73 positive cases.
Firearms Control Businesses dealing in firearms and the general public
• 1 936 institutions such as training providers, shooting ranges, hunting associations and sport-shooting organisations were accredited since the implementation of the firearms control legislation (i.e. 107 additional to 1 829 institutions at the end of March 2010).
• 268 459 firearm license renewals and 240 422 competency certifications were issued from 1 April 2010 to 31 March 2011.
• Some provisions of the Firearms Control Amendment Act were put into operation in order to provide for a mechanism to renew competency certificates in respect of firearms. The Act also provides for the extension of the validity period of some categories of firearms licenses, such as conducting business as a game rancher and conducting business in hunting from five years to ten years and for other business purposes from two years to five years.
SAPS TOGETHER SQUEEZING CRIME to ZEROSAPS Members, My Family - Together Pushing Back The Frontiers Of Evil
ANNUAL REPORT 2010/2011SOUTH AFRICAN POLICE SERVICE
195
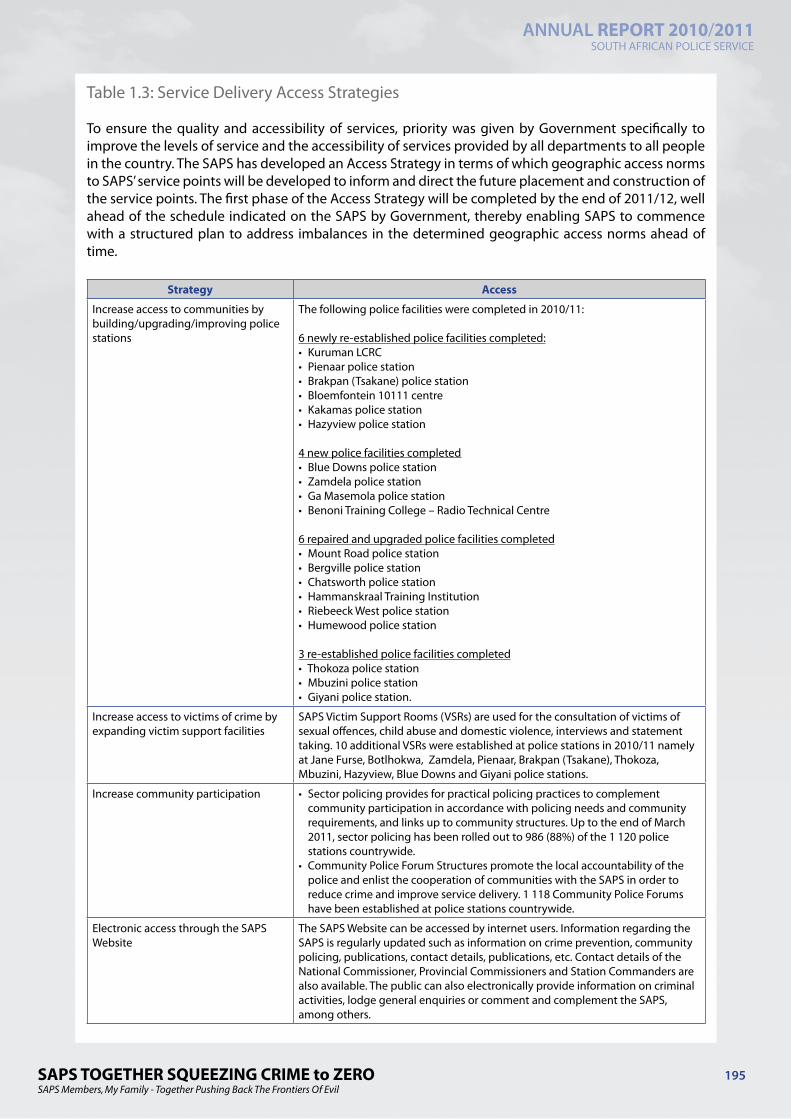
Table 1.3: Service Delivery Access Strategies
To ensure the quality and accessibility of services, priority was given by Government specifically to improve the levels of service and the accessibility of services provided by all departments to all people in the country. The SAPS has developed an Access Strategy in terms of which geographic access norms to SAPS’ service points will be developed to inform and direct the future placement and construction of the service points. The first phase of the Access Strategy will be completed by the end of 2011/12, well ahead of the schedule indicated on the SAPS by Government, thereby enabling SAPS to commence with a structured plan to address imbalances in the determined geographic access norms ahead of time.
Strategy Access
Increase access to communities by building/upgrading/improving police stations
The following police facilities were completed in 2010/11:
6 newly re-established police facilities completed:• Kuruman LCRC• Pienaar police station• Brakpan (Tsakane) police station• Bloemfontein 10111 centre• Kakamas police station• Hazyview police station
4 new police facilities completed• Blue Downs police station• Zamdela police station• Ga Masemola police station• Benoni Training College – Radio Technical Centre
6 repaired and upgraded police facilities completed• Mount Road police station• Bergville police station• Chatsworth police station• Hammanskraal Training Institution• Riebeeck West police station• Humewood police station
3 re-established police facilities completed• Thokoza police station• Mbuzini police station• Giyani police station.
Increase access to victims of crime by expanding victim support facilities
SAPS Victim Support Rooms (VSRs) are used for the consultation of victims of sexual offences, child abuse and domestic violence, interviews and statement taking. 10 additional VSRs were established at police stations in 2010/11 namely at Jane Furse, Botlhokwa, Zamdela, Pienaar, Brakpan (Tsakane), Thokoza, Mbuzini, Hazyview, Blue Downs and Giyani police stations.
Increase community participation • Sector policing provides for practical policing practices to complement community participation in accordance with policing needs and community requirements, and links up to community structures. Up to the end of March 2011, sector policing has been rolled out to 986 (88%) of the 1 120 police stations countrywide.
• Community Police Forum Structures promote the local accountability of the police and enlist the cooperation of communities with the SAPS in order to reduce crime and improve service delivery. 1 118 Community Police Forums have been established at police stations countrywide.
Electronic access through the SAPS Website
The SAPS Website can be accessed by internet users. Information regarding the SAPS is regularly updated such as information on crime prevention, community policing, publications, contact details, publications, etc. Contact details of the National Commissioner, Provincial Commissioners and Station Commanders are also available. The public can also electronically provide information on criminal activities, lodge general enquiries or comment and complement the SAPS, among others.
SAPS TOGETHER SQUEEZING CRIME to ZEROSAPS Members, My Family - Together Pushing Back The Frontiers Of Evil
ANNUAL REPORT 2010/2011SOUTH AFRICAN POLICE SERVICE
196
Strategy Access
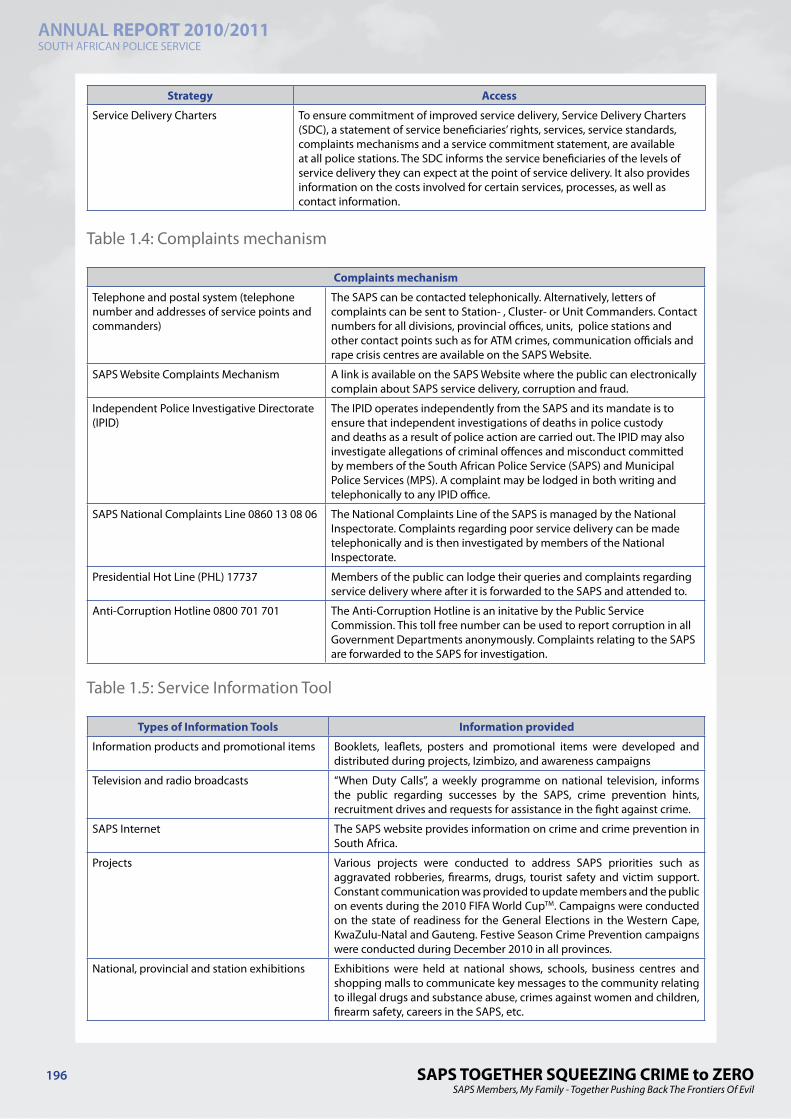
Service Delivery Charters To ensure commitment of improved service delivery, Service Delivery Charters (SDC), a statement of service beneficiaries’ rights, services, service standards, complaints mechanisms and a service commitment statement, are available at all police stations. The SDC informs the service beneficiaries of the levels of service delivery they can expect at the point of service delivery. It also provides information on the costs involved for certain services, processes, as well as contact information.
Table 1.4: Complaints mechanism
Complaints mechanism
Telephone and postal system (telephone number and addresses of service points and commanders)
The SAPS can be contacted telephonically. Alternatively, letters of complaints can be sent to Station- , Cluster- or Unit Commanders. Contact numbers for all divisions, provincial offices, units, police stations and other contact points such as for ATM crimes, communication officials and rape crisis centres are available on the SAPS Website.
SAPS Website Complaints Mechanism A link is available on the SAPS Website where the public can electronically complain about SAPS service delivery, corruption and fraud.
Independent Police Investigative Directorate (IPID)
The IPID operates independently from the SAPS and its mandate is to ensure that independent investigations of deaths in police custody and deaths as a result of police action are carried out. The IPID may also investigate allegations of criminal offences and misconduct committed by members of the South African Police Service (SAPS) and Municipal Police Services (MPS). A complaint may be lodged in both writing and telephonically to any IPID office.
SAPS National Complaints Line 0860 13 08 06 The National Complaints Line of the SAPS is managed by the National Inspectorate. Complaints regarding poor service delivery can be made telephonically and is then investigated by members of the National Inspectorate.
Presidential Hot Line (PHL) 17737 Members of the public can lodge their queries and complaints regarding service delivery where after it is forwarded to the SAPS and attended to.
Anti-Corruption Hotline 0800 701 701 The Anti-Corruption Hotline is an initative by the Public Service Commission. This toll free number can be used to report corruption in all Government Departments anonymously. Complaints relating to the SAPS are forwarded to the SAPS for investigation.
Table 1.5: Service Information Tool
Types of Information Tools Information provided
Information products and promotional items Booklets, leaflets, posters and promotional items were developed and distributed during projects, Izimbizo, and awareness campaigns
Television and radio broadcasts “When Duty Calls”, a weekly programme on national television, informs the public regarding successes by the SAPS, crime prevention hints, recruitment drives and requests for assistance in the fight against crime.
SAPS Internet The SAPS website provides information on crime and crime prevention in South Africa.
Projects Various projects were conducted to address SAPS priorities such as aggravated robberies, firearms, drugs, tourist safety and victim support. Constant communication was provided to update members and the public on events during the 2010 FIFA World CupTM. Campaigns were conducted on the state of readiness for the General Elections in the Western Cape, KwaZulu-Natal and Gauteng. Festive Season Crime Prevention campaigns were conducted during December 2010 in all provinces.
National, provincial and station exhibitions Exhibitions were held at national shows, schools, business centres and shopping malls to communicate key messages to the community relating to illegal drugs and substance abuse, crimes against women and children, firearm safety, careers in the SAPS, etc.

SAPS TOGETHER SQUEEZING CRIME to ZEROSAPS Members, My Family - Together Pushing Back The Frontiers Of Evil
ANNUAL REPORT 2010/2011SOUTH AFRICAN POLICE SERVICE
197
Types of Information Tools Information provided
SAPS Museums SAPS Museums showcase the positive aspects and achievements of policing, focusing on education and building partnerships.
Service Delivery Charters and Service Delivery Improvement Plans
Service Delivery Charters are available and visible at police stations indicating the services being delivered and the standard of services. Service Delivery Plans are compiled at all levels, which is cascaded into Performance Agreements and individual performance plans.
SAPS Strategic Plan 2010 to 2014 The SAPS Strategic Plan directs strategic and operational planning within the Department for a five-year period. The plan was distributed to role players and is available on the SAPS Website.
Annual Performance Plan 2010/11 The Annual Performance Plan, extrapolated from the Strategic Plan, provides a clear indication of the strategic priorities within the context of the prevailing financial year, the measurable objectives and targets associated with the priorities, and guidelines for the implementation of the one-year focus. Performance plans are compiled at all levels within the SAPS which are aligned to and support the Annual Performance Plan. The plan was distributed to role players and is available on the SAPS Website.
Media liaison Radio talks, television interviews, presentations as well as the printed media are utilised to advise the community e.g. on processes and procedures, SAPS successes, initiatives and operations, the policing of special events and tourist safety.
Internal communication Various internal communication mediums exist such as:• The SAPS Intranet (e.g. SAPS Strategic Plan, SAPS Annual Performance
Plan, SAPS Annual Report, press releases and speeches, careers and vacant posts),
• PolTV (an in-house broadcast medium which serves as a platform for police management to communicate with its employees and to provide members with information regarding the SAPS priorities)
• The SAPS Journal (an in-house magazine which focuses on police successes and good practices)
• Monthly salary advices (reflect important messages from top management).
2. ExpenditureThe following tables summarize final audited expenditure by programme (Table 2.1) and by salary bands (Table 2.2). In particular, it provides an indication of the amount spent on personnel costs in terms of each of the programmes or salary bands within the department.
Table 2.1: Personnel costs by programme, 1 April 2010 to 31 March 2011
Programme Total Expenditure
(R’000)
Compensation of Employees
(R’000)
Training Expenditure
(R’000)
Compensation of Employees
as percent of Total
Expenditure
Average Compensation of Employees
Cost per Employee
(R’000)
Employment
Administration 17 871 936 9 686 512 1 130 329 18,1 290 33352
Visible Policing 21 702 627 17 241 363 32,2 176 97693
Detective Service 8 868 123 6 941 683 13,0 186 37402
Crime Intelligence 1 947 626 1 680 164 3,1 193 8723
Protection & Security Services 3 139 388 2 865 615 5,4 171 16722
Total 53 529 700 38 415 337 1 130 329 71,8 198 193892
SAPS TOGETHER SQUEEZING CRIME to ZEROSAPS Members, My Family - Together Pushing Back The Frontiers Of Evil
ANNUAL REPORT 2010/2011SOUTH AFRICAN POLICE SERVICE
198
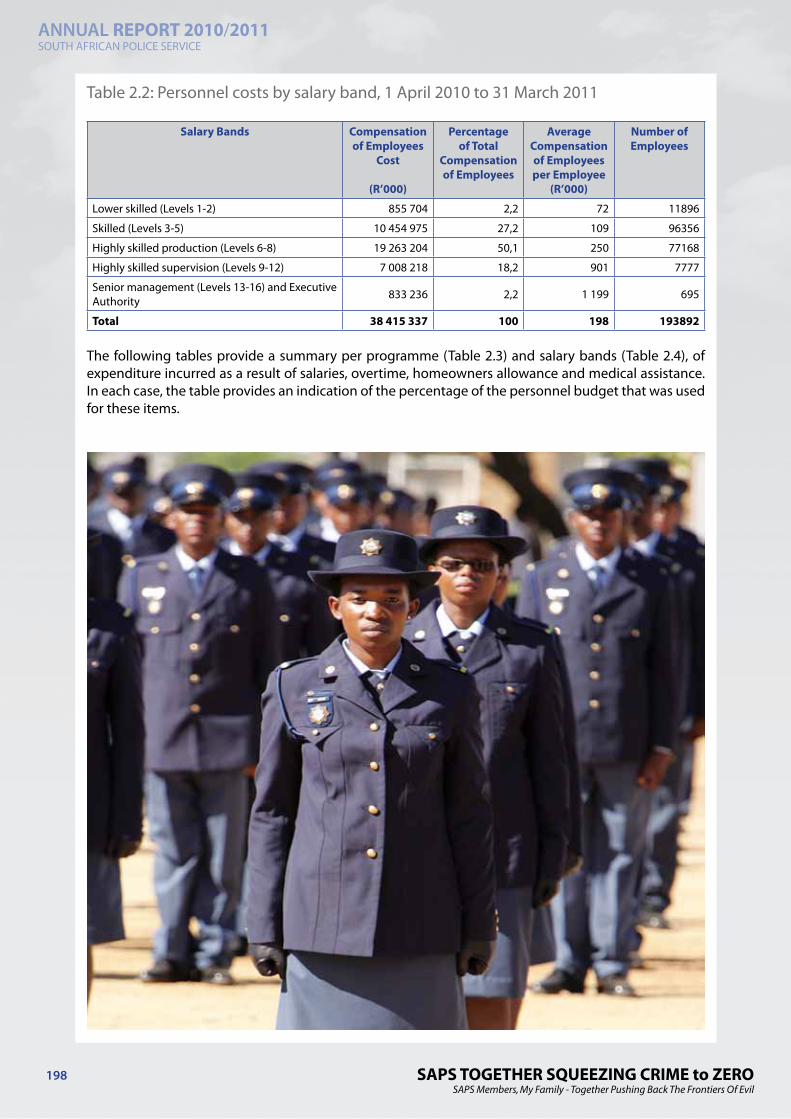
Table 2.2: Personnel costs by salary band, 1 April 2010 to 31 March 2011
Salary Bands Compensation of Employees
Cost
(R’000)
Percentage of Total
Compensation of Employees
Average Compensation of Employees per Employee
(R’000)
Number of Employees
Lower skilled (Levels 1-2) 855 704 2,2 72 11896
Skilled (Levels 3-5) 10 454 975 27,2 109 96356
Highly skilled production (Levels 6-8) 19 263 204 50,1 250 77168
Highly skilled supervision (Levels 9-12) 7 008 218 18,2 901 7777
Senior management (Levels 13-16) and Executive Authority 833 236 2,2 1 199 695
Total 38 415 337 100 198 193892
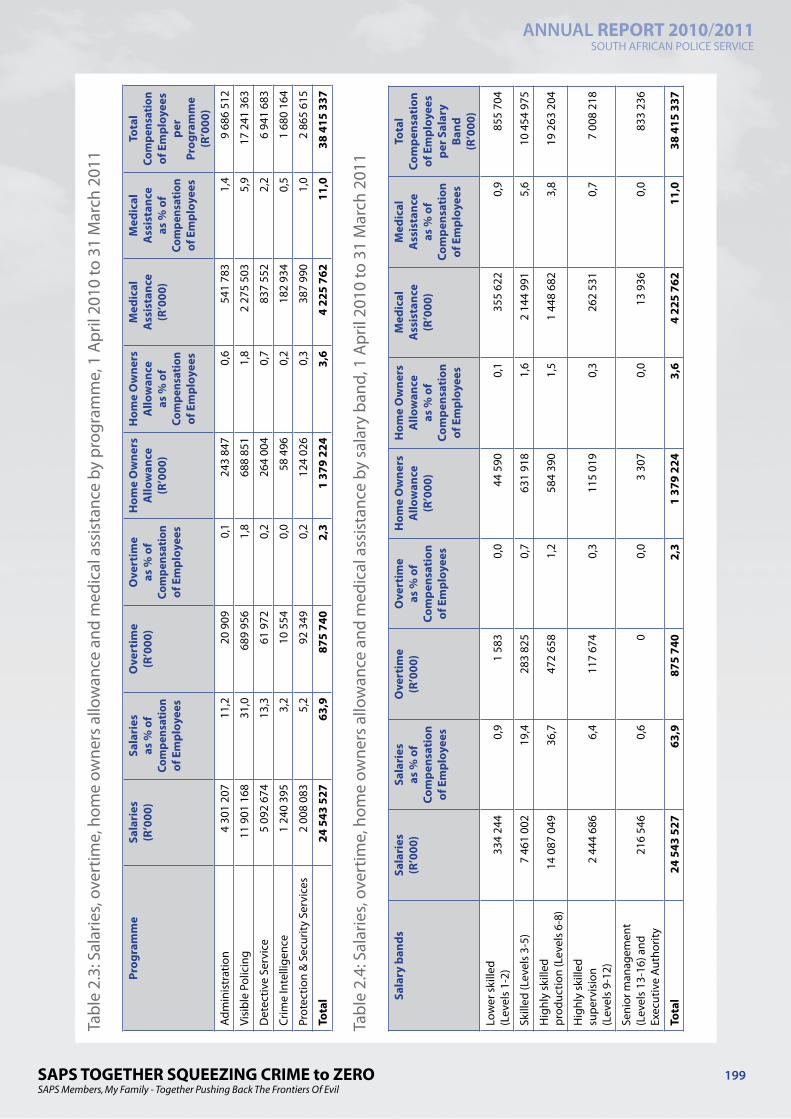
The following tables provide a summary per programme (Table 2.3) and salary bands (Table 2.4), of expenditure incurred as a result of salaries, overtime, homeowners allowance and medical assistance. In each case, the table provides an indication of the percentage of the personnel budget that was used for these items.
SAPS TOGETHER SQUEEZING CRIME to ZEROSAPS Members, My Family - Together Pushing Back The Frontiers Of Evil
ANNUAL REPORT 2010/2011SOUTH AFRICAN POLICE SERVICE
199
Tabl
e 2.
3: S
alar
ies,
over
time,
hom
e ow
ners
allo
wan
ce a
nd m
edic
al a
ssis
tanc
e by
pro
gram
me,
1 A
pril
2010
to 3
1 M
arch
201
1
Prog
ram
me
Sala
ries
(R
’000
)Sa
lari
es
as %
of
Com
pens
atio
n of
Em
ploy
ees
Ove
rtim
e (R
’000
)O
vert
ime
as %
of
Com
pens
atio
n of
Em
ploy
ees
Hom
e O
wne
rs
Allo
wan
ce
(R’0
00)
Hom
e O
wne
rs
Allo
wan
ce
as %
of
Com
pens
atio
n of
Em
ploy
ees
Med
ical
A
ssis
tanc
e (R
’000
)
Med
ical
A
ssis
tanc
e as
% o
f Co
mpe
nsat
ion
of E
mpl
oyee
s
Tota
l Co
mpe
nsat
ion
of E
mpl
oyee
s pe
r Pr
ogra
mm
e (R
’000
)
Adm
inis
trat
ion
4 30
1 20
711
,220
909
0,1
243
847
0,6
541
783
1,4
9 68
6 51
2
Visi
ble
Polic
ing
11 9
01 1
6831
,068
9 95
61,
868
8 85
11,
82
275
503
5,9
17 2
41 3
63
Det
ectiv
e Se
rvic
e 5
092
674
13,3
61 9
720,
226
4 00
40,
783
7 55
22,
26
941
683
Crim
e In
telli
genc
e1
240
395
3,2
10 5
540,
058
496
0,2
182
934
0,5
1 68
0 16
4
Prot
ectio
n &
Sec
urity
Ser
vice
s2
008
083
5,2
92 3
490,
212
4 02
60,
338
7 99
01,
02
865
615
Tota
l24
543
527
63,9
875
740
2,3
1 37
9 22
43,
64
225
762
11,0
38 4
15 3
37
Tabl
e 2.
4: S
alar
ies,
over
time,
hom
e ow
ners
allo
wan
ce a
nd m
edic
al a
ssis
tanc
e by
sal
ary
band
, 1 A
pril
2010
to 3
1 M
arch
201
1
Sala
ry b
ands
Sala
ries
(R
’000
)Sa
lari
es
as %
of
Com
pens
atio
n of
Em
ploy
ees
Ove
rtim
e (R
’000
)O
vert
ime
as %
of
Com
pens
atio
n of
Em
ploy
ees
Hom
e O
wne
rs
Allo
wan
ce
(R’0
00)
Hom
e O
wne
rs
Allo
wan
ce
as %
of
Com
pens
atio
n of
Em
ploy
ees
Med
ical
A
ssis
tanc
e (R
’000
)
Med
ical
A
ssis
tanc
e as
% o
f Co
mpe
nsat
ion
of E
mpl
oyee
s
Tota
l Co
mpe
nsat
ion
of E
mpl
oyee
s pe
r Sal
ary
Band
(R
’000
)
Low
er s
kille
d(L
evel
s 1-
2)
334
244
0,9
1 58
30,
044
590
0,1
355
622
0,9
855
704
Skill
ed (L
evel
s 3-
5)
7 46
1 00
219
,428
3 82
50,
763
1 91
81,
62
144
991
5,6
10 4
54 9
75
Hig
hly
skill
ed
prod
uctio
n (L
evel
s 6-
8)
14 0
87 0
4936
,747
2 65
81,
258
4 39
01,
51
448
682
3,8
19 2
63 2
04
Hig
hly
skill
ed
supe
rvis
ion
(Lev
els
9-12
) 2
444
686
6,4
117
674
0,3
115
019
0,3
262
531
0,7
7 00
8 21
8
Seni
or m
anag
emen
t (L
evel
s 13
-16)
and
Ex
ecut
ive
Auth
ority
216
546
0,6
00,
03
307
0,0
13 9
360,
083
3 23
6
Tota
l24
543
527
63,9
875
740
2,3
1 37
9 22
43,
64
225
762
11,0
38 4
15 3
37
SAPS TOGETHER SQUEEZING CRIME to ZEROSAPS Members, My Family - Together Pushing Back The Frontiers Of Evil
ANNUAL REPORT 2010/2011SOUTH AFRICAN POLICE SERVICE
200
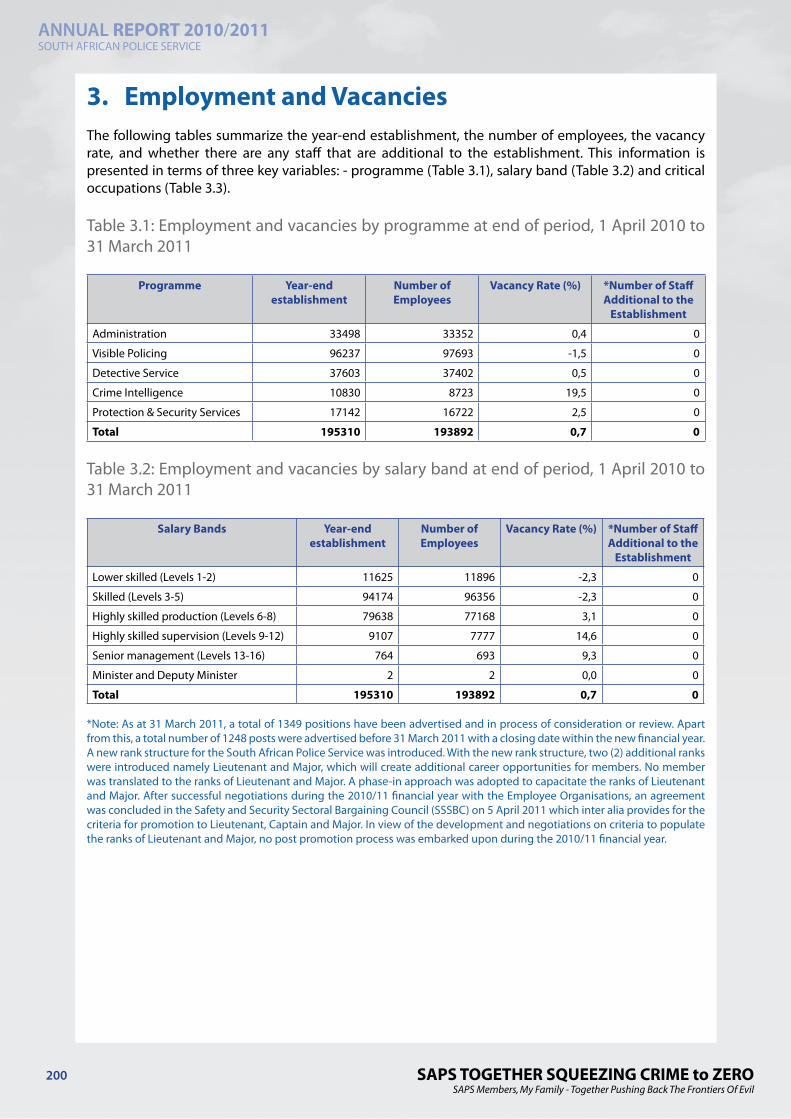
3. Employment and VacanciesThe following tables summarize the year-end establishment, the number of employees, the vacancy rate, and whether there are any staff that are additional to the establishment. This information is presented in terms of three key variables: - programme (Table 3.1), salary band (Table 3.2) and critical occupations (Table 3.3).
Table 3.1: Employment and vacancies by programme at end of period, 1 April 2010 to 31 March 2011
Programme Year-end establishment
Number of Employees
Vacancy Rate (%) *Number of Staff Additional to the
Establishment
Administration 33498 33352 0,4 0
Visible Policing 96237 97693 -1,5 0
Detective Service 37603 37402 0,5 0
Crime Intelligence 10830 8723 19,5 0
Protection & Security Services 17142 16722 2,5 0
Total 195310 193892 0,7 0
Table 3.2: Employment and vacancies by salary band at end of period, 1 April 2010 to 31 March 2011
Salary Bands Year-end establishment
Number of Employees
Vacancy Rate (%) *Number of Staff Additional to the
Establishment
Lower skilled (Levels 1-2) 11625 11896 -2,3 0
Skilled (Levels 3-5) 94174 96356 -2,3 0
Highly skilled production (Levels 6-8) 79638 77168 3,1 0
Highly skilled supervision (Levels 9-12) 9107 7777 14,6 0
Senior management (Levels 13-16) 764 693 9,3 0
Minister and Deputy Minister 2 2 0,0 0
Total 195310 193892 0,7 0
*Note: As at 31 March 2011, a total of 1349 positions have been advertised and in process of consideration or review. Apart from this, a total number of 1248 posts were advertised before 31 March 2011 with a closing date within the new financial year. A new rank structure for the South African Police Service was introduced. With the new rank structure, two (2) additional ranks were introduced namely Lieutenant and Major, which will create additional career opportunities for members. No member was translated to the ranks of Lieutenant and Major. A phase-in approach was adopted to capacitate the ranks of Lieutenant and Major. After successful negotiations during the 2010/11 financial year with the Employee Organisations, an agreement was concluded in the Safety and Security Sectoral Bargaining Council (SSSBC) on 5 April 2011 which inter alia provides for the criteria for promotion to Lieutenant, Captain and Major. In view of the development and negotiations on criteria to populate the ranks of Lieutenant and Major, no post promotion process was embarked upon during the 2010/11 financial year.
SAPS TOGETHER SQUEEZING CRIME to ZEROSAPS Members, My Family - Together Pushing Back The Frontiers Of Evil
ANNUAL REPORT 2010/2011SOUTH AFRICAN POLICE SERVICE
201
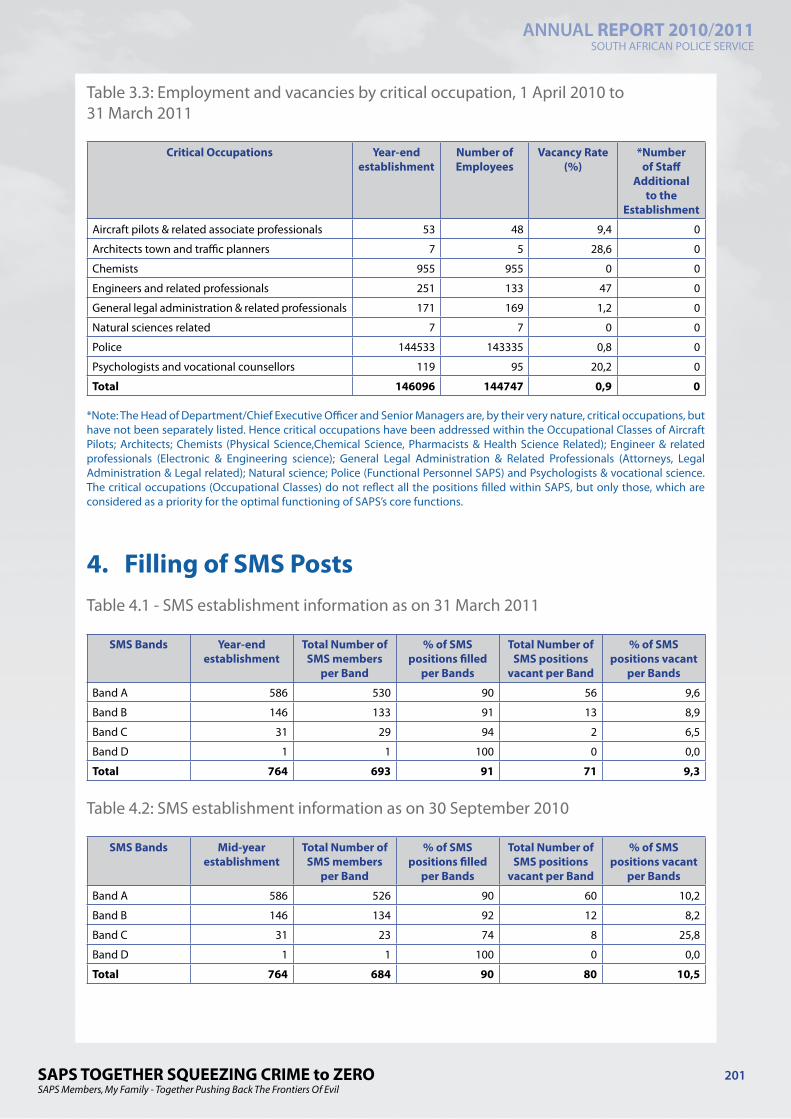
Table 3.3: Employment and vacancies by critical occupation, 1 April 2010 to31 March 2011
Critical Occupations Year-end establishment
Number of Employees
Vacancy Rate (%)
*Number of Staff
Additional to the
Establishment
Aircraft pilots & related associate professionals 53 48 9,4 0
Architects town and traffic planners 7 5 28,6 0
Chemists 955 955 0 0
Engineers and related professionals 251 133 47 0
General legal administration & related professionals 171 169 1,2 0
Natural sciences related 7 7 0 0
Police 144533 143335 0,8 0
Psychologists and vocational counsellors 119 95 20,2 0
Total 146096 144747 0,9 0
*Note: The Head of Department/Chief Executive Officer and Senior Managers are, by their very nature, critical occupations, but have not been separately listed. Hence critical occupations have been addressed within the Occupational Classes of Aircraft Pilots; Architects; Chemists (Physical Science,Chemical Science, Pharmacists & Health Science Related); Engineer & related professionals (Electronic & Engineering science); General Legal Administration & Related Professionals (Attorneys, Legal Administration & Legal related); Natural science; Police (Functional Personnel SAPS) and Psychologists & vocational science. The critical occupations (Occupational Classes) do not reflect all the positions filled within SAPS, but only those, which are considered as a priority for the optimal functioning of SAPS’s core functions.
4. Filling of SMS PostsTable 4.1 - SMS establishment information as on 31 March 2011
SMS Bands Year-end establishment
Total Number of SMS members
per Band
% of SMS positions filled
per Bands
Total Number of SMS positions
vacant per Band
% of SMS positions vacant
per Bands
Band A 586 530 90 56 9,6
Band B 146 133 91 13 8,9
Band C 31 29 94 2 6,5
Band D 1 1 100 0 0,0
Total 764 693 91 71 9,3
Table 4.2: SMS establishment information as on 30 September 2010
SMS Bands Mid-year establishment
Total Number of SMS members
per Band
% of SMS positions filled
per Bands
Total Number of SMS positions
vacant per Band
% of SMS positions vacant
per Bands
Band A 586 526 90 60 10,2
Band B 146 134 92 12 8,2
Band C 31 23 74 8 25,8
Band D 1 1 100 0 0,0
Total 764 684 90 80 10,5
SAPS TOGETHER SQUEEZING CRIME to ZEROSAPS Members, My Family - Together Pushing Back The Frontiers Of Evil
ANNUAL REPORT 2010/2011SOUTH AFRICAN POLICE SERVICE
202
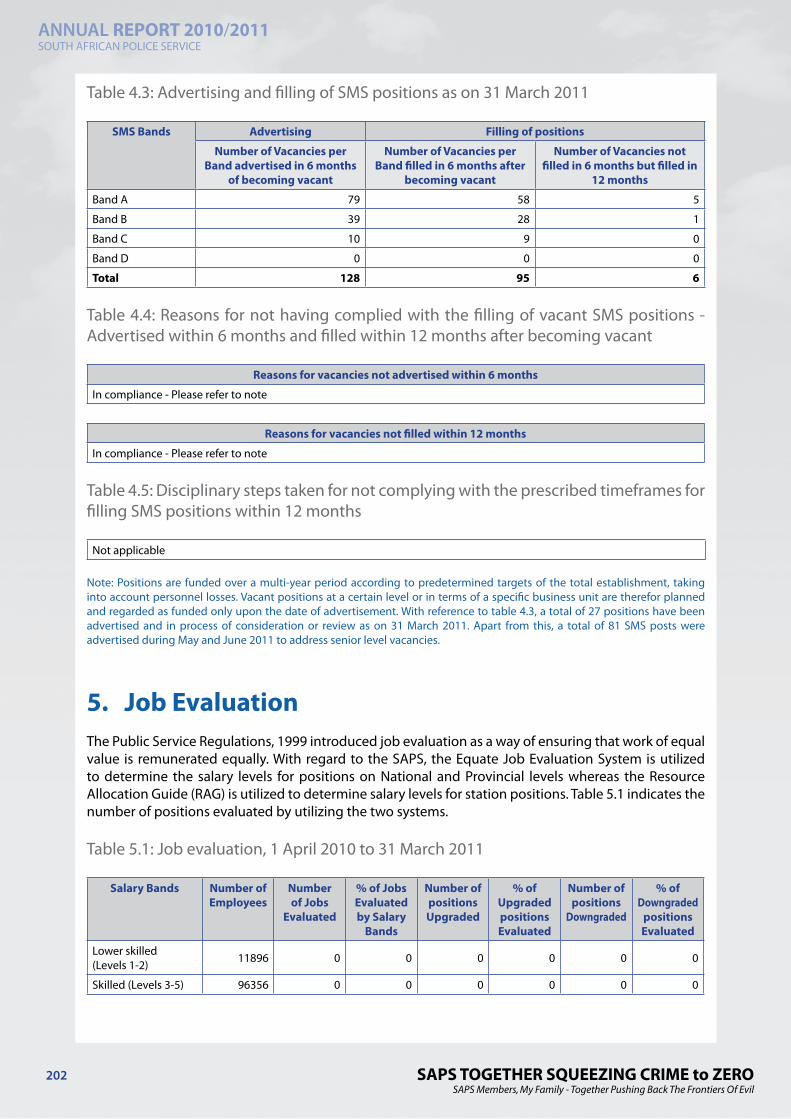
Table 4.3: Advertising and filling of SMS positions as on 31 March 2011
SMS Bands Advertising Filling of positions
Number of Vacancies per Band advertised in 6 months
of becoming vacant
Number of Vacancies per Band filled in 6 months after
becoming vacant
Number of Vacancies not filled in 6 months but filled in
12 months
Band A 79 58 5
Band B 39 28 1
Band C 10 9 0
Band D 0 0 0
Total 128 95 6
Table 4.4: Reasons for not having complied with the filling of vacant SMS positions - Advertised within 6 months and filled within 12 months after becoming vacant
Reasons for vacancies not advertised within 6 months
In compliance - Please refer to note
Reasons for vacancies not filled within 12 months
In compliance - Please refer to note
Table 4.5: Disciplinary steps taken for not complying with the prescribed timeframes for filling SMS positions within 12 months
Not applicable
Note: Positions are funded over a multi-year period according to predetermined targets of the total establishment, taking into account personnel losses. Vacant positions at a certain level or in terms of a specific business unit are therefor planned and regarded as funded only upon the date of advertisement. With reference to table 4.3, a total of 27 positions have been advertised and in process of consideration or review as on 31 March 2011. Apart from this, a total of 81 SMS posts were advertised during May and June 2011 to address senior level vacancies.
5. Job EvaluationThe Public Service Regulations, 1999 introduced job evaluation as a way of ensuring that work of equal value is remunerated equally. With regard to the SAPS, the Equate Job Evaluation System is utilized to determine the salary levels for positions on National and Provincial levels whereas the Resource Allocation Guide (RAG) is utilized to determine salary levels for station positions. Table 5.1 indicates the number of positions evaluated by utilizing the two systems.
Table 5.1: Job evaluation, 1 April 2010 to 31 March 2011
Salary Bands Number of Employees
Number of Jobs
Evaluated
% of Jobs Evaluated by Salary
Bands
Number of positions Upgraded
% of Upgraded positions Evaluated
Number of positions
Downgraded
% of Downgraded
positions Evaluated
Lower skilled(Levels 1-2) 11896 0 0 0 0 0 0
Skilled (Levels 3-5) 96356 0 0 0 0 0 0

SAPS TOGETHER SQUEEZING CRIME to ZEROSAPS Members, My Family - Together Pushing Back The Frontiers Of Evil
ANNUAL REPORT 2010/2011SOUTH AFRICAN POLICE SERVICE
203
Salary Bands Number of Employees
Number of Jobs
Evaluated
% of Jobs Evaluated by Salary
Bands
Number of positions Upgraded
% of Upgraded positions Evaluated
Number of positions
Downgraded
% of Downgraded
positions Evaluated
Highly skilled production(Levels 6-8)
77168 2 0 0 0 0 0
Highly skilled supervision(Levels 9-12)
7777 492 6,3 0 0 0 0
Senior management (Levels 13-16) 695 294 42,3 0 0 0 0
Total 193892 788 0,4 0 0 0 0
Table 5.2: Profile of employees whose positions were upgraded due to their jobs being upgraded, 1 April 2010 to 31 March 2011
None
Table 5.3: Employees whose salary level exceed the grade determined by job evaluation, 1 April 2010 to 31 March 2011 [i.t.o PSR 1.V.C.3]
None
Table 5.4: Profile of employees whose salary level exceeded the grade determined by job evaluation, 1 April 2010 to 31 March 2011 [i.t.o. PSR 1.V.C.3]
None
With regard to tables 4.2 to 4.4 vacant newly created positions are evaluated and then filled through the normal advertisement and filling procedure, therefore no individual employees were affected by job evaluations in terms of their salary levels.
6. Employment ChangesThis section provides information on changes in employment over the financial year. Turnover rates provide an indication of trends in the employment profile of the department. The following tables provide a summary of turnover rates by salary bands (Table 6.1) and by critical occupations (Table 6.2).
Table 6.1: Annual turnover rates by salary band, 1 April 2010 to 31 March 2011
Salary Bands *Employment at Beginning
of Period (April 2010)
Recruitments Terminations Turnover Rate (%)
Lower skilled (Levels 1-2) 6180 5886 170 2,8
Skilled (Levels 3-5) 95751 1629 1024 1,1
Highly skilled production (Levels 6-8) 77671 632 1135 1,5
Highly skilled supervision (Levels 9-12) 8023 46 292 3,6
Senior management (Levels 13-16) 736 9 50 6,8
Total 188361 8202 2671 1,4
SAPS TOGETHER SQUEEZING CRIME to ZEROSAPS Members, My Family - Together Pushing Back The Frontiers Of Evil
ANNUAL REPORT 2010/2011SOUTH AFRICAN POLICE SERVICE
204
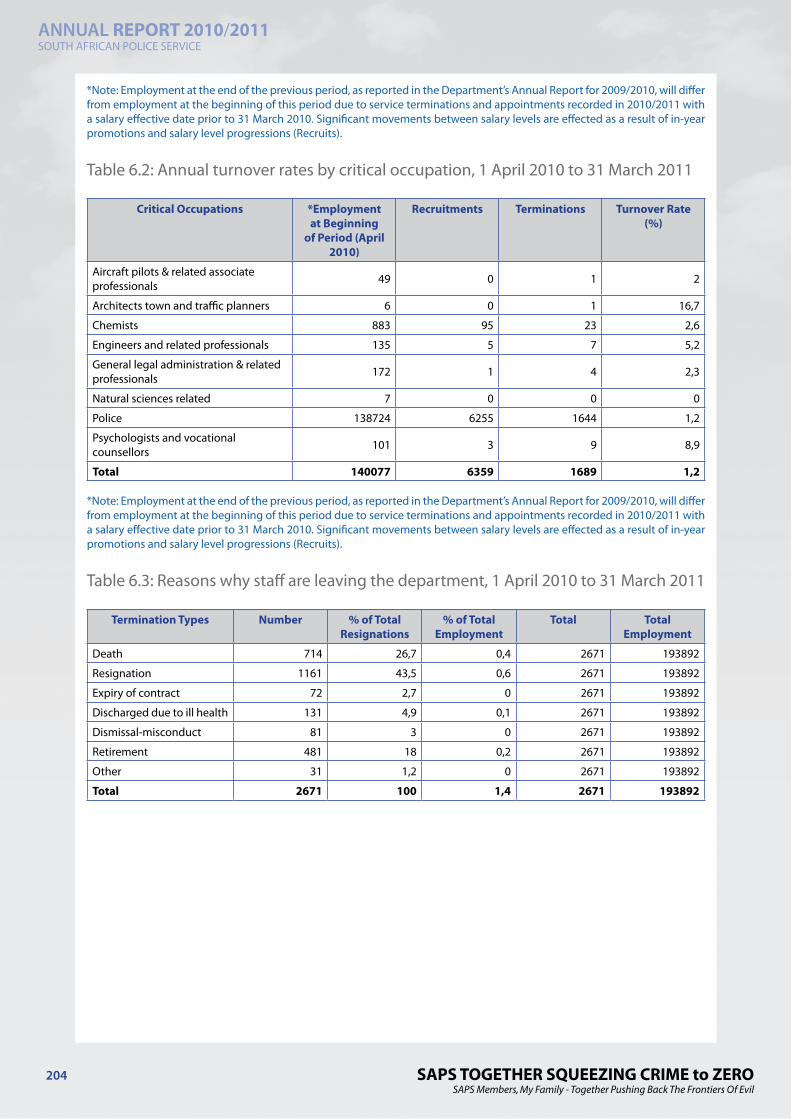
*Note: Employment at the end of the previous period, as reported in the Department’s Annual Report for 2009/2010, will differ from employment at the beginning of this period due to service terminations and appointments recorded in 2010/2011 with a salary effective date prior to 31 March 2010. Significant movements between salary levels are effected as a result of in-year promotions and salary level progressions (Recruits).
Table 6.2: Annual turnover rates by critical occupation, 1 April 2010 to 31 March 2011
Critical Occupations *Employment at Beginning
of Period (April 2010)
Recruitments Terminations Turnover Rate (%)
Aircraft pilots & related associate professionals 49 0 1 2
Architects town and traffic planners 6 0 1 16,7
Chemists 883 95 23 2,6
Engineers and related professionals 135 5 7 5,2
General legal administration & related professionals 172 1 4 2,3
Natural sciences related 7 0 0 0
Police 138724 6255 1644 1,2
Psychologists and vocational counsellors 101 3 9 8,9
Total 140077 6359 1689 1,2
*Note: Employment at the end of the previous period, as reported in the Department’s Annual Report for 2009/2010, will differ from employment at the beginning of this period due to service terminations and appointments recorded in 2010/2011 with a salary effective date prior to 31 March 2010. Significant movements between salary levels are effected as a result of in-year promotions and salary level progressions (Recruits).
Table 6.3: Reasons why staff are leaving the department, 1 April 2010 to 31 March 2011
Termination Types Number % of Total Resignations
% of Total Employment
Total Total Employment
Death 714 26,7 0,4 2671 193892
Resignation 1161 43,5 0,6 2671 193892
Expiry of contract 72 2,7 0 2671 193892
Discharged due to ill health 131 4,9 0,1 2671 193892
Dismissal-misconduct 81 3 0 2671 193892
Retirement 481 18 0,2 2671 193892
Other 31 1,2 0 2671 193892
Total 2671 100 1,4 2671 193892

SAPS TOGETHER SQUEEZING CRIME to ZEROSAPS Members, My Family - Together Pushing Back The Frontiers Of Evil
ANNUAL REPORT 2010/2011SOUTH AFRICAN POLICE SERVICE
205
Table 6.4: Promotions by critical occupation, 1 April 2010 to 31 March 2011
Critical Occupations Employment at the End of Period
Promotions to another Salary
Level
Salary Level Promotions as a %
of Employment
Aircraft pilots & related associate professionals 48 0 0
Architects town and traffic planners 5 0 0
Chemists 955 0 0
Engineers and related professionals 133 0 0
General legal administration & related professionals 169 0 0
Natural sciences related 7 0 0
Police 143335 1329 0,9
Psychologists and vocational counsellors 95 0 0
Total 144747 1329 0,9
Table 6.5: Promotions by salary band, 1 April 2010 to 31 March 2011
Salary Bands Employment at the End of Period
Promotions to another Salary Level
Salary Level Promotions as a % of
Employment
Lower skilled (Levels 1-2) 11896 183 1,5
Skilled (Levels 3-5) 96356 25 0
Highly skilled production (Levels 6-8) 77168 1401 1,8
Highly skilled supervision (Levels 9-12) 7777 0 0
Senior management (Levels 13-16) 695 93 13,4
Total 193892 1702 0,9
SAPS TOGETHER SQUEEZING CRIME to ZEROSAPS Members, My Family - Together Pushing Back The Frontiers Of Evil
ANNUAL REPORT 2010/2011SOUTH AFRICAN POLICE SERVICE
206
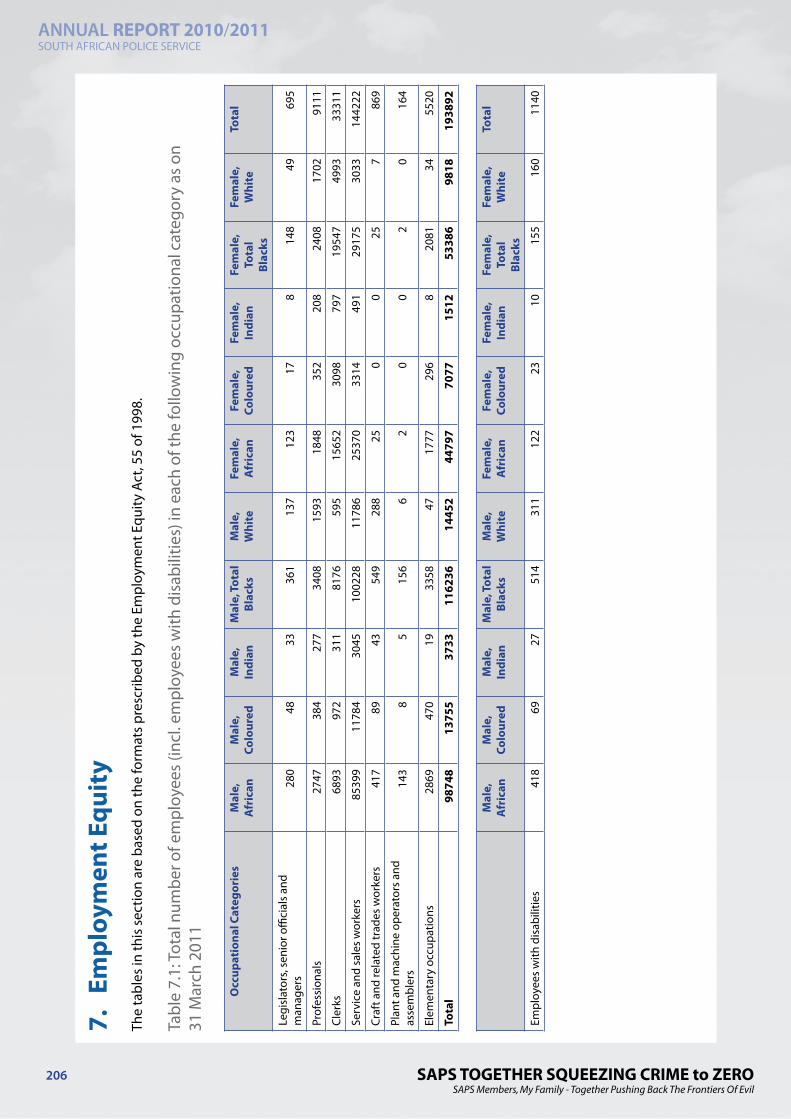
7. E
mpl
oym
ent E
quit
yTh
e ta
bles
in th
is s
ectio
n ar
e ba
sed
on th
e fo
rmat
s pr
escr
ibed
by
the
Empl
oym
ent E
quity
Act
, 55
of 1
998.
Tabl
e 7.
1: To
tal n
umbe
r of e
mpl
oyee
s (in
cl. e
mpl
oyee
s w
ith d
isab
ilitie
s) in
eac
h of
the
follo
win
g oc
cupa
tiona
l cat
egor
y as
on
31 M
arch
201
1
Occ
upat
iona
l Cat
egor
ies
Mal
e,
Afr
ican
Mal
e,
Colo
ured
Mal
e,
Indi
anM
ale,
Tota
l Bl
acks
Mal
e,
Whi
teFe
mal
e,
Afr
ican
Fem
ale,
Co
lour
edFe
mal
e,
Indi
anFe
mal
e,
Tota
l Bl
acks
Fem
ale,
W
hite
Tota
l
Legi
slat
ors,
seni
or o
ffici
als
and
man
ager
s28
048
3336
113
712
317
814
849
695
Prof
essi
onal
s 27
4738
427
734
0815
9318
4835
220
824
0817
0291
11
Cler
ks
6893
972
311
8176
595
1565
230
9879
719
547
4993
3331
1
Serv
ice
and
sale
s w
orke
rs85
399
1178
430
4510
0228
1178
625
370
3314
491
2917
530
3314
4222
Craf
t and
rela
ted
trad
es w
orke
rs
417
8943
549
288
250
025
786
9
Plan
t and
mac
hine
ope
rato
rs a
nd
asse
mbl
ers
143
85
156
62
00
20
164
Elem
enta
ry o
ccup
atio
ns
2869
470
1933
5847
1777
296
820
8134
5520
Tota
l98
748
1375
537
3311
6236
1445
244
797
7077
1512
5338
698
1819
3892
Mal
e,
Afr
ican
Mal
e,
Colo
ured
Mal
e,
Indi
anM
ale,
Tota
l Bl
acks
Mal
e,
Whi
teFe
mal
e,
Afr
ican
Fem
ale,
Co
lour
edFe
mal
e,
Indi
anFe
mal
e,
Tota
l Bl
acks
Fem
ale,
W
hite
Tota
l
Empl
oyee
s w
ith d
isab
ilitie
s 41
869
2751
431
112
223
1015
516
011
40
SAPS TOGETHER SQUEEZING CRIME to ZEROSAPS Members, My Family - Together Pushing Back The Frontiers Of Evil
ANNUAL REPORT 2010/2011SOUTH AFRICAN POLICE SERVICE
207
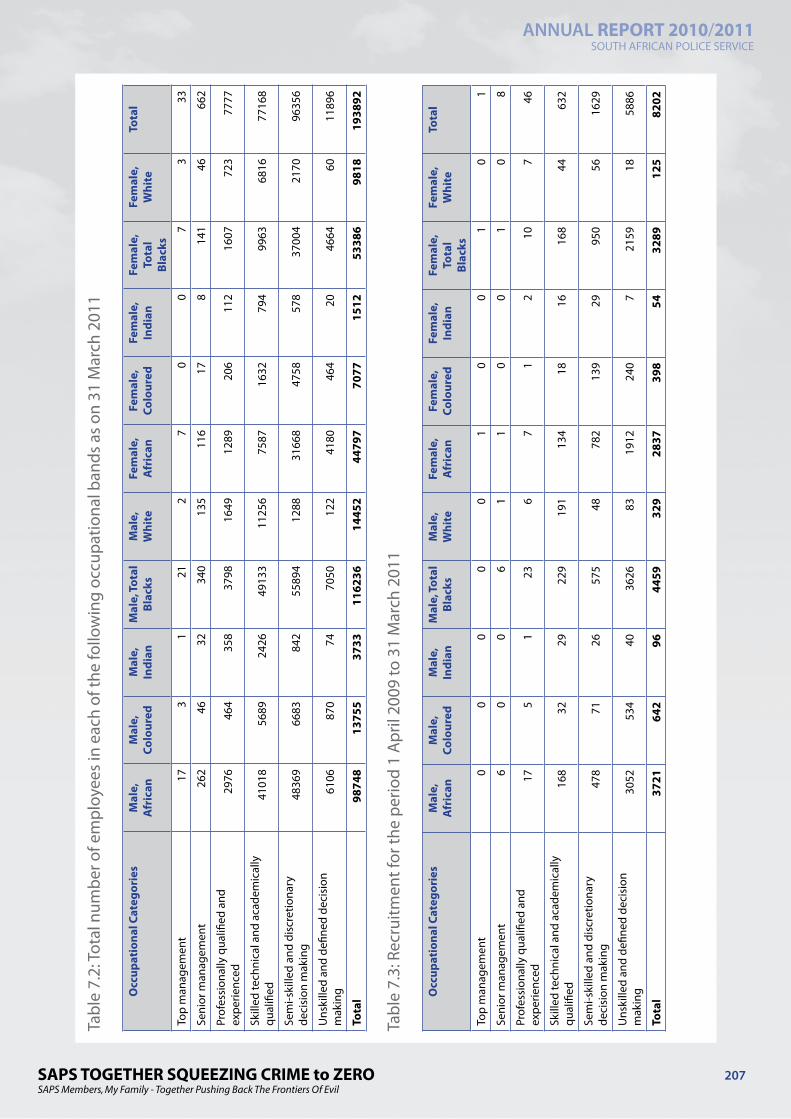
Tabl
e 7.
2: To
tal n
umbe
r of e
mpl
oyee
s in
eac
h of
the
follo
win
g oc
cupa
tiona
l ban
ds a
s on
31
Mar
ch 2
011
Occ
upat
iona
l Cat
egor
ies
Mal
e,
Afr
ican
Mal
e,
Colo
ured
Mal
e,
Indi
anM
ale,
Tota
l Bl
acks
Mal
e,
Whi
teFe
mal
e,
Afr
ican
Fem
ale,
Co
lour
edFe
mal
e,
Indi
anFe
mal
e,
Tota
l Bl
acks
Fem
ale,
W
hite
Tota
l
Top
man
agem
ent
173
121
27
00
73
33
Seni
or m
anag
emen
t26
246
3234
013
511
617
814
146
662
Prof
essi
onal
ly q
ualifi
ed a
nd
expe
rienc
ed29
7646
435
837
9816
4912
8920
611
216
0772
377
77
Skill
ed te
chni
cal a
nd a
cade
mic
ally
qu
alifi
ed41
018
5689
2426
4913
311
256
7587
1632
794
9963
6816
7716
8
Sem
i-ski
lled
and
disc
retio
nary
de
cisi
on m
akin
g48
369
6683
842
5589
412
8831
668
4758
578
3700
421
7096
356
Uns
kille
d an
d de
fined
dec
isio
n m
akin
g61
0687
074
7050
122
4180
464
2046
6460
1189
6
Tota
l98
748
1375
537
3311
6236
1445
244
797
7077
1512
5338
698
1819
3892
Tabl
e 7.
3: R
ecru
itmen
t for
the
perio
d 1
Apr
il 20
09 to
31
Mar
ch 2
011
Occ
upat
iona
l Cat
egor
ies
Mal
e,
Afr
ican
Mal
e,
Colo
ured
Mal
e,
Indi
anM
ale,
Tota
l Bl
acks
Mal
e,
Whi
teFe
mal
e,
Afr
ican
Fem
ale,
Co
lour
edFe
mal
e,
Indi
anFe
mal
e,
Tota
l Bl
acks
Fem
ale,
W
hite
Tota
l
Top
man
agem
ent
00
00
01
00
10
1
Seni
or m
anag
emen
t6
00
61
10
01
08
Prof
essi
onal
ly q
ualifi
ed a
nd
expe
rienc
ed17
51
236
71
210
746
Skill
ed te
chni
cal a
nd a
cade
mic
ally
qu
alifi
ed16
832
2922
919
113
418
1616
844
632
Sem
i-ski
lled
and
disc
retio
nary
de
cisi
on m
akin
g47
871
2657
548
782
139
2995
056
1629
Uns
kille
d an
d de
fined
dec
isio
n m
akin
g30
5253
440
3626
8319
1224
07
2159
1858
86
Tota
l37
2164
296
4459
329
2837
398
5432
8912
582
02
SAPS TOGETHER SQUEEZING CRIME to ZEROSAPS Members, My Family - Together Pushing Back The Frontiers Of Evil
ANNUAL REPORT 2010/2011SOUTH AFRICAN POLICE SERVICE
208
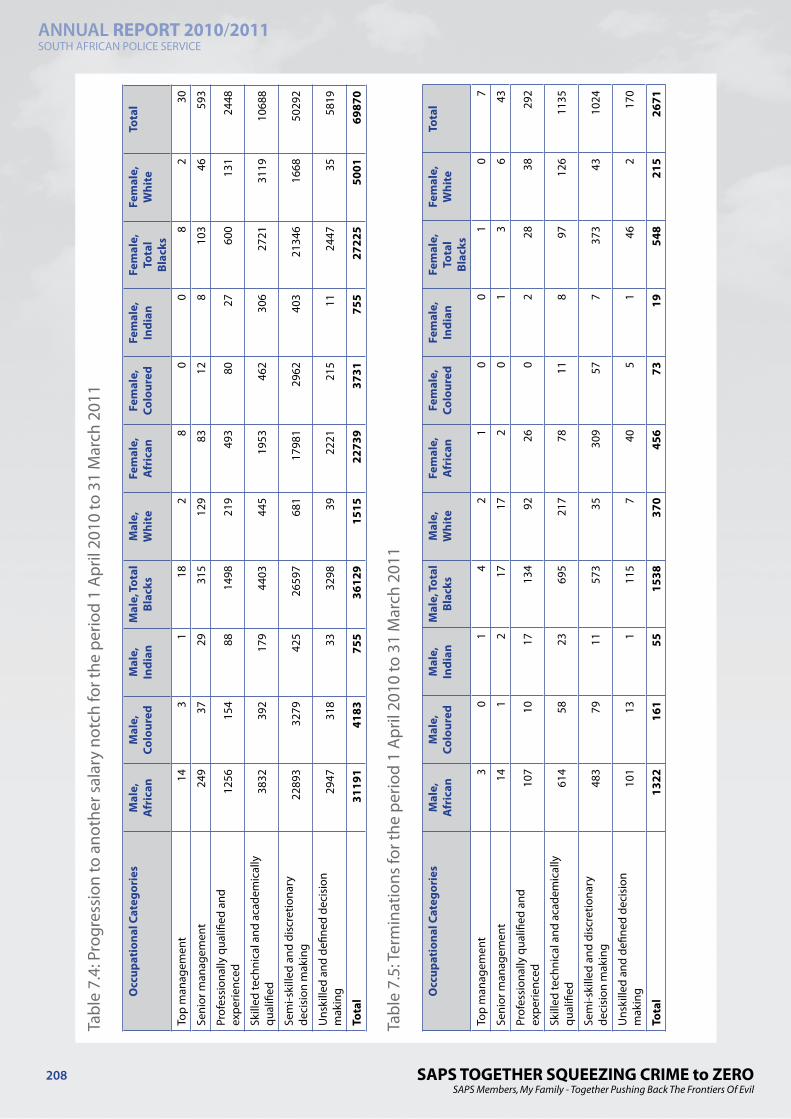
Tabl
e 7.
4: P
rogr
essi
on to
ano
ther
sal
ary
notc
h fo
r the
per
iod
1 A
pril
2010
to 3
1 M
arch
201
1
Occ
upat
iona
l Cat
egor
ies
Mal
e,
Afr
ican
Mal
e,
Colo
ured
Mal
e,
Indi
anM
ale,
Tota
l Bl
acks
Mal
e,
Whi
teFe
mal
e,
Afr
ican
Fem
ale,
Co
lour
edFe
mal
e,
Indi
anFe
mal
e,
Tota
l Bl
acks
Fem
ale,
W
hite
Tota
l
Top
man
agem
ent
143
118
28
00
82
30
Seni
or m
anag
emen
t24
937
2931
512
983
128
103
4659
3
Prof
essi
onal
ly q
ualifi
ed a
nd
expe
rienc
ed12
5615
488
1498
219
493
8027
600
131
2448
Skill
ed te
chni
cal a
nd a
cade
mic
ally
qu
alifi
ed38
3239
217
944
0344
519
5346
230
627
2131
1910
688
Sem
i-ski
lled
and
disc
retio
nary
de
cisi
on m
akin
g22
893
3279
425
2659
768
117
981
2962
403
2134
616
6850
292
Uns
kille
d an
d de
fined
dec
isio
n m
akin
g29
4731
833
3298
3922
2121
511
2447
3558
19
Tota
l31
191
4183
755
3612
915
1522
739
3731
755
2722
550
0169
870
Tabl
e 7.
5: Te
rmin
atio
ns fo
r the
per
iod
1 A
pril
2010
to 3
1 M
arch
201
1
Occ
upat
iona
l Cat
egor
ies
Mal
e,
Afr
ican
Mal
e,
Colo
ured
Mal
e,
Indi
anM
ale,
Tota
l Bl
acks
Mal
e,
Whi
teFe
mal
e,
Afr
ican
Fem
ale,
Co
lour
edFe
mal
e,
Indi
anFe
mal
e,
Tota
l Bl
acks
Fem
ale,
W
hite
Tota
l
Top
man
agem
ent
30
14
21
00
10
7
Seni
or m
anag
emen
t14
12
1717
20
13
643
Prof
essi
onal
ly q
ualifi
ed a
nd
expe
rienc
ed10
710
1713
492
260
228
3829
2
Skill
ed te
chni
cal a
nd a
cade
mic
ally
qu
alifi
ed61
458
2369
521
778
118
9712
611
35
Sem
i-ski
lled
and
disc
retio
nary
de
cisi
on m
akin
g48
379
1157
335
309
577
373
4310
24
Uns
kille
d an
d de
fined
dec
isio
n m
akin
g10
113
111
57
405
146
217
0
Tota
l13
2216
155
1538
370
456
7319
548
215
2671
SAPS TOGETHER SQUEEZING CRIME to ZEROSAPS Members, My Family - Together Pushing Back The Frontiers Of Evil
ANNUAL REPORT 2010/2011SOUTH AFRICAN POLICE SERVICE
209
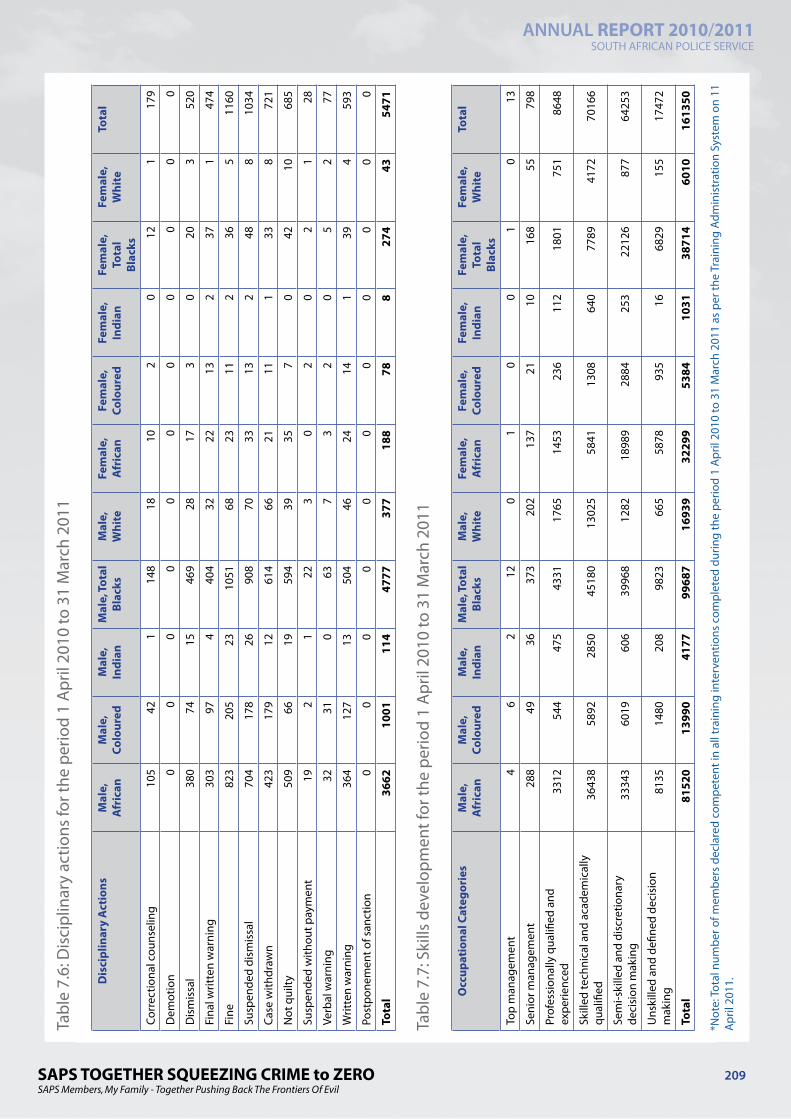
Tabl
e 7.
6: D
isci
plin
ary
actio
ns fo
r the
per
iod
1 A
pril
2010
to 3
1 M
arch
201
1
Dis
cipl
inar
y A
ctio
nsM
ale,
A
fric
anM
ale,
Co
lour
edM
ale,
In
dian
Mal
e, To
tal
Blac
ksM
ale,
W
hite
Fem
ale,
A
fric
anFe
mal
e,
Colo
ured
Fem
ale,
In
dian
Fem
ale,
To
tal
Blac
ks
Fem
ale,
W
hite
Tota
l
Corr
ectio
nal c
ouns
elin
g 10
542
114
818
102
012
117
9
Dem
otio
n0
00
00
00
00
00
Dis
mis
sal
380
7415
469
2817
30
203
520
Fina
l writ
ten
war
ning
30
397
440
432
2213
237
147
4
Fine
82
320
523
1051
6823
112
365
1160
Susp
ende
d di
smis
sal
704
178
2690
870
3313
248
810
34
Case
with
draw
n42
317
912
614
6621
111
338
721
Not
qui
lty
509
6619
594
3935
70
4210
685
Susp
ende
d w
ithou
t pay
men
t 19
21
223
02
02
128
Verb
al w
arni
ng
3231
063
73
20
52
77
Writ
ten
war
ning
36
412
713
504
4624
141
394
593
Post
pone
men
t of s
anct
ion
00
00
00
00
00
0
Tota
l36
6210
0111
447
7737
718
878
827
443
5471
Tabl
e 7.
7: S
kills
dev
elop
men
t for
the
perio
d 1
Apr
il 20
10 to
31
Mar
ch 2
011
Occ
upat
iona
l Cat
egor
ies
Mal
e,
Afr
ican
Mal
e,
Colo
ured
Mal
e,
Indi
anM
ale,
Tota
l Bl
acks
Mal
e,
Whi
teFe
mal
e,
Afr
ican
Fem
ale,
Co
lour
edFe
mal
e,
Indi
anFe
mal
e,
Tota
l Bl
acks
Fem
ale,
W
hite
Tota
l
Top
man
agem
ent
46
212
01
00
10
13
Seni
or m
anag
emen
t28
849
3637
320
213
721
1016
855
798
Prof
essi
onal
ly q
ualifi
ed a
nd
expe
rienc
ed33
1254
447
543
3117
6514
5323
611
218
0175
186
48
Skill
ed te
chni
cal a
nd a
cade
mic
ally
qu
alifi
ed36
438
5892
2850
4518
013
025
5841
1308
640
7789
4172
7016
6
Sem
i-ski
lled
and
disc
retio
nary
de
cisi
on m
akin
g33
343
6019
606
3996
812
8218
989
2884
253
2212
687
764
253
Uns
kille
d an
d de
fined
dec
isio
n m
akin
g81
3514
8020
898
2366
558
7893
516
6829
155
1747
2
Tota
l 81
520
1399
041
7799
687
1693
932
299
5384
1031
3871
460
1016
1350
*Not
e: T
otal
num
ber o
f mem
bers
dec
lare
d co
mpe
tent
in a
ll tr
aini
ng in
terv
entio
ns c
ompl
eted
dur
ing
the
perio
d 1
Apr
il 20
10 to
31
Mar
ch 2
011
as p
er th
e Tr
aini
ng A
dmin
istr
atio
n Sy
stem
on
11
Apr
il 20
11.
SAPS TOGETHER SQUEEZING CRIME to ZEROSAPS Members, My Family - Together Pushing Back The Frontiers Of Evil
ANNUAL REPORT 2010/2011SOUTH AFRICAN POLICE SERVICE
210
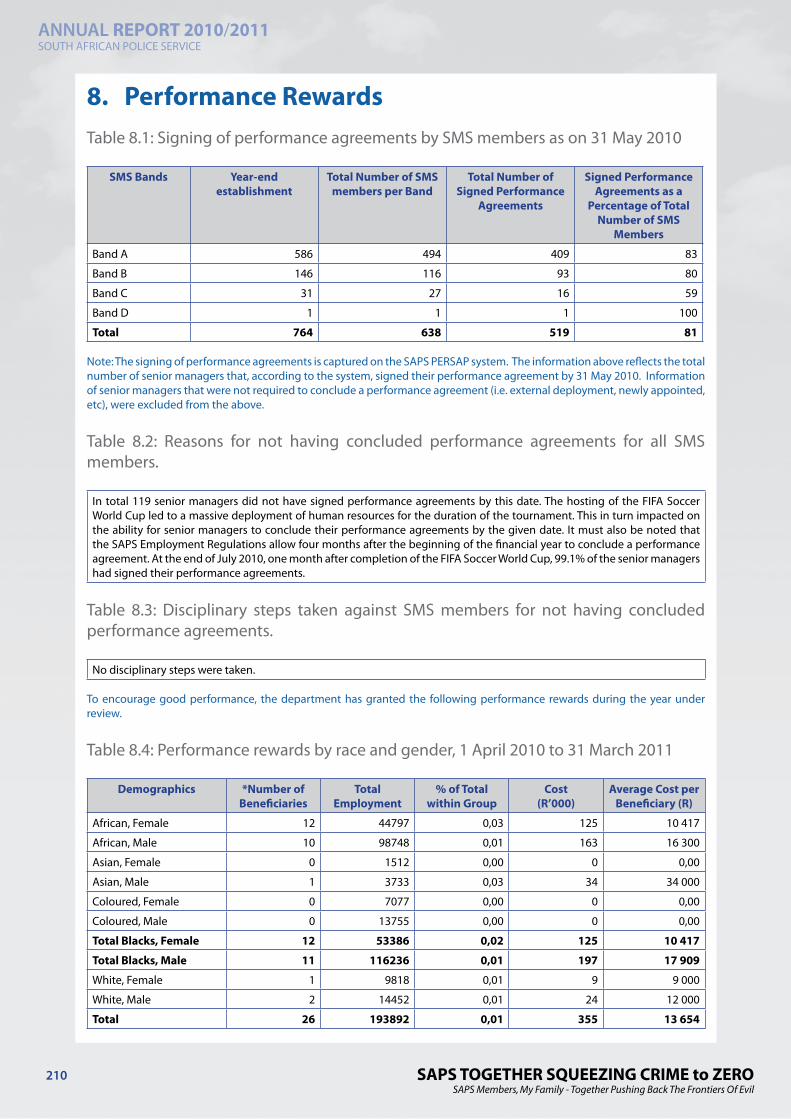
8. Performance RewardsTable 8.1: Signing of performance agreements by SMS members as on 31 May 2010
SMS Bands Year-end establishment
Total Number of SMS members per Band
Total Number of Signed Performance
Agreements
Signed Performance Agreements as a
Percentage of Total Number of SMS
Members
Band A 586 494 409 83
Band B 146 116 93 80
Band C 31 27 16 59
Band D 1 1 1 100
Total 764 638 519 81
Note: The signing of performance agreements is captured on the SAPS PERSAP system. The information above reflects the total number of senior managers that, according to the system, signed their performance agreement by 31 May 2010. Information of senior managers that were not required to conclude a performance agreement (i.e. external deployment, newly appointed, etc), were excluded from the above.
Table 8.2: Reasons for not having concluded performance agreements for all SMS members.
In total 119 senior managers did not have signed performance agreements by this date. The hosting of the FIFA Soccer World Cup led to a massive deployment of human resources for the duration of the tournament. This in turn impacted on the ability for senior managers to conclude their performance agreements by the given date. It must also be noted that the SAPS Employment Regulations allow four months after the beginning of the financial year to conclude a performance agreement. At the end of July 2010, one month after completion of the FIFA Soccer World Cup, 99.1% of the senior managers had signed their performance agreements.
Table 8.3: Disciplinary steps taken against SMS members for not having concluded performance agreements.
No disciplinary steps were taken.
To encourage good performance, the department has granted the following performance rewards during the year under review.
Table 8.4: Performance rewards by race and gender, 1 April 2010 to 31 March 2011
Demographics *Number of Beneficiaries
Total Employment
% of Total within Group
Cost(R’000)
Average Cost per Beneficiary (R)
African, Female 12 44797 0,03 125 10 417
African, Male 10 98748 0,01 163 16 300
Asian, Female 0 1512 0,00 0 0,00
Asian, Male 1 3733 0,03 34 34 000
Coloured, Female 0 7077 0,00 0 0,00
Coloured, Male 0 13755 0,00 0 0,00
Total Blacks, Female 12 53386 0,02 125 10 417
Total Blacks, Male 11 116236 0,01 197 17 909
White, Female 1 9818 0,01 9 9 000
White, Male 2 14452 0,01 24 12 000
Total 26 193892 0,01 355 13 654

SAPS TOGETHER SQUEEZING CRIME to ZEROSAPS Members, My Family - Together Pushing Back The Frontiers Of Evil
ANNUAL REPORT 2010/2011SOUTH AFRICAN POLICE SERVICE
211
*Note: Performance rewards paid in the 2010/2011 financial year were for services rendered in the 2009/2010 financial year. Performance rewards were only paid to employees attached to the Civilian Secretariat for Police. Due to spending pressure experienced in the compensation environment, essentially for the payment of allowances to members with the hosting of the 2010 Soccer World Cup, the Department decided to reprioritize the amount initally reserved for the payment of performance rewards, thus suplementing the provision made for expenses for hosting the Soccer World Cup.
Table 8.5: Performance rewards by salary band for personnel below senior management, 1 April 2010 to 31 March 2011
Salary Bands *Number of Beneficiaries
Total Employment
% of Total per Level and Employment
Cost
(R’000)
Average Cost per Beneficiary
(R)
Lower skilled (Levels 1-2) 0 11896 0,00 0 0
Skilled (Levels 3-5) 8 96356 0,00 37 4 625
Highly skilled production (Levels 6-8) 5 77168 0,00 37 7 400
Highly skilled supervision (Levels 9-12) 9 7777 0,10 144 16 000
Total 22 193197 0,00 218 9 909
*Note: Performance rewards paid in the 2010/2011 financial year were for services rendered in the 2009/2010 financial year. The classification of beneficiaries were done in accordance with the salary band profile of employees as at 31 March 2011. Performance rewards were only paid to employees attached to the Civilian Secretariat for Police. Due to spending pressure experienced in the compensation environment, essentially for the payment of allowances to members with the hosting of the 2010 Soccer World Cup, the Department decided to reprioritize the amount initally reserved for the payment of performance rewards, thus suplementing the provision made for expenses for hosting the Soccer World Cup.
Table 8.6: Performance Rewards by Critical Occupation, 1 April 2010 to 31 March 2011
Critical Occupations Number of Beneficiaries
Total Employment
% of Total Employment
Cost
(R’000)
Average Cost per
Beneficiary (R)
Aircraft pilots & related associate professionals 0 48 0,00 0 0
Architects town and traffic planners 0 5 0,00 0 0
Chemists 0 955 0,00 0 0
Engineers and related professionals 0 133 0,00 0 0
General legal administration & related professionals 2 169 1,20 48 24 000
Natural sciences related 0 7 0,00 0 0
Police 0 143335 0,00 0 0
Psychologists and vocational counsellors 0 95 0,00 0 0
Total 2 144747 0,00 48 24 000
SAPS TOGETHER SQUEEZING CRIME to ZEROSAPS Members, My Family - Together Pushing Back The Frontiers Of Evil
ANNUAL REPORT 2010/2011SOUTH AFRICAN POLICE SERVICE
212
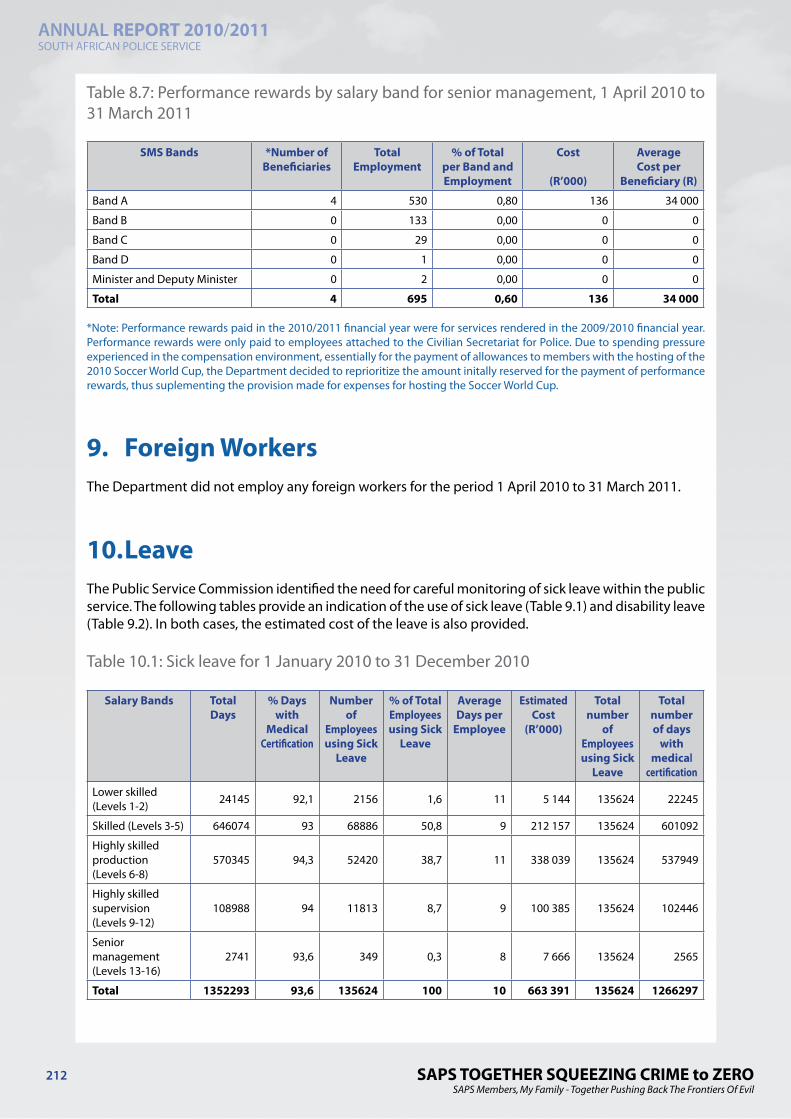
Table 8.7: Performance rewards by salary band for senior management, 1 April 2010 to 31 March 2011
SMS Bands *Number of Beneficiaries
Total Employment
% of Total per Band and Employment
Cost
(R’000)
Average Cost per
Beneficiary (R)
Band A 4 530 0,80 136 34 000
Band B 0 133 0,00 0 0
Band C 0 29 0,00 0 0
Band D 0 1 0,00 0 0
Minister and Deputy Minister 0 2 0,00 0 0
Total 4 695 0,60 136 34 000
*Note: Performance rewards paid in the 2010/2011 financial year were for services rendered in the 2009/2010 financial year. Performance rewards were only paid to employees attached to the Civilian Secretariat for Police. Due to spending pressure experienced in the compensation environment, essentially for the payment of allowances to members with the hosting of the 2010 Soccer World Cup, the Department decided to reprioritize the amount initally reserved for the payment of performance rewards, thus suplementing the provision made for expenses for hosting the Soccer World Cup.
9. Foreign WorkersThe Department did not employ any foreign workers for the period 1 April 2010 to 31 March 2011.
10. LeaveThe Public Service Commission identified the need for careful monitoring of sick leave within the public service. The following tables provide an indication of the use of sick leave (Table 9.1) and disability leave (Table 9.2). In both cases, the estimated cost of the leave is also provided.
Table 10.1: Sick leave for 1 January 2010 to 31 December 2010
Salary Bands Total Days
% Days with
Medical Certification
Number of
Employees using Sick
Leave
% of Total Employees using Sick
Leave
Average Days per
Employee
Estimated Cost
(R’000)
Total number
of Employees using Sick
Leave
Total number of days
with medical
certification
Lower skilled (Levels 1-2) 24145 92,1 2156 1,6 11 5 144 135624 22245
Skilled (Levels 3-5) 646074 93 68886 50,8 9 212 157 135624 601092
Highly skilled production(Levels 6-8)
570345 94,3 52420 38,7 11 338 039 135624 537949
Highly skilled supervision (Levels 9-12)
108988 94 11813 8,7 9 100 385 135624 102446
Senior management (Levels 13-16)
2741 93,6 349 0,3 8 7 666 135624 2565
Total 1352293 93,6 135624 100 10 663 391 135624 1266297
SAPS TOGETHER SQUEEZING CRIME to ZEROSAPS Members, My Family - Together Pushing Back The Frontiers Of Evil
ANNUAL REPORT 2010/2011SOUTH AFRICAN POLICE SERVICE
213
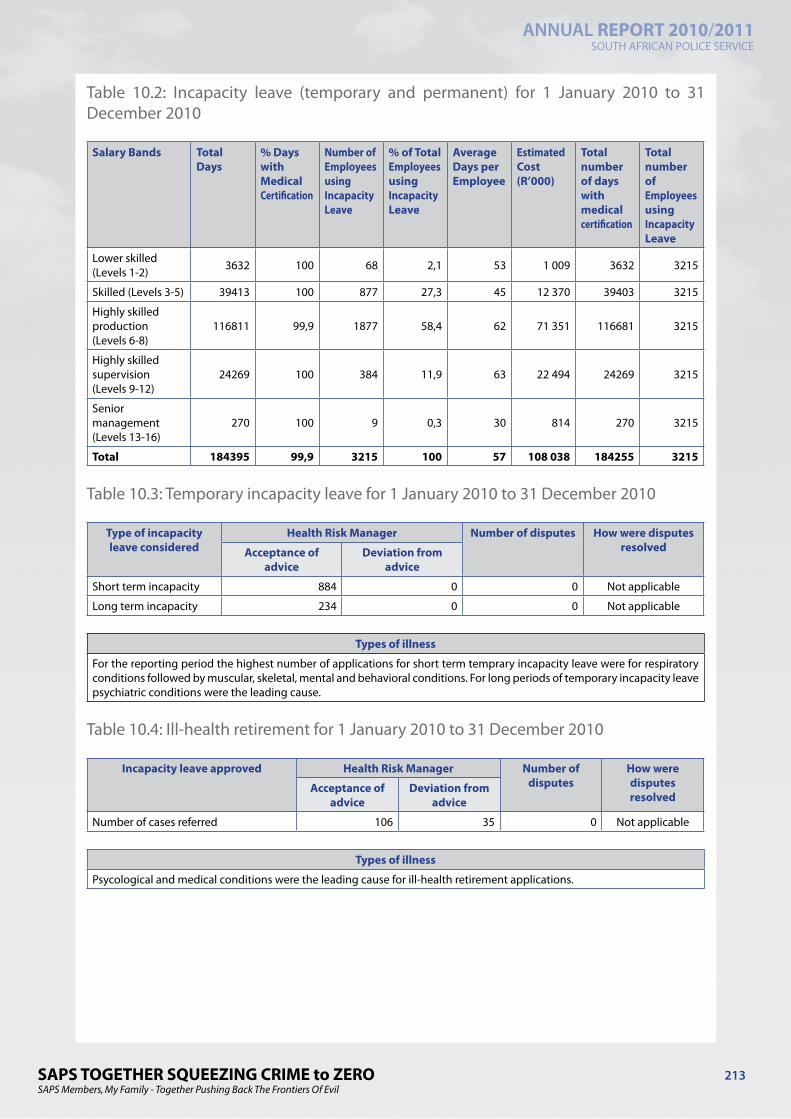
Table 10.2: Incapacity leave (temporary and permanent) for 1 January 2010 to 31 December 2010
Salary Bands Total Days
% Days with Medical Certification
Number of Employees using Incapacity Leave
% of Total Employees using Incapacity Leave
Average Days per Employee
Estimated Cost (R’000)
Total number of days with medical certification
Total number of Employees using Incapacity Leave
Lower skilled (Levels 1-2) 3632 100 68 2,1 53 1 009 3632 3215
Skilled (Levels 3-5) 39413 100 877 27,3 45 12 370 39403 3215
Highly skilled production(Levels 6-8)
116811 99,9 1877 58,4 62 71 351 116681 3215
Highly skilled supervision (Levels 9-12)
24269 100 384 11,9 63 22 494 24269 3215
Senior management (Levels 13-16)
270 100 9 0,3 30 814 270 3215
Total 184395 99,9 3215 100 57 108 038 184255 3215
Table 10.3: Temporary incapacity leave for 1 January 2010 to 31 December 2010
Type of incapacity leave considered
Health Risk Manager Number of disputes How were disputes resolvedAcceptance of
adviceDeviation from
advice
Short term incapacity 884 0 0 Not applicable
Long term incapacity 234 0 0 Not applicable
Types of illness
For the reporting period the highest number of applications for short term temprary incapacity leave were for respiratory conditions followed by muscular, skeletal, mental and behavioral conditions. For long periods of temporary incapacity leave psychiatric conditions were the leading cause.
Table 10.4: Ill-health retirement for 1 January 2010 to 31 December 2010
Incapacity leave approved Health Risk Manager Number of disputes
How were disputes resolved
Acceptance of advice
Deviation from advice
Number of cases referred 106 35 0 Not applicable
Types of illness
Psycological and medical conditions were the leading cause for ill-health retirement applications.
SAPS TOGETHER SQUEEZING CRIME to ZEROSAPS Members, My Family - Together Pushing Back The Frontiers Of Evil
ANNUAL REPORT 2010/2011SOUTH AFRICAN POLICE SERVICE
214
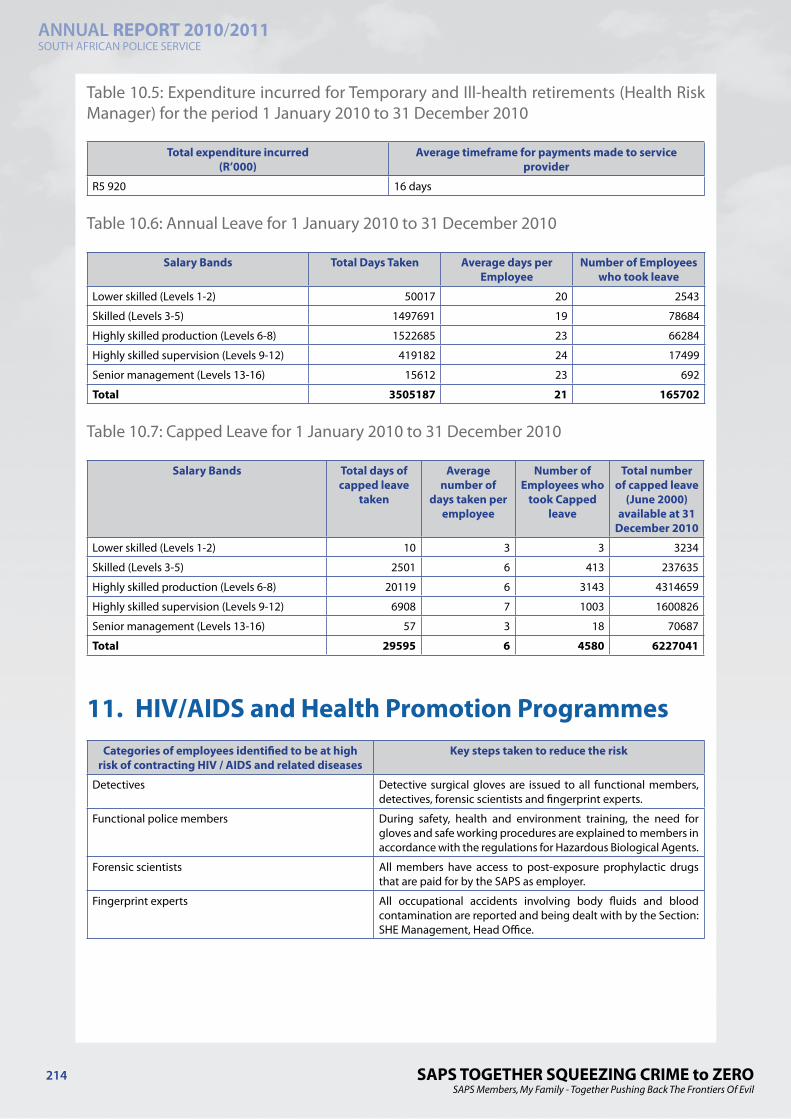
Table 10.5: Expenditure incurred for Temporary and Ill-health retirements (Health Risk Manager) for the period 1 January 2010 to 31 December 2010
Total expenditure incurred (R’000)
Average timeframe for payments made to service provider
R5 920 16 days
Table 10.6: Annual Leave for 1 January 2010 to 31 December 2010
Salary Bands Total Days Taken Average days per Employee
Number of Employees who took leave
Lower skilled (Levels 1-2) 50017 20 2543
Skilled (Levels 3-5) 1497691 19 78684
Highly skilled production (Levels 6-8) 1522685 23 66284
Highly skilled supervision (Levels 9-12) 419182 24 17499
Senior management (Levels 13-16) 15612 23 692
Total 3505187 21 165702
Table 10.7: Capped Leave for 1 January 2010 to 31 December 2010
Salary Bands Total days of capped leave
taken
Average number of
days taken per employee
Number of Employees who
took Capped leave
Total number of capped leave
(June 2000) available at 31
December 2010
Lower skilled (Levels 1-2) 10 3 3 3234
Skilled (Levels 3-5) 2501 6 413 237635
Highly skilled production (Levels 6-8) 20119 6 3143 4314659
Highly skilled supervision (Levels 9-12) 6908 7 1003 1600826
Senior management (Levels 13-16) 57 3 18 70687
Total 29595 6 4580 6227041
11. HIV/AIDS and Health Promotion ProgrammesCategories of employees identified to be at high
risk of contracting HIV / AIDS and related diseasesKey steps taken to reduce the risk
Detectives Detective surgical gloves are issued to all functional members, detectives, forensic scientists and fingerprint experts.
Functional police members During safety, health and environment training, the need for gloves and safe working procedures are explained to members in accordance with the regulations for Hazardous Biological Agents.
Forensic scientists All members have access to post-exposure prophylactic drugs that are paid for by the SAPS as employer.
Fingerprint experts All occupational accidents involving body fluids and blood contamination are reported and being dealt with by the Section: SHE Management, Head Office.

SAPS TOGETHER SQUEEZING CRIME to ZEROSAPS Members, My Family - Together Pushing Back The Frontiers Of Evil
ANNUAL REPORT 2010/2011SOUTH AFRICAN POLICE SERVICE
215
Table 11.2: Details of Health Promotion and HIV/AIDS Programmes Programmes
Question Yes No Details, if Yes
1. Has the department designated a member of the SMS to implement the provisions contained in Part VI E of Chapter 1 of the Public Service Regulations, 2001? If so, provide her/his name and position.
x Divisional Commissioner NNM MazibukoHead: Personnel Services, SAPSPrivate Bag X94Pretoria, 0001Tel no: 012 393 1504Fax no: 012 393 2454
2. Does the department have a dedicated unit or have you designated specific staff members to promote health and well being of your employees? If so, indicate the number of employees who are involved in this task and the annual budget that is available for this purpose.
x The Employee Health & Wellness consists of four sections namely; Social Work Services, Psychological Services, Spiritual Services and Quality of Work-Life comprising of professionals who are mainly responsible for the psycho-socio and spiritual well-being of all SAPS employees as well as their immediate family members. There is approximately 600 professionals employed within the EHW environment rendering care and support services to SAPS employees nationally. The section Quality of Work-Life (QWL) comprise of HIV&AIDS and Disability Management, which is a budgeted Programme. To date, there has been an annual budget of R5 million and R4 million respectively for both programmes.
3. Has the department introduced an Employee Assistance or Health Promotion Programme for your employees? If so, indicate the key elements/services of the programme.
x The component Employee Health and Wellness delivers services of which the key elements are wellness support programmes such as stress and trauma management, suicide prevention, spiritually based programmes, life-skills, personal financial management, colleague sensitivity, HIV&AIDS awareness programmes and disability sensitization programmes. The wellness support programmes are currently being expanded to include health promotion programmes whereby employees are being tested for HIV and other chronic conditions such as high blood pressure, diabetes, cholesterol and body mass index on a voluntary basis.
4. Has the department established (a) committee(s) as contemplated in Part VI E.5 (e) of Chapter 1 of the Public Service Regulations, 2001? If so, please provide the names of the members of the committee and the stakeholder(s) that they represent.
x The Division Personnel Management within SAPS is the custodian of the National Wellness Strategic Forum which is a monitoring vehicle of all aspects related to the health and wellness of SAPS employees including their immediate family members. The forum consists of representatives from various Divisions within SAPS such as Divisional Commissioners of Personnel Management (chairperson), Human Resource Development, Legal Services, Supply Chain Management, Human Resource Utilization as well as and Organized Labour unions (POPCRU and SAPU). There are also key external role-players such as Department of Public Works, POLMED, QUALSA (administrator to POLMED), Metropolitan Health Group (managed health care provider to POLMED); GEMS and SAPS’s Health Risk Manager (PHS). Similar structures have been established in the Provinces. Both the national and provincial wellness fora are being convened on a quarterly basis and strategic reports are being shared amongst all the role-players regarding the health and wellness of employees.
SAPS TOGETHER SQUEEZING CRIME to ZEROSAPS Members, My Family - Together Pushing Back The Frontiers Of Evil
ANNUAL REPORT 2010/2011SOUTH AFRICAN POLICE SERVICE
216
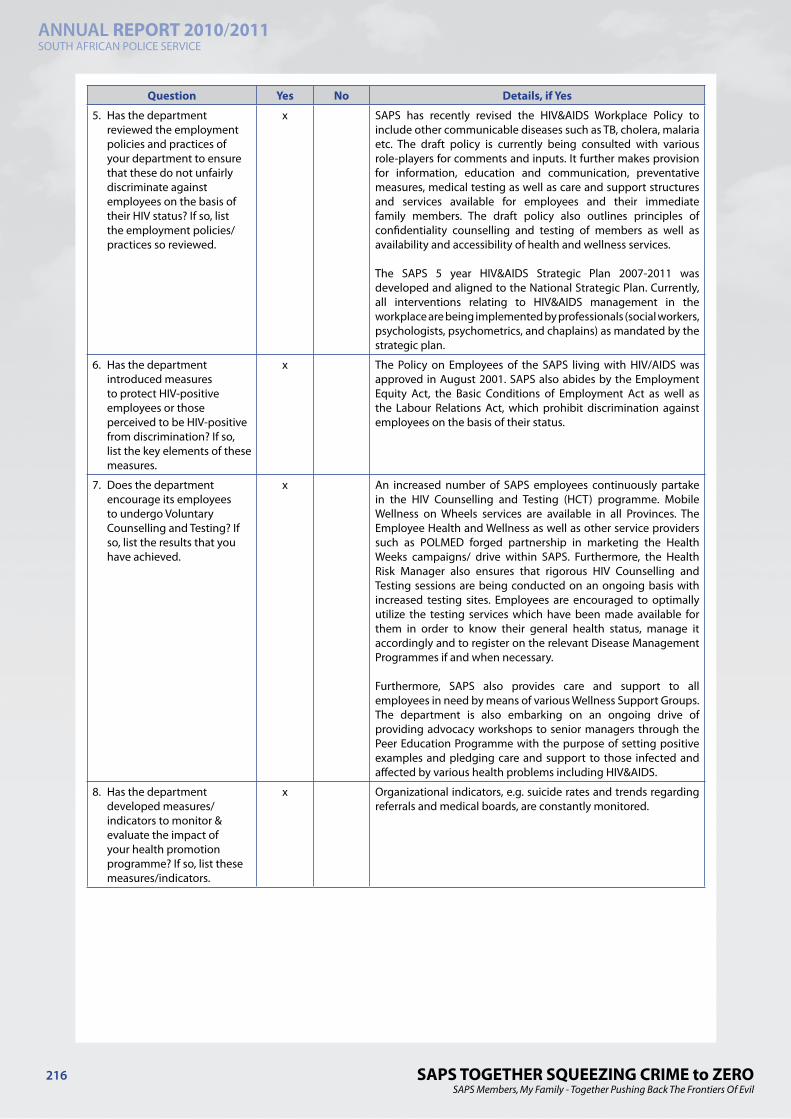
Question Yes No Details, if Yes
5. Has the department reviewed the employment policies and practices of your department to ensure that these do not unfairly discriminate against employees on the basis of their HIV status? If so, list the employment policies/practices so reviewed.
x SAPS has recently revised the HIV&AIDS Workplace Policy to include other communicable diseases such as TB, cholera, malaria etc. The draft policy is currently being consulted with various role-players for comments and inputs. It further makes provision for information, education and communication, preventative measures, medical testing as well as care and support structures and services available for employees and their immediate family members. The draft policy also outlines principles of confidentiality counselling and testing of members as well as availability and accessibility of health and wellness services.
The SAPS 5 year HIV&AIDS Strategic Plan 2007-2011 was developed and aligned to the National Strategic Plan. Currently, all interventions relating to HIV&AIDS management in the workplace are being implemented by professionals (social workers, psychologists, psychometrics, and chaplains) as mandated by the strategic plan.
6. Has the department introduced measures to protect HIV-positive employees or those perceived to be HIV-positive from discrimination? If so, list the key elements of these measures.
x The Policy on Employees of the SAPS living with HIV/AIDS was approved in August 2001. SAPS also abides by the Employment Equity Act, the Basic Conditions of Employment Act as well as the Labour Relations Act, which prohibit discrimination against employees on the basis of their status.
7. Does the department encourage its employees to undergo Voluntary Counselling and Testing? If so, list the results that you have achieved.
x An increased number of SAPS employees continuously partake in the HIV Counselling and Testing (HCT) programme. Mobile Wellness on Wheels services are available in all Provinces. The Employee Health and Wellness as well as other service providers such as POLMED forged partnership in marketing the Health Weeks campaigns/ drive within SAPS. Furthermore, the Health Risk Manager also ensures that rigorous HIV Counselling and Testing sessions are being conducted on an ongoing basis with increased testing sites. Employees are encouraged to optimally utilize the testing services which have been made available for them in order to know their general health status, manage it accordingly and to register on the relevant Disease Management Programmes if and when necessary.
Furthermore, SAPS also provides care and support to all employees in need by means of various Wellness Support Groups. The department is also embarking on an ongoing drive of providing advocacy workshops to senior managers through the Peer Education Programme with the purpose of setting positive examples and pledging care and support to those infected and affected by various health problems including HIV&AIDS.
8. Has the department developed measures/indicators to monitor & evaluate the impact of your health promotion programme? If so, list these measures/indicators.
x Organizational indicators, e.g. suicide rates and trends regarding referrals and medical boards, are constantly monitored.
SAPS TOGETHER SQUEEZING CRIME to ZEROSAPS Members, My Family - Together Pushing Back The Frontiers Of Evil
ANNUAL REPORT 2010/2011SOUTH AFRICAN POLICE SERVICE
217
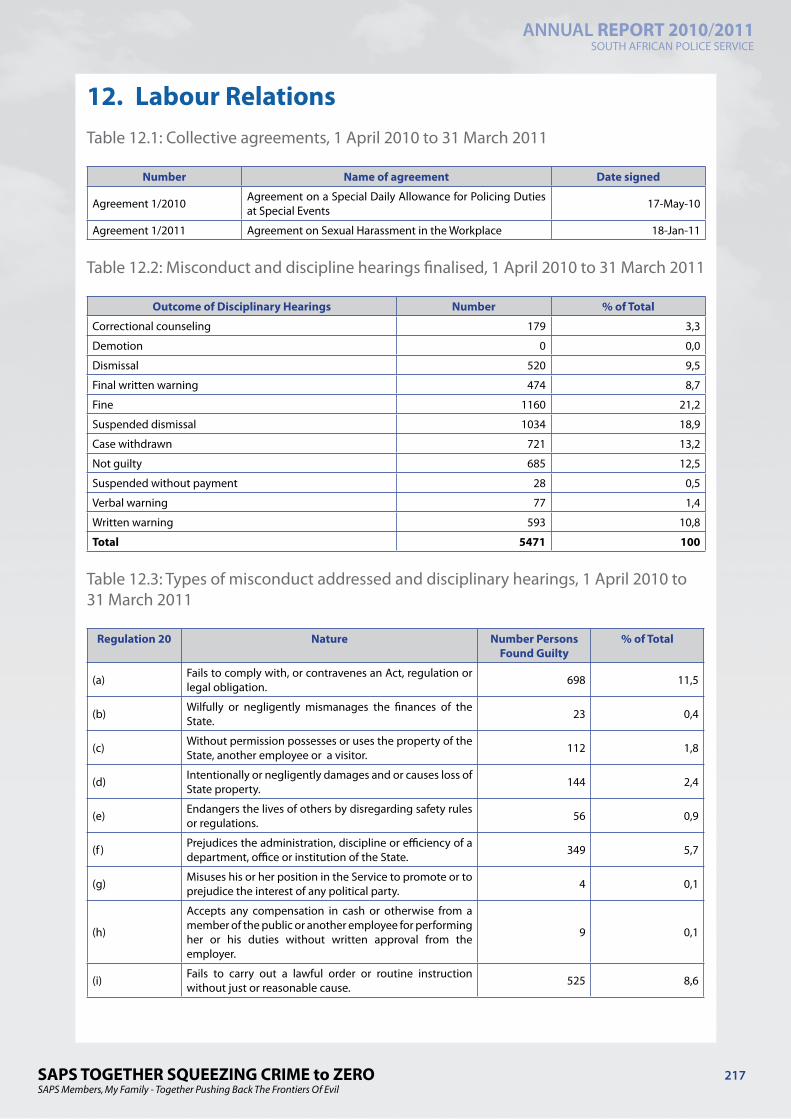
12. Labour RelationsTable 12.1: Collective agreements, 1 April 2010 to 31 March 2011
Number Name of agreement Date signed
Agreement 1/2010 Agreement on a Special Daily Allowance for Policing Duties at Special Events 17-May-10
Agreement 1/2011 Agreement on Sexual Harassment in the Workplace 18-Jan-11
Table 12.2: Misconduct and discipline hearings finalised, 1 April 2010 to 31 March 2011
Outcome of Disciplinary Hearings Number % of Total
Correctional counseling 179 3,3
Demotion 0 0,0
Dismissal 520 9,5
Final written warning 474 8,7
Fine 1160 21,2
Suspended dismissal 1034 18,9
Case withdrawn 721 13,2
Not guilty 685 12,5
Suspended without payment 28 0,5
Verbal warning 77 1,4
Written warning 593 10,8
Total 5471 100
Table 12.3: Types of misconduct addressed and disciplinary hearings, 1 April 2010 to31 March 2011
Regulation 20 Nature Number Persons Found Guilty
% of Total
(a) Fails to comply with, or contravenes an Act, regulation or legal obligation. 698 11,5
(b) Wilfully or negligently mismanages the finances of the State. 23 0,4
(c) Without permission possesses or uses the property of the State, another employee or a visitor. 112 1,8
(d) Intentionally or negligently damages and or causes loss of State property. 144 2,4
(e) Endangers the lives of others by disregarding safety rules or regulations. 56 0,9
(f ) Prejudices the administration, discipline or efficiency of a department, office or institution of the State. 349 5,7
(g) Misuses his or her position in the Service to promote or to prejudice the interest of any political party. 4 0,1
(h)
Accepts any compensation in cash or otherwise from a member of the public or another employee for performing her or his duties without written approval from the employer.
9 0,1
(i) Fails to carry out a lawful order or routine instruction without just or reasonable cause. 525 8,6
SAPS TOGETHER SQUEEZING CRIME to ZEROSAPS Members, My Family - Together Pushing Back The Frontiers Of Evil
ANNUAL REPORT 2010/2011SOUTH AFRICAN POLICE SERVICE
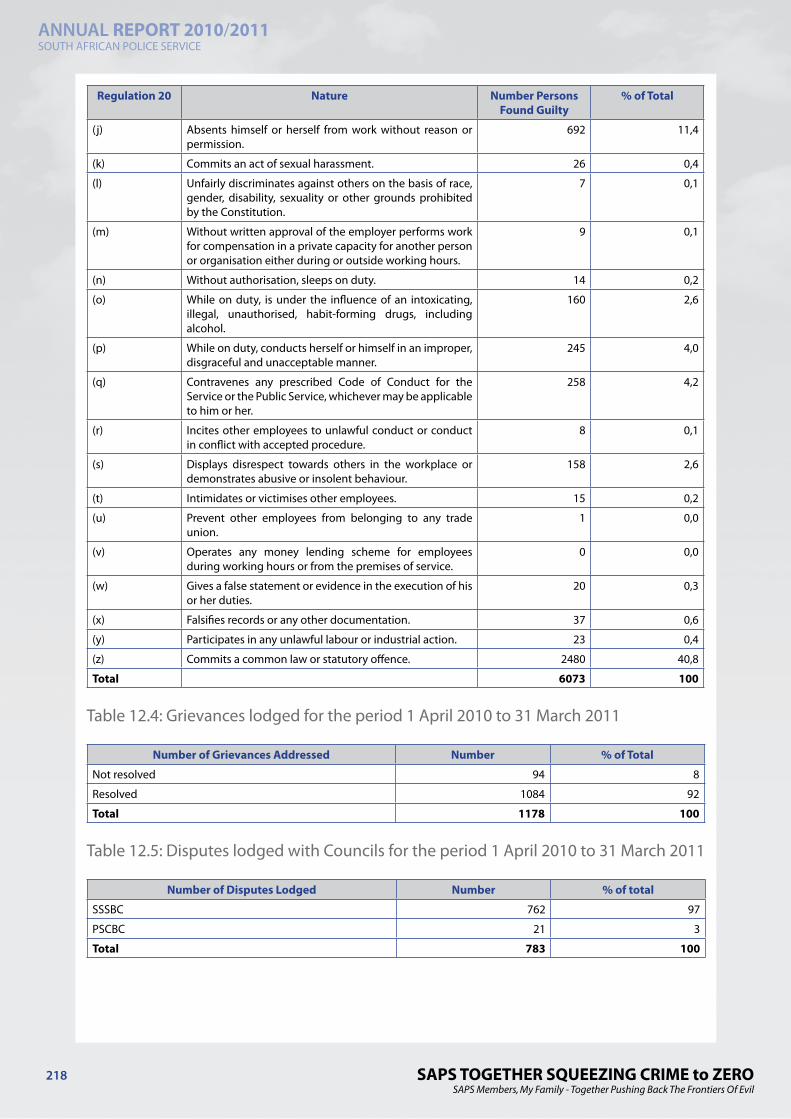
218
Regulation 20 Nature Number Persons Found Guilty
% of Total
(j) Absents himself or herself from work without reason or permission.
692 11,4
(k) Commits an act of sexual harassment. 26 0,4
(l) Unfairly discriminates against others on the basis of race, gender, disability, sexuality or other grounds prohibited by the Constitution.
7 0,1
(m) Without written approval of the employer performs work for compensation in a private capacity for another person or organisation either during or outside working hours.
9 0,1
(n) Without authorisation, sleeps on duty. 14 0,2
(o) While on duty, is under the influence of an intoxicating, illegal, unauthorised, habit-forming drugs, including alcohol.
160 2,6
(p) While on duty, conducts herself or himself in an improper, disgraceful and unacceptable manner.
245 4,0
(q) Contravenes any prescribed Code of Conduct for the Service or the Public Service, whichever may be applicable to him or her.
258 4,2
(r) Incites other employees to unlawful conduct or conduct in conflict with accepted procedure.
8 0,1
(s) Displays disrespect towards others in the workplace or demonstrates abusive or insolent behaviour.
158 2,6
(t) Intimidates or victimises other employees. 15 0,2
(u) Prevent other employees from belonging to any trade union.
1 0,0
(v) Operates any money lending scheme for employees during working hours or from the premises of service.
0 0,0
(w) Gives a false statement or evidence in the execution of his or her duties.
20 0,3
(x) Falsifies records or any other documentation. 37 0,6
(y) Participates in any unlawful labour or industrial action. 23 0,4
(z) Commits a common law or statutory offence. 2480 40,8
Total 6073 100
Table 12.4: Grievances lodged for the period 1 April 2010 to 31 March 2011
Number of Grievances Addressed Number % of Total
Not resolved 94 8
Resolved 1084 92
Total 1178 100
Table 12.5: Disputes lodged with Councils for the period 1 April 2010 to 31 March 2011
Number of Disputes Lodged Number % of total
SSSBC 762 97
PSCBC 21 3
Total 783 100
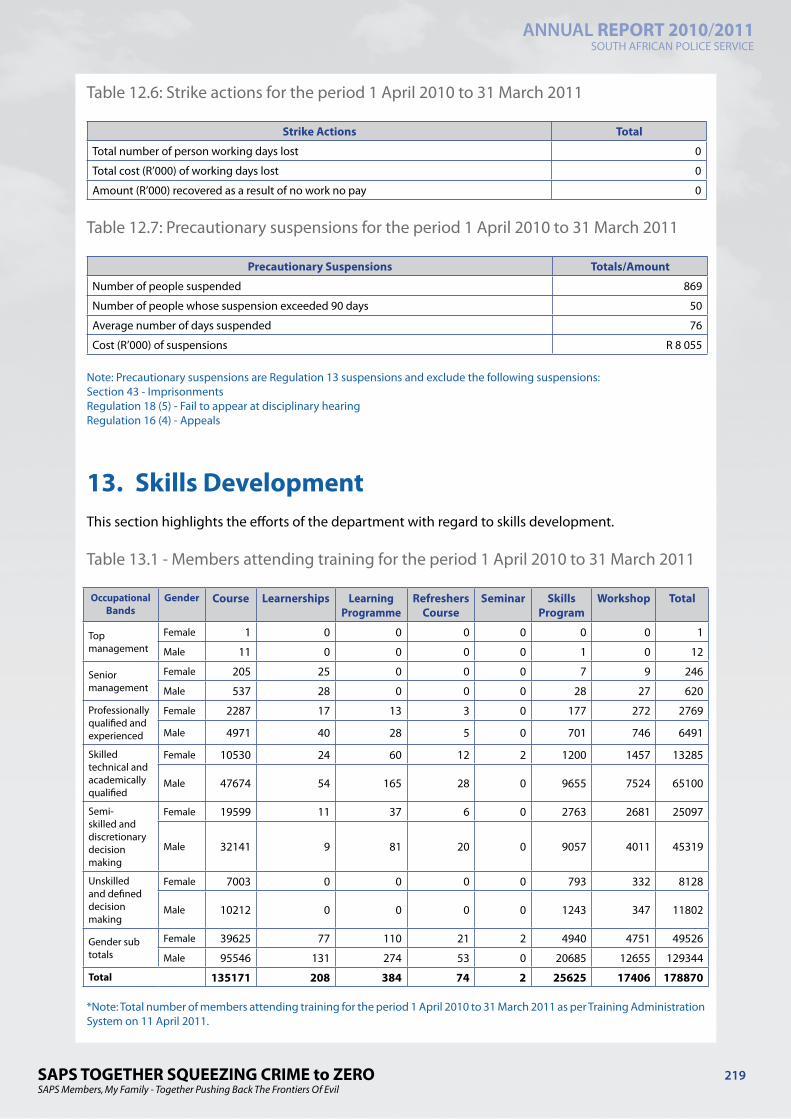
SAPS TOGETHER SQUEEZING CRIME to ZEROSAPS Members, My Family - Together Pushing Back The Frontiers Of Evil
ANNUAL REPORT 2010/2011SOUTH AFRICAN POLICE SERVICE
219
Table 12.6: Strike actions for the period 1 April 2010 to 31 March 2011
Strike Actions Total
Total number of person working days lost 0
Total cost (R’000) of working days lost 0
Amount (R’000) recovered as a result of no work no pay 0
Table 12.7: Precautionary suspensions for the period 1 April 2010 to 31 March 2011
Precautionary Suspensions Totals/Amount
Number of people suspended 869
Number of people whose suspension exceeded 90 days 50
Average number of days suspended 76
Cost (R’000) of suspensions R 8 055
Note: Precautionary suspensions are Regulation 13 suspensions and exclude the following suspensions:Section 43 - ImprisonmentsRegulation 18 (5) - Fail to appear at disciplinary hearingRegulation 16 (4) - Appeals
13. Skills DevelopmentThis section highlights the efforts of the department with regard to skills development.
Table 13.1 - Members attending training for the period 1 April 2010 to 31 March 2011
Occupational Bands
Gender Course Learnerships Learning Programme
Refreshers Course
Seminar Skills Program
Workshop Total
Top management
Female 1 0 0 0 0 0 0 1
Male 11 0 0 0 0 1 0 12
Senior management
Female 205 25 0 0 0 7 9 246
Male 537 28 0 0 0 28 27 620
Professionally qualified and experienced
Female 2287 17 13 3 0 177 272 2769
Male 4971 40 28 5 0 701 746 6491
Skilled technical and academically qualified
Female 10530 24 60 12 2 1200 1457 13285
Male 47674 54 165 28 0 9655 7524 65100
Semi-skilled and discretionary decision making
Female 19599 11 37 6 0 2763 2681 25097
Male 32141 9 81 20 0 9057 4011 45319
Unskilled and defined decision making
Female 7003 0 0 0 0 793 332 8128
Male 10212 0 0 0 0 1243 347 11802
Gender sub totals
Female 39625 77 110 21 2 4940 4751 49526
Male 95546 131 274 53 0 20685 12655 129344
Total 135171 208 384 74 2 25625 17406 178870
*Note: Total number of members attending training for the period 1 April 2010 to 31 March 2011 as per Training Administration System on 11 April 2011.
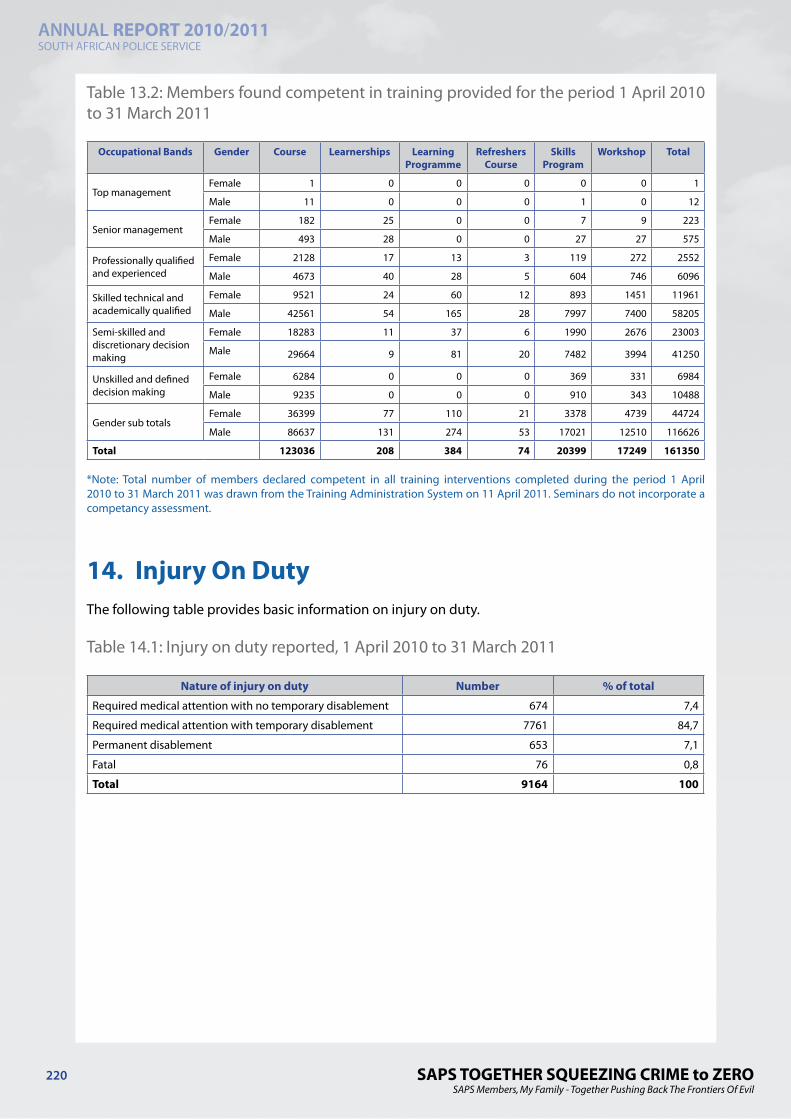
SAPS TOGETHER SQUEEZING CRIME to ZEROSAPS Members, My Family - Together Pushing Back The Frontiers Of Evil
ANNUAL REPORT 2010/2011SOUTH AFRICAN POLICE SERVICE
220
Table 13.2: Members found competent in training provided for the period 1 April 2010 to 31 March 2011
Occupational Bands Gender Course Learnerships Learning Programme
Refreshers Course
Skills Program
Workshop Total
Top managementFemale 1 0 0 0 0 0 1
Male 11 0 0 0 1 0 12
Senior managementFemale 182 25 0 0 7 9 223
Male 493 28 0 0 27 27 575
Professionally qualified and experienced
Female 2128 17 13 3 119 272 2552
Male 4673 40 28 5 604 746 6096
Skilled technical and academically qualified
Female 9521 24 60 12 893 1451 11961
Male 42561 54 165 28 7997 7400 58205
Semi-skilled and discretionary decision making
Female 18283 11 37 6 1990 2676 23003
Male 29664 9 81 20 7482 3994 41250
Unskilled and defined decision making
Female 6284 0 0 0 369 331 6984
Male 9235 0 0 0 910 343 10488
Gender sub totals Female 36399 77 110 21 3378 4739 44724
Male 86637 131 274 53 17021 12510 116626
Total 123036 208 384 74 20399 17249 161350
*Note: Total number of members declared competent in all training interventions completed during the period 1 April 2010 to 31 March 2011 was drawn from the Training Administration System on 11 April 2011. Seminars do not incorporate a competancy assessment.
14. Injury On DutyThe following table provides basic information on injury on duty.
Table 14.1: Injury on duty reported, 1 April 2010 to 31 March 2011
Nature of injury on duty Number % of total
Required medical attention with no temporary disablement 674 7,4
Required medical attention with temporary disablement 7761 84,7
Permanent disablement 653 7,1
Fatal 76 0,8
Total 9164 100
SAPS TOGETHER SQUEEZING CRIME to ZEROSAPS Members, My Family - Together Pushing Back The Frontiers Of Evil
ANNUAL REPORT 2010/2011SOUTH AFRICAN POLICE SERVICE
221
15. Utilization Of ConsultantsSee page 164 which refers to Goods and Services of which “Consultants, Contractors and Special Services” is a sub-classification.