Embed Size (px)
Citation preview
Global Trade & Receivables Finance WebinarAPRIL 2017
Noel Quinn – Group Managing Director and Chief Executive Officer, Global Commercial BankingNatalie Blyth – Global Head of Trade and Receivables Finance, Global Commercial Banking 1
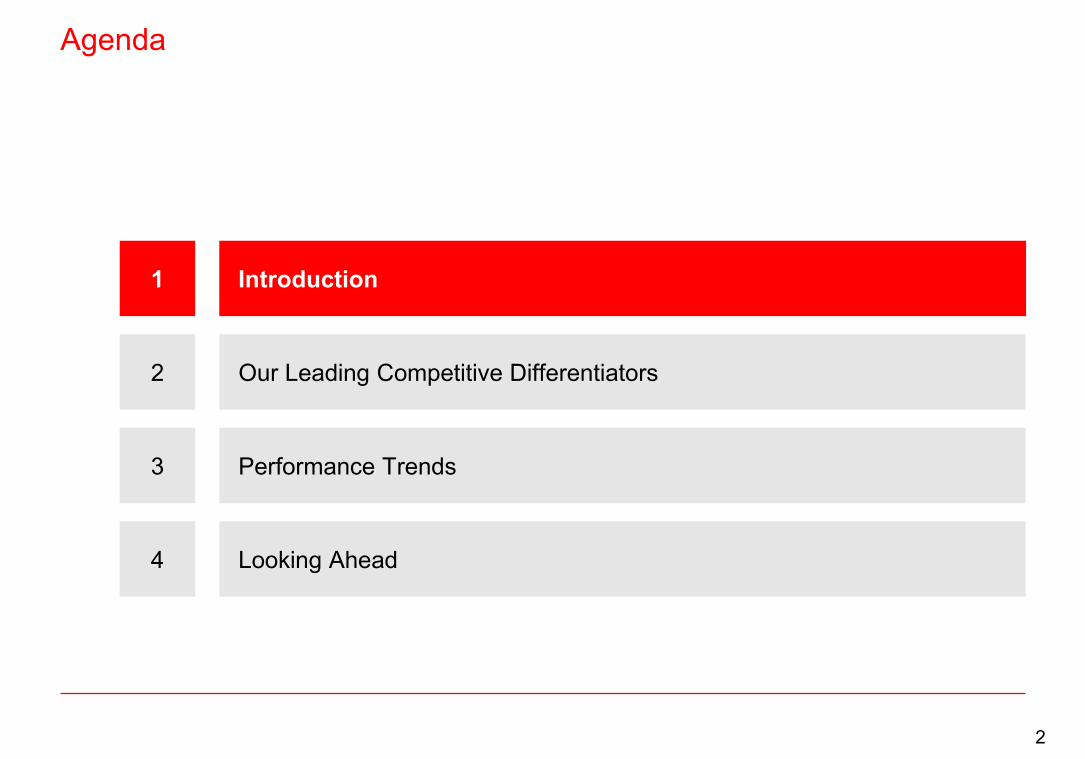
Agenda
Our Leading Competitive Differentiators2
1 Introduction
Performance Trends3
Looking Ahead4
2
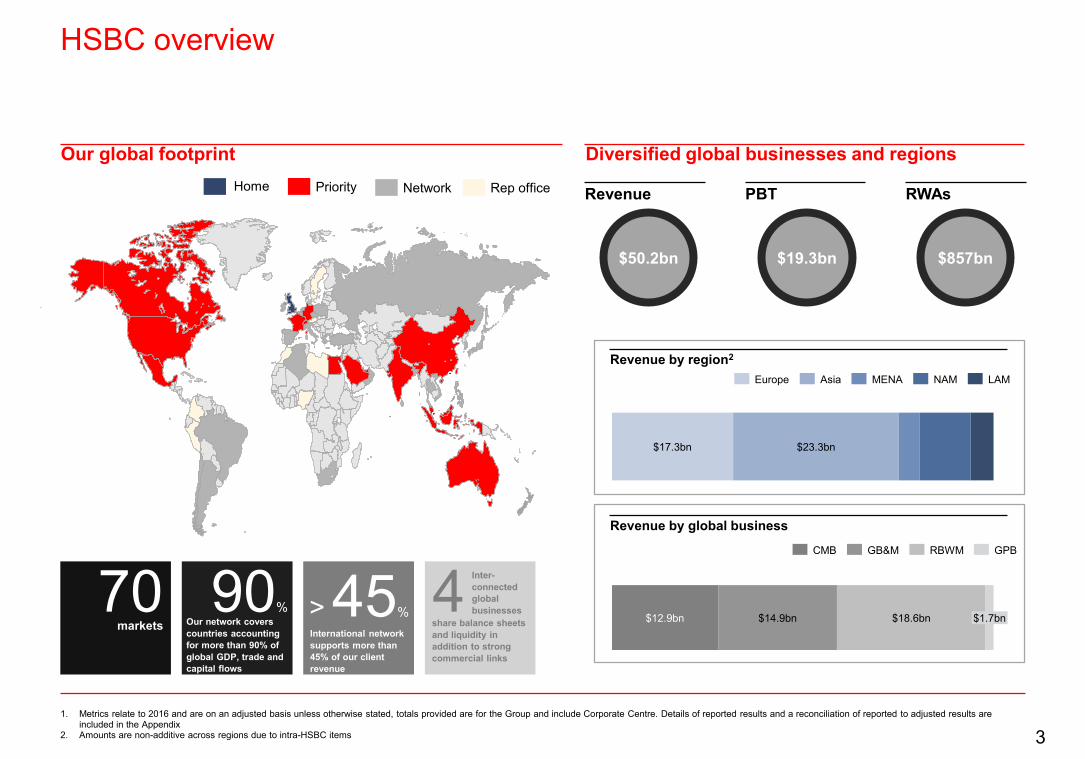
HSBC overview
1. Metrics relate to 2016 and are on an adjusted basis unless otherwise stated, totals provided are for the Group and include Corporate Centre. Details of reported results and a reconciliation of reported to adjusted results are included in the Appendix
2. Amounts are non-additive across regions due to intra-HSBC items
Our global footprint
70markets
90%Our network covers countries accounting for more than 90% of global GDP, trade and capital flows
> 45%International network supports more than 45% of our client revenue
4 Inter-connected global businesses
share balance sheets and liquidity in addition to strong commercial links
Diversified global businesses and regionsNetworkPriority Rep office
$50.2bn
Revenue PBT RWAs
$19.3bn $857bn
$17.3bn $23.3bn
LAMNAMMENAAsiaEurope
Revenue by region2
$12.9bn $14.9bn $18.6bn $1.7bn
CMB GPBGB&M RBWM
Revenue by global business
Home
3
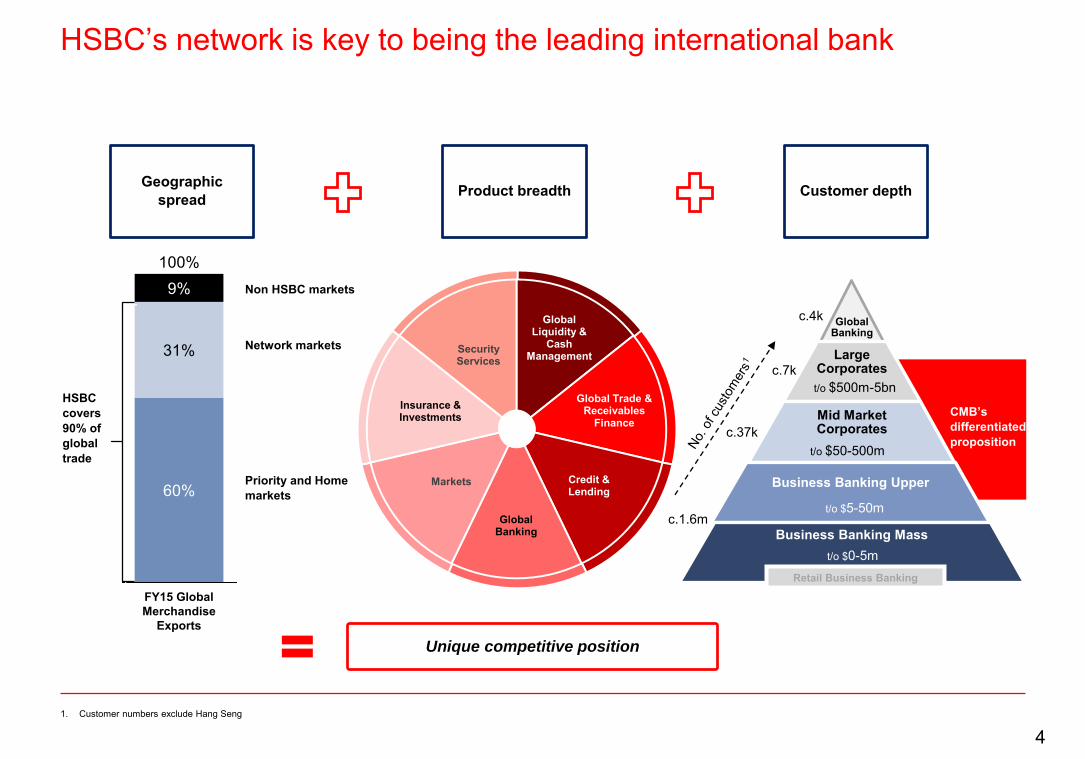
Global Banking
Large Corporates
Mid Market Corporates
Business Banking Upper
Business Banking Mass
Global Liquidity &
Cash Management
Global Trade & Receivables
Finance
Credit & Lending
Global Banking
Markets
Insurance & Investments
Security Services
HSBC’s network is key to being the leading international bank
1. Customer numbers exclude Hang Seng
Unique competitive position
60%
FY15 Global Merchandise
Exports
9%
31%
100%Non HSBC markets
Network markets
Priority and Homemarkets
Geographic spread Customer depthProduct breadth
t/o $5-50m
t/o $50-500m
t/o $500m-5bn
c.1.6m
c.37k
c.7k
t/o $0-5mRetail Business Banking
c.4k
HSBC covers 90% of global trade
CMB’s differentiated proposition
4
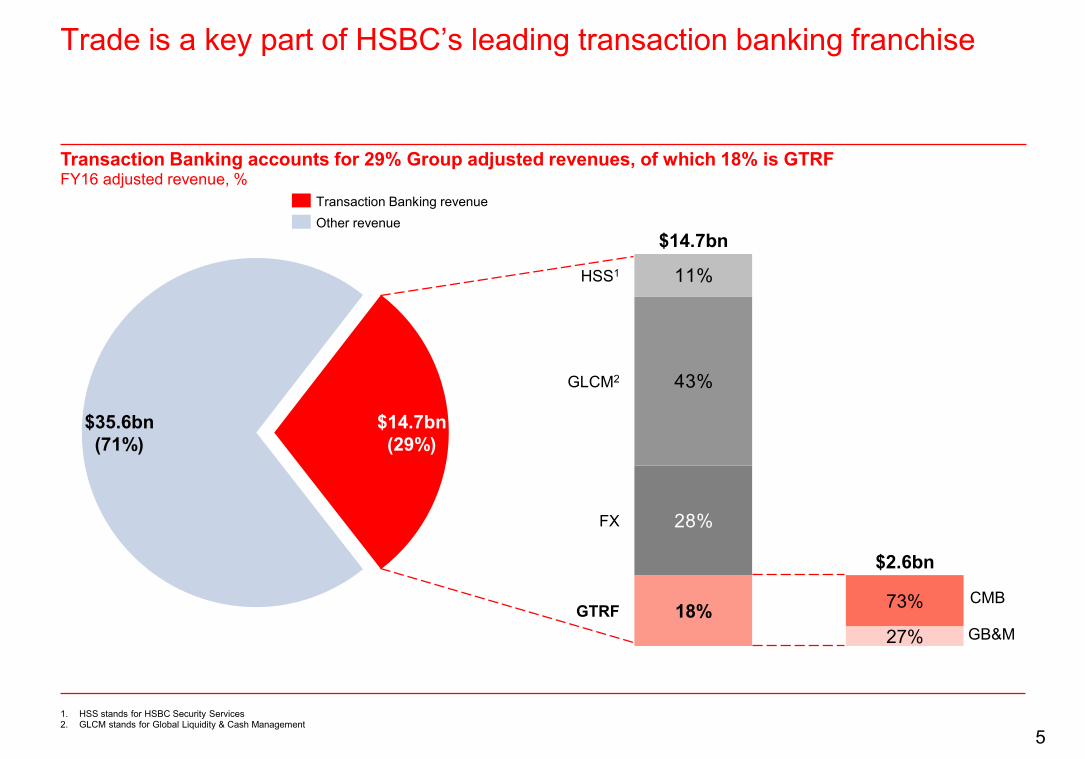
Trade is a key part of HSBC’s leading transaction banking franchise
1. HSS stands for HSBC Security Services2. GLCM stands for Global Liquidity & Cash Management
28%
43%
11%
GTRF
FX
GLCM2
HSS1
$2.6bn
27%
73%
$14.7bn
18%
$35.6bn (71%)
$14.7bn(29%)
$35.6bn(71%)
CMB
GB&M
Transaction Banking accounts for 29% Group adjusted revenues, of which 18% is GTRFFY16 adjusted revenue, %
Other revenueTransaction Banking revenue
5
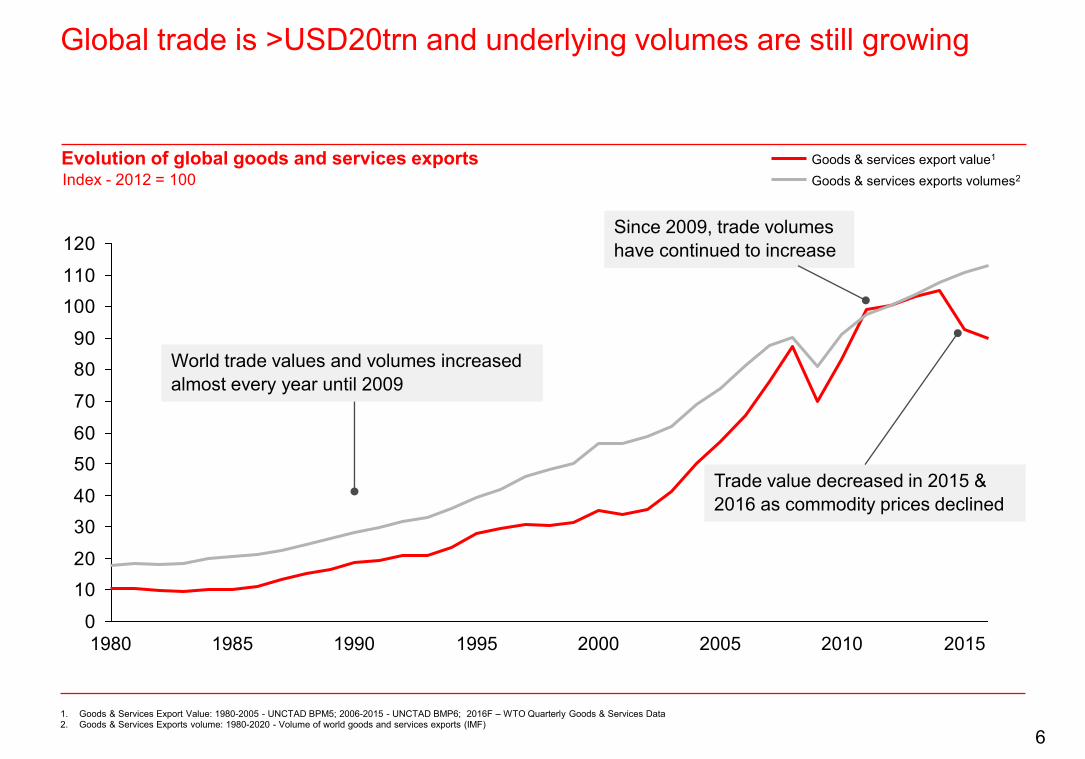
Global trade is >USD20trn and underlying volumes are still growing
Evolution of global goods and services exportsIndex - 2012 = 100
0
1020
3040
5060
70
8090
100110
120
1980 2015201020052000199519901985
Goods & services export value1
Goods & services exports volumes2
World trade values and volumes increased almost every year until 2009
Trade value decreased in 2015 & 2016 as commodity prices declined
Since 2009, trade volumes have continued to increase
1. Goods & Services Export Value: 1980-2005 - UNCTAD BPM5; 2006-2015 - UNCTAD BMP6; 2016F – WTO Quarterly Goods & Services Data2. Goods & Services Exports volume: 1980-2020 - Volume of world goods and services exports (IMF)
6
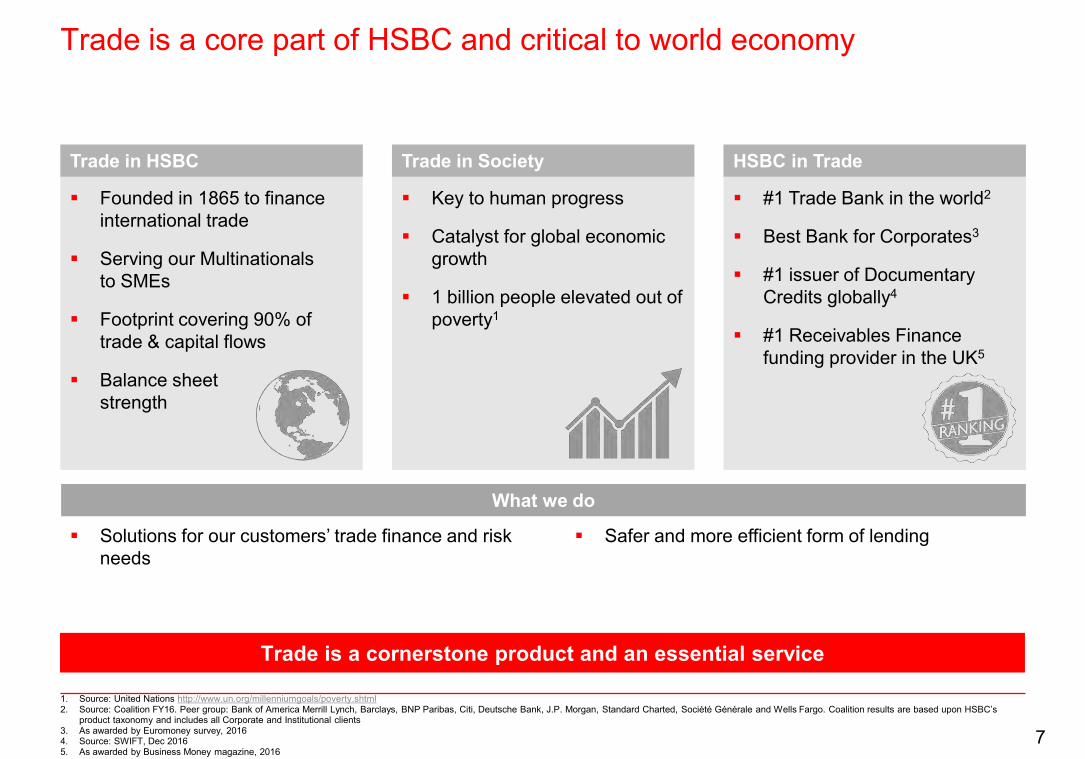
Trade is a core part of HSBC and critical to world economy
1. Source: United Nations http://www.un.org/millenniumgoals/poverty.shtml2. Source: Coalition FY16. Peer group: Bank of America Merrill Lynch, Barclays, BNP Paribas, Citi, Deutsche Bank, J.P. Morgan, Standard Charted, Société Générale and Wells Fargo. Coalition results are based upon HSBC’s
product taxonomy and includes all Corporate and Institutional clients3. As awarded by Euromoney survey, 20164. Source: SWIFT, Dec 20165. As awarded by Business Money magazine, 2016
Founded in 1865 to finance international trade
Serving our Multinationals to SMEs
Footprint covering 90% of trade & capital flows
Balance sheet strength
Trade in HSBC
Key to human progress
Catalyst for global economic growth
1 billion people elevated out of poverty1
Trade in Society
#1 Trade Bank in the world2
Best Bank for Corporates3
#1 issuer of Documentary Credits globally4
#1 Receivables Finance funding provider in the UK5
HSBC in Trade
Trade is a cornerstone product and an essential service
What we do
Solutions for our customers’ trade finance and risk needs
Safer and more efficient form of lending
7
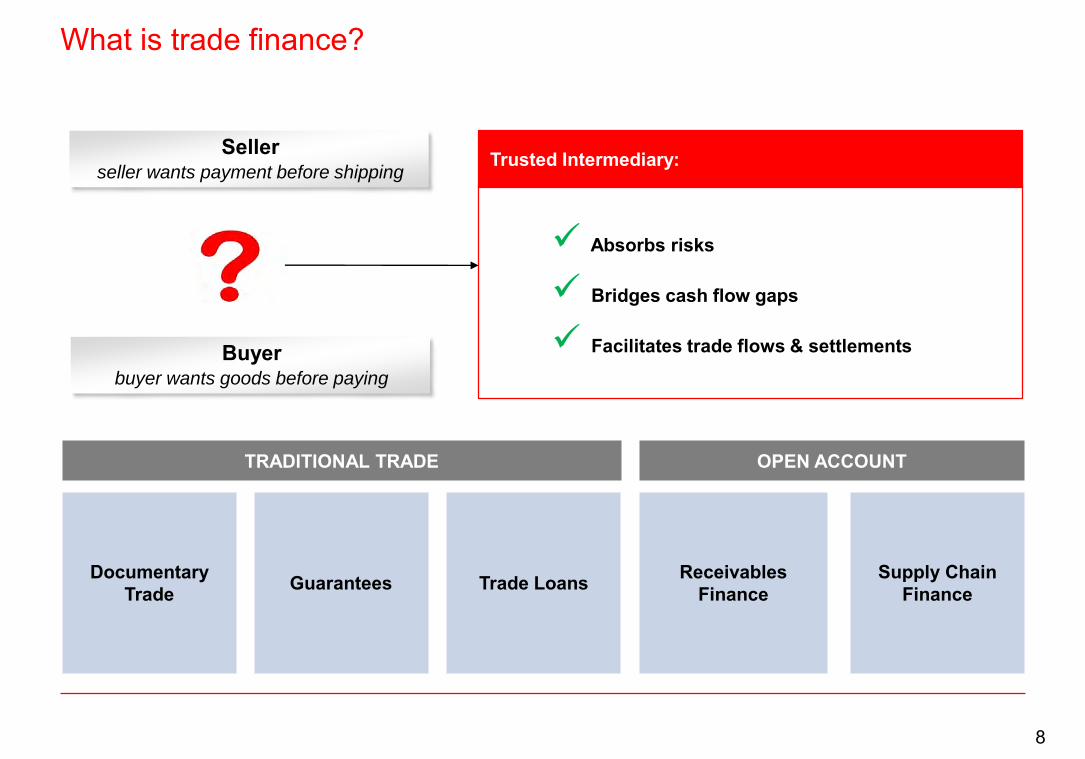
What is trade finance?
Absorbs risks
Bridges cash flow gaps
Facilitates trade flows & settlements
Trusted Intermediary:
Buyerbuyer wants goods before paying
Sellerseller wants payment before shipping
Documentary Trade Guarantees Supply Chain
FinanceTrade Loans Receivables Finance
TRADITIONAL TRADE OPEN ACCOUNT
8
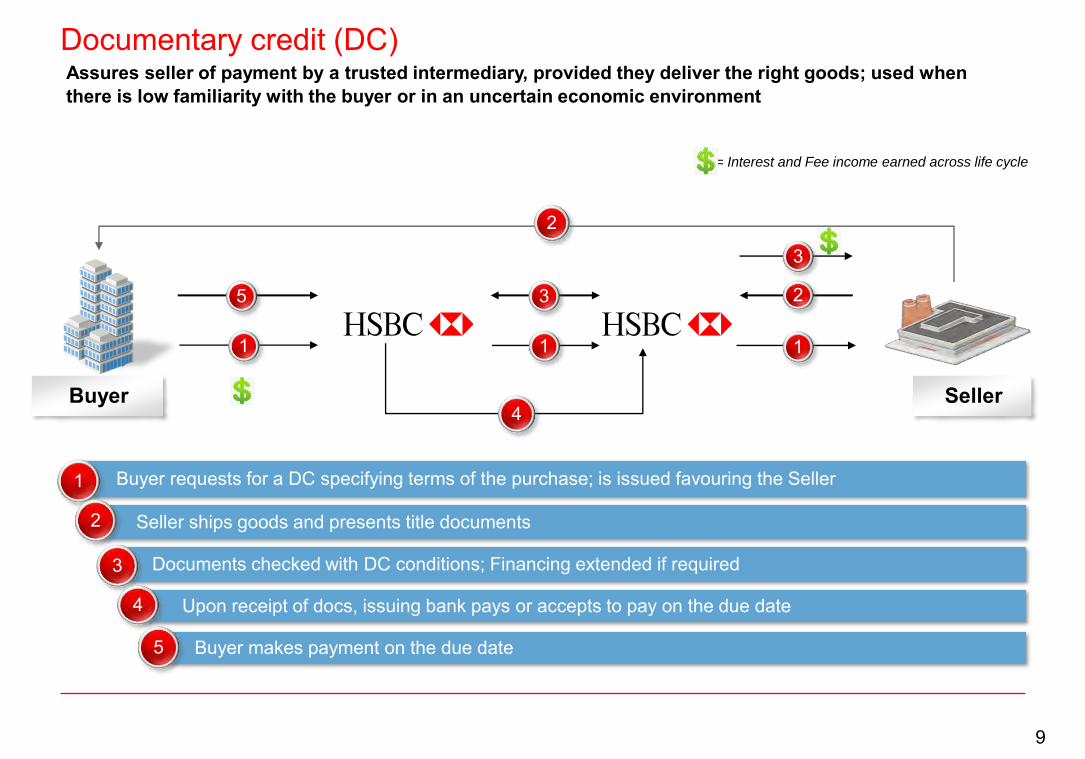
Buyer requests for a DC specifying terms of the purchase; is issued favouring the Seller 1
Documentary credit (DC)
Buyer Seller
Seller ships goods and presents title documents2
1
Documents checked with DC conditions; Financing extended if required3
1
3
Upon receipt of docs, issuing bank pays or accepts to pay on the due date4
2
= Interest and Fee income earned across life cycle
1
2
Buyer makes payment on the due date5
5
3
Assures seller of payment by a trusted intermediary, provided they deliver the right goods; used when there is low familiarity with the buyer or in an uncertain economic environment
9
4
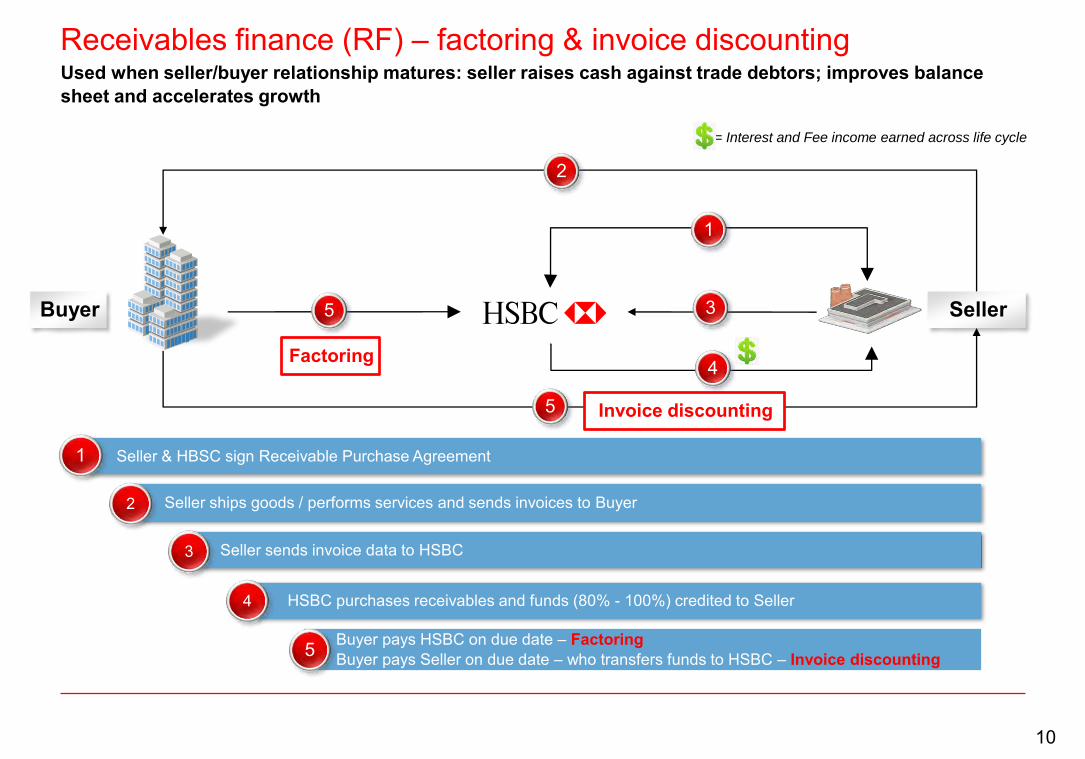
Receivables finance (RF) – factoring & invoice discounting
Buyer
OA
T
Seller
Seller & HBSC sign Receivable Purchase Agreement 1
1
Seller ships goods / performs services and sends invoices to Buyer2
3
Seller sends invoice data to HSBC 3
5
HSBC purchases receivables and funds (80% - 100%) credited to Seller 4
4
Buyer pays HSBC on due date – Factoring Buyer pays Seller on due date – who transfers funds to HSBC – Invoice discounting 5
2
5
= Interest and Fee income earned across life cycle
Used when seller/buyer relationship matures: seller raises cash against trade debtors; improves balance sheet and accelerates growth
Factoring
Invoice discounting
10
Agenda
Our Leading Competitive Differentiators2
1 Introduction
Performance Trends3
Looking Ahead4
11
Av. funded assets5
as at 4Q16
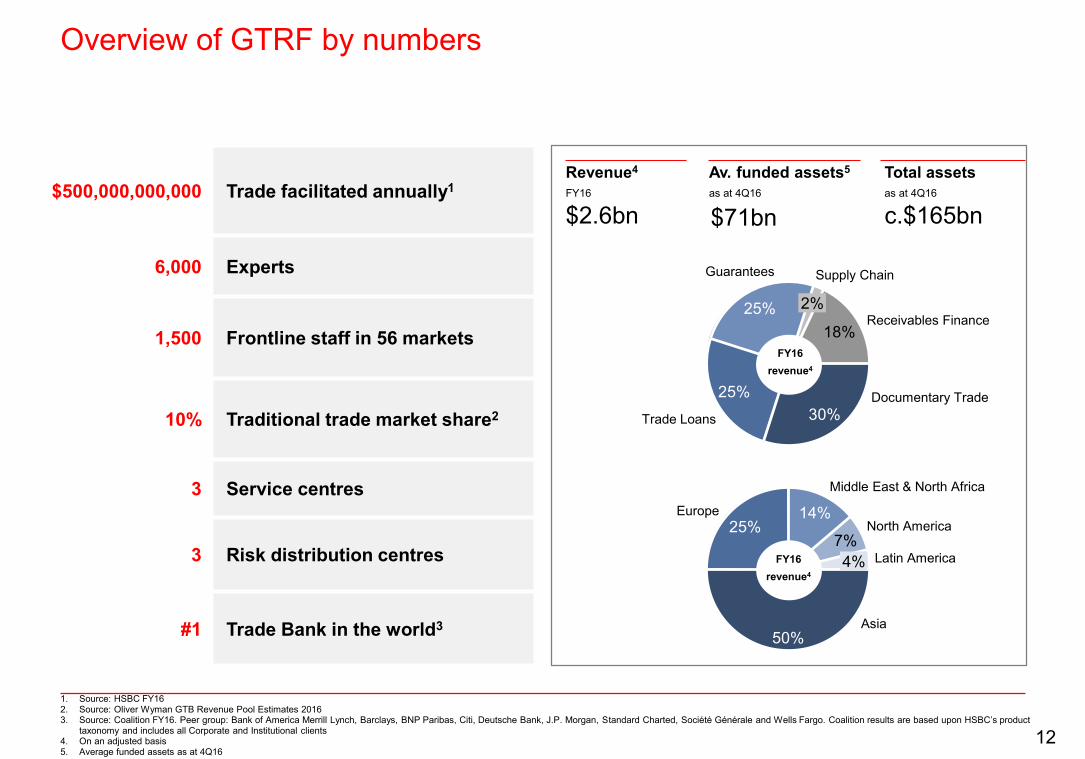
Overview of GTRF by numbers
1. Source: HSBC FY162. Source: Oliver Wyman GTB Revenue Pool Estimates 2016 3. Source: Coalition FY16. Peer group: Bank of America Merrill Lynch, Barclays, BNP Paribas, Citi, Deutsche Bank, J.P. Morgan, Standard Charted, Société Générale and Wells Fargo. Coalition results are based upon HSBC’s product
taxonomy and includes all Corporate and Institutional clients4. On an adjusted basis5. Average funded assets as at 4Q16
$500,000,000,000 Trade facilitated annually1
6,000 Experts
1,500 Frontline staff in 56 markets
10% Traditional trade market share2
3 Service centres
3 Risk distribution centres
#1 Trade Bank in the world3
Revenue4
FY16
Total assets as at 4Q16
$2.6bn $71bn
Guarantees Supply Chain
25%
2%
18%
Documentary TradeTrade Loans 30%
25%Receivables Finance
50%Asia
25%Europe 14%
Middle East & North Africa
7%North America
4% Latin America
c.$165bn
FY16revenue4
FY16revenue4
12
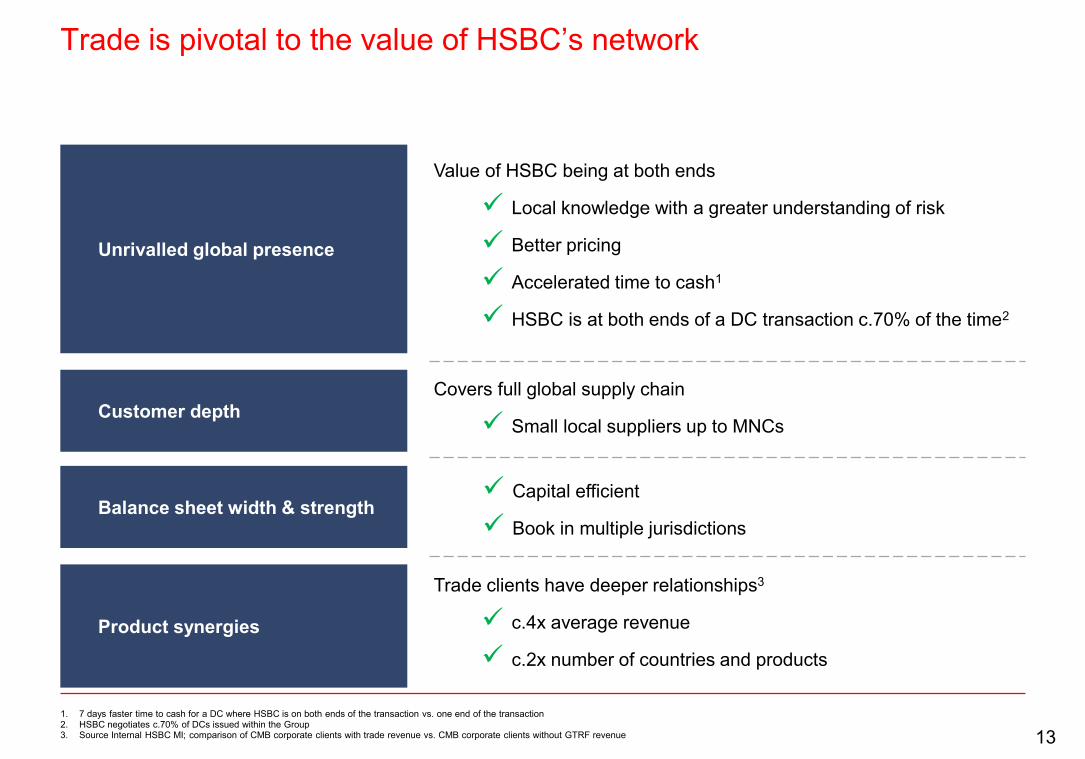
Trade is pivotal to the value of HSBC’s network
1. 7 days faster time to cash for a DC where HSBC is on both ends of the transaction vs. one end of the transaction2. HSBC negotiates c.70% of DCs issued within the Group3. Source Internal HSBC MI; comparison of CMB corporate clients with trade revenue vs. CMB corporate clients without GTRF revenue
Covers full global supply chain
Small local suppliers up to MNCs
Trade clients have deeper relationships3
c.4x average revenue
c.2x number of countries and products
Value of HSBC being at both ends
Local knowledge with a greater understanding of risk
Better pricing
Accelerated time to cash1
HSBC is at both ends of a DC transaction c.70% of the time2
Customer depth
Balance sheet width & strength
Product synergies
Unrivalled global presence
Capital efficient
Book in multiple jurisdictions
13
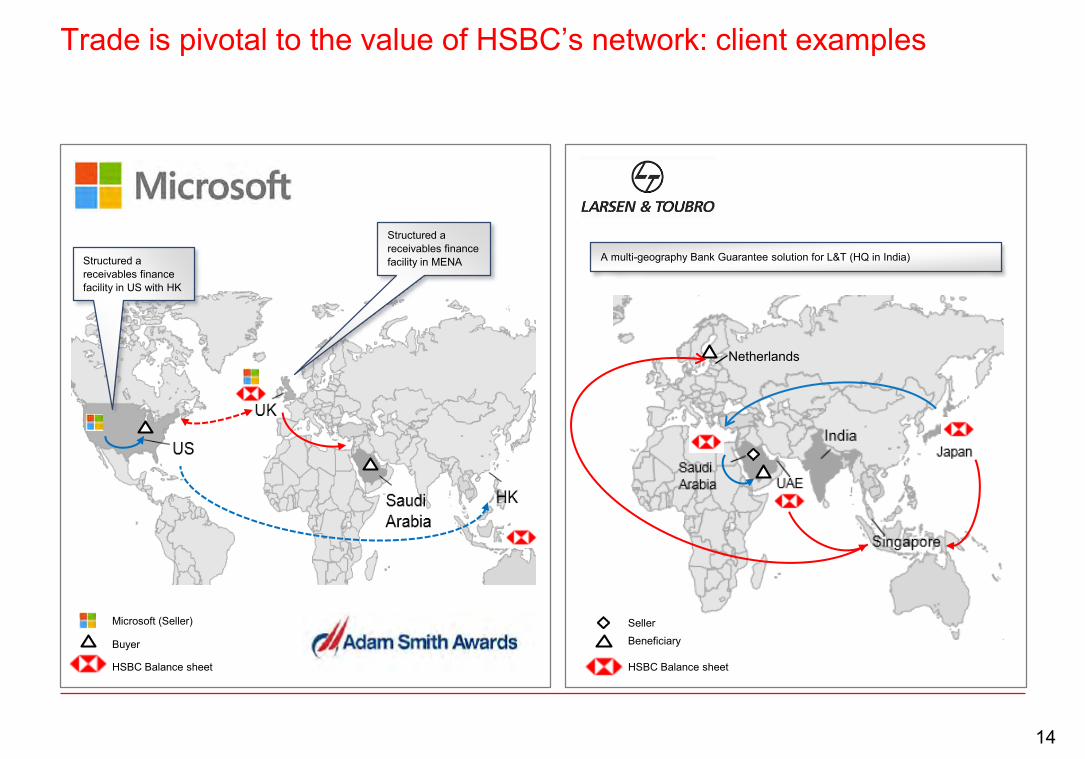
Trade is pivotal to the value of HSBC’s network: client examples
Microsoft (Seller)
Buyer
HSBC Balance sheet
Structured a receivables finance facility in US with HK
Structured a receivables finance facility in MENA
HSBC Balance sheet
BeneficiarySeller
A multi-geography Bank Guarantee solution for L&T (HQ in India)
Netherlands
14
Agenda
Our Leading Competitive Differentiators2
1 Introduction
Performance Trends3
Looking Ahead4
15
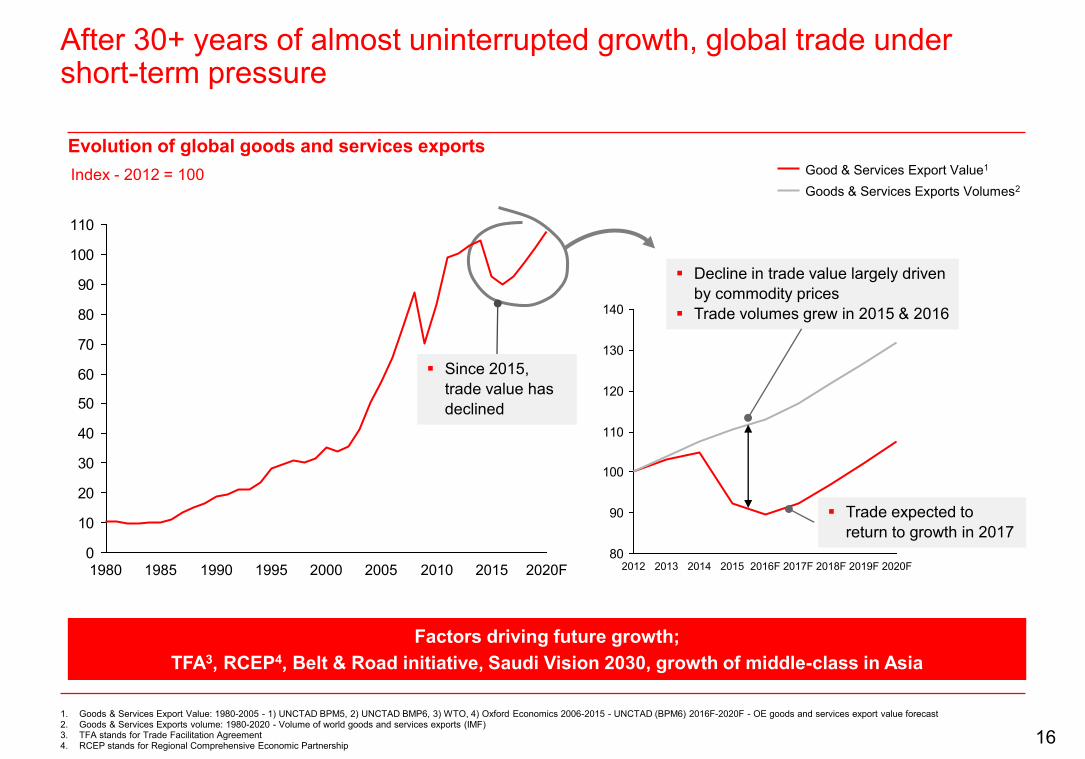
After 30+ years of almost uninterrupted growth, global trade under short-term pressure
Evolution of global goods and services exportsIndex - 2012 = 100
0
10
20
30
40
50
60
70
80
90
100
110
2020F2015201020052000199519901985198080
90
100
110
120
130
140
2020F2019F2018F2017F2016F2015201420132012
Since 2015, trade value has declined
Trade expected to return to growth in 2017
Good & Services Export Value1
Goods & Services Exports Volumes2
Decline in trade value largely driven by commodity prices
Trade volumes grew in 2015 & 2016
1. Goods & Services Export Value: 1980-2005 - 1) UNCTAD BPM5, 2) UNCTAD BMP6, 3) WTO, 4) Oxford Economics 2006-2015 - UNCTAD (BPM6) 2016F-2020F - OE goods and services export value forecast2. Goods & Services Exports volume: 1980-2020 - Volume of world goods and services exports (IMF)3. TFA stands for Trade Facilitation Agreement 4. RCEP stands for Regional Comprehensive Economic Partnership
Factors driving future growth;TFA3, RCEP4, Belt & Road initiative, Saudi Vision 2030, growth of middle-class in Asia
16
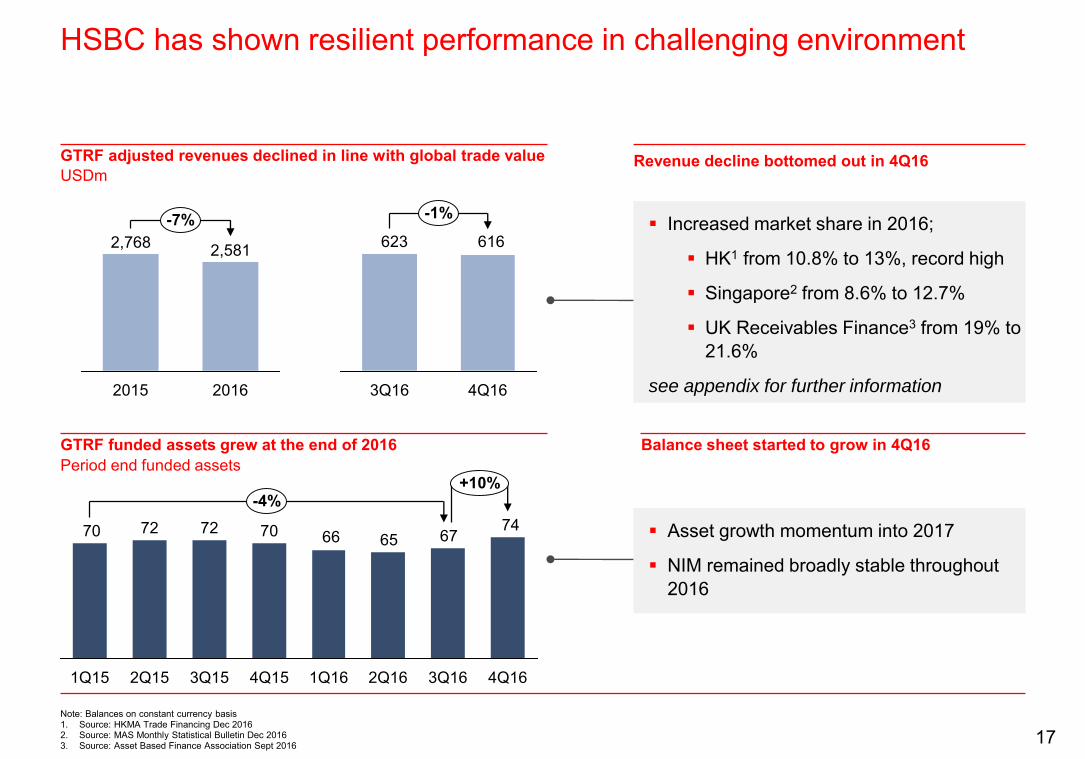
HSBC has shown resilient performance in challenging environment
Note: Balances on constant currency basis 1. Source: HKMA Trade Financing Dec 20162. Source: MAS Monthly Statistical Bulletin Dec 20163. Source: Asset Based Finance Association Sept 2016
GTRF adjusted revenues declined in line with global trade value USDm
7467656670727270
1Q15
+10%
4Q163Q162Q161Q164Q153Q152Q15
-4%
GTRF funded assets grew at the end of 2016 Period end funded assets
2016
-7%2,768 2,581
2015
616623
4Q16
-1%
3Q16
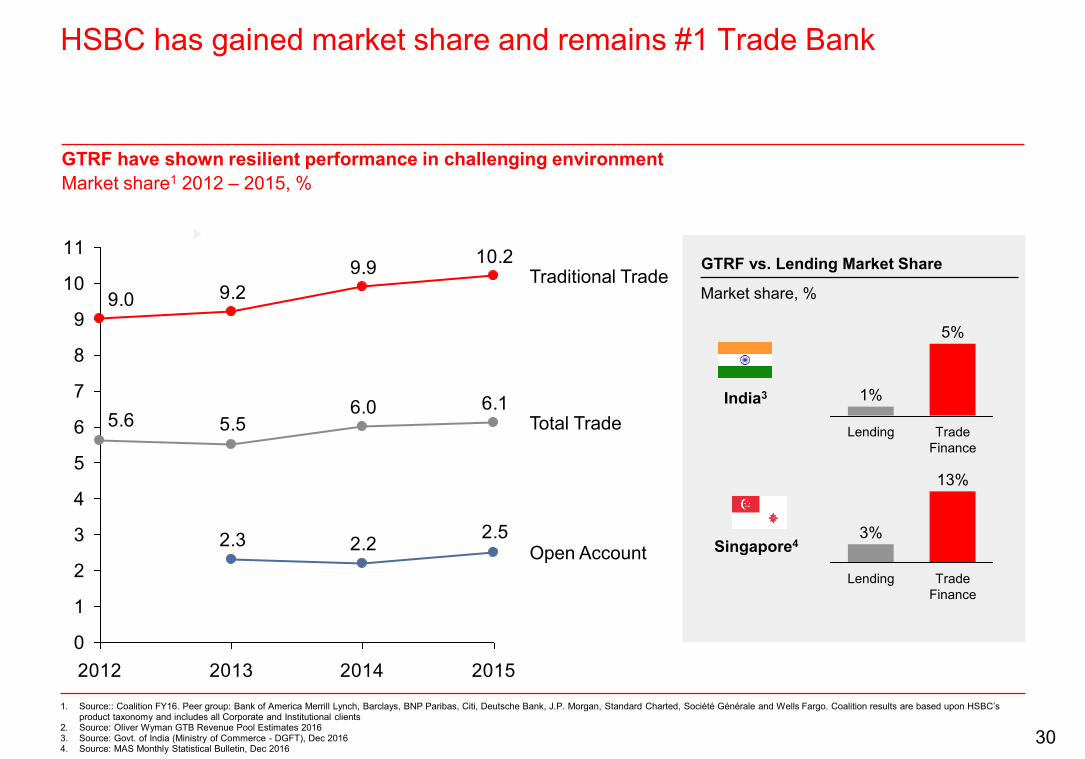
Increased market share in 2016;
HK1 from 10.8% to 13%, record high
Singapore2 from 8.6% to 12.7%
UK Receivables Finance3 from 19% to 21.6%
see appendix for further information
Asset growth momentum into 2017
NIM remained broadly stable throughout 2016
Revenue decline bottomed out in 4Q16
Balance sheet started to grow in 4Q16
17
Agenda
Our Leading Competitive Differentiators2
1 Introduction
Performance Trends3
Looking Ahead4
18
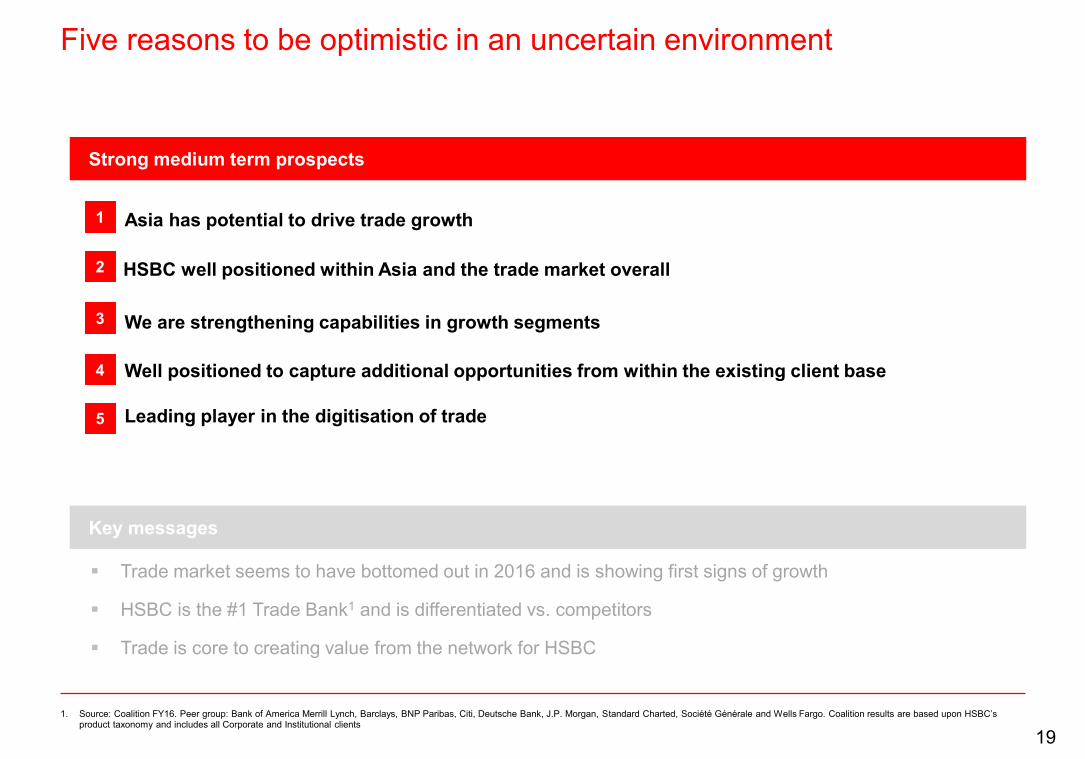
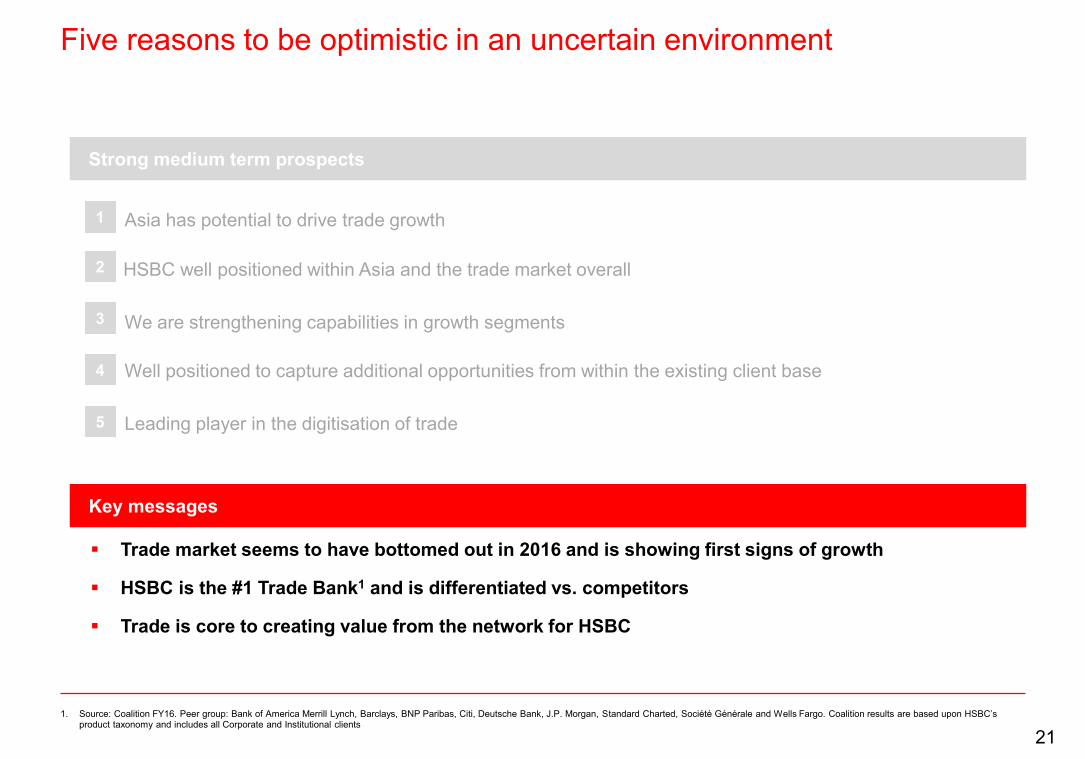
Five reasons to be optimistic in an uncertain environment
1. Source: Coalition FY16. Peer group: Bank of America Merrill Lynch, Barclays, BNP Paribas, Citi, Deutsche Bank, J.P. Morgan, Standard Charted, Société Générale and Wells Fargo. Coalition results are based upon HSBC’s product taxonomy and includes all Corporate and Institutional clients
Asia has potential to drive trade growth
We are strengthening capabilities in growth segments
Well positioned to capture additional opportunities from within the existing client base
HSBC well positioned within Asia and the trade market overall
Leading player in the digitisation of trade
Strong medium term prospects
Trade market seems to have bottomed out in 2016 and is showing first signs of growth
HSBC is the #1 Trade Bank1 and is differentiated vs. competitors
Trade is core to creating value from the network for HSBC
Key messages
1
2
3
4
5
19
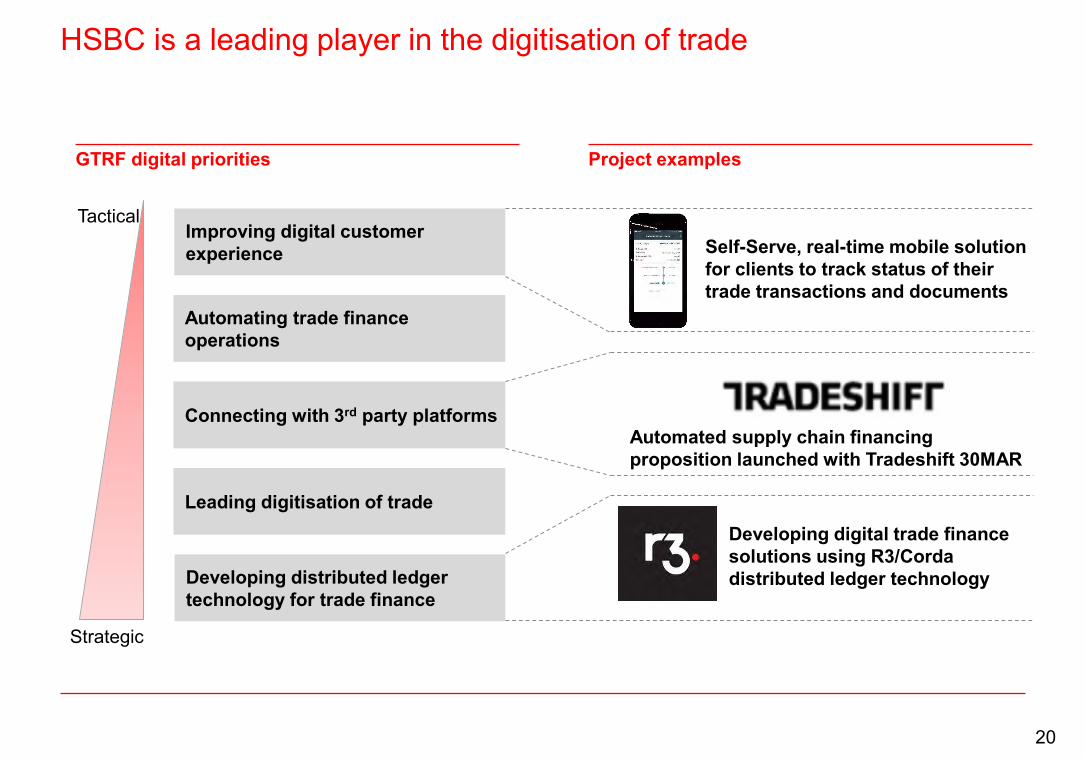
HSBC is a leading player in the digitisation of trade
GTRF digital priorities
Improving digital customer experience
Connecting with 3rd party platforms
Developing distributed ledger technology for trade finance
Leading digitisation of trade
Automating trade finance operations
Tactical
Strategic
Self-Serve, real-time mobile solution for clients to track status of their trade transactions and documents
Project examples
Automated supply chain financing proposition launched with Tradeshift 30MAR
Developing digital trade finance solutions using R3/Cordadistributed ledger technology
20
Five reasons to be optimistic in an uncertain environment
1. Source: Coalition FY16. Peer group: Bank of America Merrill Lynch, Barclays, BNP Paribas, Citi, Deutsche Bank, J.P. Morgan, Standard Charted, Société Générale and Wells Fargo. Coalition results are based upon HSBC’s product taxonomy and includes all Corporate and Institutional clients
Asia has potential to drive trade growth
We are strengthening capabilities in growth segments
Well positioned to capture additional opportunities from within the existing client base
HSBC well positioned within Asia and the trade market overall
Leading player in the digitisation of trade
Strong medium term prospects
Trade market seems to have bottomed out in 2016 and is showing first signs of growth
HSBC is the #1 Trade Bank1 and is differentiated vs. competitors
Trade is core to creating value from the network for HSBC
Key messages
1
2
3
4
5
21
Appendix
22
23
AppendixImportant notice and forward-looking statements
Important notice
The information set out in this presentation and subsequent discussion does not constitute a public offer for the purposes of any applicable law or an offer to sell or solicitation of any offer to purchase any securities or other financial instruments or any recommendation in respect of such securities or instruments.
Forward-looking statements
This presentation and subsequent discussion may contain projections, estimates, forecasts, targets, opinions, prospects, results, returns and forward-looking statements with respect to the financial condition, results of operations, capital position and business of the Group (together, “forward-looking statements”). Any such forward-looking statements are not a reliable indicator of future performance, as they may involve significant assumptions and subjective judgements which may or may not prove to be correct and there can be no assurance that any of the matters set out in forward-looking statements are attainable, will actually occur or will be realised or are complete or accurate. Forward-looking statements are statements about the future and are inherently uncertain and generally based on stated or implied assumptions. The assumptions may prove to be incorrect and involve known and unknown risks, uncertainties, contingencies and other important factors, many of which are outside the control of the Group. Actual achievements, results, performance or other future events or conditions may differ materially from those stated, implied and/or reflected in any forward-looking statements due to a variety of risks, uncertainties and other factors (including without limitation those which are referable to general market conditions or regulatory changes). Any such forward-looking statements are based on the beliefs, expectations and opinions of the Group at the date the statements are made, and the Group does not assume, and hereby disclaims, any obligation or duty to update them if circumstances or management’s beliefs, expectations or opinions should change. For these reasons, recipients should not place reliance on, and are cautioned about relying on, any forward-looking statements. Additional detailed information concerning important factors that could cause actual results to differ materially is available in our 2016 Annual Report and Accounts.
This presentation contains non-GAAP financial information. The primary non-GAAP financial measure we use is ‘adjusted performance’ which is computed by adjusting reported results for the period-on-period effects of foreign currency translation differences and significant items which distort period-on-period comparisons. Significant items are those items which management and investors would ordinarily identify and consider separately when assessing performance in order to better understand the underlying trends in the business. Reconciliations between non-GAAP financial measurements and the most directly comparable measures under GAAP are provided in the 2016 Annual Report and Accounts and theReconciliations of Non-GAAP Financial Measures document which are both available at www.hsbc.com.
23
Executive Biographies
Noel Quinn was appointed Chief Executive, Global Commercial Banking, in December 2015.
He became a Group Managing Director in September 2016.
Based in London, Mr Quinn is responsible for HSBC’s relationships with about 2 million business customers with turnover up to $5bn in Asia-Pacific, Europe, the Middle East and North Africa, North America and Latin America. He is responsible for c.$300bn of lending assets and $13bn of revenues across 54 countries.
From 2011 to 2015 he was the Regional Head of Commercial Banking for the Asia-Pacific region based in Hong Kong, which accounted for c.50% of global CMB revenues. From October 2008-2011 he was Head of Commercial Banking in the UK, which represented c.20% of global CMB revenues, and started in role by managing the business carefully through the global financial crisis.
Mr Quinn qualified as an accountant in October 1987. He joined Forward Trust Group, a subsidiary of Midland Bank (now part of HSBC), in January 1988. He has spent 30 years in Banking, 26 of which have been in front line or functional roles within HSBC.
He has lived and worked in the UK, Europe, US and Asia. He featured among the Top 30 Ally Executives in the 2015 Financial Times/OUTstanding Executive Diversity ranking. He is passionate about developing a culture that values inclusion and diversity, and helping entrepreneurial businesses to develop and grow.
Noel QuinnGroup Managing Director and Chief Executive Officer, Global Commercial Banking
24
Executive Biographies
Natalie Blyth was appointed Global Head of Trade and Receivables Finance, Global Commercial Banking, in July 2016.
Based in HSBC Group’s London offices, Ms. Blyth is responsible for a business which provides financing and risk mitigation solutions to meet clients’ international and domestic trade requirements.
Ms. Blyth has over 20 years’ investment banking experience. She joined the Global Commercial Banking business in 2015, as the Global Head of Large Corporates and went on to become the Global Head of Client Coverage. Before moving into Commercial Banking, she spent 8 years with the Global Banking and Markets business, as the Global Head of the Consumer Group and the Co-Head of UK Banking.
Before joining HSBC in 2007, Ms. Blyth spent 3 years as the Head of Consumer at Deutsche Bank. Previously, she spent 11 years at Dresdner Kleinwort Wasserstein and prior to her move into banking, worked as a solicitor at Stephenson Harwood, focusing on corporate law.
Ms. Blyth holds a BSc in Biochemistry from St Andrew’s University.
Natalie BlythGlobal Head of Trade and Receivables Finance, Global Commercial Banking
25
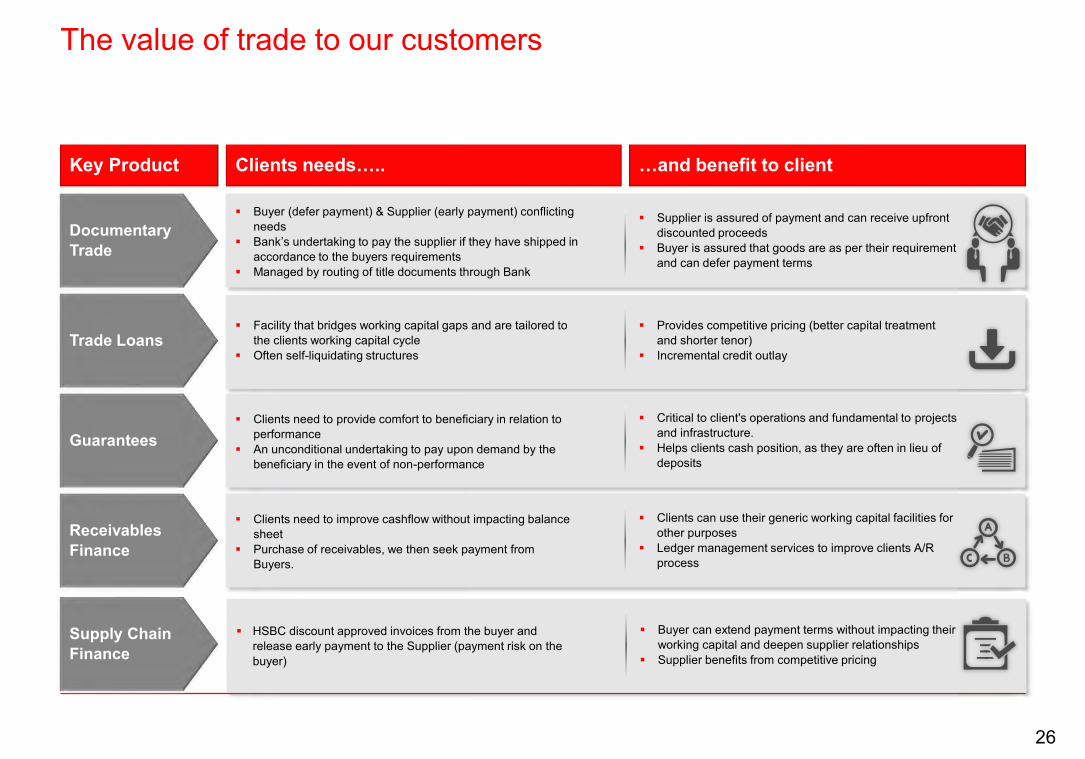
The value of trade to our customers
Key Product Clients needs….. …and benefit to client
Clients need to improve cashflow without impacting balance sheet
Purchase of receivables, we then seek payment from Buyers.
Receivables Finance
Clients can use their generic working capital facilities for other purposes
Ledger management services to improve clients A/R process
Facility that bridges working capital gaps and are tailored to the clients working capital cycle
Often self-liquidating structuresTrade Loans
Provides competitive pricing (better capital treatment and shorter tenor)
Incremental credit outlay
Clients need to provide comfort to beneficiary in relation to performance
An unconditional undertaking to pay upon demand by the beneficiary in the event of non-performance
Guarantees Critical to client's operations and fundamental to projects
and infrastructure. Helps clients cash position, as they are often in lieu of
deposits
Buyer (defer payment) & Supplier (early payment) conflicting needs
Bank’s undertaking to pay the supplier if they have shipped in accordance to the buyers requirements
Managed by routing of title documents through Bank
Documentary Trade
Supplier is assured of payment and can receive upfront discounted proceeds
Buyer is assured that goods are as per their requirement and can defer payment terms
Supply Chain Finance
HSBC discount approved invoices from the buyer and release early payment to the Supplier (payment risk on the buyer)
Buyer can extend payment terms without impacting their working capital and deepen supplier relationships
Supplier benefits from competitive pricing
26
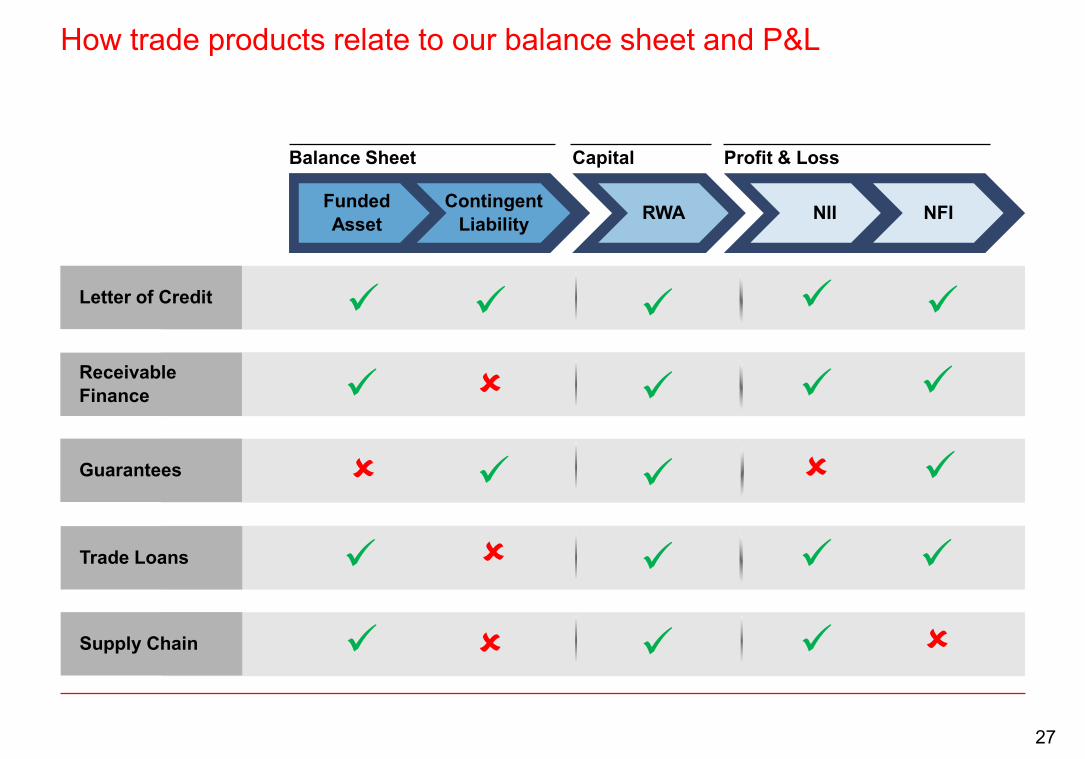
How trade products relate to our balance sheet and P&L
Letter of Credit
Receivable Finance
Guarantees
Trade Loans
Supply Chain
Balance Sheet Capital Profit & Loss
FundedAsset
ContingentLiability RWA NII NFI
27
4
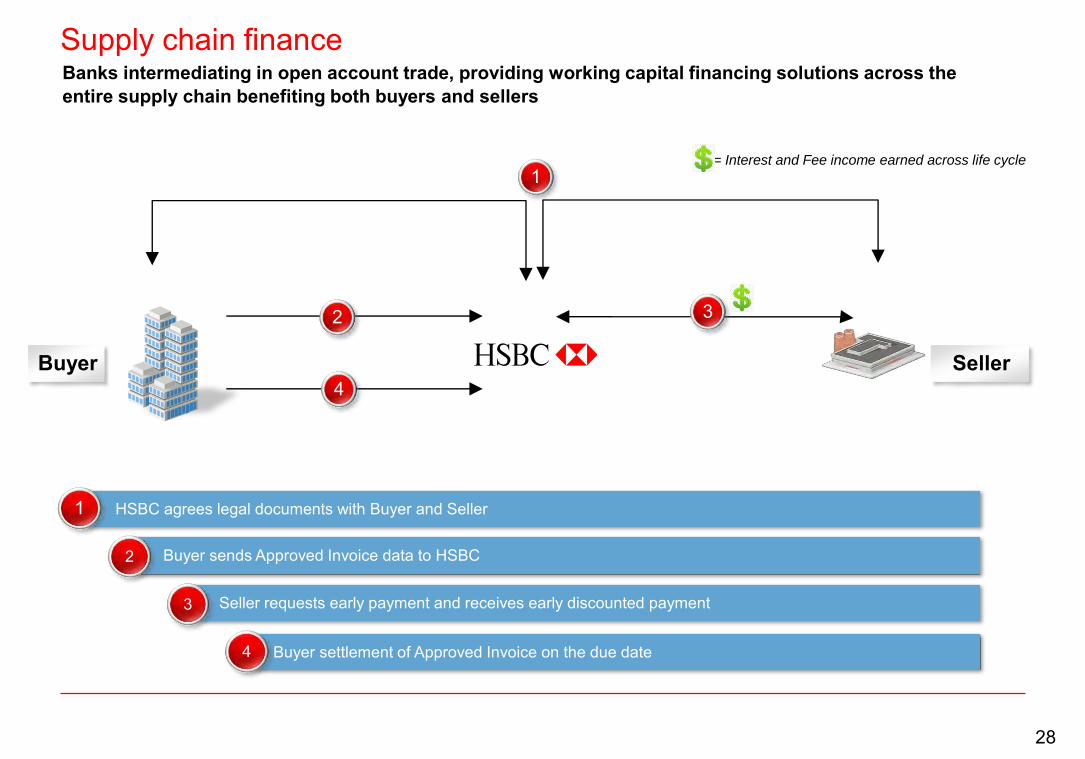
Supply chain finance
Buyer Seller
2
HSBC agrees legal documents with Buyer and Seller1
3
Buyer sends Approved Invoice data to HSBC2
Seller requests early payment and receives early discounted payment3
Buyer settlement of Approved Invoice on the due date4
1= Interest and Fee income earned across life cycle
Banks intermediating in open account trade, providing working capital financing solutions across the entire supply chain benefiting both buyers and sellers
28
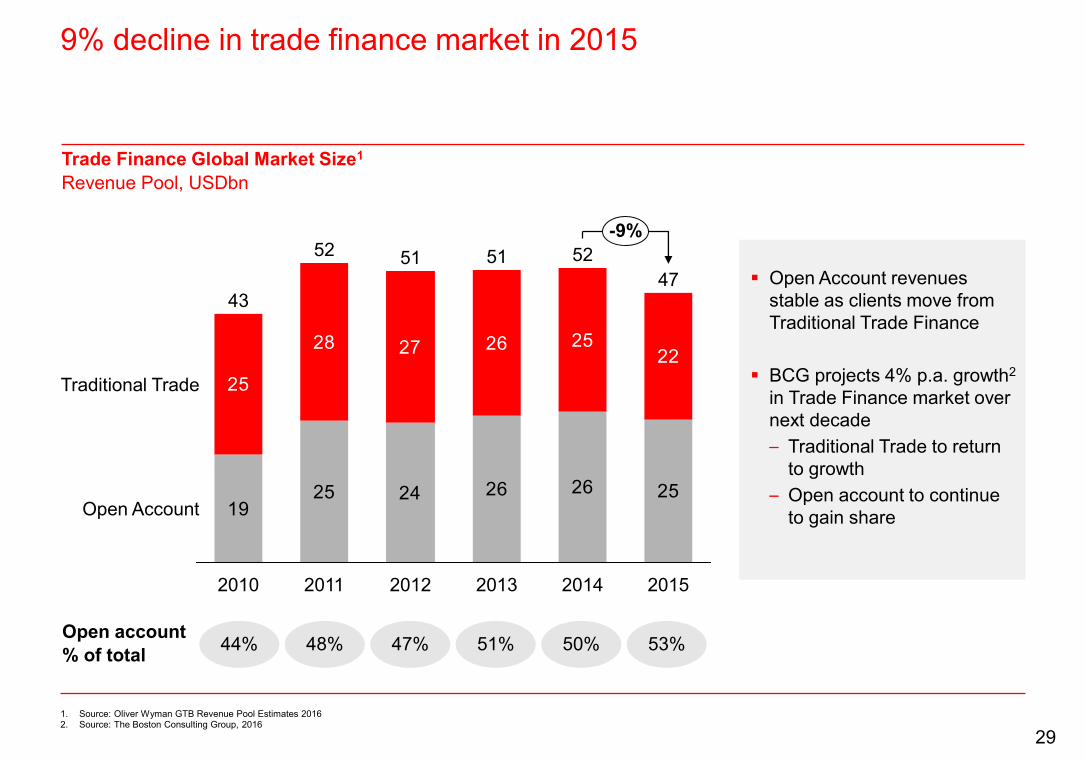
9% decline in trade finance market in 2015
1. Source: Oliver Wyman GTB Revenue Pool Estimates 2016 2. Source: The Boston Consulting Group, 2016
1925 26 26 25
25
28 27 26 2522
24
2014
52
2013
-9%
Open Account
Traditional Trade
2015
4751
2012
51
43
2011
52
2010
Trade Finance Global Market Size1
Revenue Pool, USDbn
Open Account revenues stable as clients move from Traditional Trade Finance
BCG projects 4% p.a. growth2
in Trade Finance market over next decade– Traditional Trade to return
to growth– Open account to continue
to gain share
Open account % of total 44% 48% 47% 51% 50% 53%
29
Singapore4
India3
HSBC has gained market share and remains #1 Trade Bank
1. Source:: Coalition FY16. Peer group: Bank of America Merrill Lynch, Barclays, BNP Paribas, Citi, Deutsche Bank, J.P. Morgan, Standard Charted, Société Générale and Wells Fargo. Coalition results are based upon HSBC’s product taxonomy and includes all Corporate and Institutional clients
2. Source: Oliver Wyman GTB Revenue Pool Estimates 2016 3. Source: Govt. of India (Ministry of Commerce - DGFT), Dec 20164. Source: MAS Monthly Statistical Bulletin, Dec 2016
10.29.99.29.0
2.52.22.3
6.16.05.55.6
0
1
2
3
4
5
6
7
8
9
10
11
2012 2013 2014 2015
Total Trade
Open Account
Traditional Trade
GTRF have shown resilient performance in challenging environmentMarket share1 2012 – 2015, %
Trade Finance
Lending
5%
1%
Trade Finance
13%
Lending
3%
Market share, %
GTRF vs. Lending Market Share
30
Asia leading trade growth going forward, positioning HSBC well
1. 2015 UNCTAD regional trade data, split according to World Bank definitions of regions2. Regional Comprehensive Economic Partnership accord is a mega-regional trade deal covering 16 countries in the Asia-Pacific region
4.4
Intra-Europe
Intra-NAFTA 1.1
Intra-Asia3.3
Europe-Asia
1.7
NAFTA-Europe
0.9
NAFTA-Asia1.4
Area of bubble = Value of bilateral merchandise trade (global total = USD17trn)
Asian leadership in trade RCEP2 to drive liberalisation China’s Belt & Road initiative
Asia-MENA
0.8
Selected Regional Bilateral Trade Corridors, 2015 Merchandise Trade1, USDtrn
31
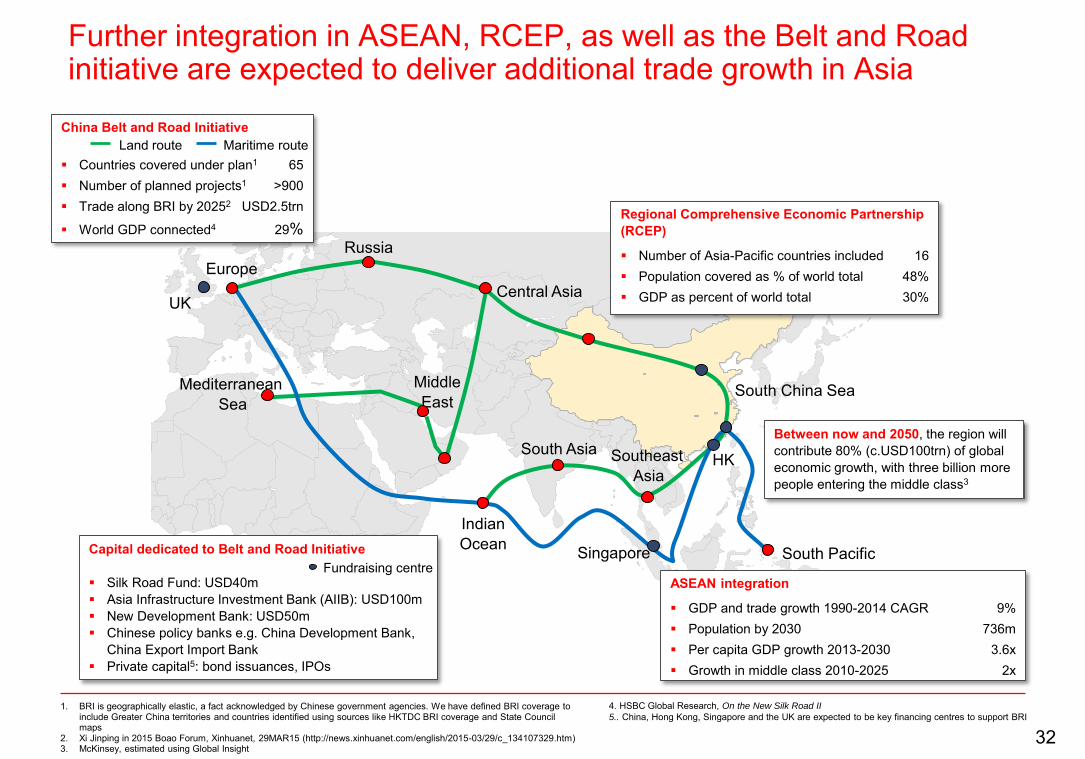
Further integration in ASEAN, RCEP, as well as the Belt and Road initiative are expected to deliver additional trade growth in Asia
1. BRI is geographically elastic, a fact acknowledged by Chinese government agencies. We have defined BRI coverage to include Greater China territories and countries identified using sources like HKTDC BRI coverage and State Council maps
2. Xi Jinping in 2015 Boao Forum, Xinhuanet, 29MAR15 (http://news.xinhuanet.com/english/2015-03/29/c_134107329.htm)3. McKinsey, estimated using Global Insight
RussiaEurope
IndianOcean
South China Sea
Central Asia
China Belt and Road Initiative
Countries covered under plan1 65 Number of planned projects1 >900 Trade along BRI by 20252 USD2.5trn
World GDP connected4 29%
Between now and 2050, the region will contribute 80% (c.USD100trn) of global economic growth, with three billion more people entering the middle class3
South Asia
4. HSBC Global Research, On the New Silk Road II
5.. China, Hong Kong, Singapore and the UK are expected to be key financing centres to support BRI
Land route Maritime route
Mediterranean Sea
SoutheastAsia
MiddleEast
South Pacific
ASEAN integration
GDP and trade growth 1990-2014 CAGR 9% Population by 2030 736m Per capita GDP growth 2013-2030 3.6x Growth in middle class 2010-2025 2x
Regional Comprehensive Economic Partnership(RCEP)
Number of Asia-Pacific countries included 16 Population covered as % of world total 48% GDP as percent of world total 30%UK
HK
Capital dedicated to Belt and Road Initiative
Silk Road Fund: USD40m Asia Infrastructure Investment Bank (AIIB): USD100m New Development Bank: USD50m Chinese policy banks e.g. China Development Bank,
China Export Import Bank Private capital5: bond issuances, IPOs
Fundraising centreSingapore
32
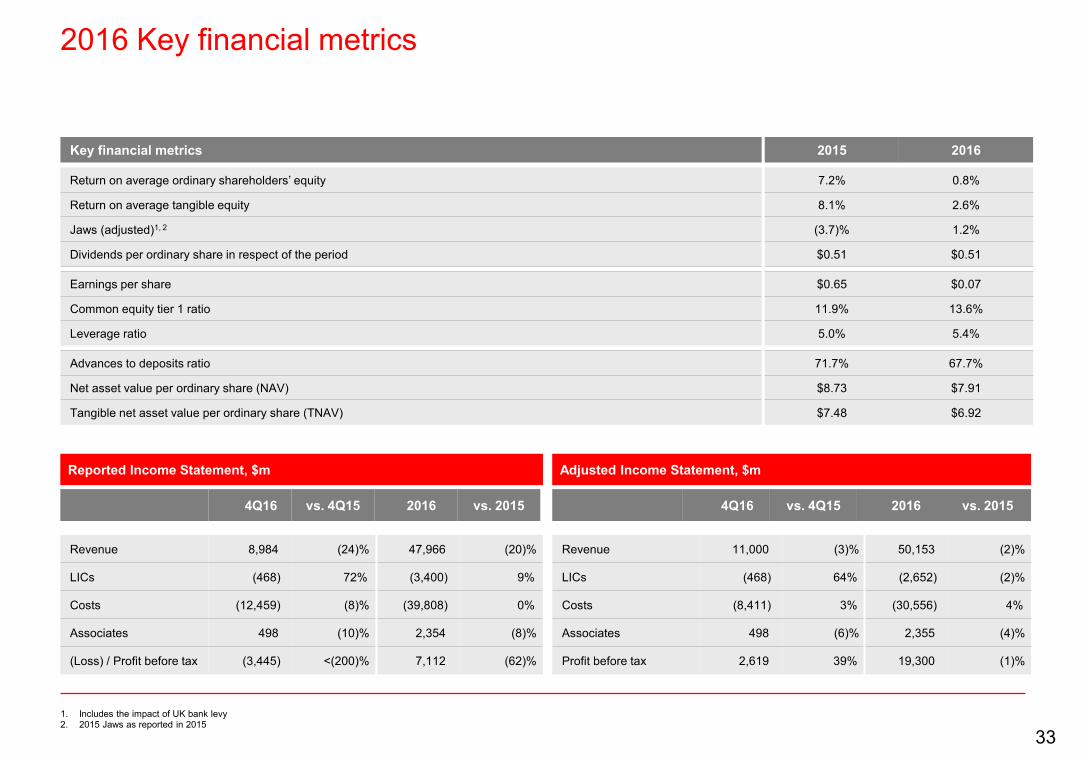
2016 Key financial metrics
1. Includes the impact of UK bank levy2. 2015 Jaws as reported in 2015
Return on average ordinary shareholders’ equity
Return on average tangible equity
Jaws (adjusted)1, 2
Dividends per ordinary share in respect of the period
Key financial metrics
7.2% 0.8%
8.1% 2.6%
(3.7)% 1.2%
$0.51 $0.51
2015 2016
Advances to deposits ratio
Net asset value per ordinary share (NAV)
Tangible net asset value per ordinary share (TNAV)
71.7% 67.7%
$8.73 $7.91
$7.48 $6.92
Earnings per share
Common equity tier 1 ratio
Leverage ratio
$0.65 $0.07
11.9% 13.6%
5.0% 5.4%
Revenue 8,984 (24)% 47,966 (20)%
LICs (468) 72% (3,400) 9%
Costs (12,459) (8)% (39,808) 0%
Associates 498 (10)% 2,354 (8)%
(Loss) / Profit before tax (3,445) <(200)% 7,112 (62)%
Revenue 11,000 (3)% 50,153 (2)%
LICs (468) 64% (2,652) (2)%
Costs (8,411) 3% (30,556) 4%
Associates 498 (6)% 2,355 (4)%
Profit before tax 2,619 39% 19,300 (1)%
Adjusted Income Statement, $m
4Q16 vs. 4Q15 2016 vs. 2015
Reported Income Statement, $m
4Q16 vs. 4Q15 2016 vs. 2015
33
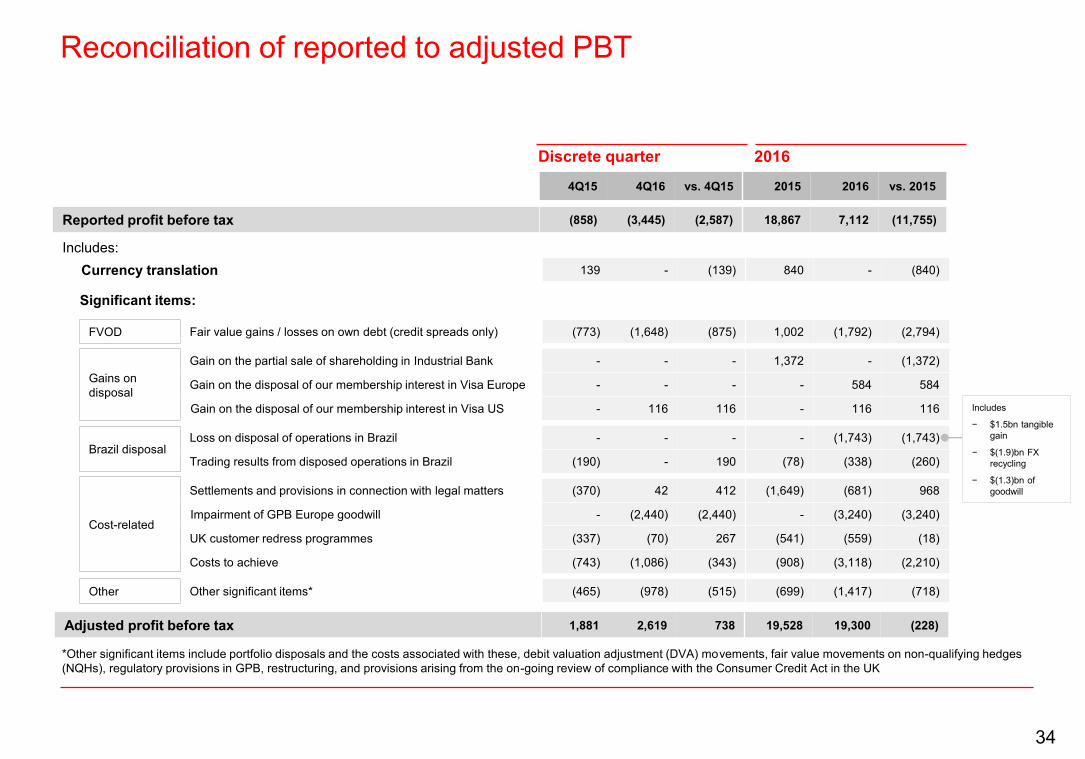
Reconciliation of reported to adjusted PBT
2016Discrete quarter
FVOD
Gains on disposal
Brazil disposal
Cost-related
Other
Loss on disposal of operations in Brazil - - - - (1,743) (1,743)
Trading results from disposed operations in Brazil (190) - 190 (78) (338) (260)
Gain on the partial sale of shareholding in Industrial Bank - - - 1,372 - (1,372)
Gain on the disposal of our membership interest in Visa Europe - - - - 584 584
Gain on the disposal of our membership interest in Visa US - 116 116 - 116 116
Fair value gains / losses on own debt (credit spreads only) (773) (1,648) (875) 1,002 (1,792) (2,794)
Settlements and provisions in connection with legal matters (370) 42 412 (1,649) (681) 968
Impairment of GPB Europe goodwill - (2,440) (2,440) - (3,240) (3,240)
UK customer redress programmes (337) (70) 267 (541) (559) (18)
Costs to achieve (743) (1,086) (343) (908) (3,118) (2,210)
Significant items:
Currency translation 139 - (139) 840 - (840)
Other significant items* (465) (978) (515) (699) (1,417) (718)
Reported profit before tax (858) (3,445) (2,587) 18,867 7,112 (11,755)
Adjusted profit before tax 1,881 2,619 738 19,528 19,300 (228)
Includes:
4Q15 4Q16 vs. 4Q15 2015 2016 vs. 2015
*Other significant items include portfolio disposals and the costs associated with these, debit valuation adjustment (DVA) movements, fair value movements on non-qualifying hedges (NQHs), regulatory provisions in GPB, restructuring, and provisions arising from the on-going review of compliance with the Consumer Credit Act in the UK
Includes
− $1.5bn tangible gain
− $(1.9)bn FX recycling
− $(1.3)bn of goodwill
34

35