Embed Size (px)
Citation preview
© Copyright 2015 Hewlett-Packard Development Company, L.P. The information contained herein is subject to change without notice.
HP Q2 FY15 Earnings AnnouncementMay 21, 2015
http://www.hp.com/investor/home
© Copyright 2015 Hewlett-Packard Development Company, L.P. The information contained herein is subject to change without notice.2
Forward-looking statements
This presentation contains forward-looking statements that involve risks, uncertainties and assumptions. If the risks or uncertainties ever materialize or the assumptionsprove incorrect, the results of HP may differ materially from those expressed or implied by such forward-looking statements and assumptions. All statements other thanstatements of historical fact are statements that could be deemed forward-looking statements, including but not limited to any projections of revenue, margins,expenses, effective tax rates, net earnings, net earnings per share, cash flows, benefit plan funding, share repurchases, currency exchange rates or other financial items;any projections of the amount, timing or impact of cost savings or restructuring charges; any statements of the plans, strategies and objectives of management for futureoperations, including the previously announced separation transaction and the future performances of the post-separation companies if the separation is completed, aswell as the execution of restructuring plans and any resulting cost savings or revenue or profitability improvements; any statements concerning the expecteddevelopment, performance, market share or competitive performance relating to products or services; any statements regarding current or future macroeconomic trendsor events and the impact of those trends and events on HP and its financial performance; any statements regarding pending investigations, claims or disputes; anystatements of expectation or belief; and any statements of assumptions underlying any of the foregoing. Risks, uncertainties and assumptions include the need toaddress the many challenges facing HP’s businesses; the competitive pressures faced by HP’s businesses; risks associated with executing HP’s strategy, including theplanned separation transaction; the impact of macroeconomic and geopolitical trends and events; the need to manage third-party suppliers and the distribution of HP’sproducts and the delivery of HP’s services effectively; the protection of HP’s intellectual property assets, including intellectual property licensed from third parties; risksassociated with HP’s international operations; the development and transition of new products and services and the enhancement of existing products and services tomeet customer needs and respond to emerging technological trends; the execution and performance of contracts by HP and its suppliers, customers and partners; thehiring and retention of key employees; integration and other risks associated with business combination and investment transactions; the execution, timing and results ofthe separation transaction or restructuring plans, including estimates and assumptions related to the cost (including any possible disruption of HP’s business) and theanticipated benefits of implementing the separation transaction and restructuring plans; the resolution of pending investigations, claims and disputes; and other risks thatare described in HP’s Annual Report on Form 10-K for the fiscal year ended October 31, 2014 and HP’s other filings with the Securities and Exchange Commission includingHP’s Quarterly Report on Form 10-Q for the fiscal quarter ended January 31, 2015. As in prior periods, the financial information set forth in this presentation, includingtax-related items, reflects estimates based on information available at this time. While HP believes these estimates to be reasonable, these amounts could differmaterially from reported amounts in HP’s Quarterly Report on Form 10-Q for the fiscal quarter ended April 30, 2015. HP assumes no obligation and does not intend toupdate these forward-looking statements.
© Copyright 2015 Hewlett-Packard Development Company, L.P. The information contained herein is subject to change without notice.3
Use of non-GAAP financial informationHP has included non-GAAP financial measures in this presentation to supplement HP’s consolidated financial statements presented on a GAAP basis. Definitions of these non-GAAP financial measures
and reconciliations of these non-GAAP financial measures to the most directly comparable GAAP financial measures are included elsewhere in this presentation.
HP’s management uses revenue on a constant currency basis, non-GAAP operating expense, non-GAAP operating profit, non-GAAP tax rate, non-GAAP net earnings, and non-GAAP diluted net earnings
per share to evaluate and forecast HP’s performance before gains, losses or other charges that are considered by HP’s management to be outside of HP’s core business segment operating results. Gross
cash, net cash, free cash flow and net capital expenditures are liquidity measures that provide useful information to management about the amount of cash available for investment in HP’s businesses,
funding acquisitions, repurchasing stock and other purposes. Net cash and net debt provide useful information to management about the state of HP’s consolidated balance sheet. Operating company
net cash and operating company net debt provide additional useful information to management about the state of HP’s consolidated balance sheet by providing more transparency into the financial
components of the operating company separate from HP’s financing business, which has different capital structure requirements and requires much greater leverage to run effectively.
These non-GAAP financial measures may have limitations as analytical tools, and these measures should not be considered in isolation or as a substitute for analysis of HP’s results as reported under
GAAP. For example, items such as impairment of goodwill and intangible assets and amortization of intangible assets, though not directly affecting HP’s cash position, represent the loss in value of
intangible assets over time. The expense associated with this loss in value is not included in non-GAAP operating profit, non-GAAP tax rate, non-GAAP net earnings, and non-GAAP diluted net earnings
per share and therefore does not reflect the full economic effect of the loss in value of those intangible assets. In addition, items such as restructuring charges and separation costs that are excluded
from non-GAAP operating expense, non-GAAP operating profit, non-GAAP tax rate, non-GAAP net earnings and non-GAAP diluted net earnings per share can have a material impact on the equivalent
GAAP earnings measure and cash flow. HP may not be able to liquidate the short-term and long-term investments included in gross cash immediately, which may limit the usefulness of gross cash as a
liquidity measure. In addition, free cash flow, which includes net capital expenditures, does not represent the total increase or decrease in cash for the period. The non-GAAP financial information that
we provide also may differ from the non-GAAP information provided by other companies.
We compensate for the limitations on our use of these non-GAAP financial measures by relying primarily on our GAAP financial statements and using non-GAAP financial measures only supplementally.
We also provide robust and detailed reconciliations of each non-GAAP financial measure to the most directly comparable GAAP measure, and we encourage investors to review carefully those
reconciliations.
We believe that providing these non-GAAP financial measures in addition to the related GAAP measures provides investors with greater transparency to the information used by HP’s management in its
financial and operational decision-making and allows investors to see HP’s results “through the eyes” of management. We further believe that providing this information better enables investors to
understand HP’s operating performance and financial condition and to evaluate the efficacy of the methodology and information used by management to evaluate and measure such performance and
financial condition.
© Copyright 2015 Hewlett-Packard Development Company, L.P. The information contained herein is subject to change without notice.4
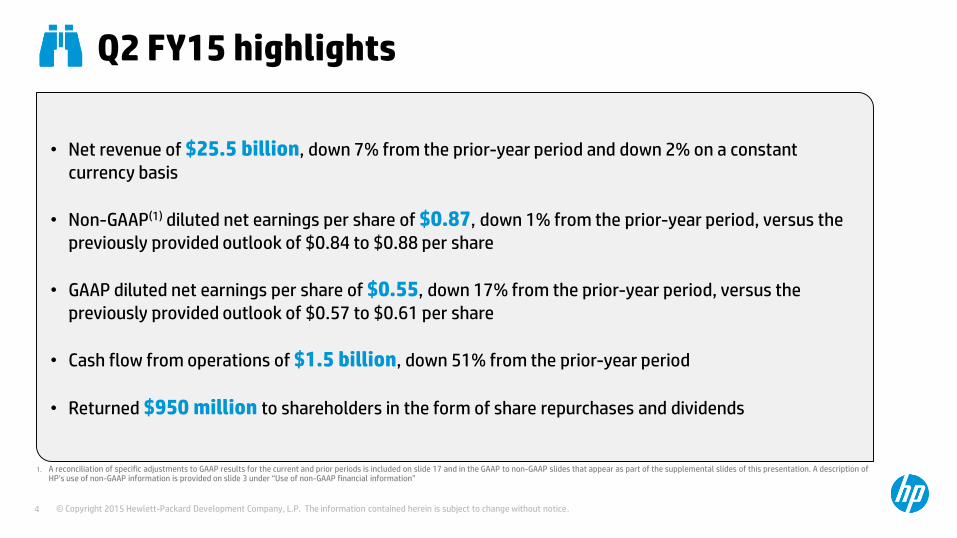
Q2 FY15 highlights
• Net revenue of $25.5 billion, down 7% from the prior-year period and down 2% on a constant currency basis
• Non-GAAP(1) diluted net earnings per share of $0.87, down 1% from the prior-year period, versus the previously provided outlook of $0.84 to $0.88 per share
• GAAP diluted net earnings per share of $0.55, down 17% from the prior-year period, versus the previously provided outlook of $0.57 to $0.61 per share
• Cash flow from operations of $1.5 billion, down 51% from the prior-year period
• Returned $950 million to shareholders in the form of share repurchases and dividends
1. A reconciliation of specific adjustments to GAAP results for the current and prior periods is included on slide 17 and in the GAAP to non-GAAP slides that appear as part of the supplemental slides of this presentation. A description of HP’s use of non-GAAP information is provided on slide 3 under “Use of non-GAAP financial information”
© Copyright 2015 Hewlett-Packard Development Company, L.P. The information contained herein is subject to change without notice.5
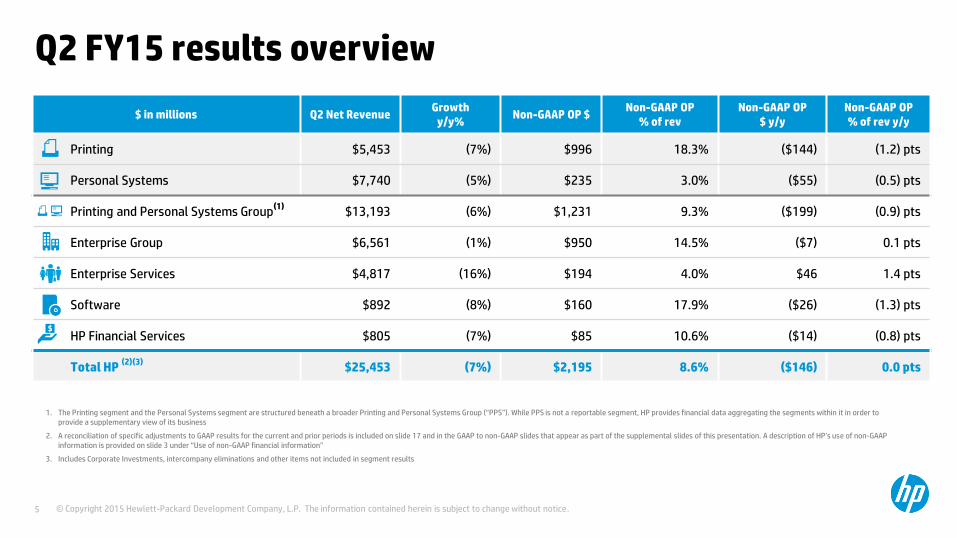
1. The Printing segment and the Personal Systems segment are structured beneath a broader Printing and Personal Systems Group (“PPS”). While PPS is not a reportable segment, HP provides financial data aggregating the segments within it in order to provide a supplementary view of its business
2. A reconciliation of specific adjustments to GAAP results for the current and prior periods is included on slide 17 and in the GAAP to non-GAAP slides that appear as part of the supplemental slides of this presentation. A description of HP’s use of non-GAAP information is provided on slide 3 under “Use of non-GAAP financial information”
3. Includes Corporate Investments, intercompany eliminations and other items not included in segment results
Q2 FY15 results overview
$ in millions Q2 Net RevenueGrowth
y/y%Non-GAAP OP $
Non-GAAP OP % of rev
Non-GAAP OP $ y/y
Non-GAAP OP% of rev y/y
Printing $5,453 (7%) $996 18.3% ($144) (1.2) pts
Personal Systems $7,740 (5%) $235 3.0% ($55) (0.5) pts
Printing and Personal Systems Group(1)
$13,193 (6%) $1,231 9.3% ($199) (0.9) pts
Enterprise Group $6,561 (1%) $950 14.5% ($7) 0.1 pts
Enterprise Services $4,817 (16%) $194 4.0% $46 1.4 pts
Software $892 (8%) $160 17.9% ($26) (1.3) pts
HP Financial Services $805 (7%) $85 10.6% ($14) (0.8) pts
Total HP (2)(3)
$25,453 (7%) $2,195 8.6% ($146) 0.0 pts
© Copyright 2015 Hewlett-Packard Development Company, L.P. The information contained herein is subject to change without notice.6
$(59)
$950
$194
$160
$235
$996
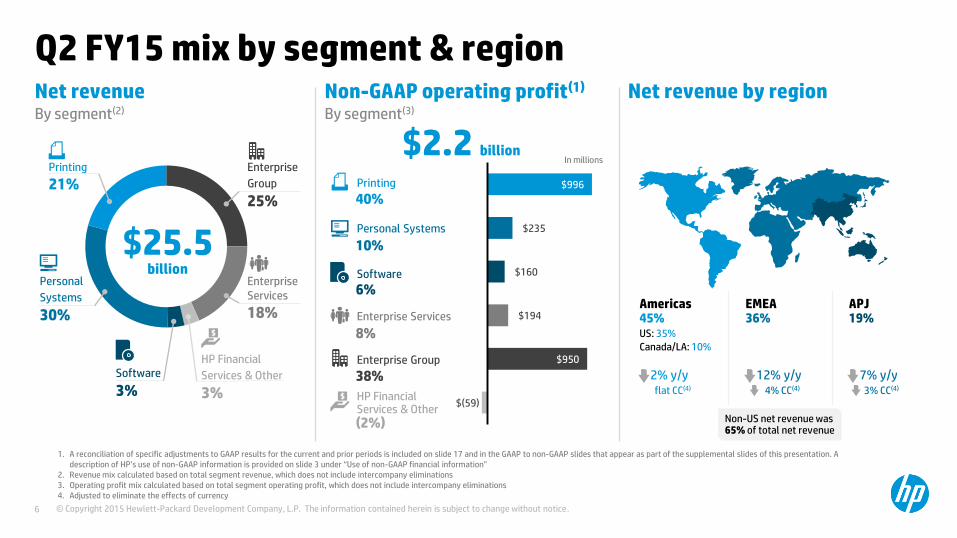
Q2 FY15 mix by segment & regionNet revenue Net revenue by regionNon-GAAP operating profit(1)
$2.2 billion
$25.5billion
APJ 19%
7% y/y3% CC(4)
EMEA36%
12% y/y4% CC(4)
Americas45%US: 35%
Canada/LA: 10%
2% y/yflat CC(4)
Enterprise Services
18%
Enterprise
Group
25%
HP Financial
Services & Other
3%
Printing
21%
Personal
Systems
30%
Software
3%
1. A reconciliation of specific adjustments to GAAP results for the current and prior periods is included on slide 17 and in the GAAP to non-GAAP slides that appear as part of the supplemental slides of this presentation. A description of HP’s use of non-GAAP information is provided on slide 3 under “Use of non-GAAP financial information”
2. Revenue mix calculated based on total segment revenue, which does not include intercompany eliminations3. Operating profit mix calculated based on total segment operating profit, which does not include intercompany eliminations4. Adjusted to eliminate the effects of currency
By segment(3)By segment(2)
Enterprise Group
Printing
Personal Systems
Enterprise Services
Software
HP Financial Services & Other(2%)
40%
10%
6%
8%
38%
In millions
Non-US net revenue was 65% of total net revenue
© Copyright 2015 Hewlett-Packard Development Company, L.P. The information contained herein is subject to change without notice.7
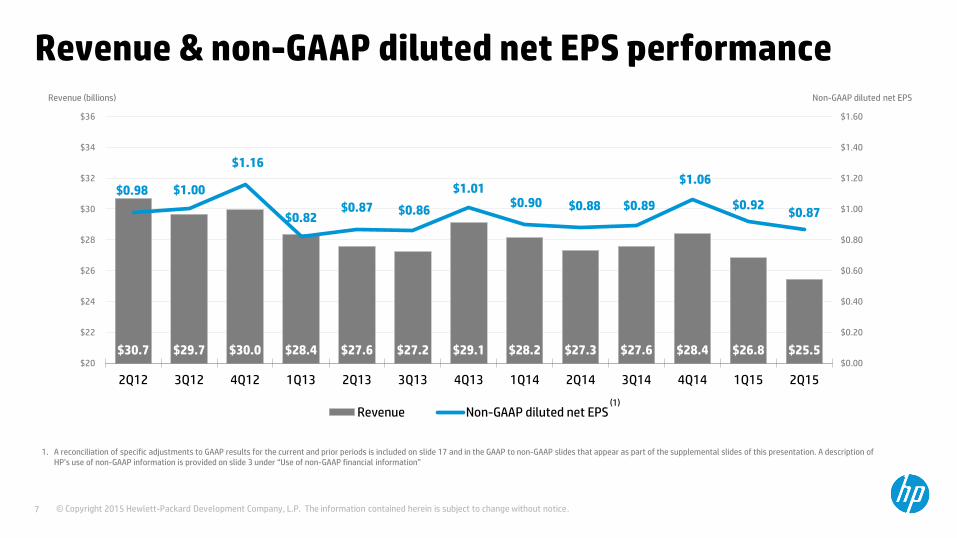
Revenue & non-GAAP diluted net EPS performance
1. A reconciliation of specific adjustments to GAAP results for the current and prior periods is included on slide 17 and in the GAAP to non-GAAP slides that appear as part of the supplemental slides of this presentation. A description of HP’s use of non-GAAP information is provided on slide 3 under “Use of non-GAAP financial information”
Non-GAAP diluted net EPS Revenue (billions)
$30.7 $29.7 $30.0 $28.4 $27.6 $27.2 $29.1 $28.2 $27.3 $27.6 $28.4 $26.8 $25.5
$0.98 $1.00
$1.16
$0.82 $0.87 $0.86
$1.01 $0.90 $0.88 $0.89
$1.06
$0.92 $0.87
$0.00
$0.20
$0.40
$0.60
$0.80
$1.00
$1.20
$1.40
$1.60
$20
$22
$24
$26
$28
$30
$32
$34
$36
2Q12 3Q12 4Q12 1Q13 2Q13 3Q13 4Q13 1Q14 2Q14 3Q14 4Q14 1Q15 2Q15
Revenue Non-GAAP diluted net EPS(1)
© Copyright 2015 Hewlett-Packard Development Company, L.P. The information contained herein is subject to change without notice.8
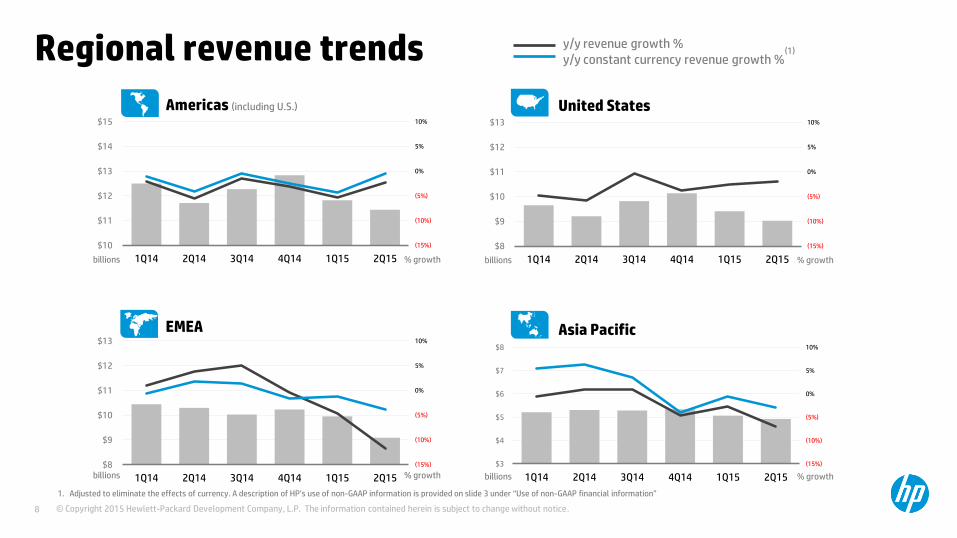
Regional revenue trends y/y revenue growth %y/y constant currency revenue growth %
(15%)
(10%)
(5%)
0%
5%
10%
$3
$4
$5
$6
$7
$8
1Q14 2Q14 3Q14 4Q14 1Q15 2Q15
Americas (including U.S.)
billions % growth
(15%)
(10%)
(5%)
0%
5%
10%
$10
$11
$12
$13
$14
$15
1Q14 2Q14 3Q14 4Q14 1Q15 2Q15
(15%)
(10%)
(5%)
0%
5%
10%
$8
$9
$10
$11
$12
$13
1Q14 2Q14 3Q14 4Q14 1Q15 2Q15
United States
billions % growth
EMEA
(15%)
(10%)
(5%)
0%
5%
10%
$8
$9
$10
$11
$12
$13
1Q14 2Q14 3Q14 4Q14 1Q15 2Q15billions % growth
Asia Pacific
billions % growth
1. Adjusted to eliminate the effects of currency. A description of HP’s use of non-GAAP information is provided on slide 3 under “Use of non-GAAP financial information”
(1)
© Copyright 2015 Hewlett-Packard Development Company, L.P. The information contained herein is subject to change without notice.9
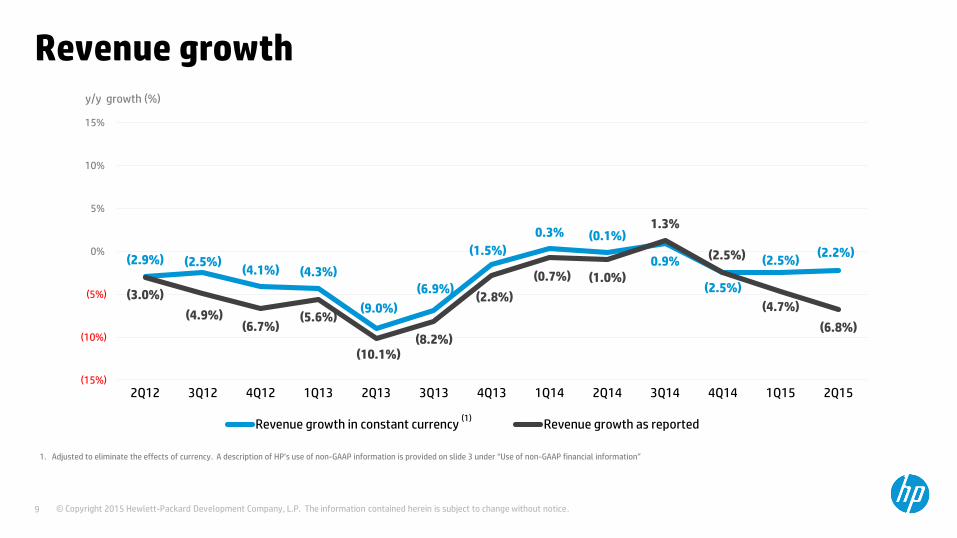
Revenue growth
1. Adjusted to eliminate the effects of currency. A description of HP’s use of non-GAAP information is provided on slide 3 under “Use of non-GAAP financial information”
(2.9%) (2.5%)(4.1%) (4.3%)
(9.0%)
(6.9%)
(1.5%)
0.3% (0.1%)
0.9%
(2.5%)
(2.5%)(2.2%)
(3.0%)
(4.9%)(6.7%)
(5.6%)
(10.1%)(8.2%)
(2.8%)
(0.7%) (1.0%)
1.3%
(2.5%)
(4.7%)
(6.8%)
(15%)
(10%)
(5%)
0%
5%
10%
15%
2Q12 3Q12 4Q12 1Q13 2Q13 3Q13 4Q13 1Q14 2Q14 3Q14 4Q14 1Q15 2Q15
Revenue growth in constant currency Revenue growth as reported
y/y growth (%)
(1)
© Copyright 2015 Hewlett-Packard Development Company, L.P. The information contained herein is subject to change without notice.10
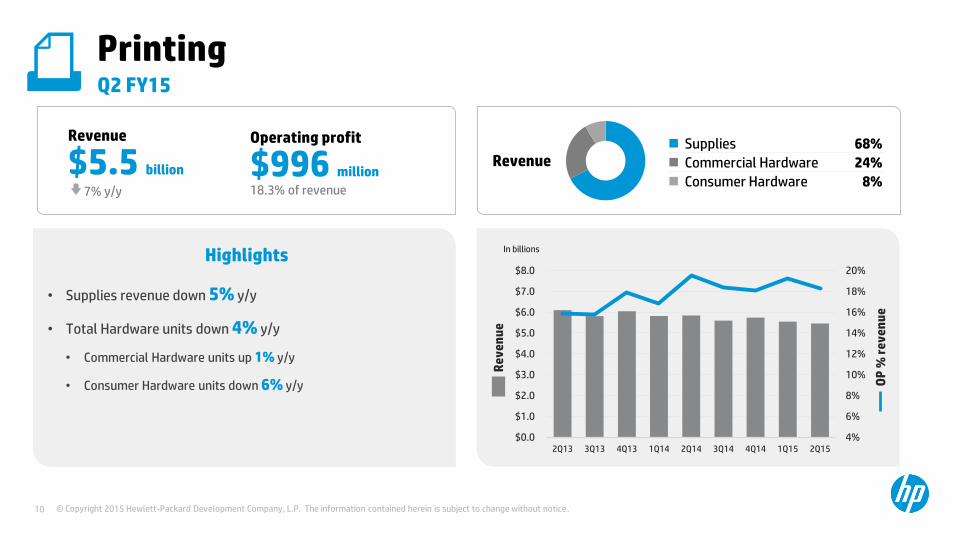
Supplies 68%
Commercial Hardware 24%
Consumer Hardware 8%
Printing
Operating profit
$996 million
18.3% of revenue
Revenue
$5.5 billion
7% y/y
Revenue
Highlights
• Supplies revenue down 5% y/y
• Total Hardware units down 4% y/y
• Commercial Hardware units up 1% y/y
• Consumer Hardware units down 6% y/y
In billions
OP
% r
ev
en
ue
4%
6%
8%
10%
12%
14%
16%
18%
20%
$0.0
$1.0
$2.0
$3.0
$4.0
$5.0
$6.0
$7.0
$8.0
2Q13 3Q13 4Q13 1Q14 2Q14 3Q14 4Q14 1Q15 2Q15
Re
ve
nu
e
Q2 FY15
© Copyright 2015 Hewlett-Packard Development Company, L.P. The information contained herein is subject to change without notice.11
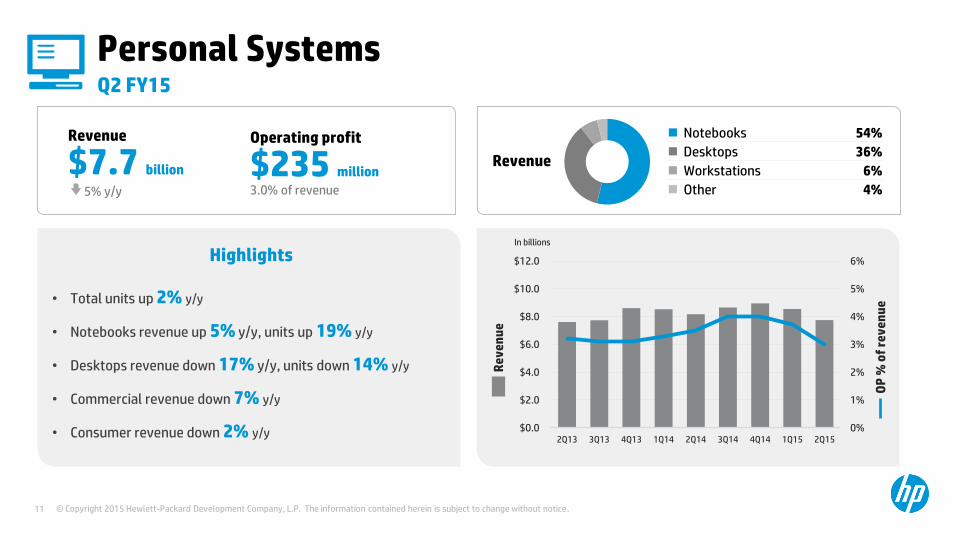
Personal Systems
Operating profit
$235 million
3.0% of revenue
Revenue
$7.7 billion
5% y/y
Notebooks 54%
Desktops 36%
Workstations 6%
Other 4%
Revenue
Highlights
• Total units up 2% y/y
• Notebooks revenue up 5% y/y, units up 19% y/y
• Desktops revenue down 17% y/y, units down 14% y/y
• Commercial revenue down 7% y/y
• Consumer revenue down 2% y/y 0%
1%
2%
3%
4%
5%
6%
$0.0
$2.0
$4.0
$6.0
$8.0
$10.0
$12.0
2Q13 3Q13 4Q13 1Q14 2Q14 3Q14 4Q14 1Q15 2Q15
In billions
OP
% o
f re
ve
nu
e
Re
ve
nu
e
Q2 FY15
© Copyright 2015 Hewlett-Packard Development Company, L.P. The information contained herein is subject to change without notice.12
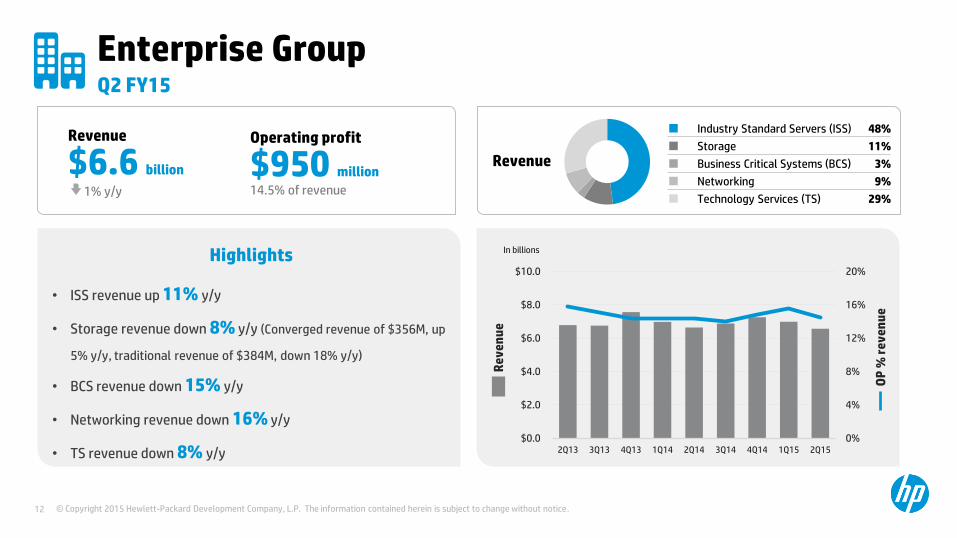
Enterprise Group
Operating profit
$950 million
14.5% of revenue
Revenue
$6.6 billion
1% y/y
Revenue
Highlights
• ISS revenue up 11% y/y
• Storage revenue down 8% y/y (Converged revenue of $356M, up
5% y/y, traditional revenue of $384M, down 18% y/y)
• BCS revenue down 15% y/y
• Networking revenue down 16% y/y
• TS revenue down 8% y/y
Industry Standard Servers (ISS) 48%
Storage 11%
Business Critical Systems (BCS) 3%
Networking 9%
Technology Services (TS) 29%
In billions
OP
% r
ev
en
ue
0%
4%
8%
12%
16%
20%
$0.0
$2.0
$4.0
$6.0
$8.0
$10.0
2Q13 3Q13 4Q13 1Q14 2Q14 3Q14 4Q14 1Q15 2Q15
Re
ve
nu
e
Q2 FY15
© Copyright 2015 Hewlett-Packard Development Company, L.P. The information contained herein is subject to change without notice.13
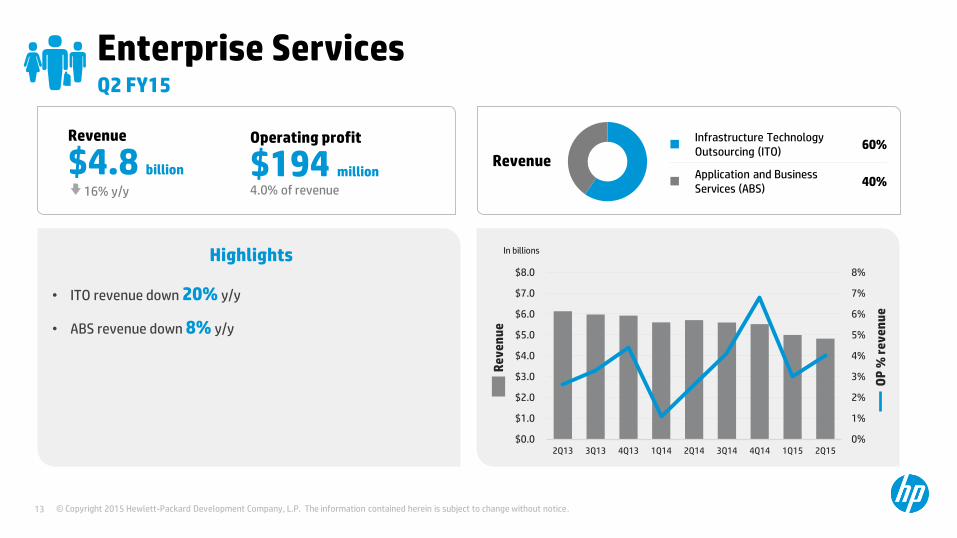
Infrastructure Technology Outsourcing (ITO)
60%
Application and Business Services (ABS)
40%
Enterprise Services
Operating profit
$194 million
4.0% of revenue
Revenue
$4.8 billion
16% y/y
Revenue
Highlights
• ITO revenue down 20% y/y
• ABS revenue down 8% y/y
In billions
OP
% r
ev
en
ue
0%
1%
2%
3%
4%
5%
6%
7%
8%
$0.0
$1.0
$2.0
$3.0
$4.0
$5.0
$6.0
$7.0
$8.0
2Q13 3Q13 4Q13 1Q14 2Q14 3Q14 4Q14 1Q15 2Q15
Re
ve
nu
e
Q2 FY15
© Copyright 2015 Hewlett-Packard Development Company, L.P. The information contained herein is subject to change without notice.14
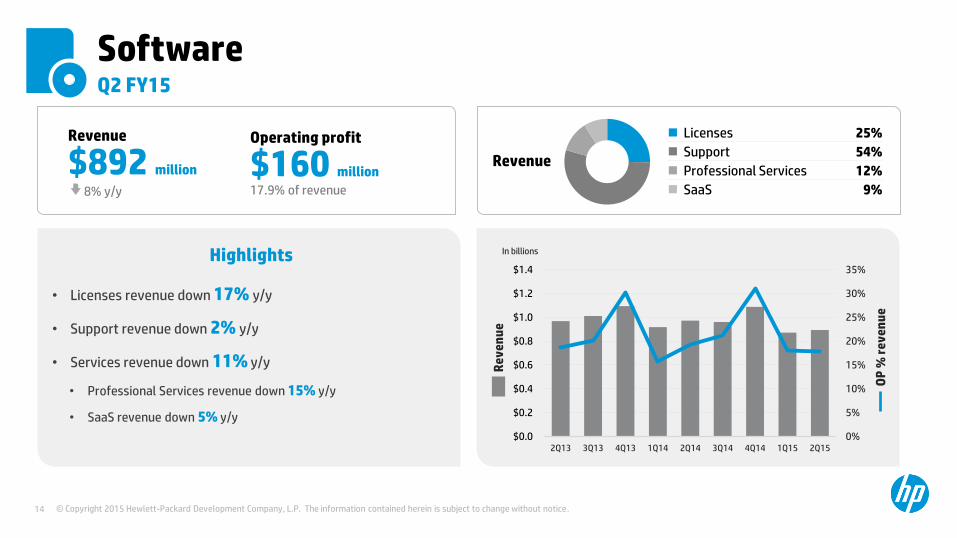
Software
Operating profit
$160 million
17.9% of revenue
Revenue
$892 million
8% y/y
Revenue
Highlights
• Licenses revenue down 17% y/y
• Support revenue down 2% y/y
• Services revenue down 11% y/y
• Professional Services revenue down 15% y/y
• SaaS revenue down 5% y/y
In billions
OP
% r
ev
en
ue
0%
5%
10%
15%
20%
25%
30%
35%
$0.0
$0.2
$0.4
$0.6
$0.8
$1.0
$1.2
$1.4
2Q13 3Q13 4Q13 1Q14 2Q14 3Q14 4Q14 1Q15 2Q15
Re
ve
nu
e
Q2 FY15
Licenses 25%
Support 54%
Professional Services 12%
SaaS 9%
© Copyright 2015 Hewlett-Packard Development Company, L.P. The information contained herein is subject to change without notice.15
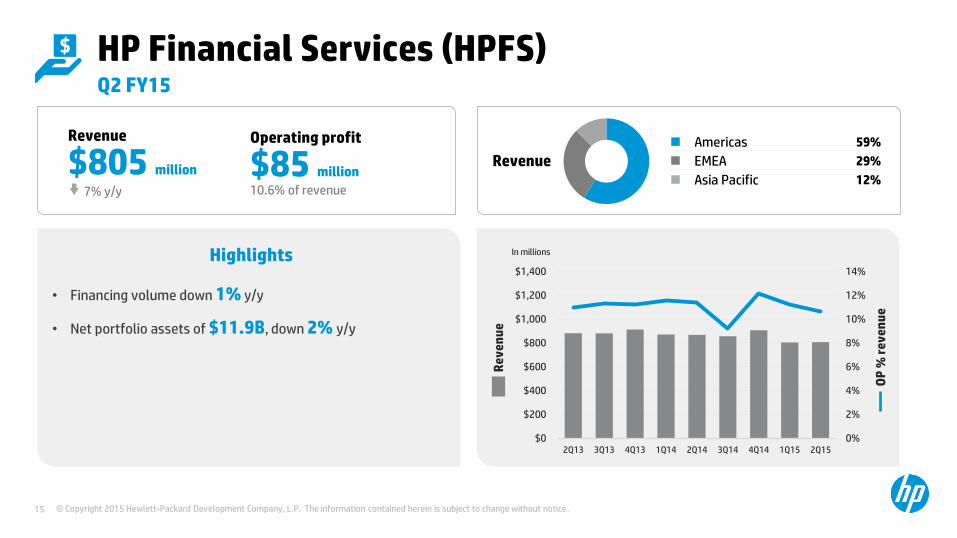
Americas 59%
EMEA 29%
Asia Pacific 12%
HP Financial Services (HPFS)
Operating profit
$85 million
10.6% of revenue
Revenue
$805 million
7% y/y
Revenue
Highlights
• Financing volume down 1% y/y
• Net portfolio assets of $11.9B, down 2% y/y
In millions
OP
% r
ev
en
ue
0%
2%
4%
6%
8%
10%
12%
14%
$0
$200
$400
$600
$800
$1,000
$1,200
$1,400
2Q13 3Q13 4Q13 1Q14 2Q14 3Q14 4Q14 1Q15 2Q15
Re
ve
nu
e
Q2 FY15
© Copyright 2015 Hewlett-Packard Development Company, L.P. The information contained herein is subject to change without notice.16
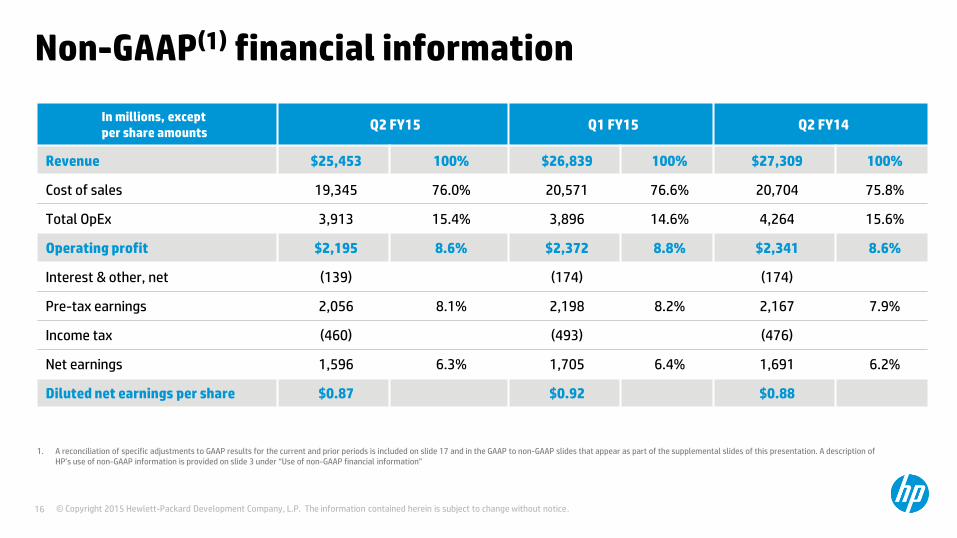
Non-GAAP(1) financial information
In millions, exceptper share amounts
Q2 FY15 Q1 FY15 Q2 FY14
Revenue $25,453 100% $26,839 100% $27,309 100%
Cost of sales 19,345 76.0% 20,571 76.6% 20,704 75.8%
Total OpEx 3,913 15.4% 3,896 14.6% 4,264 15.6%
Operating profit $2,195 8.6% $2,372 8.8% $2,341 8.6%
Interest & other, net (139) (174) (174)
Pre-tax earnings 2,056 8.1% 2,198 8.2% 2,167 7.9%
Income tax (460) (493) (476)
Net earnings 1,596 6.3% 1,705 6.4% 1,691 6.2%
Diluted net earnings per share $0.87 $0.92 $0.88
1. A reconciliation of specific adjustments to GAAP results for the current and prior periods is included on slide 17 and in the GAAP to non-GAAP slides that appear as part of the supplemental slides of this presentation. A description of HP’s use of non-GAAP information is provided on slide 3 under “Use of non-GAAP financial information”
© Copyright 2015 Hewlett-Packard Development Company, L.P. The information contained herein is subject to change without notice.17
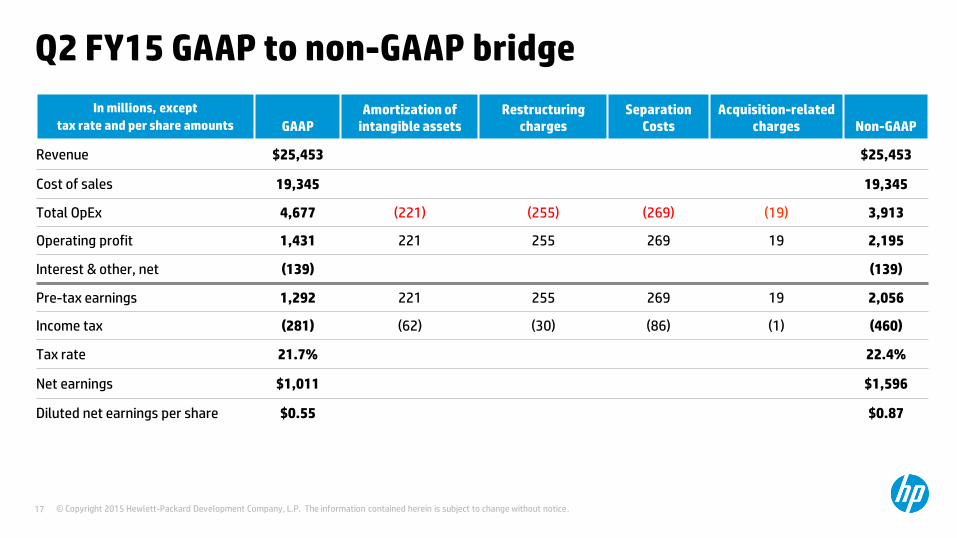
Q2 FY15 GAAP to non-GAAP bridge
In millions, except
tax rate and per share amounts GAAPAmortization of
intangible assetsRestructuring
chargesSeparation
CostsAcquisition-related
charges Non-GAAP
Revenue $25,453 $25,453
Cost of sales 19,345 19,345
Total OpEx 4,677 (221) (255) (269) (19) 3,913
Operating profit 1,431 221 255 269 19 2,195
Interest & other, net (139) (139)
Pre-tax earnings 1,292 221 255 269 19 2,056
Income tax (281) (62) (30) (86) (1) (460)
Tax rate 21.7% 22.4%
Net earnings $1,011 $1,596
Diluted net earnings per share $0.55 $0.87
© Copyright 2015 Hewlett-Packard Development Company, L.P. The information contained herein is subject to change without notice.18
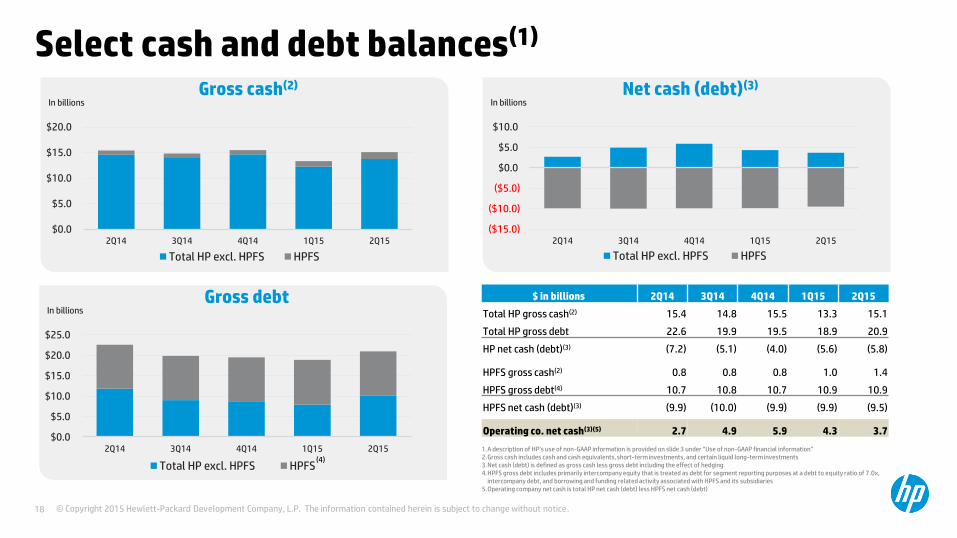
Select cash and debt balances(1)
1.A description of HP’s use of non-GAAP information is provided on slide 3 under “Use of non-GAAP financial information”2.Gross cash includes cash and cash equivalents, short-term investments, and certain liquid long-term investments3.Net cash (debt) is defined as gross cash less gross debt including the effect of hedging4.HPFS gross debt includes primarily intercompany equity that is treated as debt for segment reporting purposes at a debt to equity ratio of 7.0x,
intercompany debt, and borrowing and funding related activity associated with HPFS and its subsidiaries5.Operating company net cash is total HP net cash (debt) less HPFS net cash (debt)
$ in billions 2Q14 3Q14 4Q14 1Q15 2Q15
Total HP gross cash(2) 15.4 14.8 15.5 13.3 15.1
Total HP gross debt 22.6 19.9 19.5 18.9 20.9
HP net cash (debt)(3) (7.2) (5.1) (4.0) (5.6) (5.8)
HPFS gross cash(2) 0.8 0.8 0.8 1.0 1.4
HPFS gross debt(4) 10.7 10.8 10.7 10.9 10.9
HPFS net cash (debt)(3) (9.9) (10.0) (9.9) (9.9) (9.5)
Operating co. net cash(3)(5) 2.7 4.9 5.9 4.3 3.7
In billionsGross debt
$0.0
$5.0
$10.0
$15.0
$20.0
$25.0
2Q14 3Q14 4Q14 1Q15 2Q15
Total HP excl. HPFS HPFS
In billionsNet cash (debt)(3)
($15.0)
($10.0)
($5.0)
$0.0
$5.0
$10.0
2Q14 3Q14 4Q14 1Q15 2Q15
Total HP excl. HPFS HPFS
In billionsGross cash(2)
$0.0
$5.0
$10.0
$15.0
$20.0
2Q14 3Q14 4Q14 1Q15 2Q15
Total HP excl. HPFS HPFS
(4)
© Copyright 2015 Hewlett-Packard Development Company, L.P. The information contained herein is subject to change without notice.19
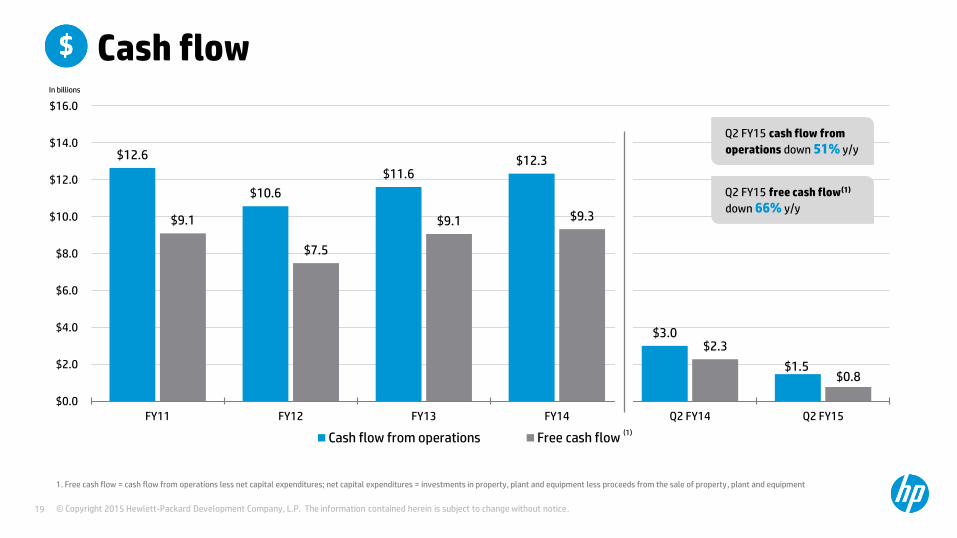
Cash flow
$12.6
$10.6
$11.6 $12.3
$3.0
$1.5
$9.1
$7.5
$9.1 $9.3
$2.3
$0.8
$0.0
$2.0
$4.0
$6.0
$8.0
$10.0
$12.0
$14.0
$16.0
FY11 FY12 FY13 FY14 Q2 FY14 Q2 FY15
Cash flow from operations Free cash flow
In billions
1. Free cash flow = cash flow from operations less net capital expenditures; net capital expenditures = investments in property, plant and equipment less proceeds from the sale of property, plant and equipment
(1)
Q2 FY15 cash flow from
operations down 51% y/y
Q2 FY15 free cash flow(1)
down 66% y/y
© Copyright 2015 Hewlett-Packard Development Company, L.P. The information contained herein is subject to change without notice.20
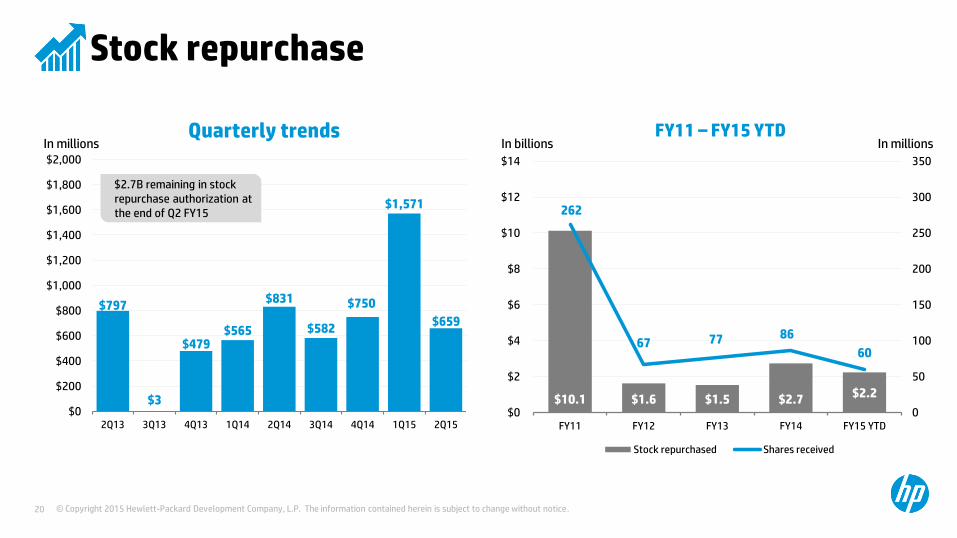
Stock repurchase
$10.1 $1.6 $1.5 $2.7 $2.2
262
67 77 86
60
0
50
100
150
200
250
300
350
$0
$2
$4
$6
$8
$10
$12
$14
FY11 FY12 FY13 FY14 FY15 YTD
Stock repurchased Shares received
In billionsFY11 – FY15 YTD
$797
$3
$479$565
$831
$582
$750
$1,571
$659
$0
$200
$400
$600
$800
$1,000
$1,200
$1,400
$1,600
$1,800
$2,000
2Q13 3Q13 4Q13 1Q14 2Q14 3Q14 4Q14 1Q15 2Q15
In millionsQuarterly trends
$2.7B remaining in stock repurchase authorization at the end of Q2 FY15
In millions
© Copyright 2015 Hewlett-Packard Development Company, L.P. The information contained herein is subject to change without notice.21
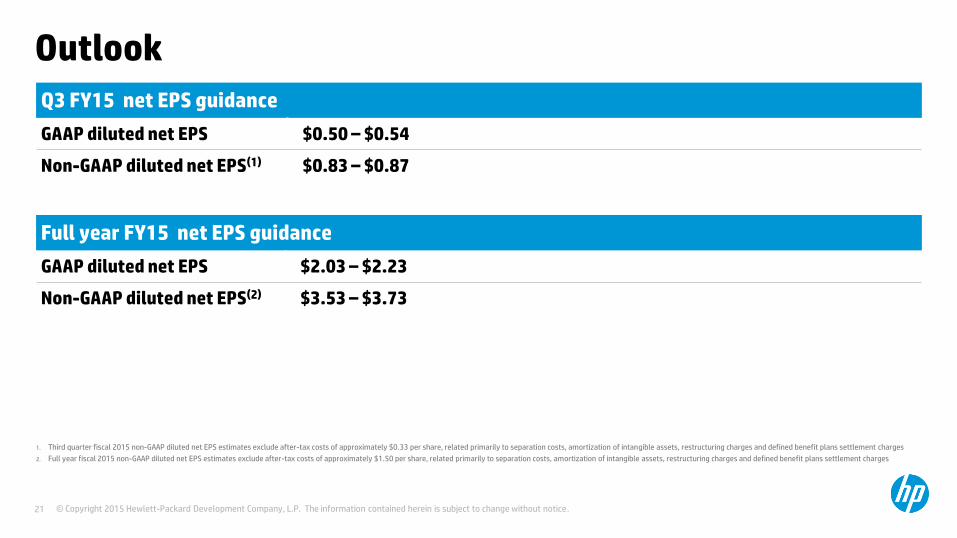
Outlook
Q3 FY15 net EPS guidance
GAAP diluted net EPS $0.50 – $0.54
Non-GAAP diluted net EPS(1) $0.83 – $0.87
1. Third quarter fiscal 2015 non-GAAP diluted net EPS estimates exclude after-tax costs of approximately $0.33 per share, related primarily to separation costs, amortization of intangible assets, restructuring charges and defined benefit plans settlement charges
2. Full year fiscal 2015 non-GAAP diluted net EPS estimates exclude after-tax costs of approximately $1.50 per share, related primarily to separation costs, amortization of intangible assets, restructuring charges and defined benefit plans settlement charges
Full year FY15 net EPS guidance
GAAP diluted net EPS $2.03 – $2.23
Non-GAAP diluted net EPS(2) $3.53 – $3.73
© Copyright 2015 Hewlett-Packard Development Company, L.P. The information contained herein is subject to change without notice.
Supplemental slides
© Copyright 2015 Hewlett-Packard Development Company, L.P. The information contained herein is subject to change without notice.23 © Copyright 2015 Hewlett-Packard Development Company, L.P. The information contained herein is subject to change without notice.
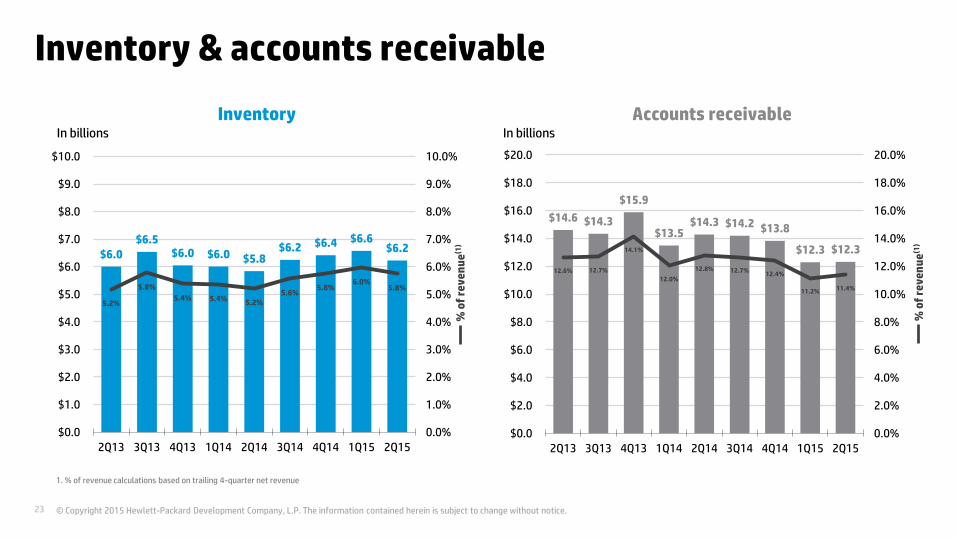
Inventory & accounts receivable
$6.0 $6.5
$6.0 $6.0 $5.8 $6.2 $6.4 $6.6
$6.2
5.2%
5.8%
5.4% 5.4% 5.2%5.6%
5.8%6.0%
5.8%
0.0%
1.0%
2.0%
3.0%
4.0%
5.0%
6.0%
7.0%
8.0%
9.0%
10.0%
$0.0
$1.0
$2.0
$3.0
$4.0
$5.0
$6.0
$7.0
$8.0
$9.0
$10.0
2Q13 3Q13 4Q13 1Q14 2Q14 3Q14 4Q14 1Q15 2Q15
$14.6 $14.3
$15.9
$13.5 $14.3 $14.2 $13.8
$12.3 $12.3
12.6% 12.7%
14.1%
12.0%
12.8% 12.7%12.4%
11.2% 11.4%
0.0%
2.0%
4.0%
6.0%
8.0%
10.0%
12.0%
14.0%
16.0%
18.0%
20.0%
$0.0
$2.0
$4.0
$6.0
$8.0
$10.0
$12.0
$14.0
$16.0
$18.0
$20.0
2Q13 3Q13 4Q13 1Q14 2Q14 3Q14 4Q14 1Q15 2Q15
Inventory Accounts receivableIn billions In billions
% o
f re
ve
nu
e(1
)
% o
f re
ve
nu
e(1
)
1. % of revenue calculations based on trailing 4-quarter net revenue
© Copyright 2015 Hewlett-Packard Development Company, L.P. The information contained herein is subject to change without notice.24 © Copyright 2015 Hewlett-Packard Development Company, L.P. The information contained herein is subject to change without notice.
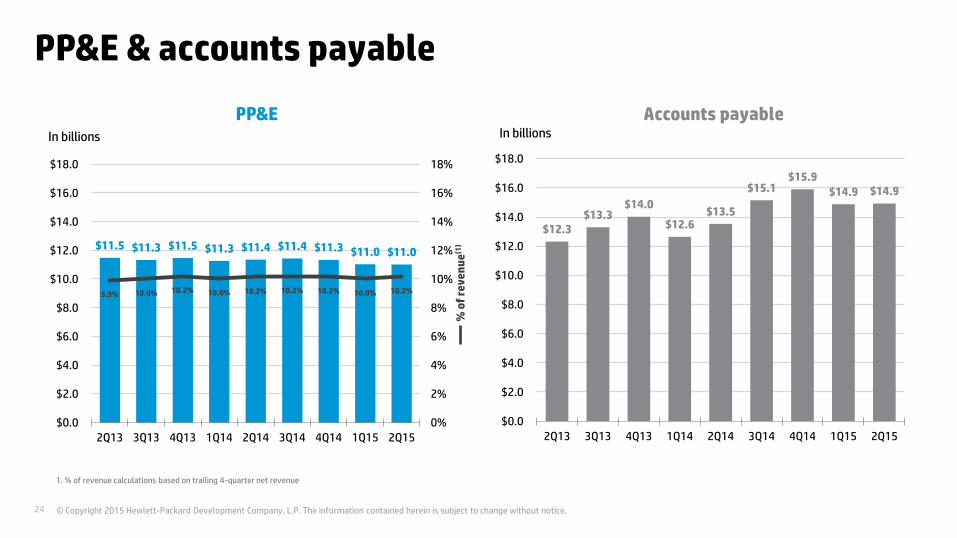
PP&E & accounts payable
$12.3 $13.3
$14.0
$12.6 $13.5
$15.1 $15.9
$14.9 $14.9
$0.0
$2.0
$4.0
$6.0
$8.0
$10.0
$12.0
$14.0
$16.0
$18.0
2Q13 3Q13 4Q13 1Q14 2Q14 3Q14 4Q14 1Q15 2Q15
$11.5 $11.3 $11.5 $11.3 $11.4 $11.4 $11.3 $11.0 $11.0
9.9% 10.0% 10.2% 10.0% 10.2% 10.2% 10.2% 10.0% 10.2%
0%
2%
4%
6%
8%
10%
12%
14%
16%
18%
$0.0
$2.0
$4.0
$6.0
$8.0
$10.0
$12.0
$14.0
$16.0
$18.0
2Q13 3Q13 4Q13 1Q14 2Q14 3Q14 4Q14 1Q15 2Q15
In billions In billions
PP&E Accounts payable
% o
f re
ve
nu
e(1
)
1. % of revenue calculations based on trailing 4-quarter net revenue
© Copyright 2015 Hewlett-Packard Development Company, L.P. The information contained herein is subject to change without notice.25
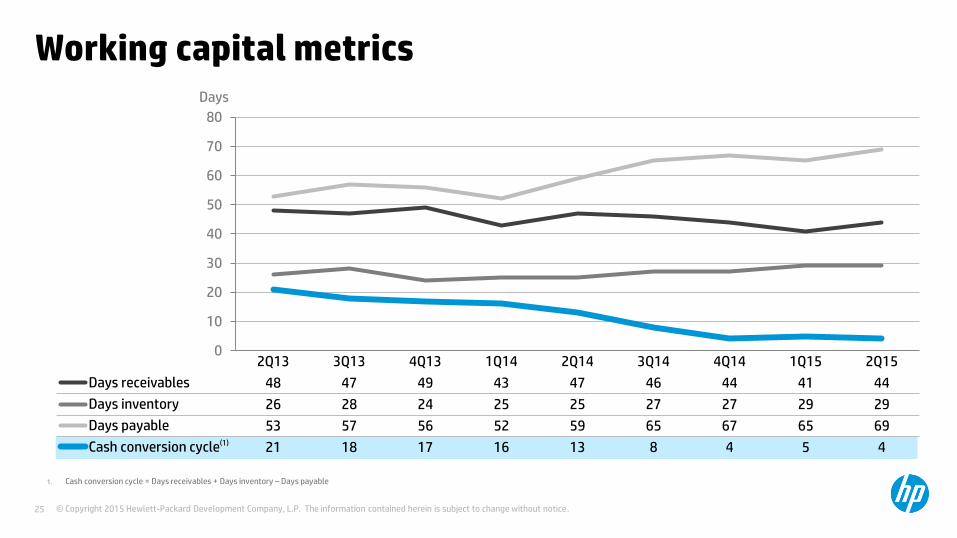
0
10
20
30
40
50
60
70
80
2Q13 3Q13 4Q13 1Q14 2Q14 3Q14 4Q14 1Q15 2Q15
Days receivables 48 47 49 43 47 46 44 41 44
Days inventory 26 28 24 25 25 27 27 29 29
Days payable 53 57 56 52 59 65 67 65 69
Cash conversion cycle 21 18 17 16 13 8 4 5 4
Working capital metricsDays
1. Cash conversion cycle = Days receivables + Days inventory – Days payable
(1)
© Copyright 2015 Hewlett-Packard Development Company, L.P. The information contained herein is subject to change without notice.26 © Copyright 2015 Hewlett-Packard Development Company, L.P. The information contained herein is subject to change without notice.
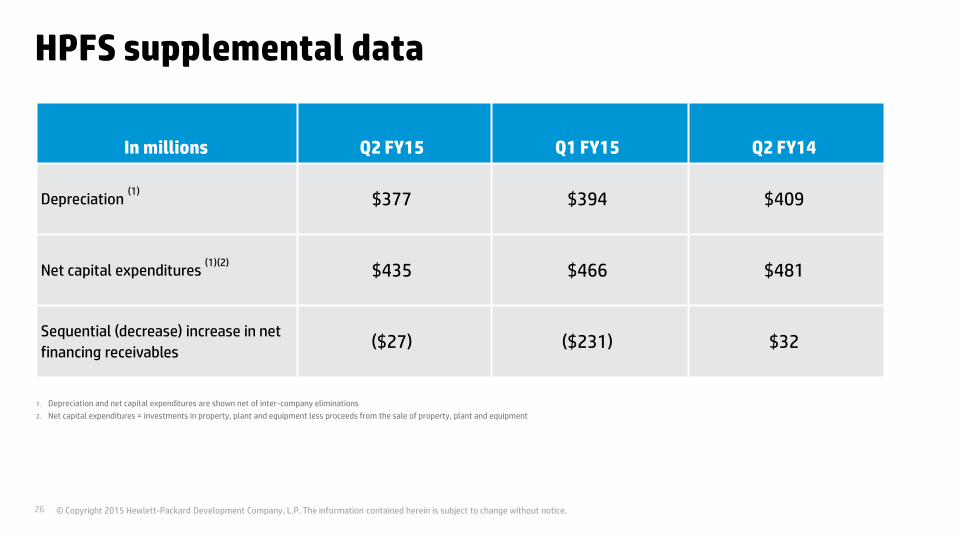
HPFS supplemental data
In millions Q2 FY15 Q1 FY15 Q2 FY14
Depreciation (1)
$377 $394 $409
Net capital expenditures (1)(2)
$435 $466 $481
Sequential (decrease) increase in net
financing receivables($27) ($231) $32
1. Depreciation and net capital expenditures are shown net of inter-company eliminations
2. Net capital expenditures = investments in property, plant and equipment less proceeds from the sale of property, plant and equipment

© Copyright 2015 Hewlett-Packard Development Company, L.P. The information contained herein is subject to change without notice.27
Q1 FY15 GAAP to non-GAAP bridge
In millions, except
tax rate and per share amounts GAAPAmortization of
intangible assetsRestructuring
chargesSeparation
CostsAcquisition-related
charges Non-GAAP
Revenue $26,839 $26,839
Cost of sales 20,571 20,571
Total OpEx 4,348 (222) (146) (80) (4) 3,896
Operating profit 1,920 222 146 80 4 2,372
Interest & other, net (174) (174)
Pre-tax earnings 1,746 222 146 80 4 2,198
Income tax (380) (63) (20) (29) (1) (493)
Tax rate 21.8% 22.4%
Net earnings $1,366 $1,705
Diluted net earnings per share $0.73 $0.92

© Copyright 2015 Hewlett-Packard Development Company, L.P. The information contained herein is subject to change without notice.28
FY14 GAAP to non-GAAP bridge
In millions, except
tax rate and per share amounts GAAPAmortization of
intangible assetsRestructuring
chargesAcquisition-related
charges Non-GAAP
Revenue $111,454 $111,454
Cost of sales 84,839 84,839
Total OpEx 19,430 (1,000) (1,619) (11) 16,800
Operating profit 7,185 1,000 1,619 11 9,815
Interest & other, net (628) (628)
Pre-tax earnings 6,557 1,000 1,619 11 9,187
Income tax (1,544) (270) (225) (3) (2,042)
Tax rate 23.5% 22.2%
Net earnings $5,013 $7,145
Diluted net earnings per share $2.62 $3.74

© Copyright 2015 Hewlett-Packard Development Company, L.P. The information contained herein is subject to change without notice.29
Q4 FY14 GAAP to non-GAAP bridge
In millions, except
tax rate and per share amounts GAAPAmortization of
intangible assetsRestructuring
chargesAcquisition-related
charges Non-GAAP
Revenue $28,406 $28,406
Cost of sales 21,425 21,425
Total OpEx 5,073 (226) (604) (3) 4,240
Operating profit 1,908 226 604 3 2,741
Interest & other, net (146) (146)
Pre-tax earnings 1,762 226 604 3 2,595
Income tax (432) (66) (82) (1) (581)
Tax rate 24.5% 22.4%
Net earnings $1,330 $2,014
Diluted net earnings per share $0.70 $1.06

© Copyright 2015 Hewlett-Packard Development Company, L.P. The information contained herein is subject to change without notice.30
Q3 FY14 GAAP to non-GAAP bridge
In millions, except
tax rate and per share amounts GAAPAmortization of
intangible assetsRestructuring
chargesAcquisition-related
charges Non-GAAP
Revenue $27,585 $27,585
Cost of sales 20,974 20,974
Total OpEx 5,153 (227) (649) (2) 4,275
Operating profit 1,458 227 649 2 2,336
Interest & other, net (145) (145)
Pre-tax earnings 1,313 227 649 2 2,191
Income tax (328) (65) (100) (0) (493)
Tax rate 25.0% 22.5%
Net earnings $985 $1,698
Diluted net earnings per share $0.52 $0.89

© Copyright 2015 Hewlett-Packard Development Company, L.P. The information contained herein is subject to change without notice.31
Q2 FY14 GAAP to non-GAAP bridge
In millions, except
tax rate and per share amounts GAAPAmortization of
intangible assetsRestructuring
chargesAcquisition-related
charges Non-GAAP
Revenue $27,309 $27,309
Cost of sales 20,704 20,704
Total OpEx 4,783 (264) (252) (3) 4,264
Operating profit 1,822 264 252 3 2,341
Interest & other, net (174) (174)
Pre-tax earnings 1,648 264 252 3 2,167
Income tax (375) (72) (28) (1) (476)
Tax rate 22.8% 22.0%
Net earnings $1,273 $1,691
Diluted net earnings per share $0.66 $0.88

© Copyright 2015 Hewlett-Packard Development Company, L.P. The information contained herein is subject to change without notice.32
Q1 FY14 GAAP to non-GAAP bridge
In millions, except
tax rate and per share amounts GAAPAmortization of
intangible assetsRestructuring
chargesAcquisition-related
charges Non-GAAP
Revenue $28,154 $28,154
Cost of sales 21,736 21,736
Total OpEx 4,421 (283) (114) (3) 4,021
Operating profit 1,997 283 114 3 2,397
Interest & other, net (163) (163)
Pre-tax earnings 1,834 283 114 3 2,234
Income tax (409) (67) (15) (1) (492)
Tax rate 22.3% 22.0%
Net earnings $1,425 $1,742
Diluted net earnings per share $0.74 $0.90
© Copyright 2015 Hewlett-Packard Development Company, L.P. The information contained herein is subject to change without notice.33
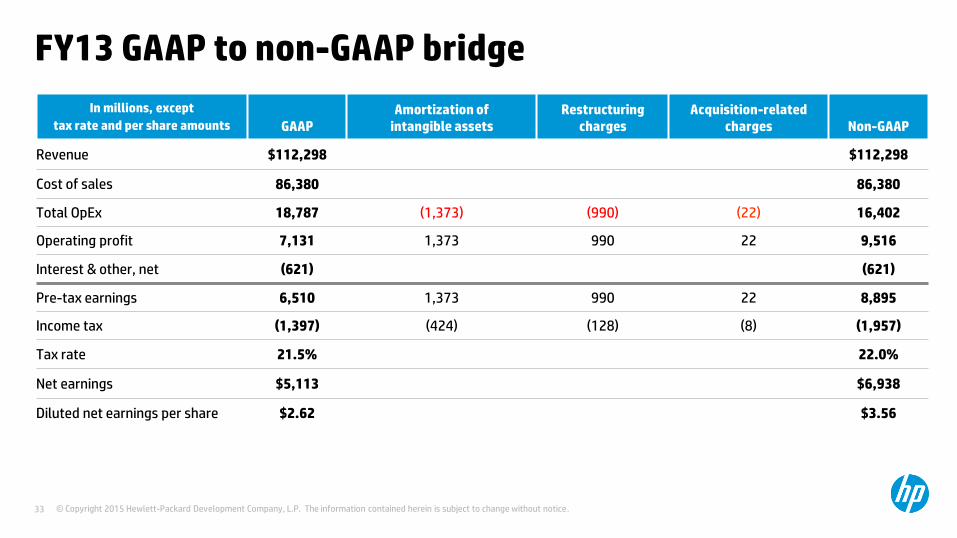
FY13 GAAP to non-GAAP bridge
In millions, except
tax rate and per share amounts GAAPAmortization of
intangible assetsRestructuring
chargesAcquisition-related
charges Non-GAAP
Revenue $112,298 $112,298
Cost of sales 86,380 86,380
Total OpEx 18,787 (1,373) (990) (22) 16,402
Operating profit 7,131 1,373 990 22 9,516
Interest & other, net (621) (621)
Pre-tax earnings 6,510 1,373 990 22 8,895
Income tax (1,397) (424) (128) (8) (1,957)
Tax rate 21.5% 22.0%
Net earnings $5,113 $6,938
Diluted net earnings per share $2.62 $3.56

© Copyright 2015 Hewlett-Packard Development Company, L.P. The information contained herein is subject to change without notice.34
Q4 FY13 GAAP to non-GAAP bridge
In millions, except
tax rate and per share amounts GAAPAmortization of
intangible assetsRestructuring
chargesAcquisition-related
charges Non-GAAP
Revenue $29,131 $29,131
Cost of sales 22,437 22,437
Total OpEx 4,771 (317) (371) (3) 4,080
Operating profit 1,923 317 371 3 2,614
Interest & other, net (103) (103)
Pre-tax earnings 1,820 317 371 3 2,511
Income tax (406) (87) (58) (1) (552)
Tax rate 22.3% 22.0%
Net earnings $1,414 $1,959
Diluted net earnings per share $0.73 $1.01
© Copyright 2015 Hewlett-Packard Development Company, L.P. The information contained herein is subject to change without notice.35
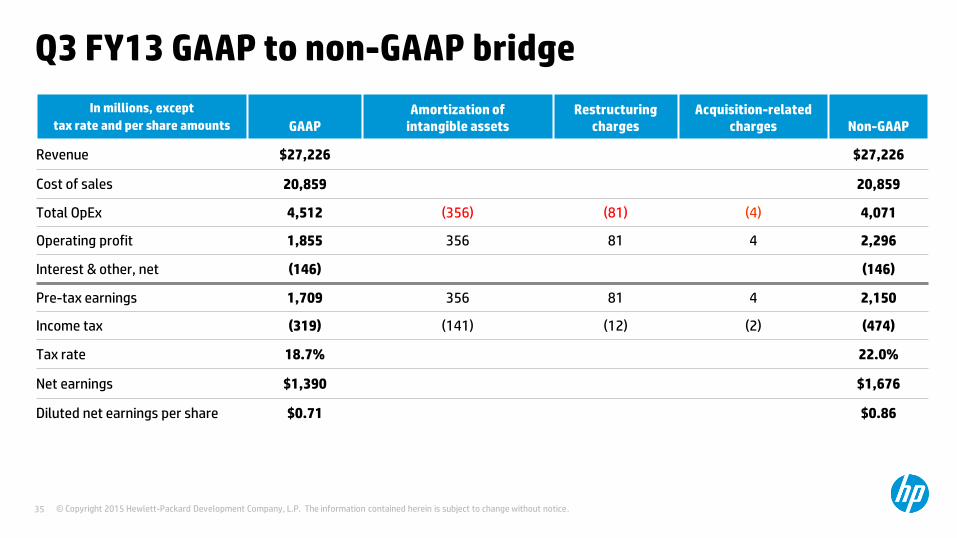
Q3 FY13 GAAP to non-GAAP bridge
In millions, except
tax rate and per share amounts GAAPAmortization of
intangible assetsRestructuring
chargesAcquisition-related
charges Non-GAAP
Revenue $27,226 $27,226
Cost of sales 20,859 20,859
Total OpEx 4,512 (356) (81) (4) 4,071
Operating profit 1,855 356 81 4 2,296
Interest & other, net (146) (146)
Pre-tax earnings 1,709 356 81 4 2,150
Income tax (319) (141) (12) (2) (474)
Tax rate 18.7% 22.0%
Net earnings $1,390 $1,676
Diluted net earnings per share $0.71 $0.86

© Copyright 2015 Hewlett-Packard Development Company, L.P. The information contained herein is subject to change without notice.36
Q2 FY13 GAAP to non-GAAP bridge
In millions, except
tax rate and per share amounts GAAPAmortization of
intangible assetsRestructuring
chargesAcquisition-related
charges Non-GAAP
Revenue $27,582 $27,582
Cost of sales 21,055 21,055
Total OpEx 4,926 (350) (408) (11) 4,157
Operating profit 1,601 350 408 11 2,370
Interest & other, net (193) (193)
Pre-tax earnings 1,408 350 408 11 2,177
Income tax (331) (101) (43) (4) (479)
Tax rate 23.5% 22.0%
Net earnings $1,077 $1,698
Diluted net earnings per share $0.55 $0.87
© Copyright 2015 Hewlett-Packard Development Company, L.P. The information contained herein is subject to change without notice.37 © Copyright 2015 Hewlett-Packard Development Company, L.P. The information contained herein is subject to change without notice.
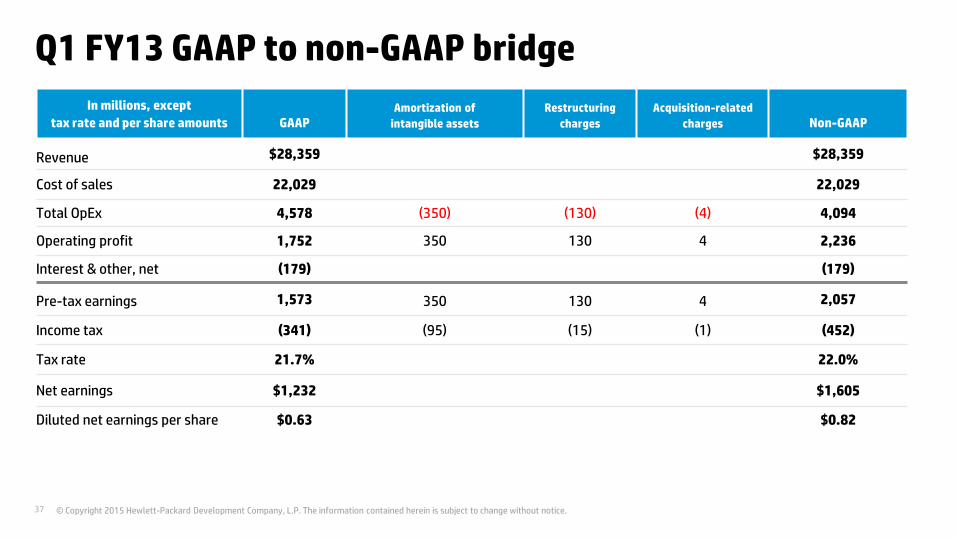
Q1 FY13 GAAP to non-GAAP bridge
In millions, except
tax rate and per share amounts GAAPAmortization of
intangible assets
Restructuring
charges
Acquisition-related
charges Non-GAAP
Revenue $28,359 $28,359
Cost of sales 22,029 22,029
Total OpEx 4,578 (350) (130) (4) 4,094
Operating profit 1,752 350 130 4 2,236
Interest & other, net (179) (179)
Pre-tax earnings 1,573 350 130 4 2,057
Income tax (341) (95) (15) (1) (452)
Tax rate 21.7% 22.0%
Net earnings $1,232 $1,605
Diluted net earnings per share $0.63 $0.82
© Copyright 2015 Hewlett-Packard Development Company, L.P. The information contained herein is subject to change without notice.38 © Copyright 2015 Hewlett-Packard Development Company, L.P. The information contained herein is subject to change without notice.
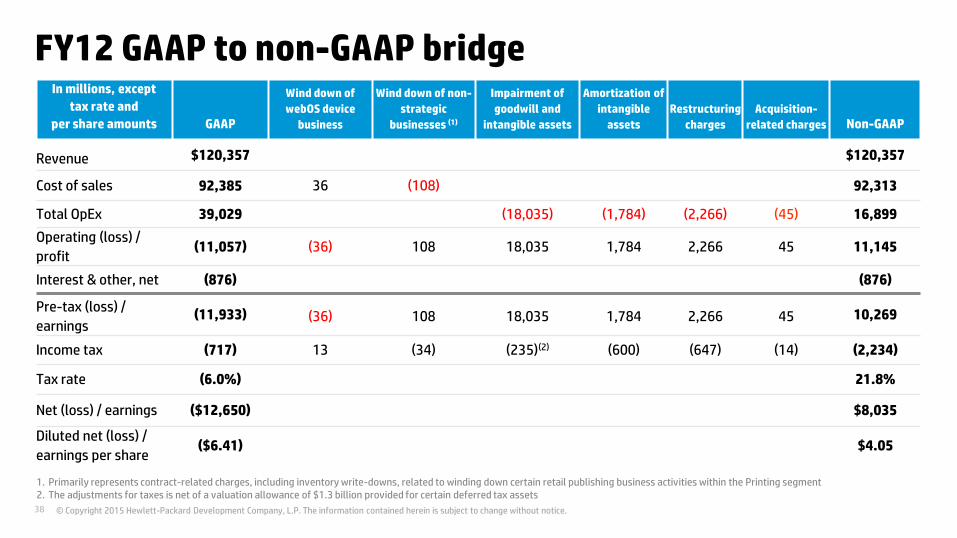
FY12 GAAP to non-GAAP bridgeIn millions, except
tax rate and
per share amounts GAAP
Wind down of
webOS device
business
Wind down of non-
strategic
businesses (1)
Impairment of
goodwill and
intangible assets
Amortization of
intangible
assets
Restructuring
charges
Acquisition-
related charges Non-GAAP
Revenue $120,357 $120,357
Cost of sales 92,385 36 (108) 92,313
Total OpEx 39,029 (18,035) (1,784) (2,266) (45) 16,899
Operating (loss) /
profit(11,057) (36) 108 18,035 1,784 2,266 45 11,145
Interest & other, net (876) (876)
Pre-tax (loss) /
earnings(11,933) (36) 108 18,035 1,784 2,266 45 10,269
Income tax (717) 13 (34) (235)(2) (600) (647) (14) (2,234)
Tax rate (6.0%) 21.8%
Net (loss) / earnings ($12,650) $8,035
Diluted net (loss) /
earnings per share($6.41) $4.05
1. Primarily represents contract-related charges, including inventory write-downs, related to winding down certain retail publishing business activities within the Printing segment2. The adjustments for taxes is net of a valuation allowance of $1.3 billion provided for certain deferred tax assets
© Copyright 2015 Hewlett-Packard Development Company, L.P. The information contained herein is subject to change without notice.39 © Copyright 2015 Hewlett-Packard Development Company, L.P. The information contained herein is subject to change without notice.
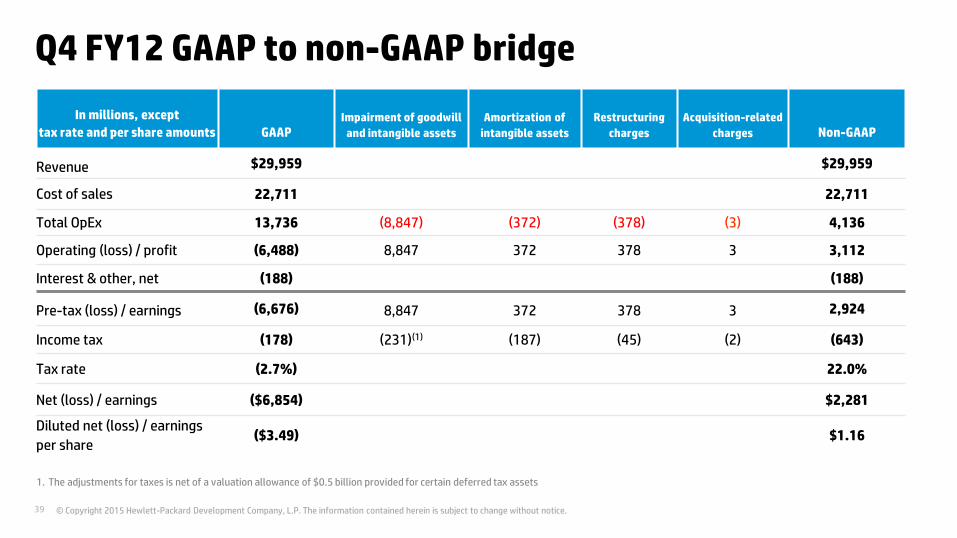
Q4 FY12 GAAP to non-GAAP bridge
In millions, except
tax rate and per share amounts GAAPImpairment of goodwill
and intangible assets
Amortization of
intangible assets
Restructuring
charges
Acquisition-related
charges Non-GAAP
Revenue $29,959 $29,959
Cost of sales 22,711 22,711
Total OpEx 13,736 (8,847) (372) (378) (3) 4,136
Operating (loss) / profit (6,488) 8,847 372 378 3 3,112
Interest & other, net (188) (188)
Pre-tax (loss) / earnings (6,676) 8,847 372 378 3 2,924
Income tax (178) (231)(1) (187) (45) (2) (643)
Tax rate (2.7%) 22.0%
Net (loss) / earnings ($6,854) $2,281
Diluted net (loss) / earnings
per share($3.49) $1.16
1. The adjustments for taxes is net of a valuation allowance of $0.5 billion provided for certain deferred tax assets
© Copyright 2015 Hewlett-Packard Development Company, L.P. The information contained herein is subject to change without notice.40 © Copyright 2015 Hewlett-Packard Development Company, L.P. The information contained herein is subject to change without notice.
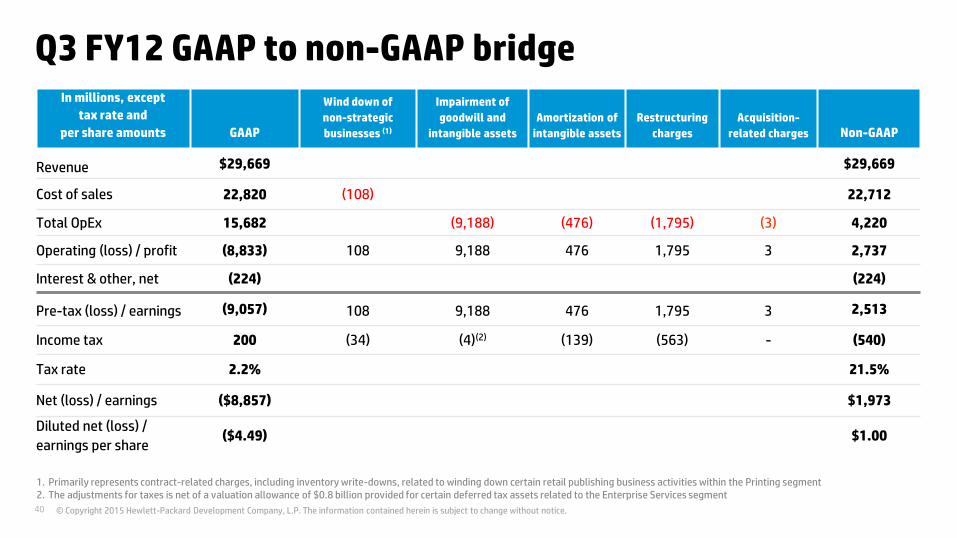
Q3 FY12 GAAP to non-GAAP bridgeIn millions, except
tax rate and
per share amounts GAAP
Wind down of
non-strategic
businesses (1)
Impairment of
goodwill and
intangible assets
Amortization of
intangible assets
Restructuring
charges
Acquisition-
related charges Non-GAAP
Revenue $29,669 $29,669
Cost of sales 22,820 (108) 22,712
Total OpEx 15,682 (9,188) (476) (1,795) (3) 4,220
Operating (loss) / profit (8,833) 108 9,188 476 1,795 3 2,737
Interest & other, net (224) (224)
Pre-tax (loss) / earnings (9,057) 108 9,188 476 1,795 3 2,513
Income tax 200 (34) (4)(2) (139) (563) - (540)
Tax rate 2.2% 21.5%
Net (loss) / earnings ($8,857) $1,973
Diluted net (loss) /
earnings per share($4.49) $1.00
1. Primarily represents contract-related charges, including inventory write-downs, related to winding down certain retail publishing business activities within the Printing segment2. The adjustments for taxes is net of a valuation allowance of $0.8 billion provided for certain deferred tax assets related to the Enterprise Services segment
© Copyright 2015 Hewlett-Packard Development Company, L.P. The information contained herein is subject to change without notice.41 © Copyright 2015 Hewlett-Packard Development Company, L.P. The information contained herein is subject to change without notice.
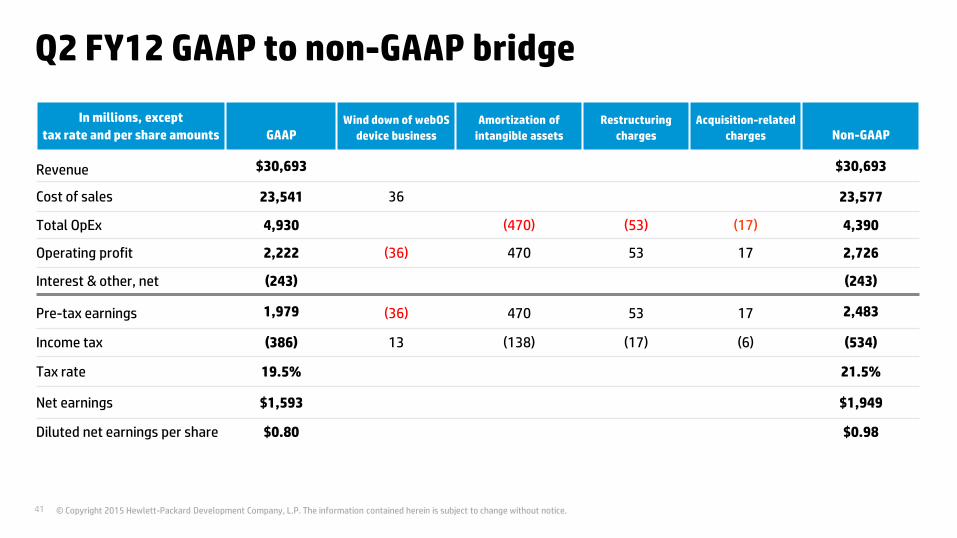
Q2 FY12 GAAP to non-GAAP bridge
In millions, except
tax rate and per share amounts GAAPWind down of webOS
device business
Amortization of
intangible assets
Restructuring
charges
Acquisition-related
charges Non-GAAP
Revenue $30,693 $30,693
Cost of sales 23,541 36 23,577
Total OpEx 4,930 (470) (53) (17) 4,390
Operating profit 2,222 (36) 470 53 17 2,726
Interest & other, net (243) (243)
Pre-tax earnings 1,979 (36) 470 53 17 2,483
Income tax (386) 13 (138) (17) (6) (534)
Tax rate 19.5% 21.5%
Net earnings $1,593 $1,949
Diluted net earnings per share $0.80 $0.98