Embed Size (px)
Citation preview
C H A R L E S C O E
A S S I S T A N T I N S P E C T O R G E N E R A L , I N F O R M A T I O N
T E C H N O L O G Y A U D I T S A N D C O M P U T E R C R I M E I N V E S T I G A T I O N S
U . S . D E P A R T M E N T O F E D U C A T I O N O F F I C E O F I N S P E C T O R G E N E R A L
F E D E R A L A U D I T E X E C U T I V E C O U N C I L B I - M O N T H L Y M E E T I N G A N D T R A I N I N G
A U G U S T 2 2 , 2 0 1 2
How-to leverage Data Analytics to support Audit or
Investigation Services
Today’s Agenda
Part I – Foundation Cornerstones Vision & Commitment
Strategy
Project management
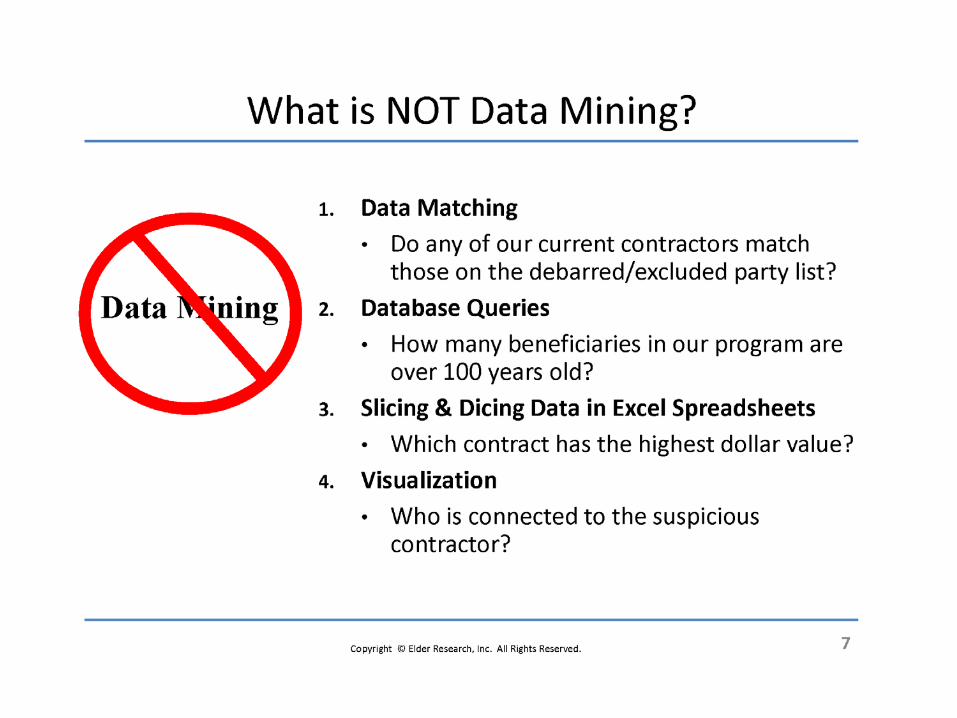
Part II – Data/Predictive Analytics & Risk Models What is & What isn’t State & Local Risk Model
E-Fraud Risk Model
2
Part I - Foundation Cornerstones
Vision and Commitment Strategy
Project Management
3
Vision and Commitment
Leadership is an essential ingredient executive champion/sponsor who has an agreed upon vision of
the value and direction of the implementation of a data analytic project
DON’T start without it!
Set expectations and secure resources don’t expect to get a Cadillac on VW budget no free lunch
4
Strategy
Benchmark other organizations who have been successful do NOT forge your own path unless absolutely necessary!
Take advantage of “Lessons Learned” from benchmark organizations
Research legal & IT security requirements (SORN, CMA, C&A, etc …)
Determine skill sets needed “over time” establish effective interview and selection methodology – no, you
can’t fudge this one!
5
Project Management
Identify your customer requirements & needs (Audit
& Investigations) Audit – traditional risk models reflecting how best to allocate
limited audit resources that focus on critical operational areas
Investigations – data analytical models looking for known fraudulent patterns within key operational areas that have the highest return on investment of investigation resources
6
Project Management - continued
Seek program experts to help develop your data
analytics projects
False positives are your enemy – these can be fatal!
Deliver on time and don’t miss milestones, otherwise you jeopardize losing your “Champion” supporters
Be prepared for unintended consequences/results of creating risk models!
7
Part II - Predictive Analytics & Risk Models
20th Century - Standard Audit Practice Audit occurs significantly after transactions are completed. Rarely able to test all transactions in comprehensive fashion. Normal practice
is using statistical sampling techniques. Therefore there may have been significant risk that errors could have occurred,
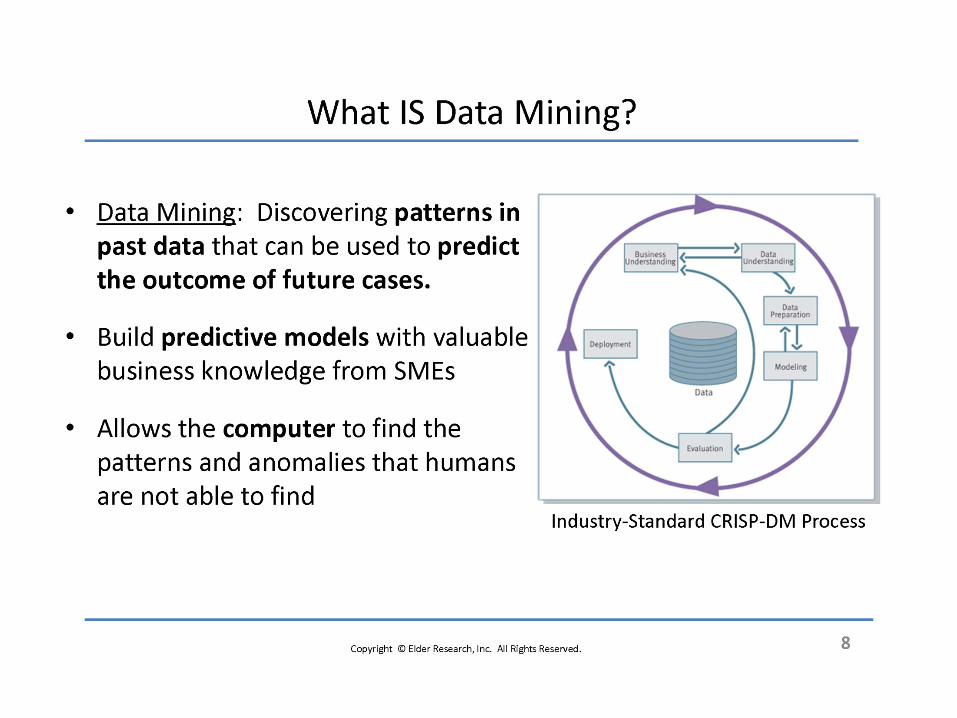
but remain undetected. 21st Century - “Predictive Analytics” Techniques Empowers Investigators and Auditors to leverage today’s technology to predict
with a high degree of probability, anomalies where fraudulent or inaccurate activity is likely using statistical and mathematical techniques.
Makes the audit and investigative processes more efficient and effective. Ability to discover both fraudulent anomalies as well as indicators of
control deficiencies and emerging risk.
8
11
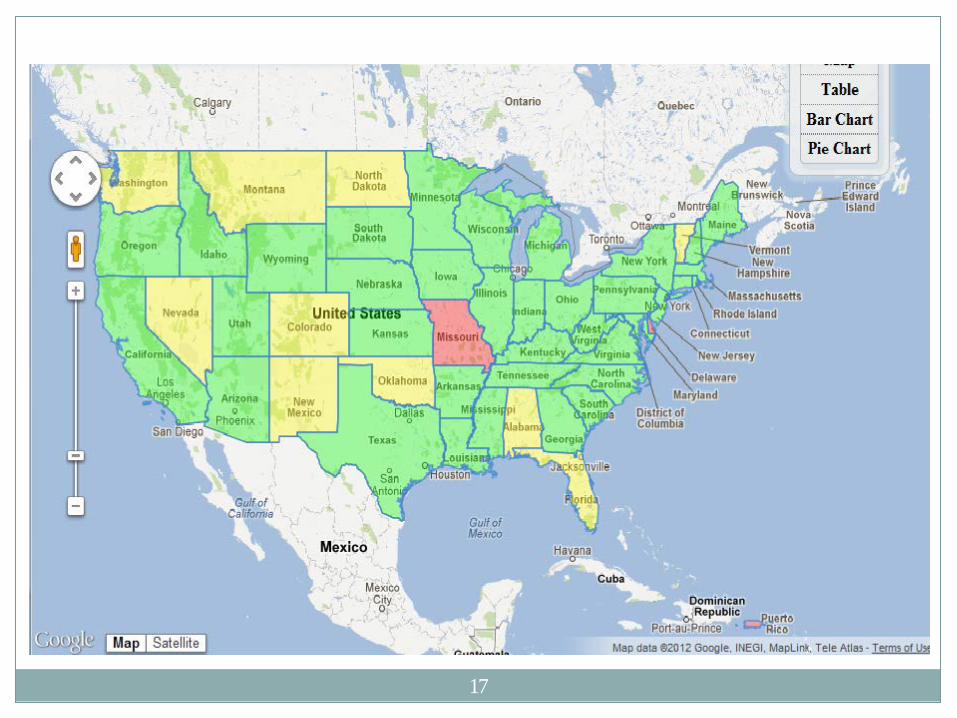
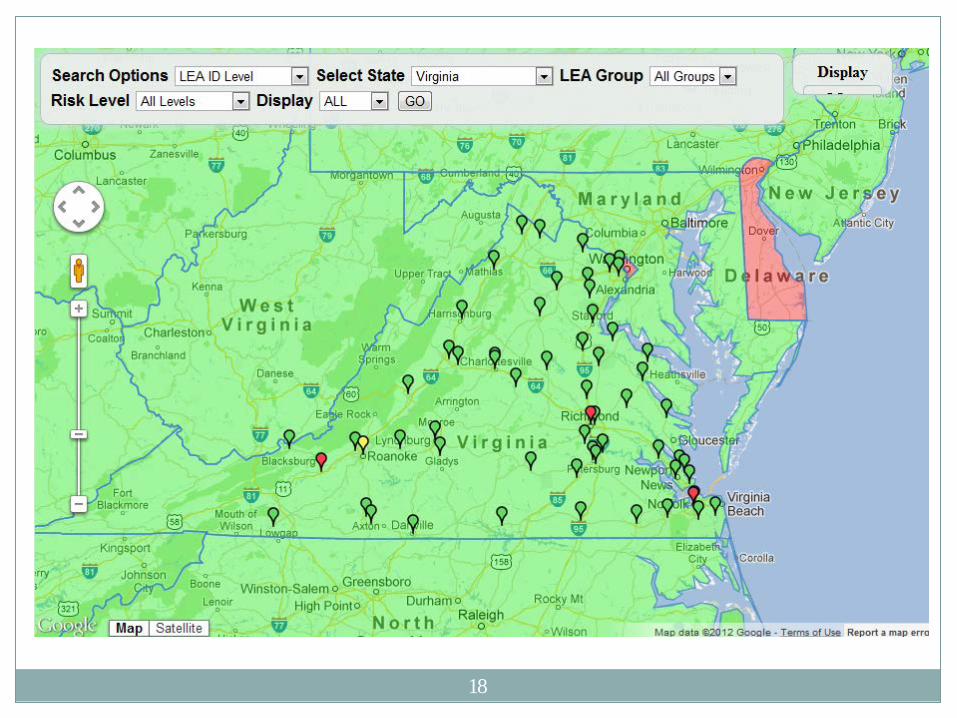
State & Local Education Agencies Risk Model (SLRM)
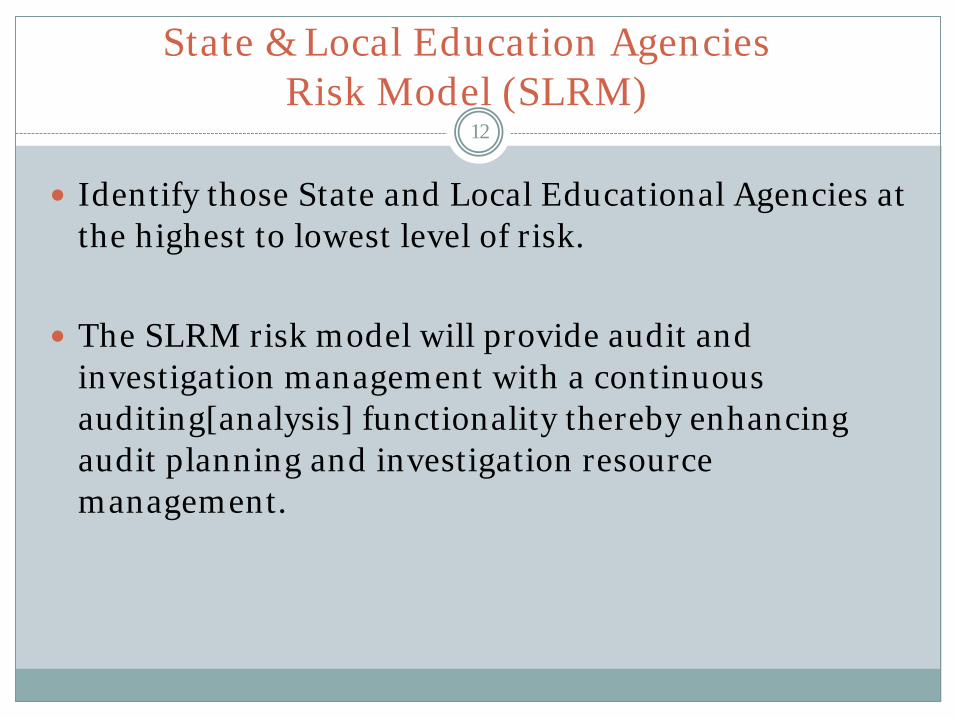
Identify those State and Local Educational Agencies at the highest to lowest level of risk.
The SLRM risk model will provide audit and
investigation management with a continuous auditing[analysis] functionality thereby enhancing audit planning and investigation resource management.
12
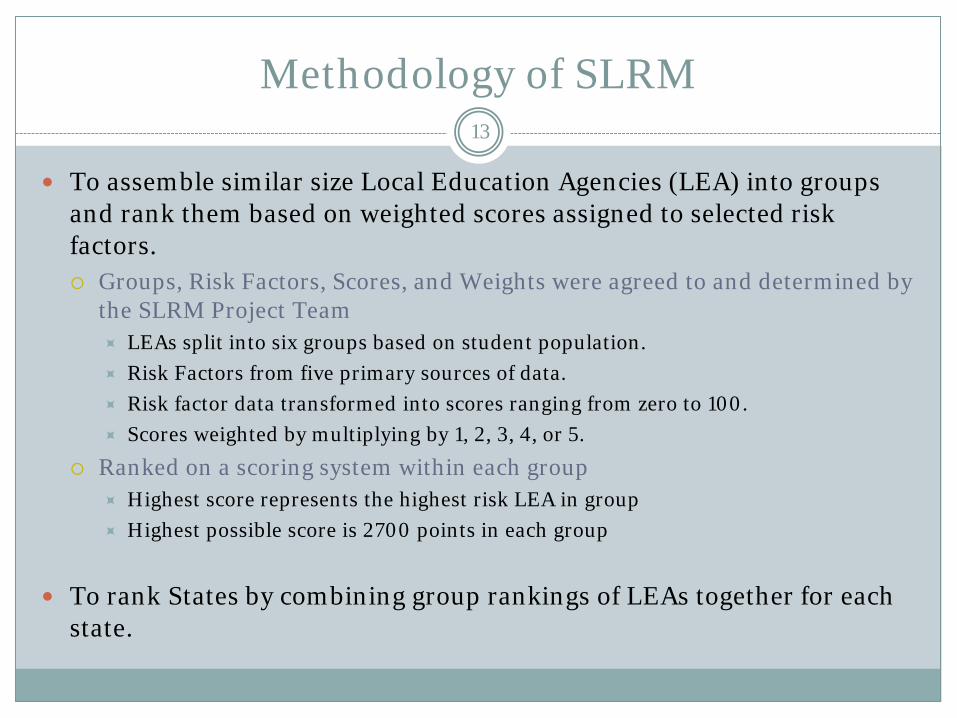
Methodology of SLRM
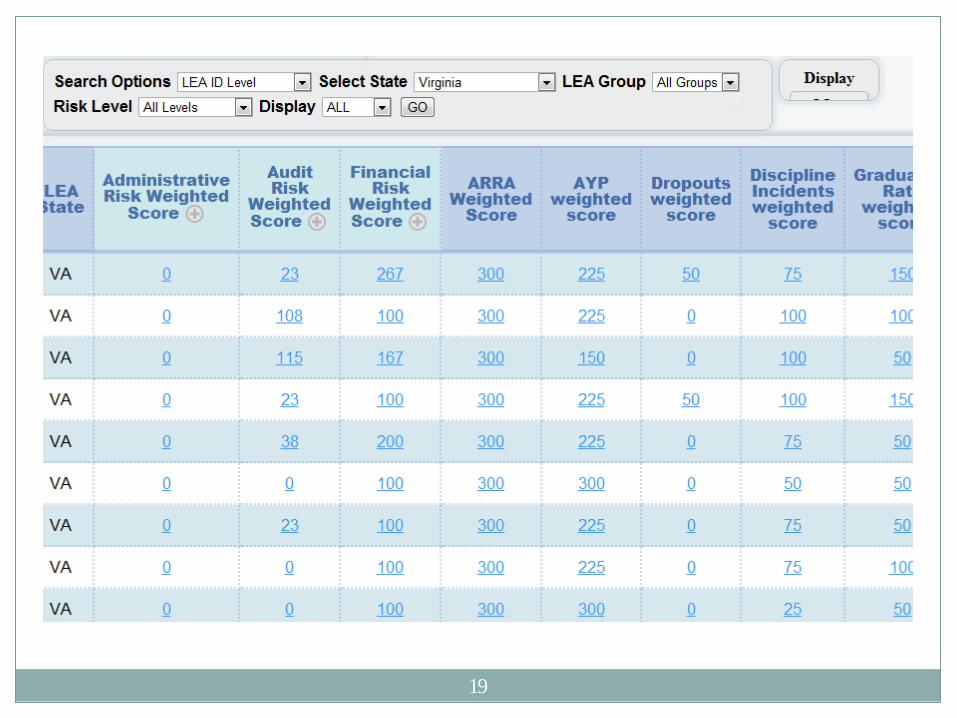
To assemble similar size Local Education Agencies (LEA) into groups and rank them based on weighted scores assigned to selected risk factors. Groups, Risk Factors, Scores, and Weights were agreed to and determined by
the SLRM Project Team LEAs split into six groups based on student population. Risk Factors from five primary sources of data. Risk factor data transformed into scores ranging from zero to 100. Scores weighted by multiplying by 1, 2, 3, 4, or 5.
Ranked on a scoring system within each group Highest score represents the highest risk LEA in group Highest possible score is 2700 points in each group
To rank States by combining group rankings of LEAs together for each state.
13
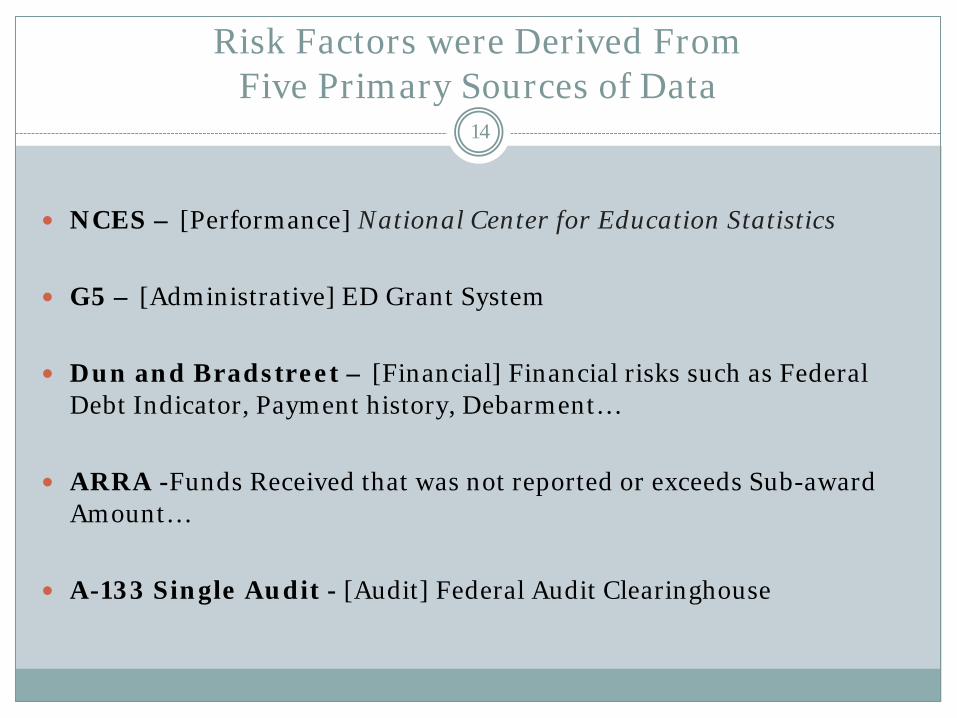
Risk Factors were Derived From Five Primary Sources of Data
NCES – [Performance] National Center for Education Statistics G5 – [Administrative] ED Grant System Dun and Bradstreet – [Financial] Financial risks such as Federal
Debt Indicator, Payment history, Debarment… ARRA -Funds Received that was not reported or exceeds Sub-award
Amount… A-133 Single Audit - [Audit] Federal Audit Clearinghouse
14
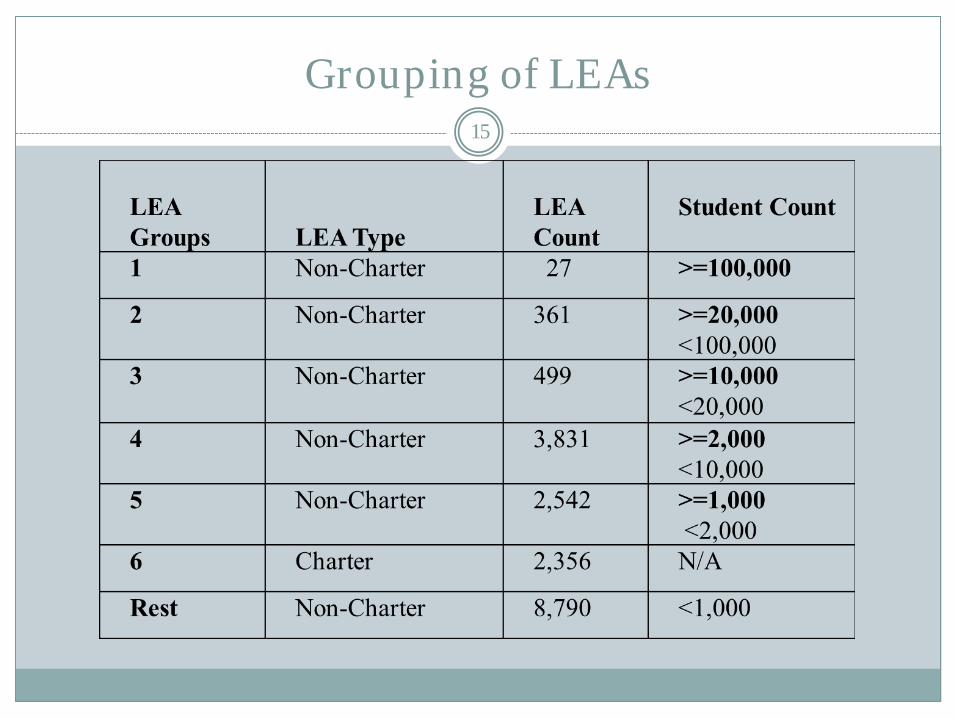
Grouping of LEAs 15
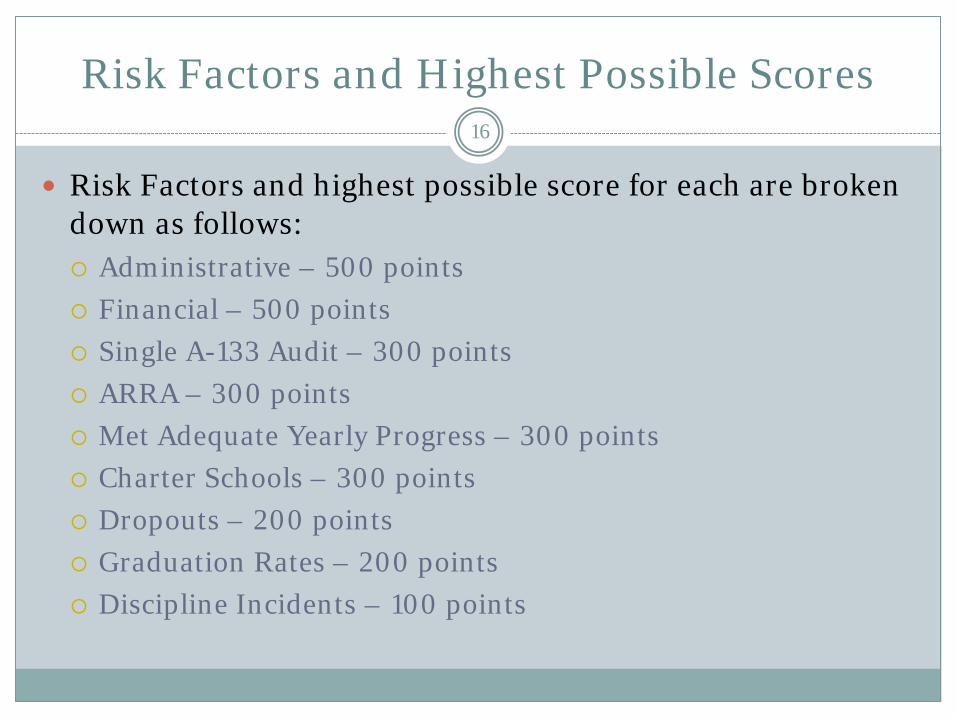
Risk Factors and Highest Possible Scores
Risk Factors and highest possible score for each are broken down as follows: Administrative – 500 points Financial – 500 points Single A-133 Audit – 300 points ARRA – 300 points Met Adequate Yearly Progress – 300 points Charter Schools – 300 points Dropouts – 200 points Graduation Rates – 200 points Discipline Incidents – 100 points
16
17
18
19
E-Fraud Data Analytical Model
Student fraud rings have become a rapidly growing crime
activity that now have targeted the U.S. Department of Education (ED) FSA programs.
ED processed over 19 million applications for student financial aid and disbursed over $90 Billion in FSA funds in SY2010.
20
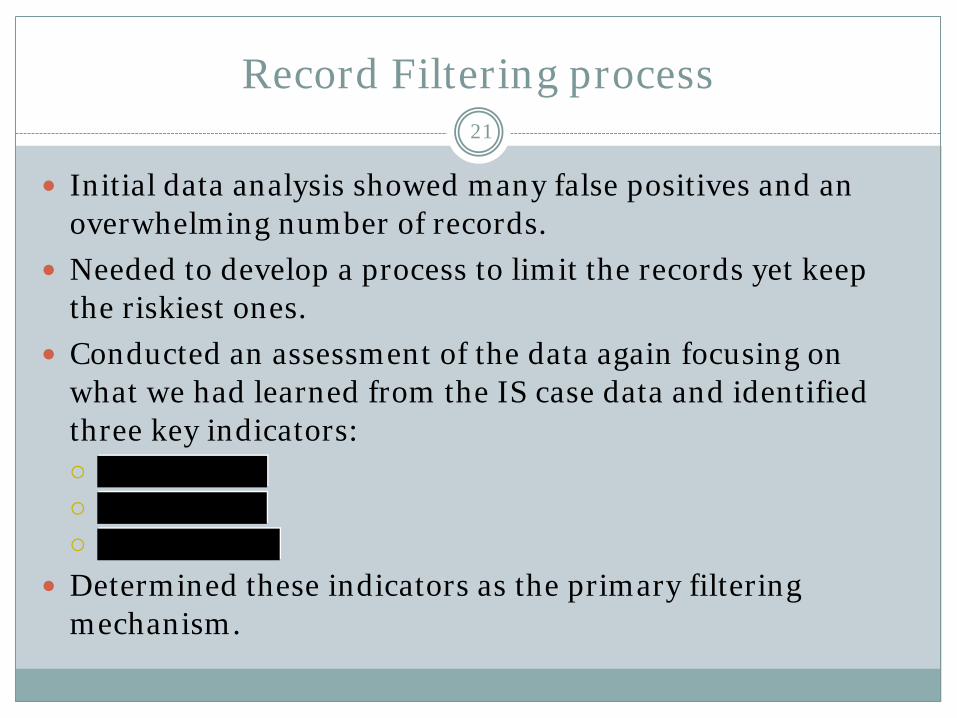
Record Filtering process
Initial data analysis showed many false positives and an overwhelming number of records.
Needed to develop a process to limit the records yet keep the riskiest ones.
Conducted an assessment of the data again focusing on what we had learned from the IS case data and identified three key indicators:
Determined these indicators as the primary filtering mechanism.
21
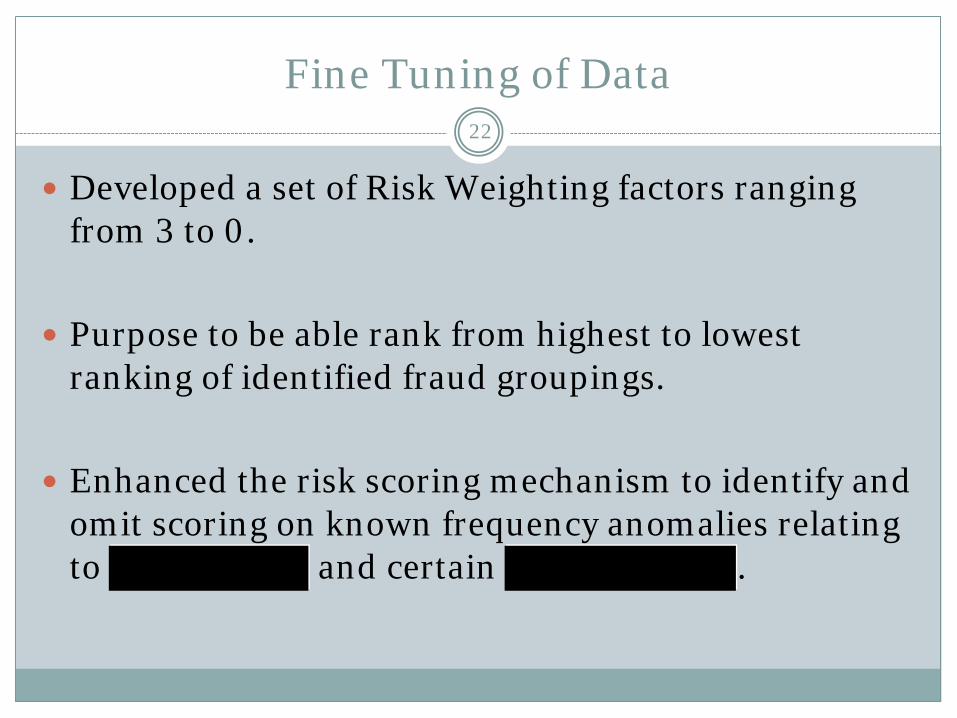
Fine Tuning of Data
Developed a set of Risk Weighting factors ranging from 3 to 0.
Purpose to be able rank from highest to lowest
ranking of identified fraud groupings. Enhanced the risk scoring mechanism to identify and
omit scoring on known frequency anomalies relating to and certain .
22
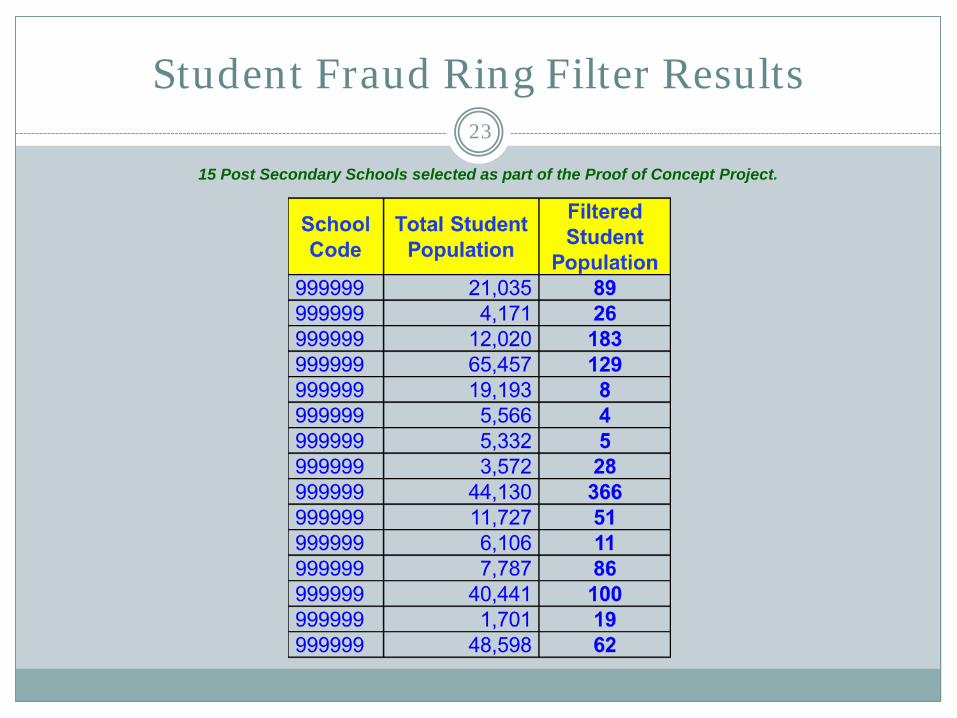
Student Fraud Ring Filter Results 23
15 Post Secondary Schools selected as part of the Proof of Concept Project.
Is Your Model Statistically Supportable?
Verify that your sample data being used in the proof of concept project
is representative of the total population.
Address concerns of bias by modifying established fraud indicator parameters looking for abnormal/unexpected variances.
Use data outside of the sample but from the total population to reaffirm expected outcomes.
Bringing a statistician onboard from the outset of the project, or at a minimum assess the planned project methodology is recommended.
24
Feedback from the Field
Conclusion model had identified all known fraud rings from
SY2010 test set. Statistically this is very rare, which further gives us a sense of the value generated.
Identified new previously unknown fraud rings.
Added additional students to fraud rings under investigation.
25
Audit Independence Concerns?
Tell story here of unintended consequences ….
Build risk models as part of a performance audit!
26

The End
Questions?
27