Embed Size (px)
Citation preview

How middle-class is Latin America?
Latin American Conference on Measuring Well-Being
and Fostering the Progress of Societies
Mexico DF, 11 May 2011
Social inequality and well-being
Jeff Dayton-Johnson
Head, Americas Desk
OECD Development Centre
2
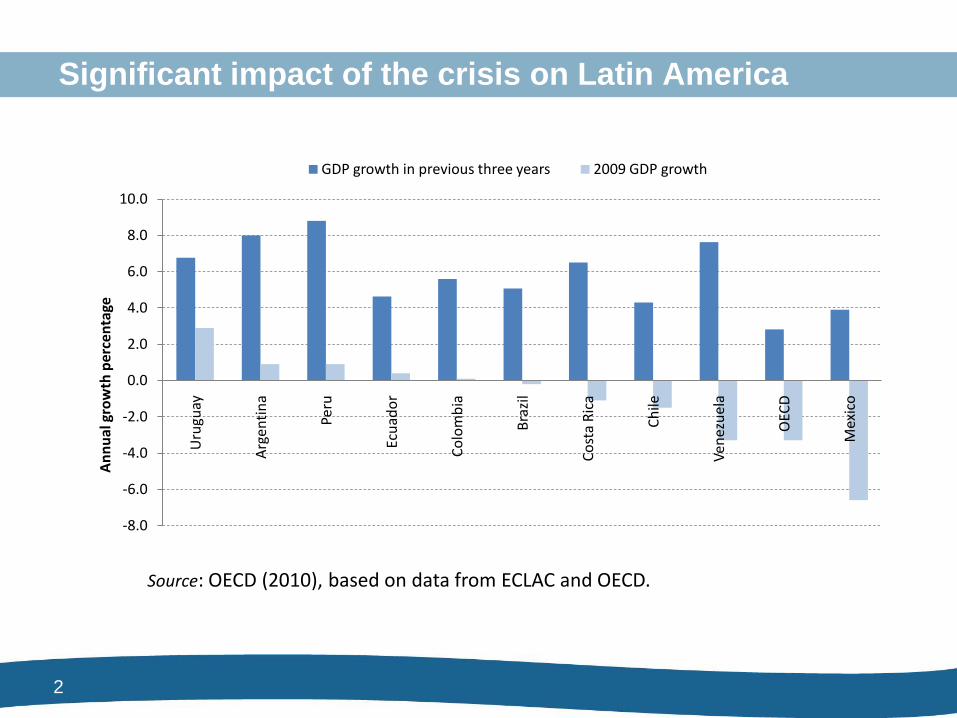
Significant impact of the crisis on Latin America
Source: OECD (2010), based on data from ECLAC and OECD.
-8.0
-6.0
-4.0
-2.0
0.0
2.0
4.0
6.0
8.0
10.0U
rugu
ay
Arg
enti
na
Peru
Ecu
ado
r
Co
lom
bia
Bra
zil
Co
sta
Ric
a
Ch
ile
Ven
ezu
ela
OEC
D
Mex
ico
An
nu
al g
row
th p
erce
nta
ge
GDP growth in previous three years 2009 GDP growth
3
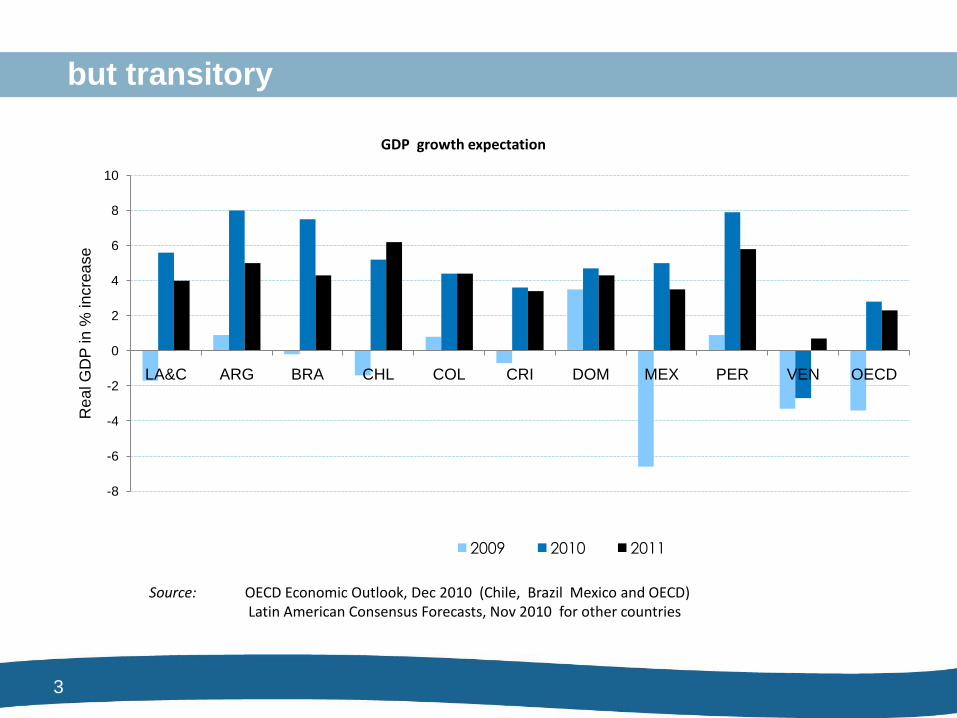
but transitory
Source: OECD Economic Outlook, Dec 2010 (Chile, Brazil Mexico and OECD) Latin American Consensus Forecasts, Nov 2010 for other countries
-8
-6
-4
-2
0
2
4
6
8
10
LA&C ARG BRA CHL COL CRI DOM MEX PER VEN OECD
Rea
l G
DP
in
% incre
ase
GDP growth expectation
2009 2010 2011
4
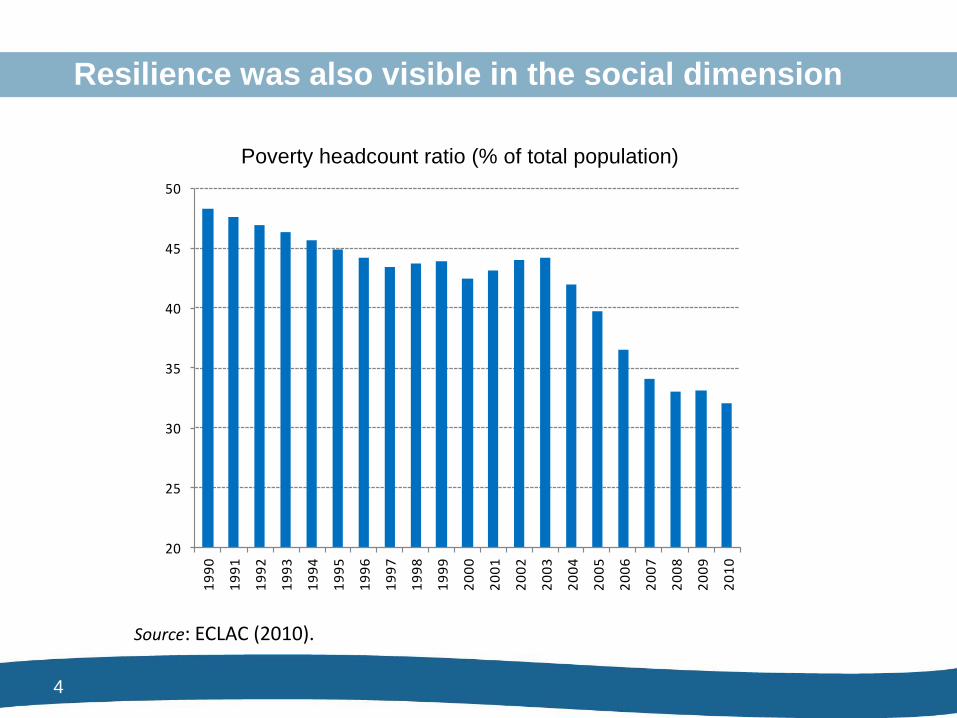
Resilience was also visible in the social dimension
20
25
30
35
40
45
50
19
90
19
91
19
92
19
93
19
94
19
95
19
96
19
97
19
98
19
99
20
00
20
01
20
02
20
03
20
04
20
05
20
06
20
07
20
08
20
09
20
10
Source: ECLAC (2010).
Poverty headcount ratio (% of total population)
5
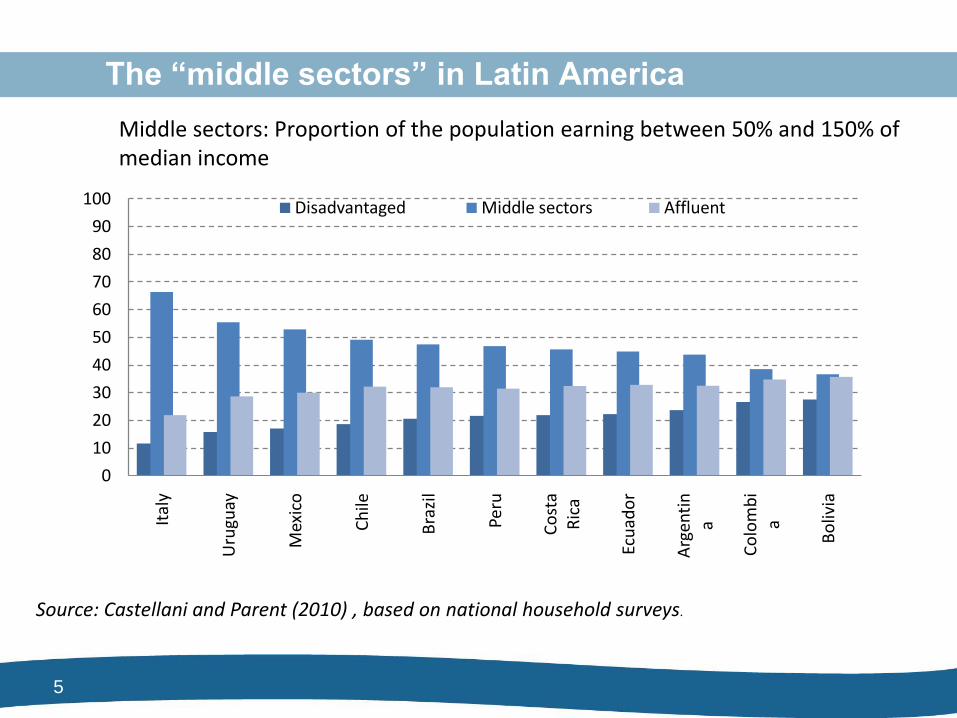
The “middle sectors” in Latin America
0
10
20
30
40
50
60
70
80
90
100
Ital
y
Uru
guay
Mex
ico
Ch
ile
Bra
zil
Peru
Co
sta
Ric
a
Ecu
ado
r
Arg
enti
na
Co
lom
bi
a
Bo
livia
Disadvantaged Middle sectors Affluent
Source: Castellani and Parent (2010) , based on national household surveys.
Middle sectors: Proportion of the population earning between 50% and 150% of median income
6
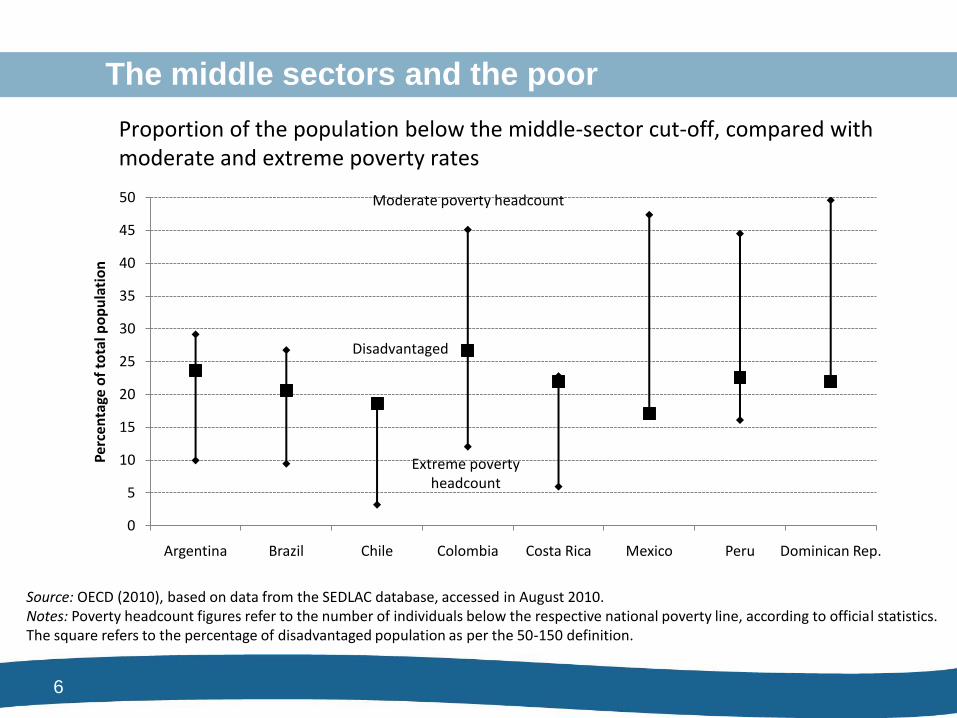
The middle sectors and the poor
0
5
10
15
20
25
30
35
40
45
50
Argentina Brazil Chile Colombia Costa Rica Mexico Peru Dominican Rep.
Per
cen
tage
of
tota
l po
pu
lati
on
Moderate poverty headcount
Extreme poverty headcount
Disadvantaged
Source: OECD (2010), based on data from the SEDLAC database, accessed in August 2010.Notes: Poverty headcount figures refer to the number of individuals below the respective national poverty line, according to official statistics. The square refers to the percentage of disadvantaged population as per the 50-150 definition.
Proportion of the population below the middle-sector cut-off, compared with moderate and extreme poverty rates
7
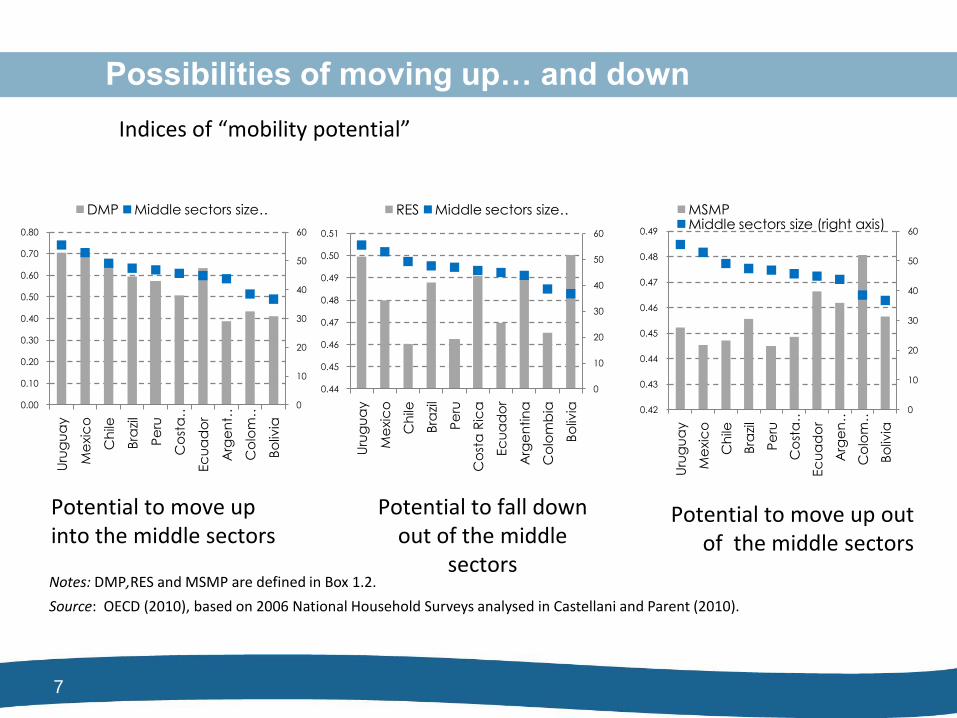
Possibilities of moving up… and down
Notes: DMP,RES and MSMP are defined in Box 1.2.
Source: OECD (2010), based on 2006 National Household Surveys analysed in Castellani and Parent (2010).
0
10
20
30
40
50
60
0.00
0.10
0.20
0.30
0.40
0.50
0.60
0.70
0.80
Uru
gu
ay
Me
xic
o
Ch
ile
Bra
zil
Pe
ru
Co
sta
…
Ec
ua
do
r
Arg
en
t…
Co
lom
…
Bo
livia
DMP Middle sectors size …
0
10
20
30
40
50
60
0.44
0.45
0.46
0.47
0.48
0.49
0.50
0.51
Uru
gu
ay
Me
xic
o
Ch
ile
Bra
zil
Pe
ru
Co
sta
Ric
a
Ec
ua
do
r
Arg
en
tin
a
Co
lom
bia
Bo
livia
RES Middle sectors size …
0
10
20
30
40
50
60
0.42
0.43
0.44
0.45
0.46
0.47
0.48
0.49
Uru
gu
ay
Me
xic
o
Ch
ile
Bra
zil
Pe
ru
Co
sta
…
Ec
ua
do
r
Arg
en
…
Co
lom
…
Bo
livia
MSMPMiddle sectors size (right axis)
Potential to move up into the middle sectors
Potential to fall down out of the middle
sectors
Potential to move up out of the middle sectors
Indices of “mobility potential”
8
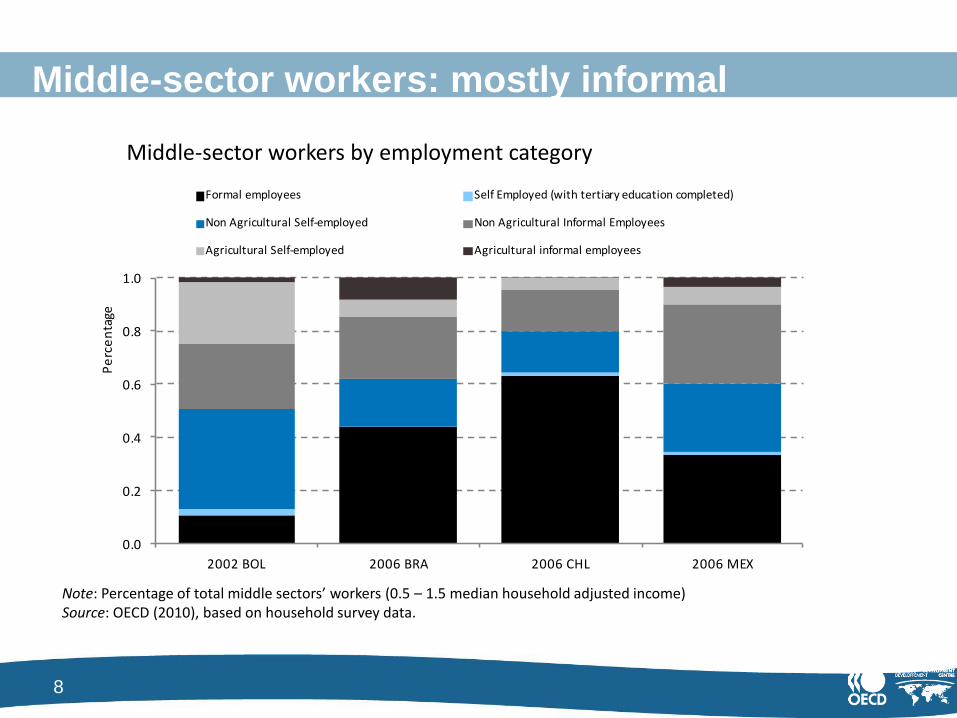
Middle-sector workers: mostly informal
Note: Percentage of total middle sectors’ workers (0.5 – 1.5 median household adjusted income)Source: OECD (2010), based on household survey data.
Middle-sector workers by employment category
0.0
0.2
0.4
0.6
0.8
1.0
2002 BOL 2006 BRA 2006 CHL 2006 MEX
Pe
rce
nta
ge
Formal employees Self Employed (with tertiary education completed)
Non Agricultural Self-employed Non Agricultural Informal Employees
Agricultural Self-employed Agricultural informal employees
9
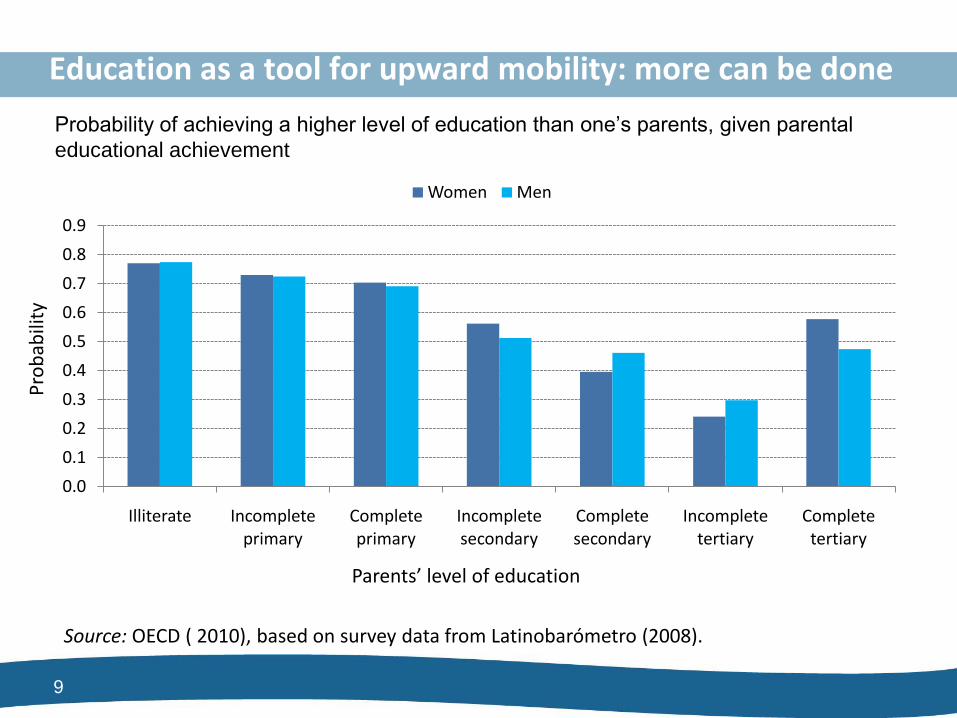
Probability of achieving a higher level of education than one’s parents, given parental
educational achievement
Education as a tool for upward mobility: more can be done
0.0
0.1
0.2
0.3
0.4
0.5
0.6
0.7
0.8
0.9
Illiterate Incomplete primary
Complete primary
Incomplete secondary
Complete secondary
Incomplete tertiary
Complete tertiary
Women Men
Source: OECD ( 2010), based on survey data from Latinobarómetro (2008).
Parents’ level of education
Pro
bab
ility
10
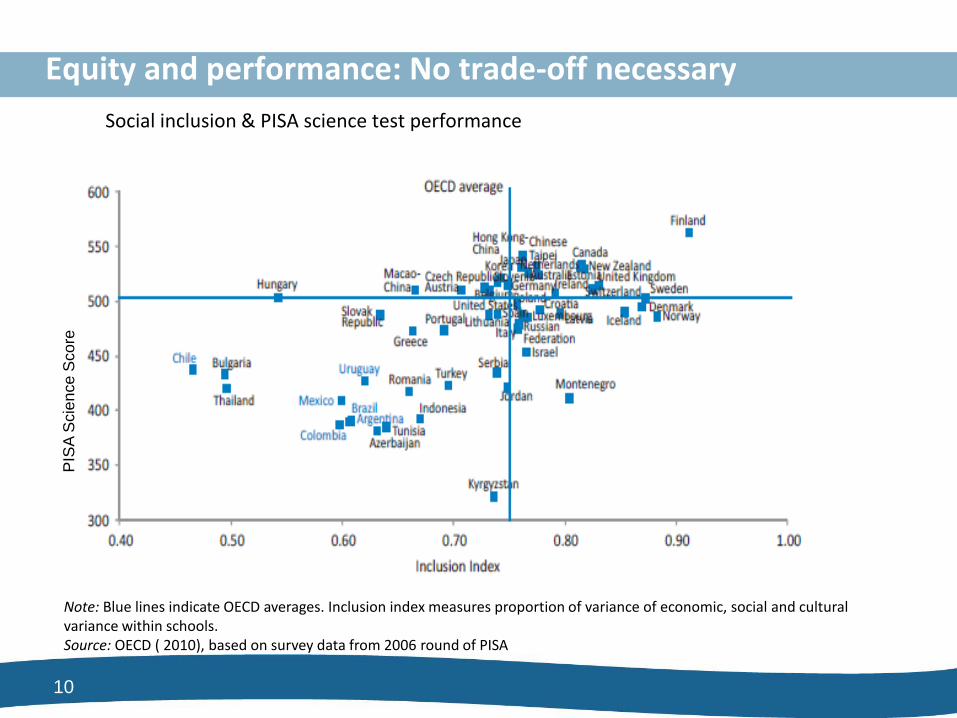
Social inclusion & PISA science test performance
Note: Blue lines indicate OECD averages. Inclusion index measures proportion of variance of economic, social and cultural variance within schools.Source: OECD ( 2010), based on survey data from 2006 round of PISA
Equity and performance: No trade-off necessary P
ISA
Scie
nce
Sco
re
11
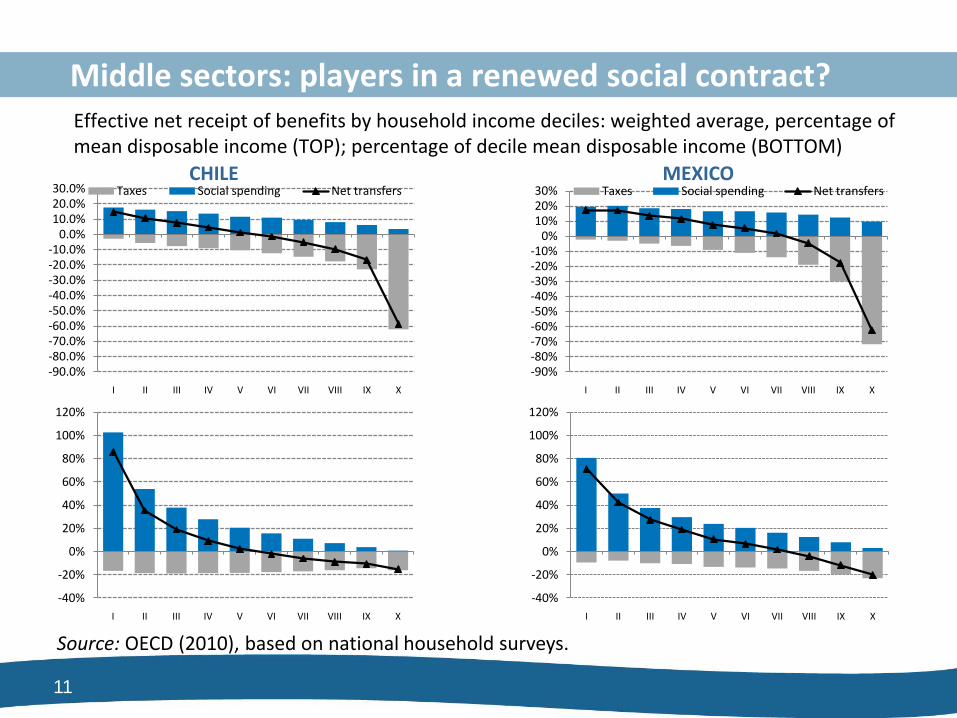
Effective net receipt of benefits by household income deciles: weighted average, percentage of mean disposable income (TOP); percentage of decile mean disposable income (BOTTOM)
Middle sectors: players in a renewed social contract?
-90.0%-80.0%-70.0%-60.0%-50.0%-40.0%-30.0%-20.0%-10.0%
0.0%10.0%20.0%30.0%
I II III IV V VI VII VIII IX X
Taxes Social spending Net transfersCHILE MEXICO
-90%-80%-70%-60%-50%-40%-30%-20%-10%
0%10%20%30%
I II III IV V VI VII VIII IX X
Taxes Social spending Net transfers
-40%
-20%
0%
20%
40%
60%
80%
100%
120%
I II III IV V VI VII VIII IX X
-40%
-20%
0%
20%
40%
60%
80%
100%
120%
I II III IV V VI VII VIII IX X
Source: OECD (2010), based on national household surveys.

12
Taxation and satisfaction with public services
30
35
40
45
50
55
60
Q1 Q2 Q3 Q4 Q5
"Good Citizens pay their taxes"(percentage of respondents who agree)
25
30
35
40
45
50
Q1 Q2 Q3 Q4 Q5
"Taxes are too high"(percentage of respondents who agree)
25
27
29
31
33
35
37
Q1 Q2 Q3 Q4 Q5
"Tax evasion is never justified"(percentage of respondents who agree)
-
20
40
60
80
100
Q1 Q2 Q3 Q4 Q5
Satisfaction with health services(percentage of respondents)
Satisfied
Not Satisfied
No Access
Source: OECD ( 2010), based on survey data from Latinobarómetro (2007-8).
www.latameconomy.org
www.oecd.org/dev
Jeff Dayton-Johnson
Head, Americas Desk
OECD Development Centre
Thank you Obrigado
Gracias Merci
How middle-class is Latin America?
Paradoxes of well-being
Latin American Conference on Measuring Well-Being
and Fostering the Progress of Societies
Mexico DF, May 2011
14
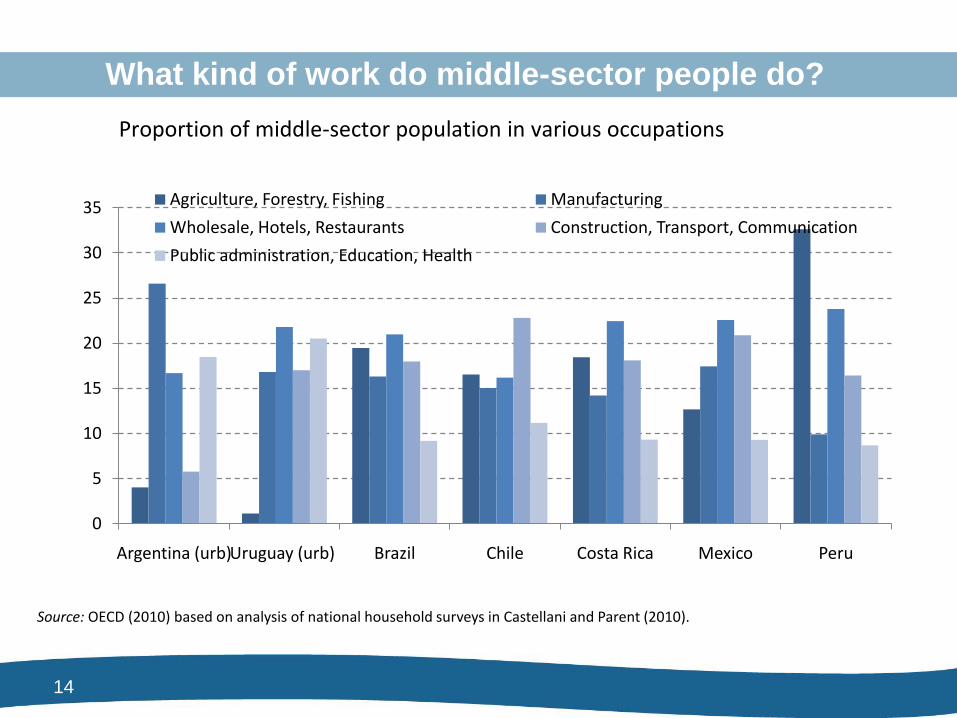
What kind of work do middle-sector people do?
0
5
10
15
20
25
30
35
Argentina (urb)Uruguay (urb) Brazil Chile Costa Rica Mexico Peru
Agriculture, Forestry, Fishing Manufacturing
Wholesale, Hotels, Restaurants Construction, Transport, Communication
Public administration, Education, Health
Source: OECD (2010) based on analysis of national household surveys in Castellani and Parent (2010).
Proportion of middle-sector population in various occupations
15
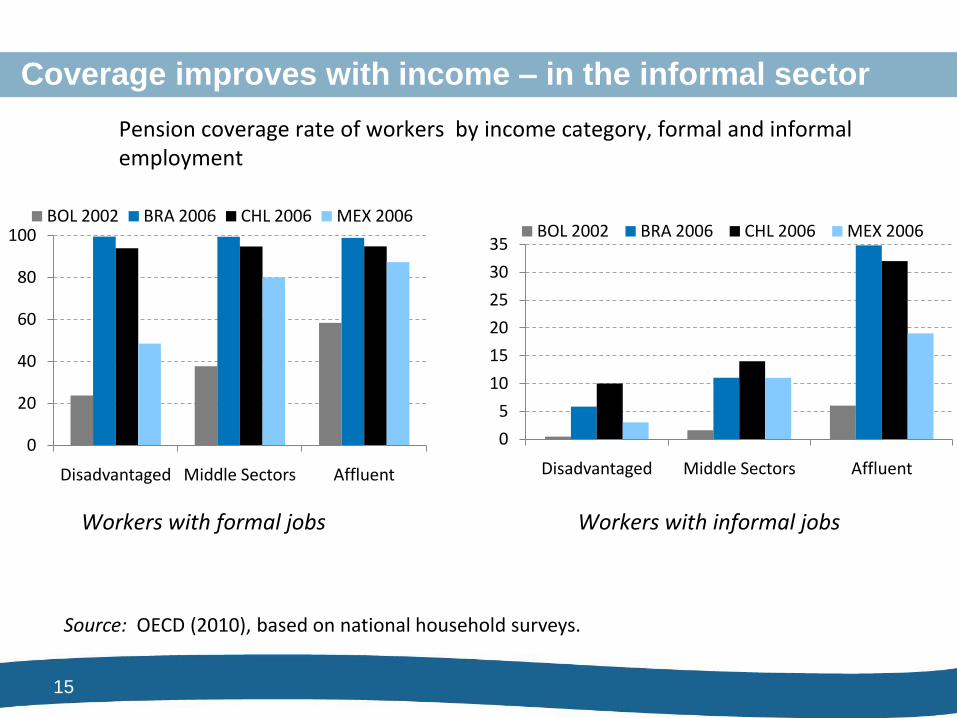
Coverage improves with income – in the informal sector
sector
Source: OECD (2010), based on national household surveys.
0
20
40
60
80
100
Disadvantaged Middle Sectors Affluent
BOL 2002 BRA 2006 CHL 2006 MEX 2006
0
5
10
15
20
25
30
35
Disadvantaged Middle Sectors Affluent
BOL 2002 BRA 2006 CHL 2006 MEX 2006
Workers with formal jobs Workers with informal jobs
Pension coverage rate of workers by income category, formal and informal employment
16
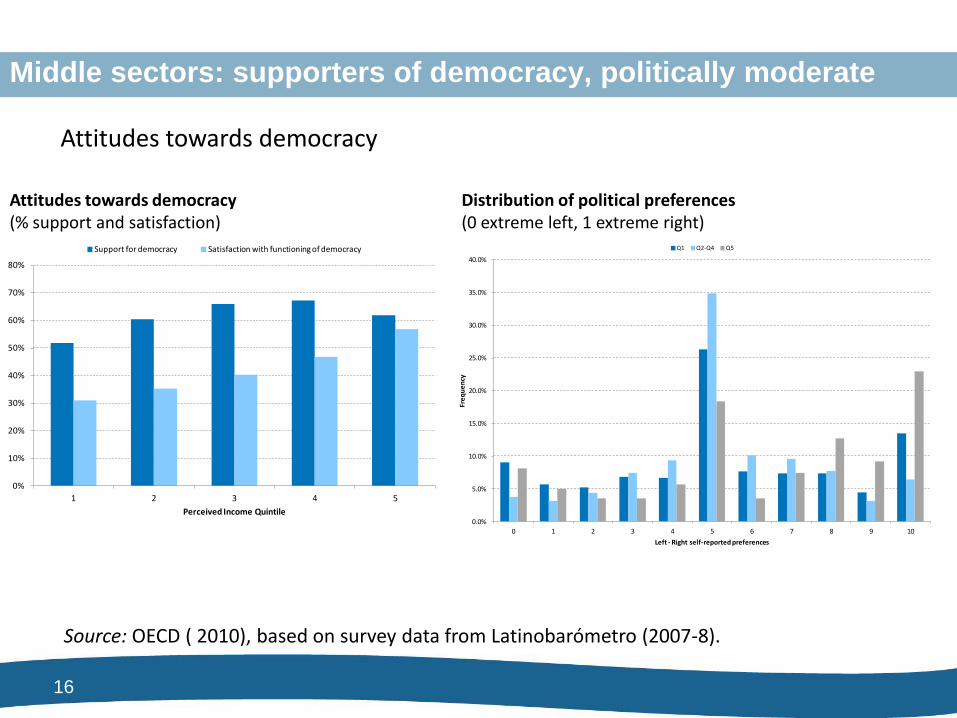
Middle sectors: supporters of democracy, politically moderate
Attitudes towards democracy(% support and satisfaction)
Distribution of political preferences(0 extreme left, 1 extreme right)
Attitudes towards democracy
0%
10%
20%
30%
40%
50%
60%
70%
80%
1 2 3 4 5
Perceived Income Quintile
Support for democracy Satisfaction with functioning of democracy
0.0%
5.0%
10.0%
15.0%
20.0%
25.0%
30.0%
35.0%
40.0%
0 1 2 3 4 5 6 7 8 9 10
Fre
qu
en
cy
Left - Right self-reported preferences
Q1 Q2-Q4 Q5
Source: OECD ( 2010), based on survey data from Latinobarómetro (2007-8).
17
The Outlook: Main Messages
• The middle sectors in Latin America are economically vulnerable
• Labour informality – and low social protection coverage – are particularly
prevalent among the middle sectors
• Education is a powerful motor of intergenerational social mobility: but one
that isn’t working particularly well in Latin America
• The middle sectors are disposed to pay taxes – if they receive public goods
of reasonable quality in exchange.
18
The Outlook: Policy Recommendations
• Flexible social protection policies must be put in place to arrest
downward social mobility and an increase in inequality
• Early childhood education, as well as better quantity and quality of
secondary education would bolster the role of human capital as a
means of climbing the social ladder
• Tax reform must be accompanied -- or preceded -- by improvements in
the quality of public spending