Embed Size (px)
Citation preview

Ann. Physik 1 (1992) 380-385
Annalen der Physik
0 Johann Ambrosius Barth 1992
How many spectral lines are statistically significant?
J. Freund
Fachbereich Physik, Universitat Paderborn, W-4790 Paderborn, Germany
Received 28 April 1992, accepted 21 May 1992
Abstract. When experimental line spectra are fitted with least squares techniques one frequently does not know whether n or n + 1 lines may be fitted safely. This paper shows how an F-test can be applied in order to determine the statistical significance of including an extra line into the fitting routine.
Keywords: F-test; Spectroscopy; Statistical significance.
Contemporary scientific work is characterized by pressure on investigators to reduce as much as possible the time allotted to measurements. Consequently, there is a general inclination to allow a considerable amount of statistical noise and cope with the fact that some of the relevant features of spectra become so weak that they are no longer “obvious”, i. e. non-random with a very high degree of certainty, by visual inspection alone. Since this is true for all areas of science, a large body of literature has evolved in mathematical statistics with the purpose of providing objective means to assist in the evaluation of scientific measurements in terms of their statistical significance or soundness.
However, knowledge of the availability and handling of statistical tests has not yet penetrated sufficiently into every field of experimental science. There is still a tendency of overdoing data interpretation, i. e. of presenting quantitative results without prior investigation as to their statistical significance. The purpose of this paper is a demonstra- tion of how to show statistically whether a certain feature in a spectrum is indeed of physical nature and to what degree of certainty such a statement can be made.
In a previous paper [I] the fitting of a filtered EXAFS (x-ray-absorption fine-structure) spectrum was treated. The question was whether a given data set contains n or n + 1 physical parameters. The (n + 1)-th parameter was supposed to give information on anharmonic contributions of interatomic potential parameters. The ambiguity was resolved after application of an F-test.
More generally, one is faced with the problem of fitting a data set with either n or n + m parameters. A typical absorption or emission spectrum, for example, consists of a series of spectral lines which can usually be represented by a function consisting of three parameters for each line: position, height and width. A spectrum consisting of n/3 (with n = 3, 6 , . . .) spectral lines thus requires n fit parameters. If one is not satisfied with the goodness-of-fit statistic, x2, of the n parameter fit, one may want to redo the fit with ( d 3 ) + 1 spectral lines, i. e. n + 3 fit parameters, and recalculate x2. If, and only if, it turns out that the reduction of x2 is statistically significant one may say that the

J. Freund, How many spectral lines are significant? 38 1
spectrum contains (n/3) + 1 rather than n/3 spectral lines. The statistical significance can be tested with an F-test. This paper shows how such a test is to be performed.
For the sake of clarity, the simplest possible problem is investigated, viz. the question of whether a given spectrum contains 1 or 2 spectral lines, i. e. whether 3 or 6 parameters have to be fitted. An artificial spectrum, the so-called parent function, was produced consisting of 2 Lorentzians with 6 parent parameters [position: 20(25), full width at half maximum: 8 (4), height: 100(20), for 1st (2nd) line; dimensionless units for abscissas and ordinates]. The parent distribution was superimposed with normally distributed random noise with standard deviations of 2.0, 4.0, 6.0 and 8.0 units, respectively, producing a total of 4 artifical data sets (Figs. 1-4). The question is: For which of these data sets is the fitting of 2 lines rather than 1 line still statistically sound?
First, one calculates the goodness-of-fit statistic, x2, [2, 31 for a 3 parameter fit,
N i s the number of data points (100 in this example), n the number of fit parameters (3 in this example), y? - yifit the vertical distance between the i-th data point and the fit function and a; the uncertainty in y pertaining to data point i. Next, one recalculates the goodness-of-fit statistic for a 6 parameter fit. Finally, the F-statistic is calculated.
In order to do so one calls to mind that upon replacing an n parameter fit by an n + 1 parameter fit the F-statistic is calculated by [ l , 21,
where the subscripts indicate that the F-value thus calculated has 1 degree of freedom in the numerator and N - (n + 1 ) degrees of freedom in the denominator. The superscript (p) indicates that the calculated value of F does not come about by chance with a probability of p .
If we were able to increase the number of fit parameters one by one, we would then test the (n + 2)th parameter by,
and finally the (n + 3)th parameter by,
Since we have to go directly from an n parameter fit to an n + 3 parameter fit, Eqs. (2a), (2b) and (2c) are multiplied giving,

382 Ann. Physik 1 (1992)
After noting t h a t N - n = N - (n + 1 ) = N - (n + 2) = N - (n + 3) f o r N % n, we solve for Ff,N-(n+2) to obtain,
The value of Ff,N-(n+2) thus calculated must be compared with the corresponding tabulated values, such as those given in references [4,5]. A short F-table is also given here (Tab. 1). I f the calculated F exceeds the listed Fa t a given probability level, p , one may say that it is statistically significant with a probability of at least p to include an extra spectral line with 3 new degrees of freedom.
Table 1 F-table for 4 probability levels.
N - ( n + 2) p = 95% p = 99% p = 99.9% p = 99.95%
15 4.54 8.68 16.6 19.5 20 4.35 8.10 14.8 17.2 24 4.26 7.82 14.0 16.2 30 4.17 7.56 13.3 15.2 40 4.08 7.3 1 12.6 14.4 60 4.00 7.08 12.0 13.6
120 3.92 6.85 11.4 12.8 03 3.84 6.63 10.8 12.1
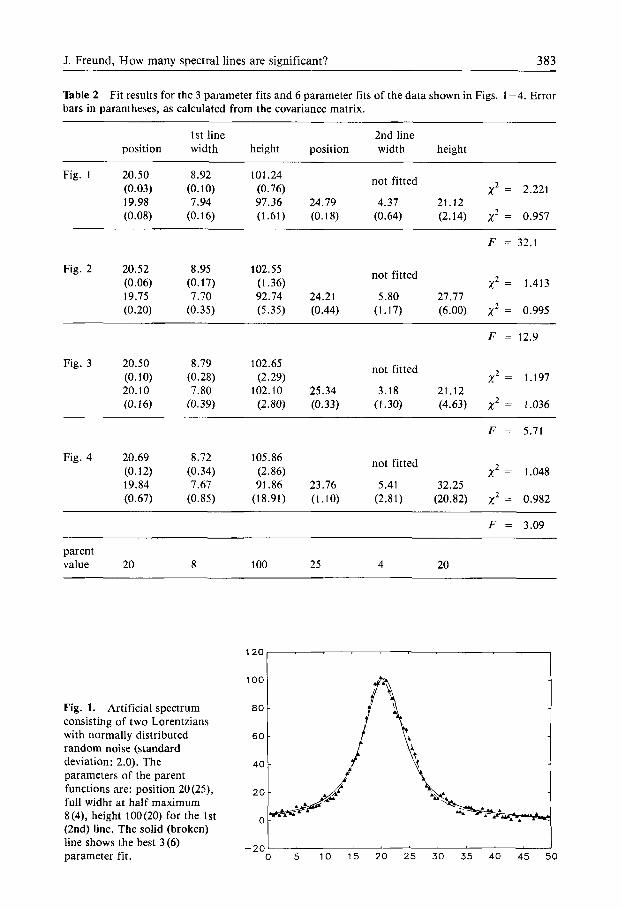
Tab. 2 shows the results for the 3 parameter fits and the 6 parameter fits of the data shown in Figs. 1-4. Tab. 2 also contains the calculated values of ,y2 and E:
For N - (n + 2) = 95 degrees of freedom in the denominator the critical F-values are (after interpolation between the entires for 60 and 120) about 3.95, 6.95, I 1.7 and 13. I for probabilities of 95%, 99%, 99.9% and 99.95’70, respectively. Therefore, fitting 2 lines rather than 1 line is certainly justified in Fig. 1 with its F of 32.1. The 2nd line is also “immediately obvious” from visual inspection of Fig. 1. However, the height of the 1 st line is fitted less accurately in the 2 line fit (parent value: 100).
For Fig. 2, with its 2nd line being less “obvious”, an F of 12.9 is calculated which corresponds to a significance level of approximately 99.95%. One would, in most cases, do a 2 line fit under these circumstances. As in Fig. 1 , this would yield improved values for position and width of the 1 st line (parent values: 20 and 8, respectively), however a considerable decrease in the accuracy of the height of the 1st line would have to be accepted.
For Fig. 3 with its F o f 5.71 the statistical significanceis between 95% and 99%. Visual inspection does not give a clue about the existence of a 2nd line. Astonishingly enough,
J. Freund, How many spectral lines are significant? 383
Table 2 Fit results for the 3 parameter fits and 6 parameter fits of the data shown in Figs. 1-4. Error bars in parantheses, as calculated from the covariance matrix.
1st line 2nd line position width height position width height
not fitted Fig. I 20.50 8.92 101.24 (0.03) (0.10) (0.76) x2 = 2.221 19.98 7.94 97.36 24.79 4.37 21.12 (0.08) (0.16) (1.61) (0.18) (0.64) (2.14) x2 = 0.957
Fig. 2 20.52 8.95 102.55 (0.06) (0.17) (1.36)
not fitted
F = 32.1
x2 = 1.413 19.75 7.70 92.74 24.21 5.80 21.77 (0.20) (0.35) (5.35) (0.44) (1.17) (6.00) x2 = 0.995
F = 12.9
not fitted 2 Fig. 3 20.50 8.79 102.65
(0.10) (0.28) (2.29) x = 1.197 20.10 7.80 102.10 25.34 3.18 21.12 (0.16) (0.39) (2.80) (0.33) (1.30) (4.63) x2 = 1.036
F = 5.71
not fitted Fig. 4 20.69 8.12 105.86 (0.12) (0.34) (2.86) xZ = 1.048 19.84 7.61 91.86 23.76 5.41 32.25 (0.67) (0.85) (18.91) (1.10) (2.81) (20.82) x2 = 0.982
F = 3.09
parent value 20 8 100 25 4 20
120 I 100 -
Fig. 1. Artificial spectrum 80 - consisting of two Lorentzians
random noise (standard
parameters of the parent functions are: position 20(25), full widht at half maximum 8(4), height lOO(20) for the 1st (2nd) line. The solid (broken) line shows the best 3 (6)
with normally distributed 60 -
deviation: 2.0). The 40 -
-20 parameter fit. 0 5 10 15 20 25 30 35 40 45 50

3 84 Ann. Physik 1 (1992)
- 2 0 ' o 5 1 0 1 5 20 25 30 35 40 45 50 of random noiseis4.0.
120
Fig. 2. however, standard deviation
As in Fig. 1 ,
Fig. 3. however, standard deviation
As in Fig. 1,
_. 0 5 10 15 20 25 30 35 40 45 50 of random noiseis 6.0.
120
100
80
60
40
20
C
-2c
\. \
,~ \
/+A , n
. I -. 5 10 15 2 0 25 30 35 40 45
Fig. 4. however, standard deviation of random noise is 8.0.
As in Fig. 1 ,
1

J. Freund, How many spectral lines are significant? 385
all fit results of the 2 line fit come closer to their parent values than in the 2 line fit of Fig. 2. Also, for the first time, the height of the 1st line fits more reliably in the 2 line fit. Thus, omission of the 2nd line in the fitting of Fig. 3 would be a real loss of information. I t is these cases where the F-test is particularly valuable since, without knowledge of the 95% -99% reliability, one would, or should, be reluctant to accept a 2nd line in Fig. 3.
Finally, in Fig. 4 the significance of including a 2nd line is well below 95%. This means that, in general, the 2 line fit should principally be rejected. Even though fit results for position and width of the 1st line improve upon including a 2nd line, the fitted values of both heights as well as of the width of the 2nd line deviate considerably from their parent values. As expected, the fitting of 2 lines in Fig. 4 does not give meaningful information.
This paper has shown that a very simple procedure is sufficient to guide data analysts in their decision of the proper fit function. It would be advantageous if this or any other objective method were employed on a regular basis when experimental data are fitted with the purpose of obtaining physical information from the fitted parameters.
References
[ I ] J. Freund, Phys. Lett. A157 (1991) 256 [2] Ph. R. Bevington, Data reduction and error analysis for the physical sciences, Mc Craw-Hill, New
[3] W. H. Press, B. P. Flannery, S. A. Teukolsky, W. T. Vetterling, Numerical recipes, Cambridge Univ.
[4] G. W. Snedecor, W. G. Cochran, Statistical methods, 6th ed., Iowa State Univ. Press, Ames 1967 [ 5 ] W. J. Dixon, F. J. Massey, Jr., Introduction to statistical analysis, Mc Craw-Hill, New York 1969
York 1969
Press, Cambridge 1986