Embed Size (px)
Citation preview

How Energy Choices Affect Fresh Water Supplies: A Comparison of U.S. Coal and Natural Gas
Briefing Paper 2
Emily Grubert
Saya Kitasei
November 2010
Natural Gas and Sustainable Energy Initiative
1
How Energy Choices Affect Fresh Water Supplies:
A Comparison of U.S. Coal and Natural Gas
Emily Grubert and Saya Kitasei
I. Introduction
Water and energy are critical and interdependent resources. The production and use of energy
requires both the withdrawal and consumptiona of water and represents one of the largest
demands on fresh water in the United States. In 2005, U.S. power plant cooling systems
withdrew 143 billion gallons of fresh water per day, accounting for 41 percent of domestic fresh
water withdrawals. Mining and fuel extraction withdrew an additional 2 billion gallons per day. 1
Fresh water in turn requires energy to be pumped, treated, and transported before it can be used.
In a 2003 study by the Government Accountability Office, water managers in 36 of 47 surveyed
U.S. states predicted that their states or regions would face water shortages by 2013.2 The study
warned that the depletion of groundwater aquifers, the rising demand for fresh water, and the
potential impacts of climate change could all reduce water availability.
Declining water availability is already limiting energy choices. Over the past decade, concerns
about water availability have halted power plant construction or operation in the U.S. states of
Arizona, California, Colorado, Georgia, Massachusetts, Missouri, New Mexico, North Carolina,
Pennsylvania, Rhode Island, South Dakota, Tennessee, Texas, and Washington.3 As state and
local governments around the country plan their electricity generation mix for the coming years,
they will need to consider the water dimension of their decisions.
A shift from reliance on coal-fired steam-turbine generators (which provided about 44 percent of
U.S. electricity generation in 2009) to combined-cycle plants fueled by natural gas (about 19
percent of generation) could have a profound effect on the power sector’s water demands.4 The
relatively high efficiency of natural gas combined-cycle (NGCC) plants means that they generate
electricity using less fuel and creating less than half the greenhouse gas emissions that coal
plants do.5 Moreover, NGCC plants consume one-tenth to one-half as much fresh water as
conventional coal plants do to generate each unit of electricity—a critical advantage in regions
where water shortages present as urgent a concern as air pollution and climate change.6
A newfound abundance of economically viable natural gas from unconventional reservoirs,
combined with tightening air-quality standards and/or carbon constraints, could enable natural
gas to claim a large share of the U.S. power market from coal.7 This should reduce water demand
at the power plant. However, complete comparisons of coal- and natural gas-generated electricity
must account for water demands during the full fuel cycle. For example, extracting
unconventional natural gas, including shale gas, tight gas, and coalbed methane, often requires
a Withdrawal refers to the removal of water from a natural source, which may be either returned to the
source or consumed.
2
significantly more water than conventional natural gas extraction because of the use of hydraulic
fracturing, a water-intensive well-stimulation technique.8
This paper examines the impacts on U.S. fresh water resources of generating electricity from
coal and natural gas, from the point of fuel extraction through the fuel’s use at the power plant.
Although fuel extraction can require locally significant quantities of water, by far the largest
water consumer in the life cycle of electricity is power plants—which can be responsible for
more than 90 percent of the water consumed to produce a kilowatt-hour of electricity.9
NGCC power plants generally use less water per unit of electricity generated than coal power
plants due to higher efficiency and less need for emissions controls (which in many cases
represent an extra water use at coal plants). Thus, shifting generation from coal to natural gas
should reduce the electricity sector’s water needs whether unconventional or conventional
natural gas is used.
This paper also finds that coal extraction has higher potential for long-term degradation of water
resources than does natural gas extraction. However, the quantitative and qualitative water
impacts of fuel extraction vary by site and method. Using natural gas instead of coal will likely
involve less damage to the fresh water system, with localized exceptions.
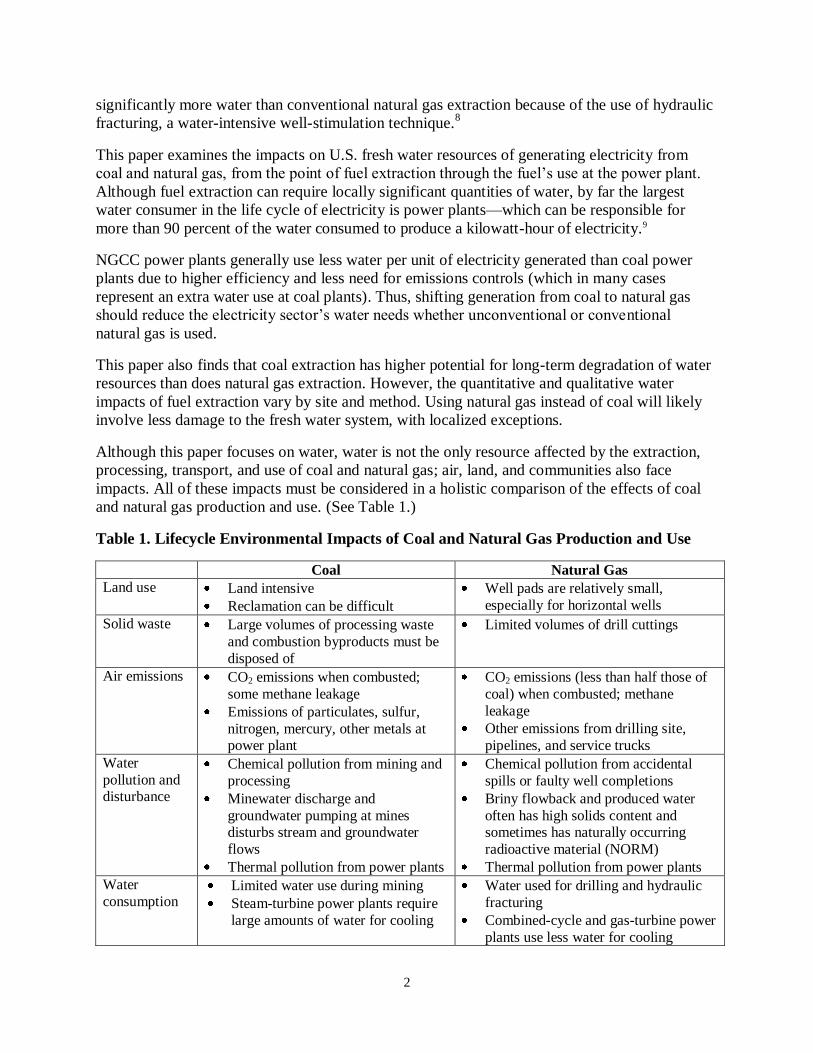
Although this paper focuses on water, water is not the only resource affected by the extraction,
processing, transport, and use of coal and natural gas; air, land, and communities also face
impacts. All of these impacts must be considered in a holistic comparison of the effects of coal
and natural gas production and use. (See Table 1.)
Table 1. Lifecycle Environmental Impacts of Coal and Natural Gas Production and Use
Coal Natural Gas
Land use Land intensive
Reclamation can be difficult
Well pads are relatively small,
especially for horizontal wells
Solid waste Large volumes of processing waste
and combustion byproducts must be
disposed of
Limited volumes of drill cuttings
Air emissions CO2 emissions when combusted;
some methane leakage
Emissions of particulates, sulfur,
nitrogen, mercury, other metals at power plant
CO2 emissions (less than half those of
coal) when combusted; methane
leakage
Other emissions from drilling site,
pipelines, and service trucks
Water
pollution and disturbance
Chemical pollution from mining and
processing
Minewater discharge and
groundwater pumping at mines disturbs stream and groundwater
flows
Thermal pollution from power plants
Chemical pollution from accidental
spills or faulty well completions
Briny flowback and produced water
often has high solids content and sometimes has naturally occurring
radioactive material (NORM)
Thermal pollution from power plants
Water
consumption Limited water use during mining
Steam-turbine power plants require
large amounts of water for cooling
Water used for drilling and hydraulic
fracturing
Combined-cycle and gas-turbine power
plants use less water for cooling
3
II. Water Impacts from Fuel Extraction, Processing, and Transport
Evaluating the water impacts of displacing coal with natural gas in the power sector requires a
clear understanding of these fuels’ demands on water. Coal and natural gas must be extracted,
processed, and transported before they reach power plants. Each of these stages uses and affects
the supply and quality of water. (See Figure 1.) Unfortunately, quantitative data on how resource
extraction affects water quality and demand are scarce, as water impacts are site-specific
depending on how and where the extraction occurs. In particular, the quality of a coal or natural
gas resource and how close it is to water affects its need for water and its potential to pollute.
Coal
The two main methods for mining coal are surface mining and underground mining. For surface
mining, miners uncover coal by removing the rock at the surface, known as the overburden; for
underground mining, they dig beneath the overburden and work under a rock roof. In the United
States, surface mines account for 69 percent of total coal production, and underground mines for
31 percent.10
Both underground and surface mines are often situated at least partially below the water table, so
miners must pump out water from the working area during much of the mining process (from
pre-excavation until the mine is abandoned). This ―mine dewatering‖ includes removing water
from rain or snow in addition to water that is already in the coal formation. Dewatering
equipment discharges most of the water at the surface, although some operations capture or treat
this water for reuse for dust suppression and other needs.
Mine dewatering can lower water tables for decades, affecting groundwater levels and flow
patterns around the mine for miles. But it can also prevent the long-term exposure of water to
any contaminants in the coal. Coal is highly heterogeneous, with the full range of the world’s
coals containing 76 of the 92 naturally occurring elements.11 Both the combustion of coal and its
exposure to water can release contaminants to the environment, making remediation difficult.
Most U.S. coal mining takes place in two regions: the Appalachian Mountains in the mid-
Atlantic (33 percent) and the Powder River Basin in the Western states of Wyoming and
Montana (42 percent).12
Appalachian coals are characterized by high energy density and
relatively high sulfur content, whereas Western coals are typically lower energy density and low
in sulfur. The United States is expected to obtain a rising share of its coal from the West in the
future, in part because of the lower sulfur emissions released during combustion.
In addition to the coal that can be used for energy, mining involves removing large volumes of
waste rock from the ground. Removal of this rock can disrupt surface and groundwater flows,
and waste rock disposal can bury streams. Rock surfaces that are inert when surrounded by other
rock can oxidize and leach material into water when they are exposed to air and water.

4
5
Coals and waste rock in the eastern United States are particularly problematic, not just because
they release higher sulfur emissions during combustion, but because the sulfur compounds are
reactive when exposed to air and water. Waste rock generally contains more of these
contaminating compounds than coal, and Appalachia’s thin coal seams are often associated with
more waste rock than Western seams, which can be 10 times as thick. And because Appalachian
coal is located in wet, mountainous areas with many streams, coal-related contamination is more
likely to affect the water in this region than in the semi-arid West.
Environmental regulations require that most Eastern coals be processed before they are used in
power plants. Companies remove impurities by crushing the coal into smaller pieces in water,
which adds 1–2 gallons of water demand per million Btu of coal.13
Once used, this water is
discharged to holding ponds and often contains fine coal particles that are difficult to remove.14
Since coals in the West usually have fewer impurities as well as lower energy densities than
those in the East, such preparation before use is often not considered worthwhile for Western
coals.15
Most U.S. coal is transported by rail, barge, or truck, so water usage for transportation is low. At
mine sites, water consumption is usually limited to domestic services such as toilets and showers
for workers and dust suppression, which involves spraying water from the mine on coal piles and
roads to reduce airborne dust. Because contamination from this dust is typically transferred to the
water, the associated pollution is often moved but not eliminated, presenting a major challenge
for mitigation. Coal is usually stored in open piles, so precipitation can become contaminated
runoff as well.
One of coal mining’s greatest impacts on water quality comes from abandoned mines, as water
moves through pits or tunnels in rock surfaces that remain chemically active. Abandoned surface
mines often turn into lakes, whereas underground mines experience groundwater seepage.
Without control measures, new water continuously enters abandoned mines and piles of waste
rock, which means that a poorly remediated mine can contaminate water for decades or even
centuries. Such contamination is a bigger problem in the eastern United States than the West, so
the expected continued shift to Western coals could reduce the negative impacts on fresh water
quality.16 But because water associated with Western coals is often of high quality, containing
few contaminants, mining in the region can deplete already-scarce water resources that could be
used for other purposes.
After mining ceases, reclaimed mine sites continue to consume water to reestablish vegetation,
although the amount varies by climate. In the U.S. West, estimates of this usage range from
616,000 liters to 925,000 liters of high-quality water per acre of reclaimed land annually, over a
10-year period.17
In 2009, Central Appalachia produced some 196 million short tons of high-sulfur, bituminous
coal—18 percent of the U.S. coal supply—from 399 underground and 403 surface mines.18
Because coal seams in the region are thin—between 3 and 15 feet—mining companies may use
mountaintop removal to access seams that are less than 30 inches thick. This involves stripping
the tops of mountains and pushing waste rock into adjacent valleys. Mountaintop removal
generates large volumes of waste rock that may be stored in impoundment slurry dams or large
tailings piles, which can bury or eliminate streams.
6
Water flow following mountaintop removal can liberate contaminants such as pyrite and heavy
metals, creating acid mine drainage (AMD) and other contaminated runoff.19
AMD is associated
with certain sulfur compounds and is highly damaging to water quality, particularly since the
acid can dissolve other contaminants into water. AMD is also persistent: rocks containing sulfur
can produce AMD as long as air and clean water are in contact with an exposed coal seam.
Wyoming and Montana’s Powder River Basin is the largest U.S. source of coal, with only 17
mines accounting for 496 million short tons, or 42 percent, of domestic production.20
The basin
is expected to provide an even larger share in the future.21 Extremely thick seams (up to 150 feet)
of low-sulfur, sub-bituminous coal are exploited through open-pit surface mines.
Because coal-mining areas in the U.S. West are less mountainous than in the East, there are
fewer headwater streams that can be affected by mining. Even when Powder River Basin coal
does impinge on water resources, it does not pose as great a risk of contamination as
Appalachian coals because it contains lower levels of sulfur, heavy metals, and other
contaminants.22 In some areas, the coal even acts as a natural filter and holds potable water—
creating a tension between developing coal resources and preserving high-quality water supplies
for drinking, livestock, and irrigation.
Some of the water in Western mines has high levels of sodium, which can negatively affect soils
when the water is discharged.23 The potential negative impact on agriculture from pumping water
and sodium contamination is one reason that Montana has restricted mining in its portion of the
Powder River Basin.24
Natural Gas
The United States produced 21 trillion cubic feet (tcf) of natural gas in 2009.25
Up until 2008,
most of the nation’s natural gas was produced from ―conventional‖ reservoirs, which have
relatively high permeability, enabling natural gas to flow easily to drilled wells. More recently,
production in less-permeable ―unconventional‖ reservoirs, including tight sands, deep shales, and
natural gas-bearing coalbeds, has overtaken conventional production and is projected to grow
through 2030 at least.26
As with coal, the water needs and risks of natural gas extraction depend
on geology and geography. In general, natural gas production from unconventional reservoirs
requires more water than production from conventional reservoirs.
Both conventional and unconventional natural gas drilling use water to lubricate and cool the
drill bit, consuming hundreds of thousands of gallons per well. The ―drilling mud‖ that results
can contain toxins, posing a disposal challenge: it may be injected underground; treated and then
reused or released; or dried and disposed of. Similarly, both conventional and unconventional
wells can produce naturally occurring water from the reservoir rock. This ―formation water‖ has
typically spent millions of years in contact with ancient rock formations and can therefore
contain high concentrations of salts, naturally occurring radioactive material (NORM), and other
contaminants including arsenic, benzene, and mercury.27 Produced water volumes vary by basin:
they are generally low for deep shale wells, due to the extreme temperature and pressure, and
high for coalbed methane wells, which must be dewatered.
All natural gas wells are subject to accidents such as blowouts, improper well construction and
abandonment, and contamination associated with the disposal of drilling mud and produced
7
water. Any structure that penetrates water aquifers, such as a well, has the potential to
contaminate these water sources.
After it is extracted, natural gas must be processed, transported, and stored for use. Natural gas
processing uses about two gallons of water per million Btu of natural gas, removing liquid
hydrocarbons, acid gases, carbon dioxide, and water vapor to produce a nearly pure methane
stream.28 Transportation in pipelines requires an additional one gallon of water per million Btu.29
Natural gas can be stored in oil or gas reservoirs, aquifers, or salt caverns. Salt cavern storage has
the highest water impact, as salt must be dissolved with a one-time use of 500–600 gallons of
water per million Btu of capacity, yielding a briny waste stream. This represents 4 percent (and
growing) of U.S. natural gas storage volume.30
Other storage options for natural gas use little
water.
For unconventional natural gas production, the major additional water need is associated with
―hydraulic fracturing,‖ a commonly used technique that enables drillers to extract natural gas
from rock with low permeability, or interconnected spaces. The goal is to give natural gas
molecules a pathway to the wellbore by stimulating and propping open fractures in the rock
formation containing the natural gas. The fracturing is accomplished by pumping 2–4 million
gallons of water mixed with sand and chemical additives into the gas-bearing layer of rock at
high pressures.31 The water used for fracturing is often transported in trucks and stored in tanks at
drilling sites. The substantial transportation needs associated with moving water can stress
nearby stream banks, contributing to erosion and adding sediment to surface water.32
Once in the ground, a large portion of the fracturing fluid may be trapped in the target
formation.33 The rest is pumped to the surface as ―flowback,‖ combined with any water
―produced‖ from the formation itself.34 Both flowback and produced water represent large waste
streams that must be disposed of in injection wells or evaporation pits, or municipal treatment
plants, or treated and reused to fracture future wells. Where injection or evaporation are not
locally tenable, waste water must be trucked to a treatment or disposal site (which increases truck
traffic) or recycled and reused in other fracture jobs. Numerous efforts to make produced water
reusable for fracturing are under way.35 If flowback and produced water are disposed of
improperly, or if the well is poorly constructed, waste water or natural gas (methane) can
contaminate surface water, threatening public and environmental health.36
With shale gas production, the two major pathways to water contamination are activities at the
surface and errors below ground. At the surface, water resources—particularly stream banks—
can be disturbed by truck traffic associated with wellpad construction, day-to-day industrial
activity, and in particular, trucking water to and from the site for fracturing and then disposal.
Other surface risks include chemical spills and leaching from produced water and flowback
stored above ground. Mitigation options do exist, however. Good road planning and reduced
truck traffic can protect stream banks. Using more benign chemicals or stricter handling
standards reduces the risk of harmful chemical spills. And better water-disposal practices,
including lining storage pits and treating water on site, can reduce contamination risk from
produced water.
Errors below ground can endanger water resources during shale gas production as well. Properly
casing wells mitigates substantially the risk of contamination when an aquifer is penetrated. One
element of this is identifying zones that need to be isolated in order to prevent potential shallow
8
pockets of natural gas in formations above the target layer from entering into ground water.37
Another way to mitigate the risk of contamination during aquifer penetration is by using
horizontal wells rather than vertical wells: horizontal wells allow drillers to produce natural gas
from a much larger region using fewer wells, thus penetrating aquifers less frequently. When
multiple horizontal wells are drilled from one well pad, the risk of contamination is reduced even
further since any problems will be localized to that area.38
Conventional natural gas has a low extraction-related water footprint, largely because
conventional wells do not require hydraulic fracturing. Shale gas, tight gas, and coalbed
methane, however, can use and affect much larger amounts of water during their extraction,
raising concerns that switching from coal to natural gas could be less benign for water supplies if
an increasing share of natural gas is produced from unconventional formations.
Unconventional natural gas has rapidly gained importance in the United States. Estimates of
potential shale gas resources have increased dramatically in the past two years and now stand at
616 tcf, or 33 percent of potential U.S. natural gas resources.39
Most natural gas-bearing shales in
the United States are located thousands of feet below the Earth’s surface, and all have very low
permeability, necessitating horizontal drilling and hydraulic fracturing. Approximately 163 tcf of
potential natural gas resources are thought to exist in coal seams as coalbed methane.40
Coalbed
methane basins are generally shallower than shales and can be located in drinking water aquifers,
meaning that wells must be dewatered rapidly and that hydraulic fracturing can pose a greater
risk of water contamination.
The Barnett Shale in Texas has served as a testing ground for hydraulic fracturing and
horizontal drilling techniques in shales. One concern in this region, which is highly urbanized, is
the high quality of water used for natural gas wells: potable water from both fire hydrants and the
Dallas-Fort Worth airport is used for drilling and fracturing. Barnett wells use an average of
250,000 gallons of drilling water per well and 3.8 million gallons of fracturing water each time a
well is hydraulically fractured.41
Water is disposed of through injection wells or recycled for
further fracturing jobs.42
Barnett wells produce very little formation water and an average of 2.7
billion cubic feet (bcf) of natural gas over their lifetimes.43
The Marcellus Shale underlying much of Appalachia presents challenging terrain in sensitive
watersheds. Marcellus wells are drilled with air mists and water- or oil-based muds, requiring
some 80,000 gallons of water for drilling and 3.8 million gallons for hydraulic fracturing per
well.44
Recovered fracture fluids are disposed of primarily through treatment and discharge or
recycling, although water treatment plants already are proving inadequate to deal with the
volumes and high salinity flowback.45
Safe fluid disposal is likely a greater challenge than water
availability, especially since few injection wells for water disposal exist in the Marcellus due to
challenging geology: water must be treated and recycled or discharged, which poses a
contamination risk for surface and ground water.46 However, water availability can be a barrier
when stream flows are low, as in the summer, and even relatively small withdrawals can affect
aquatic life. Marcellus wells produce about 3.7 bcf of natural gas over their lifetimes and almost
no formation water.47
The San Juan Basin is a mature coalbed methane field in the Four Corners area of the U.S.
Southwest. Unlike shale and tight gas reservoirs, coalbeds must be dewatered to reduce pressure
and maximize natural gas production.48 Water content and quality varies throughout the San Juan
9
Basin, with wells producing between zero and 10,000 gallons of water (average 1,000 gallons)
each day and produced water qualities ranging from potable to as saline as ocean water.49
Produced water is disposed of in injection wells and evaporation ponds.50
San Juan Basin
coalbed methane wells are historically vertical, long-lived, and almost all hydraulically fractured,
with individual well productivity ranging from as little as 1,000 to as much as 500,000 cubic feet
per day.51
Each fracturing job requires 55,000 to 300,000 gallons of water-based fluid, which can
be difficult to recover.52
Estimates for average lifetime recovery vary, with typical values
between 2 and 4 bcf per well.53
The Powder River Basin of Wyoming and Montana is a long-term target for coalbed methane
production. As with the region’s coal mines, water produced from some of the basin’s coalbed
methane wells could have been suitable for municipal consumption, so expansion of this
production in the Powder River Basin could contribute to rapid depletion of high-quality ground
water.54
Wells in the basin generally do not have to be hydraulically fractured and produce an
average of 17,000 gallons (but up to some 170,000 gallons) of high-quality water per day.55
This
water is usually discharged to surface waters, stock ponds, or reservoirs.56
Wells are small, with
average reserves of 0.4 bcf.57
III. Water Impacts at the Power Plant
Natural gas and coal are both used in thermoelectric power stations to generate electricity. Just as
the water implications of fuel extraction, processing, and transport are different for these two
fuels, so too are the water implications at the power plant.
Thermoelectric power represents a significant share of U.S. water usage. In 2005, it accounted
for 143 billion gallons (41 percent) of fresh water withdrawals per day and 58.1 billion gallons
(95 percent) of saline water withdrawals per day.58
Most of the water that is withdrawn is not
consumed: a power plant may take water from the ocean, add heat to it, and return it to the
ocean, withdrawing large amounts but consuming almost none. Even so, returning heated water
to its source can have negative environmental impacts.
In 2009, thermoelectric power plants were responsible for generating about three-quarters of
U.S. electricity.59
Steam-electric generation operates roughly the same way whether it is fueled
by coal, natural gas, biomass, nuclear, solar, or something else: the fuel is used to heat water to
steam using a circulatory system of tubes. This steam converts much of its heat energy to
mechanical energy by expanding through a turbine, which turns a generator that produces
electricity. The steam passes to a heat exchanger or ―condenser,‖ where it is cooled and
condensed to a liquid so it can be moved back easily to be reheated by fuel combustion in the
boiler.
Power plants generally use one of three main types of cooling systems to condense steam: open-
loop and closed-loop cooling (both of which use water), and dry cooling (which uses air). Some
plants use a hybrid dry-wet system to accommodate seasonal variability in water availability and
the plant’s cooling needs. The selection of a cooling technology has impacts on a plant’s water
withdrawal and consumption, construction costs, and efficiency. In general, cold-water cooling
systems allow for more efficient operation.60
10
11
Plant efficiency, or the amount of usable energy a plant creates from the chemical energy
contained in its fuel, also depends on the generating technology, fuel, elevation, age, ambient
temperature, and many other factors. No plant can convert 100 percent of its fuel’s energy into
electricity, and typical efficiencies are between 30 and 40 percent. The rest of the energy is lost
from the system as heat in flue gas or cooling water.61
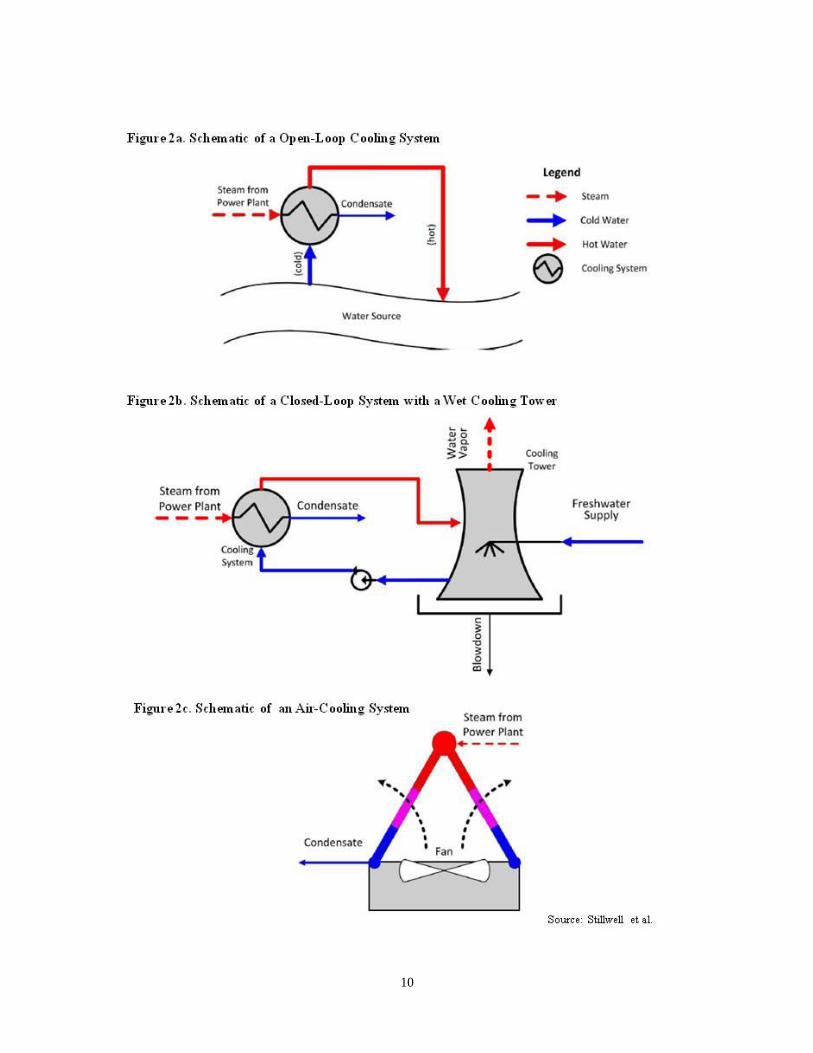
Before 1970, most U.S. thermoelectric power plants used open-loop cooling, where water is
withdrawn from a lake, river, ocean, or other body of water, passed through the condenser, and
then discharged back to its source.62 (See Figure 2.) About 31 percent of current U.S. generating
capacity uses open-loop cooling, responsible for 92 percent of water withdrawals for
thermoelectric power.63
Although water withdrawals for open-loop cooling are high, the amount
of water consumed is generally minor.
However, open-loop cooling systems can damage aquatic ecosystems. Warm water is a form of
thermal pollution, as it reduces the amount of dissolved oxygen available to fish and other
species. Since the passage of the U.S. Clean Water Act in 1972, open-loop cooling systems have
become much less common in new power plants—only about 10 such systems have been built in
the United States since 1980.64
Open-loop cooling systems can also use seawater where it is
available.
Most new U.S. power plants today use closed-loop cooling, a system in which water is pumped
to a cooling tower or pond, where it is stored and cycled through the heat exchanger. Heat is
dissipated through evaporation from cooling towers, which replenish their water supply from a
nearby water source. Closed-loop cooling withdraws much less water than open-loop cooling,
but half or more of the water it uses is lost through evaporation.65
As a result, water consumption
is actually higher for closed-loop systems, although withdrawals and impacts on aquatic
ecosystems are lower.66
Using seawater in cooling towers reduces stress on fresh water
resources, but it also introduces maintenance challenges related to corrosion and mineral build-
up.67
Dry cooling systems use air instead of water to cool power plants. After the steam is collected in
a condenser, the condenser’s tubes are cooled using air that is typically blown across the
condenser with a fan. Dry cooling enables plants to operate in regions where water availability is
extremely limited for all or part of the year.68
However, air is less able to absorb heat than water,
so air cooling reduces overall plant efficiency. This means that more fuel must be consumed and
more emissions created for each unit of electricity.69
Different plant types in the existing U.S. fleet may be more likely to have one type of cooling
system or another. For example, coal-fired generation uses a greater share of open-loop or ―once-
through‖ cooling systems than does natural gas combined-cycle generation, in large part because
these facilities are more likely to predate the 1972 Clean Water Act.70
In addition to cooling systems, coal-fired power plants may use water in ―wet‖ or ―dry‖ flue gas
desulfurization (FGD) devices. These devices remove sulfur dioxide—an air pollutant that can
lead to smog and acid rain—from boiler exhaust. The use of an FGD device has been estimated
to add some 43 liters of water per megawatt-hour (MWh) for a dry system and 257 liters per
MWh for a wet system to a plant’s withdrawals, virtually all of which is consumed.71
The
incremental water consumption attributable to FGD might be equivalent to almost 50 percent of
12
all water consumption in a plant with a wet FGD process and an open-loop cooling system,
whereas it might be less than 10 percent of all water consumption in a plant with a dry FGD
process and a cooling tower.72
(FGD is not necessary in natural gas-fired power plants since
natural gas has its relatively low sulfur content stripped out at gas processing facilities.)
Combusting coal in a power plant produces solid wastes such as coal ash, the noncombustible
portion of coal. About 10 percent of the volume of coal burned becomes ash.73 The ash is
landfilled, recycled, or mixed with water and stored in impoundments, creating large reservoirs
of sometimes-toxic ash suspended in water.74 Ash must be isolated from aquifers and
precipitation to prevent leaching. Spills from impoundment dams can be damaging to surface
waters and the surrounding environment. In 2008, the breach of an impoundment dam at a
Tennessee coal plant released an estimated 5.4 million cubic yards of wet coal ash, destroying
three houses, flooding roads and rails with sludge, and contaminating drinking water with lead
and thallium.75 By contrast, natural gas combustion produces almost no ash.
The type of generating technology also affects a plant’s overall water requirements. U.S. coal-
fired power plants are almost all single-cycle steam-turbine plants that run most of the time.
Natural gas combined-cycle plants are much more efficient and may emit more than 60 percent
less CO2 per kilowatt-hour generated than the average U.S. coal plant.76 Although the United
States has installed some 142 GW of NGCC plants since 2000, these facilities have been
underutilized, due largely to the relatively high prices of natural gas and the persistent use of coal
plants for baseload generation. In 2008, NGCC plants ran at 41 percent of their capacity, while
coal steam-turbine plants ran at almost 73 percent, although this gap narrowed substantially
during 2009 and the first half of 2010.77
Coal-fired steam turbines are the most common power-plant generator technology, accounting
for some 44 percent of U.S. electricity generation in 2009.78
They dominate baseload electricity
generation in many parts of the country, and they historically have been expensive to build but
cheap to run, since coal prices recently have been lower and more predictable than natural gas
prices and the original loans on many older coal plants have now been paid in full. Pulverized
coal is combusted in a boiler, and the resulting heat is used to create steam, which powers a
steam turbine to generate electricity. The boiler operating temperature affects the plant’s
efficiency; supercritical boilers operate at higher temperatures and with consequently higher
plant efficiencies than subcritical boilers.
Some 81 percent of U.S. natural gas generation today takes place in combined-cycle plants,
which generate about 19 percent of the country’s electricity.79
In NGCC systems, a gas turbine is
used to generate electricity, and the waste heat is recovered and used to heat water in a heat
recovery steam generator. The steam is then used to power a steam turbine. Because a portion of
the gas turbine’s waste heat is captured and utilized, NGCC plants often have high thermal
efficiencies, approaching 50 percent. Water is required to condense steam from the steam
turbine, but because the plant also utilizes a gas turbine, which is air-cooled, the water used to
generate a kilowatt-hour of electricity is only about one-third of that required by a subcritical
pulverized coal plant.80
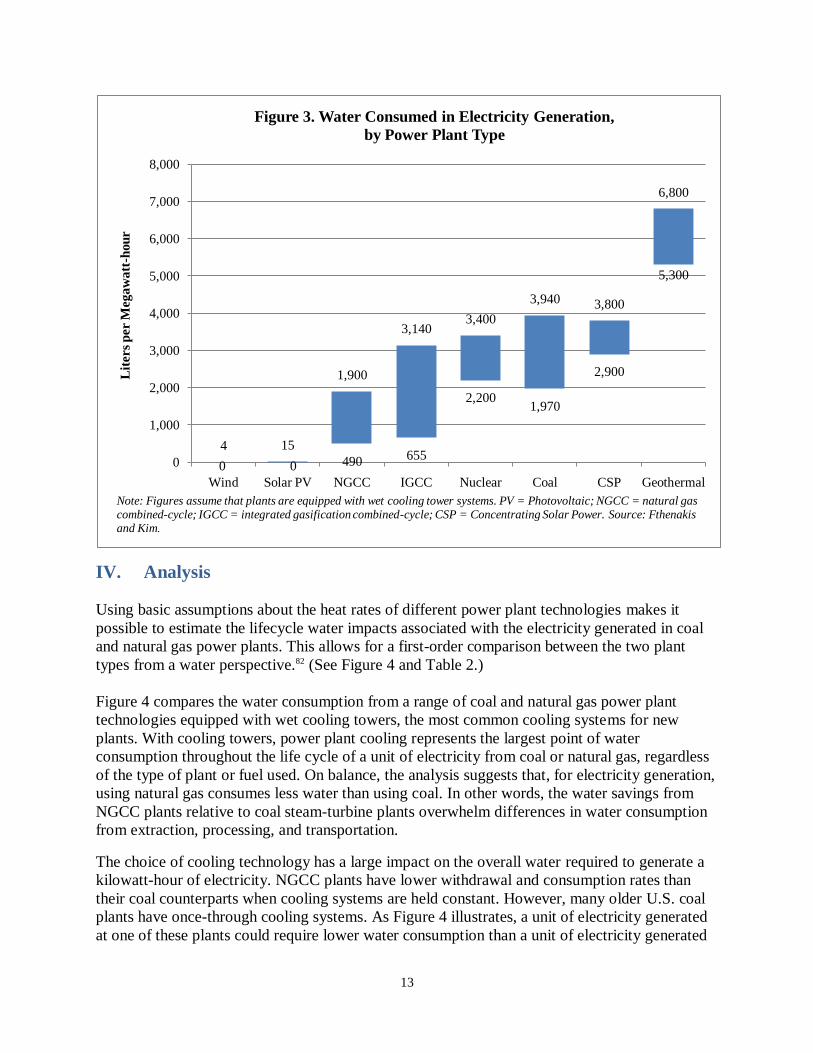
Figure 3 summarizes the estimated water needs for different generating technologies.81
13
IV. Analysis
Using basic assumptions about the heat rates of different power plant technologies makes it
possible to estimate the lifecycle water impacts associated with the electricity generated in coal
and natural gas power plants. This allows for a first-order comparison between the two plant
types from a water perspective.82 (See Figure 4 and Table 2.)
Figure 4 compares the water consumption from a range of coal and natural gas power plant
technologies equipped with wet cooling towers, the most common cooling systems for new
plants. With cooling towers, power plant cooling represents the largest point of water
consumption throughout the life cycle of a unit of electricity from coal or natural gas, regardless
of the type of plant or fuel used. On balance, the analysis suggests that, for electricity generation,
using natural gas consumes less water than using coal. In other words, the water savings from
NGCC plants relative to coal steam-turbine plants overwhelm differences in water consumption
from extraction, processing, and transportation.
The choice of cooling technology has a large impact on the overall water required to generate a
kilowatt-hour of electricity. NGCC plants have lower withdrawal and consumption rates than
their coal counterparts when cooling systems are held constant. However, many older U.S. coal
plants have once-through cooling systems. As Figure 4 illustrates, a unit of electricity generated
at one of these plants could require lower water consumption than a unit of electricity generated
0 0 490655
2,2001,970
2,900
5,300
4 15
1,900
3,1403,400
3,940 3,800
6,800
0
1,000
2,000
3,000
4,000
5,000
6,000
7,000
8,000
Wind Solar PV NGCC IGCC Nuclear Coal CSP Geothermal
Lit
ers
per M
egaw
att
-hou
rFigure 3. Water Consumed in Electricity Generation,
by Power Plant Type
Note: Figures assume that plants are equipped with wet cooling tower systems. PV = Photovoltaic; NGCC = natural gas combined-cycle; IGCC = integrated gasification combined-cycle; CSP = Concentrating Solar Power. Source: Fthenakis and Kim.
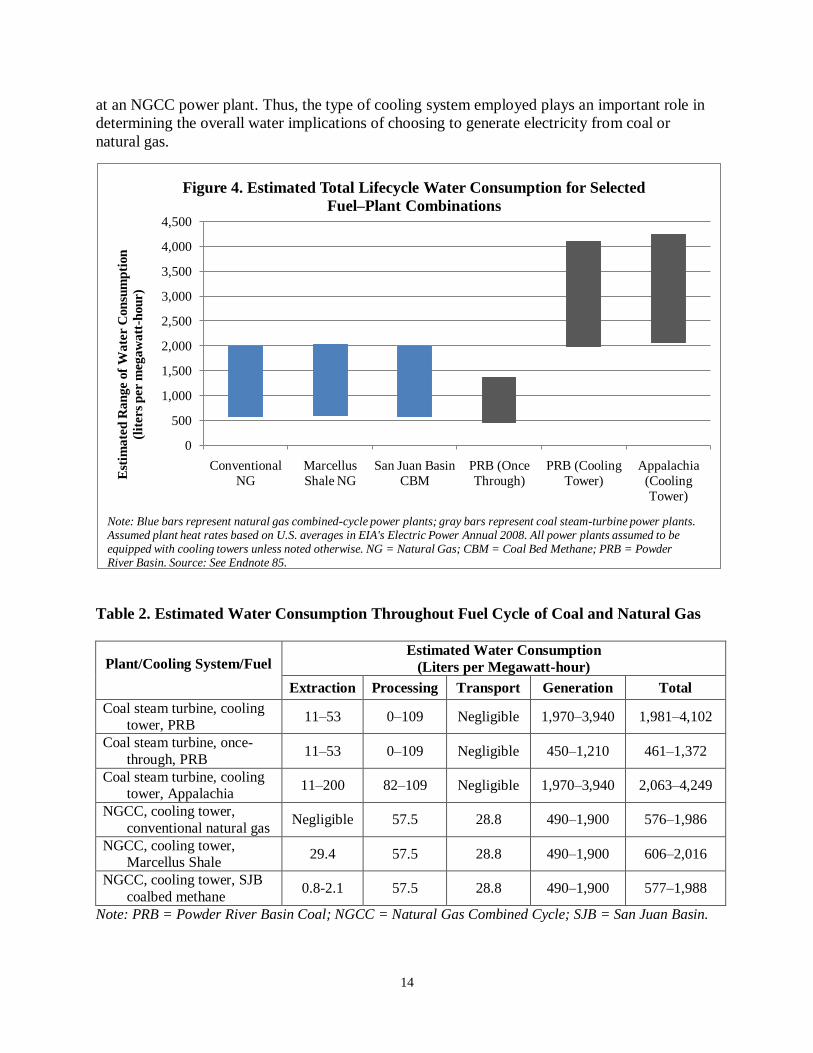
14
at an NGCC power plant. Thus, the type of cooling system employed plays an important role in
determining the overall water implications of choosing to generate electricity from coal or
natural gas.
Table 2. Estimated Water Consumption Throughout Fuel Cycle of Coal and Natural Gas
Plant/Cooling System/Fuel Estimated Water Consumption
(Liters per Megawatt-hour)
Extraction Processing Transport Generation Total
Coal steam turbine, cooling tower, PRB
11–53 0–109 Negligible 1,970–3,940 1,981–4,102
Coal steam turbine, once-
through, PRB 11–53 0–109 Negligible 450–1,210 461–1,372
Coal steam turbine, cooling tower, Appalachia
11–200 82–109 Negligible 1,970–3,940 2,063–4,249
NGCC, cooling tower,
conventional natural gas Negligible 57.5 28.8 490–1,900 576–1,986
NGCC, cooling tower, Marcellus Shale
29.4 57.5 28.8 490–1,900 606–2,016
NGCC, cooling tower, SJB
coalbed methane 0.8-2.1 57.5 28.8 490–1,900 577–1,988
Note: PRB = Powder River Basin Coal; NGCC = Natural Gas Combined Cycle; SJB = San Juan Basin.
0
500
1,000
1,500
2,000
2,500
3,000
3,500
4,000
4,500
Conventional
NG
Marcellus
Shale NG
San Juan Basin
CBM
PRB (Once
Through)
PRB (Cooling
Tower)
Appalachia
(Cooling
Tower)
Est
ima
ted
Ra
ng
e o
f W
ate
r C
on
sum
pti
on
(lit
ers
per m
egaw
att
-hou
r)
Figure 4. Estimated Total Lifecycle Water Consumption for Selected
Fuel–Plant Combinations
Note: Blue bars represent natural gas combined-cycle power plants; gray bars represent coal steam-turbine power plants. Assumed plant heat rates based on U.S. averages in EIA's Electric Power Annual 2008. All power plants assumed to be equipped with cooling towers unless noted otherwise. NG = Natural Gas; CBM = Coal Bed Methane; PRB = Powder River Basin. Source: See Endnote 85.
15
Many of the water impacts associated with fuel extraction, such as potential long-term
contamination or altered hydrology, do not represent water consumption and are difficult to
measure and compare. Coal mining likely has a greater potential for long-term water disturbance
than does natural gas extraction due to the large footprint of coal mines, acid mine drainage, and
other contamination from abandoned mines. However, fresh water impacts from extraction of
either fuel must be considered in a local context as well as a national context to obtain a true
sense of how energy choices affect fresh water supply and quantity. It is also important to note
that risks are not static: for natural gas in particular, near-term technological development may
mitigate many risks. Technologies for treating produced water, as well as less harmful additives
for hydraulic fracturing, are under active development. As drilling and fracturing techniques
improve, the water needs per well might decline as well.
Produced water represents the largest waste stream associated with natural gas extraction, as well
as one of the most significant potential sources of contamination. The volume and chemical
characteristics of produced water vary by geological formation. Coalbed methane wells in
particular produce a lot of water when they are first drilled but less and less over their lifetime.83
In some cases, produced water is of high-enough quality that it may be used for irrigation, such
as in the Powder River Basin. However, produced water from most conventional natural gas and
deep shale reservoirs is highly saline, can be toxic, and must be disposed of.
So far, most of the water produced by the U.S. oil and natural gas industry has been reinjected
into underground formations or evaporated. But these methods will not be viable on the scale
that shale gas drilling is anticipated to reach in the Marcellus Shale because of land constraints
for evaporation ponds and geology poorly suited to injection wells. The safe disposal or effective
treatment of produced water will be a significant challenge to natural gas development as it
moves into new regions.
Of course, the energy choices confronting the United States in the coming years are much
broader than whether the country will use coal or natural gas in steam turbines or combined-
cycle power plants. The United States is supporting extensive research and development into
―clean coal‖ technologies that will enable electricity to be generated from coal without the steep
CO2 emissions that conventional coal plants produce. One proposed alternative is to gasify coal
and use it in a combined-cycle plant. Because such Integrated Gasification Combined Cycle
(IGCC) plants are more efficient, they use about a third of the water that their steam turbine
counterparts do.84
Another potential solution to the large CO2 emissions associated with coal-fired electricity
generation is carbon capture and sequestration (CCS). However, CO2 capture technology
generally adds a significant parasitic load, reducing overall plant efficiency and indirectly
increasing the water intensity of generation through additional fuel needs. It can also directly
require additional water for cooling and other processes. A 2007 National Energy Technology
Laboratory study estimated that the use of CO2 capture technology increased water consumption
per kilowatt-hour by about 95 percent for pulverized coal plants and 37 percent for IGCC
plants.85 Although less frequently proposed, CCS can be used with NGCC plants as well, but this
could raise their water consumption by more than 80 percent.86 The significant water
requirements of carbon capture could make CCS-based ―clean coal‖ generation an unsustainable
option for water-constrained parts of the world.
16
Other power plant technologies have negligible water needs—including solar photovoltaic
panels, wind turbines, and gas turbines.87 If these technologies become more prevalent, they are
likely to further reduce the per-kilowatt-hour water needs of the U.S. power system.
V. Recommendations
Water and energy are valuable resources whose fates are closely linked. As the United States—
and the world—enter a 21st century marked by carbon, energy, and water constraints, managing
these two resources in isolation will become ever more challenging. Promoting technologies that
are less water intensive—and that have fewer negative impacts on water quality and quantity—
will become increasingly important as the demand for energy, clean air, and clean water grows.
Choosing natural gas over coal for electricity generation might be an option that simultaneously
reduces air emissions and water demand.
Energy production is only one of many competing consumers of limited fresh water supplies.
Fresh water is also needed to irrigate crops, supply households, and sustain aquatic ecosystems,
among other uses. Moreover, fresh water availability is not distributed evenly in time or space,
and even relatively small volumes of water may be locally significant. Decision makers should
consider both local impacts and their larger context. For example, using a more water-intensive
fuel might be a good choice if that fuel can be extracted in a water-rich region and reduce water
needs at a power plant in a water-scarce region.
A range of technologies can reduce water demand throughout the fuel cycle of electricity. At the
point of fuel extraction, recycling water simultaneously mitigates the need for fresh water
supplies and wastewater disposal. Both the coal and natural gas industries are exploring methods
for treating and reusing waste water. One Pennsylvania power plant is investigating the
possibility of using treated acid mine drainage water from local abandoned mines for cooling
water and boiler feedwater.88 And numerous natural gas companies are filtering their produced
water onsite for reuse in future fracturing jobs.89 Producers should work with communities and
local water authorities as well to shift their water usage to coincide with periods of relatively
high water availability.
Finally, improved efficiency can lower the cooling water requirements of any power plant
technology. One application that provides substantial efficiency gains is cogeneration, the
capture and utilization of the excess heat created during electricity generation. Often,
cogeneration supplies heat in the form of hot water or low-temperature steam, so the net water
impact depends on the application. Cogeneration may increase water use at the plant level, for
example, if waste heat in flue gas is captured in water for heat delivery, thereby displacing heat
from a natural gas furnace that was not using water. But cogeneration can save water if a hot
water discharge from a power plant is used to directly replace a separately fueled hot water
heating system. Cogeneration also mitigates the need for other energy sources to supply heat,
reducing water impacts associated with fuel extraction, processing, and transportation.
Decisions about energy resource use and policy should value both the quantity and quality of
water. Valuing water quality impacts is often subjective, however, and the short- and long-term

17
needs of communities should be considered. Water is inherently a fungible resource, and
considering its full context might improve overall resource utilization.
As energy extraction in the United States and elsewhere continues to affect water resources,
restoring these resources will require additional energy usage, which in turn will require greater
water demand for energy production. Utilities and policy makers considering natural gas as an
alternative to coal in the power sector should take into account the sizable difference in the fuels’
water footprints.

18
Endnotes 1 Joan Kenny et al., Estimated Use of Water in the United States in 2005, U.S. Geological Survey Circular 1344
(Reston, VA: October 2009). 2 U.S. Government Accountability Office, Freshwater Supply: States’ View of How Federal Agencies Could Help
Them Meet the Challenges of Expected Shortages (Washington, DC: 9 July 2003). 3 Benjamin Sovacool, ―Running on Empty: The Electricity-Water Nexus and the U.S. Electric Utility Sector,‖
Energy Law Journal, vol. 30, no.11 (2009), pp. 12–51. 4 Calculated based on U.S. Department of Energy, Energy Information Administration (EIA), ―Form 923 (2009)
– Preliminary,‖ (Washington, DC: 2010). 5 Sovacool, op. cit. note 3. 6 Worldwatch calculation based on estimates for water consumption by natural gas combined-cycle and coal
steam-turbine plants using cooling towers in V. Fthenakis and H. Kim, ―Life-cycle Uses of Water in U.S.
Electricity Generation,‖ Renewable and Sustainable Energy Reviews, vol. 14, no. 7 (2010), pp. 2039–48. 7 Christopher Flavin and Saya Kitasei, The Role of Natural Gas in a Low-Carbon Energy Economy (Washington,
DC: Worldwatch Institute, April 2010). 8 For other upstream environmental impacts associated with shale gas development, see Mark Zoback, Saya
Kitasei, and Brad Copithorne, Addressing the Environmental Risks of Shale Gas Development (Washington,
DC: Worldwatch Institute, July 2010). 9 Worldwatch calculation based on data in Table 2, see note 81. 10 EIA, ―Coal Production and Number of Mines by State, County, and Mine Type,‖
www.eia.doe.gov/cneaf/coal/page/acr/table2.html, viewed 21 July 2010. 11 Stanley Schweinfurth, ―Coal – A Complex Natural Resource,‖ United States Geological Survey (USGS),
Circular 1143 (Reston, VA: 2003). 12 EIA, ―Coal Production and Number of Mines by State and Mine Type, 2008–2007,‖
www.eia.doe.gov/cneaf/coal/page/acr/table1.html, viewed 21 July 2010. 13 DOE, Energy Demands on Water Resources: Report to Congress on the Interdependency of Energy and Water
(Washington, DC: 2006). 14 CQ Inc., Coal Cleaning Primer, at www.cq-inc.com/Coal_Primer.pdf, viewed 10 May 2010. 15 Ibid. 16 EIA, ―Coal Projections,‖ www.eia.doe.gov/oiaf/aeo/coal.html, viewed 9 November 2010. 17 I. White et al., Energy from the West: Energy Resource Development Systems Report, Volume II: Coal
(Washington, DC: U.S. Environmental Protection Agency (EPA), 2004 revision). 18 EIA, ―Table 1. Coal Production and Number of Mines by State and Mine Type, 2009, 2008,‖ and ―Table 6.
Coal Production and Number of Mines by State and Coal Rank, 2009,‖ in Annual Coal Report (2009), at
http://eia.gov/cneaf/coal/page/acr/table1.html and http://eia.gov/cneaf/coal/page/acr/table6.html. 19 A. Akcil and S. Koldas, ―Acid Mine Drainage (AMD): Causes, Treatment and Case Studies,‖ Journal of
Cleaner Production, vol. 14 (2006), pp. 1139–45. 20 EIA, op. cit. note 12. 21 EIA, op. cit. note 16. 22
Mikael Höök and Kjell Aleklett, ―Historical trends in American coal production and a possible future outlook,‖
International Journal of Coal Geology 78 (March 2009): 201-216. 23 Ibid. 24 Ibid. 25 Calculated based on 2009 dry natural gas production in EIA, ―June 2010 Natural Gas Monthly with Data for
April 2010,‖ www.eia.gov/oil_gas/natural_gas/data_publications/natural_gas_monthly/ngm.html. 26 In 2008, the United States produced about 6.6 tcf from onshore conventional reservoirs, 3.2 tcf from offshore
wells, 0.4 tcf from Alaska, 6.7 tcf from tight sands, 2.0 tcf from gas shales, and 1.8 tcf from coalbed methane.
EIA’s Annual Energy Outlook 2010 predicts that U.S. shale gas and coalbed methane production will grow to
7.4 tcf by 2030, or 32.8 percent of total natural gas production. Worldwatch estimates based on the following:
EIA, ―Coalbed Methane Production,‖ www.eia.gov/dnav/ng/ng_prod_coalbed_s1_a.htm; EIA, ―Shale Gas
Production,‖ www.eia.gov/dnav/ng/ng_prod_shalegas_s1_a.htm; EIA, Annual Energy Outlook 2009
(Washington, DC: March 2009); EIA, Annual Energy Outlook 2010 (Washington, DC: 11 May 2010). 27 Amy Mall et al., Drilling Down: Protecting Western Communities from the Health and Environmental Effects
of Oil and Gas Production (New York: Natural Resources Defense Council, September 2007), p. vi.
19
28 DOE, Energy Demands on Water Resources: Report to Congress on the Interdependency of Energy and Water
(Washington, DC: 2006). 29 Ibid. 30
U.S. Department of Energy, Energy Information Administration (EIA), ―Underground Natural Gas Storage,‖
available at http://www.eia.doe.gov/pub/oil_gas/natural_gas/analysis_publications/ngpipeline/
undrgrnd_storage.html, viewed 9 July 2010. 31 Groundwater Protection Council (GWPC) and ALL Consulting, Modern Shale Gas Development in the United
States: A Primer, prepared for NETL (Oklahoma City: April 2009). 32 E. Inlander, ―Innovative Construction and Maintenance Practices to Reduce Sedimentation from Unpaved
Roads during Gas Development for the Benefit of Yellowcheek Darter (Etheostoma moorei) and other Species
of Greatest Conservation Need in the Upper Little Red River Watershed, Arkansas,‖ 2009, available at
http://www.conservingarkansaswildlife.org/proposals/2010PreProposals/Sedimentation%2520and%2520the%2
520Yellowcheek%2520Darter%2520in%2520Fayetteville%2520Shale%2520development.pdf, viewed 15
November 2010. 33 Zoback, Kitasei, and Copithorne, op. cit. note 8. 34 GWPC and ALL Consulting, op. cit. note 31. 35 Pam Kasey, ―WVU Project Would Recycle Frack Water,‖ The State Journal, 9 September 2010; NETL, ―Pilot
Testing: Pretreatment Options to Allow Re-Use of Frac Flowback and Produced Brine for Gas Shale Resource
Development,‖ www.netl.doe.gov/technologies/oil-
gas/Petroleum/projects/Environmental/Produced_Water/00847_Pretreat.html, viewed 9 November 2010; NETL,
―An Integrated Water Treatment Technology Solution for Sustainable Water Resource Management in the
Marcellus Shale,‖ www.netl.doe.gov/technologies/oil-
gas/Petroleum/projects/Environmental/Produced_Water/00833_MarcellusWater.html, viewed 9 November 2010. 36 Zoback, Kitasei, and Copithorne, op. cit. note 8. 37 Duane Grubert, Susquehanna Financial Group, personal communication with Emily Grubert, 2010. 38 D. McMahon, ―The Real and Timely Issues Caused by the Marcellus Shale Play,‖ presentation at West Virginia
Water Conference, Morgantown, West Virginia, 6-7 October 2010. 39 Colorado School of Mines, ―Potential Gas Committee Reports Unprecedented Increase in Magnitude of U.S.
Natural Gas Resource Base,‖ press release (Golden, CO: 18 June 2009). 40 Ibid. 41 Chesapeake Energy, ―Water Use in Barnett Deep Shale Gas Exploration‖ (March 2010). 42 GWPC and ALL Consulting, op. cit. note 31. 43 J. Arthur et al., Evaluating the Environmental Implications of Hydraulic Fracturing in Shale Gas Reservoirs
(2008); Chesapeake Energy, op. cit. note 41. 44 GWPC and ALL Consulting, op. cit. note 31. 45 Ibid. 46 K.M. Currie and E.B. Stelle, ―Pennsylvania’s Natural Gas Boom,‖ Commonwealth Foundation Policy Brief,
vol. 22, no. 5 (2010). 47 Arthur et al., op. cit. note 43; Matthew Mantell, Deep Shale Natural Gas: Abundant, Affordable, and
Surprisingly Water Efficient, presentation at Water/Energy Sustainability Symposium, 2009 Groundwater
Protection Council Annual Forum, Salt Lake City, UT, 2009. 48 ALL Consulting and Montana Board of Oil and Gas Conservation, Coal Bed Methane Primer (February 2004). 49 Ibid; U.S. Department of Energy, Energy Information Administration (EIA), ―The San Juan Basin,‖ Evaluation
of Impacts to Underground Sources of Drinking Water by Hydraulic fracturing of Coalbed Methane Reservoirs
(2004), A1-1 to A1-33. 50 EIA, op. cit. note 49. 51 Ibid. 52 Ibid. 53 R. Williams, ―Hydrogen Production from Coal and Coal Bed Methane,‖ in Baldur Eliasson, Pierce Riemer, and
Alexander Wokaun, eds., Greenhouse Gas Control Technologies (Kidlington, United Kingdom: 1999); Vello
Kuuskraa, Advanced Resources International, personal communication with Saya Kitasei, Worldwatch Institute,
October 2010. 54 U.S. Department of Energy, Energy Information Administration (EIA), ―The Powder River Basin,‖ Evaluation
of Impacts to Underground Sources of Drinking Water by Hydraulic Fracturing of Coalbed Methane Reservoirs
(2004), A5-1 to A5-20.
20
55 Ibid. 56 Ibid. 57 ALL Consulting and Montana Board of Oil and Gas Conservation, op. cit. note 48. 58
Kenny et al., op. cit. note 2. 59 Worldwatch calculation based on Coal, Nuclear, Petroleum, and Natural Gas steam turbines and the steam
portion of combined cycle gas turbines, in EIA, ―Form-923 (2009) - Preliminary‖ op. cit. note 4. 60 NETL, Estimating Freshwater Needs to Meet Future Thermoelectric Generation Requirements: 2008 Update
(Washington, DC: September 2008), p. 11. 61 Ashlynn Stillwell et al., Energy-Water Nexus in Texas (Austin, TX: University of Texas-Austin and
Environmental Defense Fund, April 2009). 62 Figure 2 based on Stillwell et al., op. cit. note 61. 63 Kenny et al., op. cit. note 2. 64 DOE, Energy Demands on Water Resources: Report to Congress on the Interdependency of Energy and Water
(Washington, DC: 2006), p. 18. 65 NETL, op. cit. note 60, p. 14. 66 P. Torcellini, N. Long, and R. Judkoff, ―Consumptive Water Use for U.S. Power Production‖ (Golden, CO:
National Renewable Energy Laboratory, December 2003), p. 10. 67 John S. Maulbetsch and Michael N. DiFilippo, Performance, Cost, and Environmental Effects of Saltwater
Cooling Towers, prepared for California Energy Commission (Berkeley, CA: January 2010). 68 For example, NGCC plants using dry cooling systems might withdraw and consume 0.004 gallons/kWh,
compared to a consumption rate of 0.15 gallons/kWh and a withdrawal rate of 0.13 gallons/kWh for a NGCC
plant using a wet cooling tower closed-loop system. Thomas J. Feeley III et al., ―Water: A Critical Resource in
the Thermoelectric Power Industry,‖ Energy, January 2008, p. 4. 69 Stillwell et al., op. cit. note 61, p. 8. 70 For more about how the Clean Water Act impacts cooling systems, see NETL, Estimating Freshwater Needs to
Meet Future Thermoelectric Generation Requirements: 2010 Update (Washington, DC: September 2010). 71 Feeley et al., op. cit. note 68, p. 4. 72 Ibid. 73 Texas Comptroller of Public Accounts, ―Coal,‖ Window on State Government,
www.window.state.tx.us/specialrpt/energy/exec/coal.html, viewed 9 November 2010. 74 EPA, ―Fact Sheet: Coal Combustion Residues (CCR) – Surface Impoundments with High Hazard Potential
Ratings‖ (Washington, DC: June 2009). 75 Shaila Dewan, ―Tennessee Ash Flood Larger Than Initial Estimate,‖ New York Times, 26 December 2008. 76 NETL, Life Cycle Analysis: Power Studies Compilation Report (Washington, DC: 7 October 2010). 77 Worldwatch calculation based on EIA, ―Form 923 (2008) - Final‖ (Washington, DC: 2008) and ―Form 860
(2008) - Final‖ (Washington, DC: 2009). Preliminary generation data from 2009 and early 2010 had been
released at the time of publication, but final figures permitting a publishable estimate of capacity factors were not yet available.
78 Worldwatch calculation of generation based on EIA, ―Form 923 (2009) - Preliminary,‖ op. cit. note 4. 79 Worldwatch calculation based on EIA, ―Form 923 (2009) - Preliminary,‖ op. cit. note 4. 80 Feeley et al., op. cit. note 68, p. 4. 81 Figure 3 from Fthenakis and Kim, op. cit. note 6. 82 Figure 4 and Table 2 from the following sources: Feeley et al., op. cit. note 67; Fthenakis and Kim, op. cit. note
6; DOE, op. cit. note 64; GWPC and ALL Consulting, op. cit. note 31; Kuuskraa, op. cit. note 53; Mike
Hightower, Sandia National Laboratories, personal communication with Emily Grubert, September 2010; T.F.
Edgar, Coal Processing and Pollution Control, Gulf Publishing (Houston, TX:1983), Worldwatch and
University of Texas-Austin estimates. 83 John Veil et al., A White Paper Describing Produced Water from Production of Crude Oil, Natural Gas, and
Coal Bed Methane, prepared for NETL (Argonne National Laboratory: Argonne, IL, January 2004). 84 Worldwatch calculations based on Feeley et al., op. cit. note 68, pp. 1–11. 85 NETL, Cost and Performance Baseline for Fossil Energy Plants (Washington, DC: August 2007), pp. 6–7. 86 Ibid. 87 Fthenakis and Kim, op. cit. note 6. 88 Robert Zick, ―Mine Drainage: An Alternative Source of Water,‖ POWER Magazine, 1 September 2010. 89
GWPC and ALL Consulting, op. cit. note 31, p. 68.