Embed Size (px)
Citation preview
How does earnings management influence investor’sperceptions of firm value? Survey evidencefrom financial analysts
Abe de Jong • Gerard Mertens •
Marieke van der Poel • Ronald van Dijk
Published online: 8 October 2013
� Springer Science+Business Media New York 2013
Abstract Survey evidence shows CFOs to believe that earnings management can
enhance investor valuation of their firms. This evidence raises the question of
correspondence between the beliefs of CFOs and investors. Surveying financial
analysts to gain insight into how earnings management influences investor per-
ception of firm value, we find analysts’ and CFOs’ beliefs to be generally consistent.
We find that analysts perceive meeting earnings benchmarks and smoothing earn-
ings to enhance investor perception of firm value and all earnings management
actions to reach a benchmark, save share repurchases, to be value destroying. CFOs,
however, are reluctant to repurchase shares, preferring to use techniques viewed by
analysts as value destroying (e.g., reductions in discretionary spending). Analysts’
inability to unravel such techniques perhaps explains CFOs’ preferences.
Opinions expressed in this article strictly represent the authors’ personal views and opinions and cannot
in any way be construed as statements or views of APG.
A. de Jong � M. van der Poel
Rotterdam School of Management, Erasmus University, PO Box 1738, 3000 DR Rotterdam,
The Netherlands
e-mail: [email protected]
M. van der Poel
e-mail: [email protected]
A. de Jong
University of Groningen, PO Box 800, 9700 AV Groningen, The Netherlands
G. Mertens (&)
Faculty of Management, Science and Technology, Open Universiteit Nederland, PO Box 2960,
6410 DL Heerlen, The Netherlands
e-mail: [email protected]
R. van Dijk
APG Asset Management, PO Box 75283, 1070 AG Amsterdam, The Netherlands
e-mail: [email protected]
123
Rev Account Stud (2014) 19:606–627
DOI 10.1007/s11142-013-9250-y

Keywords Financial reporting � Earnings management � Earnings
benchmark � Earnings smoothing � Financial analysts � Financial executives
JEL Classification M41
1 Introduction
According to survey evidence, CFOs believe that earnings management can enhance
investor valuation of their firms (Graham et al. 2005; Graham et al. henceforth). The
evidence suggests that they are even willing to sacrifice economic value to fulfill
investors’ earnings expectations. The importance CFOs attach to investors raises the
question of correspondence between the beliefs of CFOs and investors. Taking as
our research question how earnings management influences investor perception of
firm value, we conduct a large-scale survey and interviews with sell-side analysts.
Empirical studies show analysts, who are experienced, well-trained observers of
financial reporting and sources of investment advice, to be important for investor
attention, price setting, and liquidity (e.g., Brown and Rozeff 1978; Womack 1996;
Graham et al.; Anantharaman and Zhang 2011; Mola et al. 2012).
We present survey and interview evidence of analysts’ views on policies for such
corporate financial reporting mechanisms as earnings benchmarks, within-GAAP
earnings management, and earnings smoothing. Asking analysts questions similar to
those to which CFOs responded in Graham et al. enables us to describe analysts’
views in conjunction with those of the CFOs. Our survey (which achieved a 48 %
response rate) of 306 analysts employed by 11 of the world’s largest investment
banks was complemented by interviews with 21 analysts.
The study addresses three specific questions. The first concerns analysts’ beliefs
regarding the importance of meeting earnings benchmarks. We find analysts to share
CFOs’ beliefs about the importance of stock-price-related motivations for meeting
benchmarks. Analysts’ views suggest that analysts perceive long-term consequences
to accrue to meeting or missing short-term earnings benchmarks. This perception of
long-term consequences is perhaps explained by analysts’ awareness that firms
manage their earnings to benchmarks. Our interviews corroborate this explanation.
Some analysts, for instance, posit that a firm that fails to meet its earnings
benchmark lacks the flexibility to bridge the gap between earnings and benchmark
by managing its earnings to the benchmark.
The second question explores analysts’ views of the value implications of using
different types of within-GAAP earnings management techniques to achieve earnings
benchmarks. Whereas analysts view all earnings management actions to reach a
benchmark, save share repurchases, as value destroying, CFOs are reluctant to
repurchase shares but willing to take earnings management actions analysts perceive to
be value destroying (e.g., decreasing discretionary spending). Analysts’ inability to
unravel certain earnings management actions might perhaps explain CFOs’ preferences.
The third question we address concerns analysts’ beliefs about how much value a
firm should sacrifice to avoid a bumpy earnings path and the consequences of
earnings smoothing. Our results suggest that analysts recognize the positive
Survey evidence from financial analysts 607
123

consequences of smoothing firms’ earnings paths, believing, for instance, that
smoothing earnings reduces perceived riskiness and that achieving the resulting
benefits is worth a small sacrifice in value. That analysts are nevertheless less
positive than CFOs about smoothing could explain CFOs’ willingness to sacrifice
much more value than analysts recommend. Our findings further indicate that,
although they prefer to follow firms with smooth earnings paths, analysts dislike
firms that intentionally smooth their earnings paths because their performance is
consequently akin to a black box. We infer from their answers that analysts cannot
always unravel earnings management practices.
Overall, our evidence suggests that analysts’ and CFOs’ beliefs are generally
consistent, both believing that meeting earnings benchmarks and smoothing
earnings can enhance investor perception of firm value. Where they differ with
respect to earnings management actions to meet benchmarks is in CFOs’
preferences for decreasing discretionary spending and delaying the start of new
projects and analysts’ view that only share repurchases are value enhancing.
Analysts are also less positive than CFOs about sacrificing value to smooth
earnings.
Our paper contributes to the literature on the market perspective on earnings
management. Empirical evidence in this strand of literature is mixed, with some
studies suggesting that analysts do not anticipate earnings management to achieve a
benchmark (e.g., Abarbanell and Lehavy 2003; Burgstahler and Eames 2003) and
others that analysts rationally anticipate earnings management (e.g., Coles et al.
2006; Kim and Schroeder 1990). Market responses to announcements that earnings
benchmarks have been met, moreover, depend on whether earnings management
was needed to reach the benchmark (e.g., Bartov et al. 2002; Gleason and Mills
2008). A review by Dechow et al. (2010) suggests that difficulty unraveling
earnings management to meet benchmarks potentially explains differing market
responses. Evidence from our survey and interviews suggests that analysts are aware
of earnings management, but their answers to questions on actions and smoothing
indicate that they are not always able to unravel earnings management.
Our paper is also related to the literature on the endogenous interplay between
analysts’ forecasting, and managers’ reporting behavior. Beyer’s (2008) model
posits that managers manipulate earnings in response to analyst forecasts that, in
fact, take earnings management into account. Other papers that model the
interaction between analysts and managers include Dutta and Trueman (2002),
Fischer and Stocken (2004), and Mittendorf and Zhang (2005). Our findings on
analysts’ vis-a-vis CFOs’ beliefs afford a deeper understanding of this interplay. For
example, analysts are aware that firms employ earnings management to reach
benchmarks, but CFOs believe they should manage earnings to benchmarks because
analysts might perceive missing a benchmark to signal negative future prospects.
The survey methodology we use to examine earnings management’s influence on
investor perception of firm value is subject to the following limitations. First, we use
sell-side analysts’ answers as a proxy for investor beliefs. Although analysts, being
sophisticated users of financial information who can influence investor perceptions
of firm value, constitute a good proxy, they are nevertheless intermediaries between
firms and investors and not actual investors. Investors, for example, may not share
608 A. de Jong et al.
123
analysts’ view that all earnings management actions save share repurchases are
value destroying. Analysts’ stated beliefs, moreover, may not match their behavior,
inasmuch as analysts may recommend that firms not smooth their earnings path but
attempt to maximize their forecast accuracy by following firms that do smooth
earnings.
The paper is organized as follows. In Section 2, we describe our research design
and present summary statistics for our survey data. We examine, in Section 3,
analysts’ beliefs regarding the importance of meeting earnings benchmarks, in
Section 4, their beliefs regarding the valuation implications of earnings manage-
ment, and, in Section 5, their beliefs regarding the consequences of earnings
smoothing. Section 6 concludes.
2 Research design, data description, and summary statistics
We collect the opinions of financial analysts via a survey and supplemental
interviews. (‘‘Appendix’’ details our survey design and interview setup.) We draw
heavily on the Graham et al. questionnaire that solicits opinions of CFOs of US
firms to facilitate comparison of CFOs’ and analysts’ perceptions. Asking analysts
to answer the survey questions using a US firm randomly selected from their
portfolios enables us to compare our analyst results with the CFO results of Graham
et al.
We received 306 usable responses (response rate = 48 %). We apply a five-point
scale (coded from -2 to ?2) for most questions and report the average response, the
percentage of responses in categories ?1 and ?2, and the percentage of responses in
categories -1 and -2. Subsequent analyses compare the average answers of our
analyst and the CFO survey in two ways. First, we conduct a standard difference-of-
means t test (referred to in the tables as H0: Difference = 0).1 Because the firm
characteristics of size and industry differ between the CFO and analyst samples, we
regress the response scores of both samples on an analyst dummy that equals one for
observations from our analyst and zero for observations from the CFO sample.
Additional regressors for each regression are dummy variables for revenue (size)
and industry class. The responses being in distinct categories, we use (ordered) logit
regression models. The tables report the significance of the coefficient of the analyst
dummy that represents the size and industry corrected difference between the CFO
and analyst answers (referred to in the tables as H0: Corrected difference b = 0).
We corroborate the survey results and achieve further clarification by means of
the interviews with 21 financial analysts in four institutions, a subset of the
investment banks in our survey.
Table 1 Panel A provides summary statistics for the analysts who completed the
survey. We find that 46.1 % have four to 9 years, and 34 % at least 10 years,
experience as financial analysts and that 77.8 % follow at least 10 firms.
1 This analysis requires all observations for public firms in the CFO survey sample. We are grateful to
John Graham, Campbell Harvey, and Shiva Rajgopal for providing us their CFO data.
Survey evidence from financial analysts 609
123
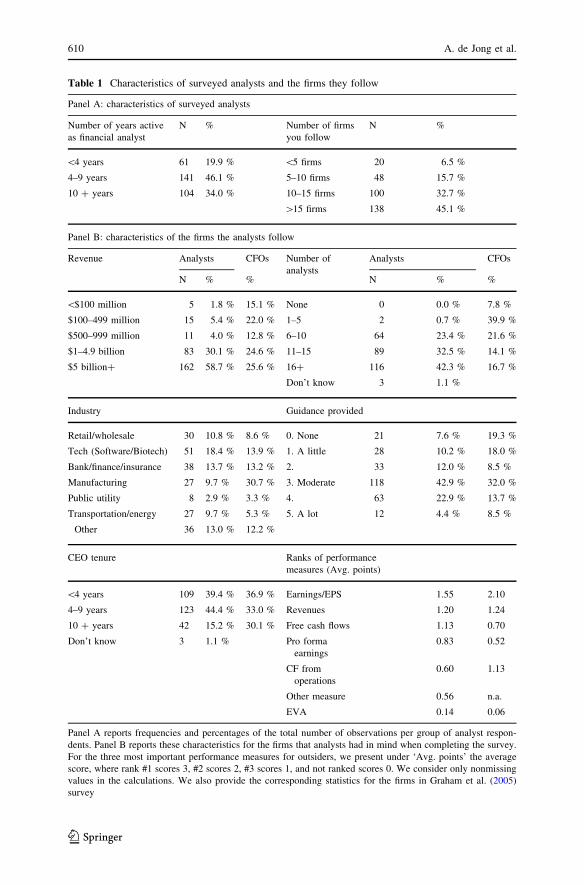
Table 1 Characteristics of surveyed analysts and the firms they follow
Panel A: characteristics of surveyed analysts
Number of years active
as financial analyst
N % Number of firms
you follow
N %
\4 years 61 19.9 % \5 firms 20 6.5 %
4–9 years 141 46.1 % 5–10 firms 48 15.7 %
10 ? years 104 34.0 % 10–15 firms 100 32.7 %
[15 firms 138 45.1 %
Panel B: characteristics of the firms the analysts follow
Revenue Analysts CFOs Number of
analysts
Analysts CFOs
N % % N % %
\$100 million 5 1.8 % 15.1 % None 0 0.0 % 7.8 %
$100–499 million 15 5.4 % 22.0 % 1–5 2 0.7 % 39.9 %
$500–999 million 11 4.0 % 12.8 % 6–10 64 23.4 % 21.6 %
$1–4.9 billion 83 30.1 % 24.6 % 11–15 89 32.5 % 14.1 %
$5 billion? 162 58.7 % 25.6 % 16? 116 42.3 % 16.7 %
Don’t know 3 1.1 %
Industry Guidance provided
Retail/wholesale 30 10.8 % 8.6 % 0. None 21 7.6 % 19.3 %
Tech (Software/Biotech) 51 18.4 % 13.9 % 1. A little 28 10.2 % 18.0 %
Bank/finance/insurance 38 13.7 % 13.2 % 2. 33 12.0 % 8.5 %
Manufacturing 27 9.7 % 30.7 % 3. Moderate 118 42.9 % 32.0 %
Public utility 8 2.9 % 3.3 % 4. 63 22.9 % 13.7 %
Transportation/energy 27 9.7 % 5.3 % 5. A lot 12 4.4 % 8.5 %
Other 36 13.0 % 12.2 %
CEO tenure Ranks of performance
measures (Avg. points)
\4 years 109 39.4 % 36.9 % Earnings/EPS 1.55 2.10
4–9 years 123 44.4 % 33.0 % Revenues 1.20 1.24
10 ? years 42 15.2 % 30.1 % Free cash flows 1.13 0.70
Don’t know 3 1.1 % Pro forma
earnings
0.83 0.52
CF from
operations
0.60 1.13
Other measure 0.56 n.a.
EVA 0.14 0.06
Panel A reports frequencies and percentages of the total number of observations per group of analyst respon-
dents. Panel B reports these characteristics for the firms that analysts had in mind when completing the survey.
For the three most important performance measures for outsiders, we present under ‘Avg. points’ the average
score, where rank #1 scores 3, #2 scores 2, #3 scores 1, and not ranked scores 0. We consider only nonmissing
values in the calculations. We also provide the corresponding statistics for the firms in Graham et al. (2005)
survey
610 A. de Jong et al.
123
Table 1 Panel B provides summary statistics for the firms the analysts used to
complete the survey.2 We ask analysts to provide information on the size, industry,
and number of analysts following the firms they select. Nearly 90 % of these firms
have revenues in excess of $ 1 billion, and 74.8 % are followed by at least 10
analysts. Interestingly, greater importance is attached to analysts for setting stock
price by CFOs of such firms than by CFOs of smaller firms and firms followed by
fewer analysts (Graham et al.). Most of the analysts in our sample indicate that their
firms provide moderate or more than moderate guidance.
To investigate whether earnings management influences investor expectations,
we need to establish a mutual focus on earnings by CFOs and analysts. According to
Graham et al., CFOs believe earnings rather than cash flows to be the most
important performance measure for outsiders. Block’s (1999) survey results provide
preliminary evidence of a preference for earnings by financial analysts. Table 1
Panel B shows the average ranking of importance analysts and CFOs attach to
different performance measures. Consistent with the mutual focus on earnings, both
view earnings as the most important performance measure for outsiders. Revenue is
ranked second most important by analysts and free cash flows third. The interviews
elucidate these analyst preferences. The importance of earnings is largely driven by
investor interest in the EPS number. One analyst explained: ‘‘This is the metric the
investment community has dictated’’, ‘‘When I think of the Street, net income is
most important.’’ Analysts’ client bases thus seem to drive their focus on earnings.
These conjectures support empirical evidence that suggests that share prices behave
as if the market is fixated on earnings rather than cash flows (Sloan 1996).
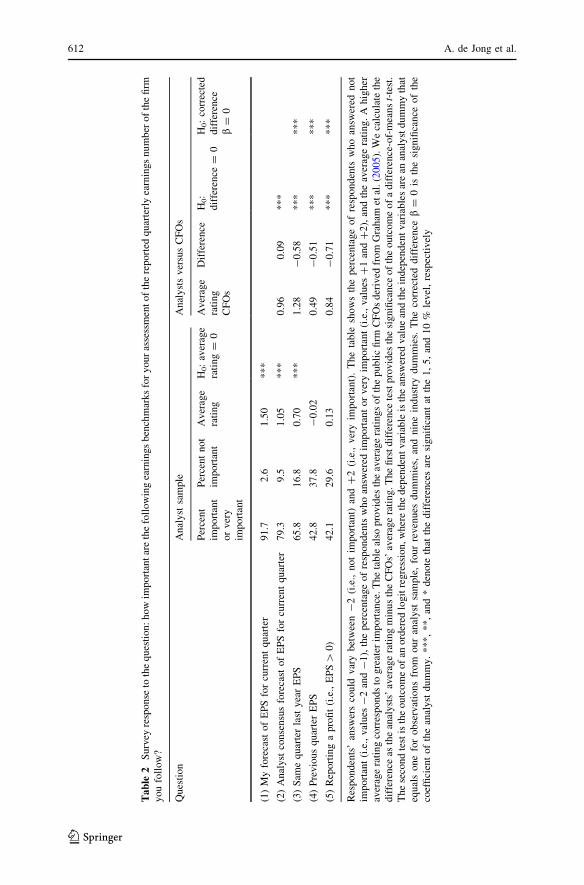
To confirm that analysts have the same benchmark in mind as CFOs answering
questions about meeting/missing earnings benchmarks and earnings management to
reach a benchmark, we ask the analysts about the importance of different
benchmarks to their assessment of firms’ reported quarterly earnings. Table 2
compares the analysts’ and CFOs’ responses.
Not surprisingly, analysts attach the greatest importance to their own forecasts
(i.e., 91.7 % agree or strongly agree). A more important result for our subsequent
analyses is that both analysts and CFOs, with average ratings of 1.05 and 0.96,
respectively, agree that consensus of analyst forecasts is an important evaluation
benchmark. The difference between the two ratings is not significant after
controlling for size and industry. For analysts, the third most important benchmark
is the EPS from the same quarter in the previous year.
3 Analysts’ beliefs regarding the importance of meeting earnings benchmarks
We first examine the analysts’ beliefs regarding the consequences of meeting or
missing earnings benchmarks with respect to the firm’s stock price. A number of
studies suggest that the market views meeting and beating earnings benchmarks as
important. Investors reward firms that meet and beat earnings benchmarks and
2 To facilitate comparison with the CFO sample in Graham et al., we also present the characteristics of
their CFO sample.
Survey evidence from financial analysts 611
123
Ta
ble
2S
urv
eyre
spo
nse
toth
eq
ues
tio
n:
ho
wim
po
rtan
tar
eth
efo
llo
win
gea
rnin
gs
ben
chm
ark
sfo
ry
ou
ras
sess
men
to
fth
ere
po
rted
qu
arte
rly
earn
ings
nu
mb
erof
the
firm
yo
ufo
llo
w?
Ques
tion
Anal
yst
sam
ple
Anal
yst
sver
sus
CF
Os
Per
cen
t
imp
ort
ant
or
ver
y
imp
ort
ant
Per
cen
tn
ot
imp
ort
ant
Av
erag
e
rati
ng
H0:
aver
age
rati
ng
=0
Av
erag
e
rati
ng
CF
Os
Dif
fere
nce
H0:
dif
fere
nce
=0
H0:
corr
ecte
d
dif
fere
nce
b=
0
(1)
My
fore
cast
of
EP
Sfo
rcu
rren
tquar
ter
91.7
2.6
1.5
0***
(2)
Anal
yst
conse
nsu
sfo
reca
sto
fE
PS
for
curr
ent
quar
ter
79.3
9.5
1.0
5***
0.9
60.0
9***
(3)
Sam
eq
uar
ter
last
yea
rE
PS
65
.81
6.8
0.7
0*
**
1.2
8-
0.5
8*
**
**
*
(4)
Pre
vio
us
qu
arte
rE
PS
42
.83
7.8
-0
.02
0.4
9-
0.5
1*
**
**
*
(5)
Rep
ort
ing
ap
rofi
t(i
.e.,
EP
S[
0)
42
.12
9.6
0.1
30
.84
-0
.71
**
**
**
Res
po
nd
ents
’an
swer
sco
uld
var
yb
etw
een
-2
(i.e
.,n
ot
imp
ort
ant)
and
?2
(i.e
.,ver
yim
port
ant)
.T
he
table
show
sth
eper
centa
ge
of
resp
onden
tsw
ho
answ
ered
not
imp
ort
ant
(i.e
.,v
alu
es-
2an
d-
1),
the
per
cen
tag
eo
fre
spo
nd
ents
wh
oan
swer
edim
po
rtan
to
rv
ery
imp
ort
ant
(i.e
.,v
alu
es?
1an
d?
2),
and
the
aver
age
rati
ng
.A
hig
her
aver
age
rati
ng
corr
esp
on
ds
tog
reat
erim
po
rtan
ce.
Th
eta
ble
also
pro
vid
esth
eav
erag
era
tin
gs
of
the
pu
bli
cfi
rmC
FO
sd
eriv
edfr
om
Gra
ham
etal
.(2
00
5).
We
calc
ula
teth
e
dif
fere
nce
asth
ean
aly
sts’
aver
age
rati
ng
min
us
the
CF
Os’
aver
age
rati
ng
.T
he
firs
td
iffe
ren
cete
stp
rov
ides
the
sig
nifi
can
ceo
fth
eo
utc
om
eo
fa
dif
fere
nce
-of-
mea
ns
t-te
st.
Th
ese
con
dte
stis
the
ou
tco
me
of
ano
rder
edlo
git
regre
ssio
n,w
her
eth
ed
epen
den
tv
aria
ble
isth
ean
swer
edv
alu
ean
dth
ein
dep
end
ent
var
iab
les
are
anan
aly
std
um
my
that
equ
als
on
efo
ro
bse
rvat
ion
sfr
om
ou
ran
aly
stsa
mp
le,
fou
rre
ven
ues
du
mm
ies,
and
nin
ein
du
stry
du
mm
ies.
Th
eco
rrec
ted
dif
fere
nce
b=
0is
the
sign
ifica
nce
of
the
coef
fici
ent
of
the
anal
yst
du
mm
y.
**
*,
**
,an
d*
den
ote
that
the
dif
fere
nce
sar
esi
gn
ifica
nt
atth
e1
,5
,an
d1
0%
lev
el,
resp
ecti
vel
y
612 A. de Jong et al.
123
punish those that fall short of them (e.g., Athanasakou et al. 2011; Skinner and
Sloan 2002), and firms that meet earnings benchmarks consistently over time are
priced at a premium (Barth et al. 1999; Kasznik and McNichols 2002); especially
when such premium is viewed as an indicator of future performance (Bartov et al.
2002; Kasznik and McNichols 2002). That the market reward is lower, or even
absent, for firms that meet or beat analysts’ forecasts as a result of earnings or
expectations management (e.g., Athanasakou, et al. 2011; Bartov et al. 2002;
Gleason and Mills 2008), however, suggests that the market at least partially
accounts for CFO discretion when targeting earnings benchmarks.
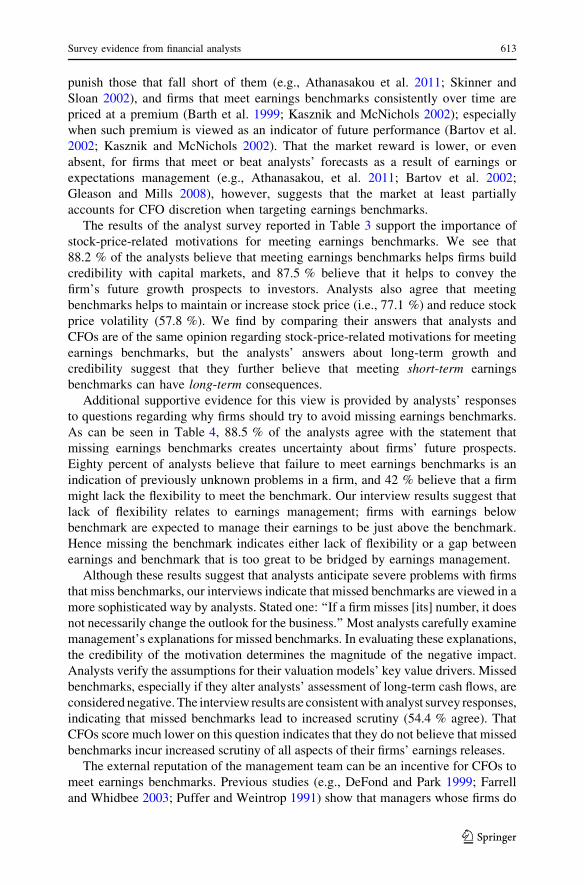
The results of the analyst survey reported in Table 3 support the importance of
stock-price-related motivations for meeting earnings benchmarks. We see that
88.2 % of the analysts believe that meeting earnings benchmarks helps firms build
credibility with capital markets, and 87.5 % believe that it helps to convey the
firm’s future growth prospects to investors. Analysts also agree that meeting
benchmarks helps to maintain or increase stock price (i.e., 77.1 %) and reduce stock
price volatility (57.8 %). We find by comparing their answers that analysts and
CFOs are of the same opinion regarding stock-price-related motivations for meeting
earnings benchmarks, but the analysts’ answers about long-term growth and
credibility suggest that they further believe that meeting short-term earnings
benchmarks can have long-term consequences.
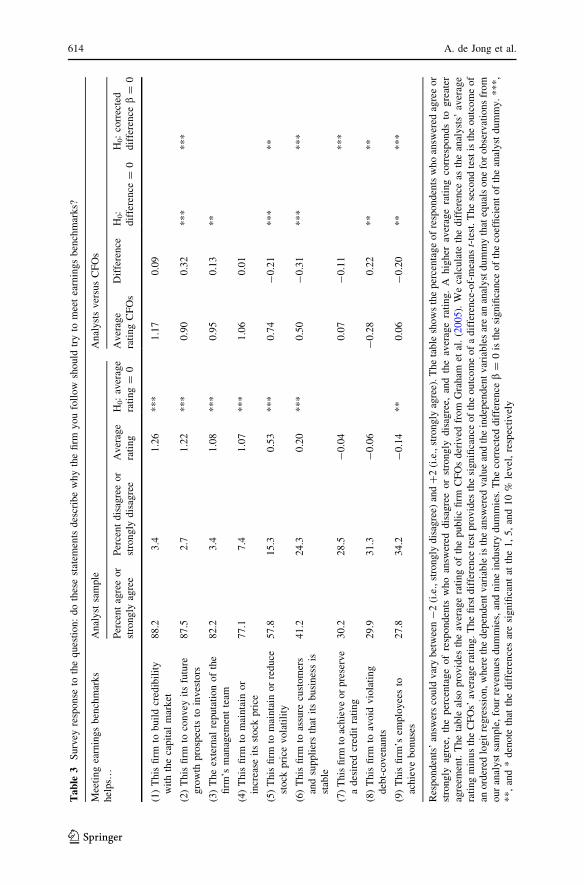
Additional supportive evidence for this view is provided by analysts’ responses
to questions regarding why firms should try to avoid missing earnings benchmarks.
As can be seen in Table 4, 88.5 % of the analysts agree with the statement that
missing earnings benchmarks creates uncertainty about firms’ future prospects.
Eighty percent of analysts believe that failure to meet earnings benchmarks is an
indication of previously unknown problems in a firm, and 42 % believe that a firm
might lack the flexibility to meet the benchmark. Our interview results suggest that
lack of flexibility relates to earnings management; firms with earnings below
benchmark are expected to manage their earnings to be just above the benchmark.
Hence missing the benchmark indicates either lack of flexibility or a gap between
earnings and benchmark that is too great to be bridged by earnings management.
Although these results suggest that analysts anticipate severe problems with firms
that miss benchmarks, our interviews indicate that missed benchmarks are viewed in a
more sophisticated way by analysts. Stated one: ‘‘If a firm misses [its] number, it does
not necessarily change the outlook for the business.’’ Most analysts carefully examine
management’s explanations for missed benchmarks. In evaluating these explanations,
the credibility of the motivation determines the magnitude of the negative impact.
Analysts verify the assumptions for their valuation models’ key value drivers. Missed
benchmarks, especially if they alter analysts’ assessment of long-term cash flows, are
considered negative. The interview results are consistent with analyst survey responses,
indicating that missed benchmarks lead to increased scrutiny (54.4 % agree). That
CFOs score much lower on this question indicates that they do not believe that missed
benchmarks incur increased scrutiny of all aspects of their firms’ earnings releases.
The external reputation of the management team can be an incentive for CFOs to
meet earnings benchmarks. Previous studies (e.g., DeFond and Park 1999; Farrell
and Whidbee 2003; Puffer and Weintrop 1991) show that managers whose firms do
Survey evidence from financial analysts 613
123
Ta
ble
3S
urv
eyre
spo
nse
toth
eq
ues
tio
n:
do
thes
est
atem
ents
des
crib
ew
hy
the
firm
yo
ufo
llo
wsh
ould
try
tom
eet
earn
ings
ben
chm
ark
s?
Mee
tin
gea
rnin
gs
ben
chm
ark
s
hel
ps…
An
aly
stsa
mple
An
alyst
sv
ersu
sC
FO
s
Per
cen
tag
ree
or
stro
ng
lyag
ree
Per
cen
td
isag
ree
or
stro
ng
lyd
isag
ree
Av
erag
e
rati
ng
H0:
aver
age
rati
ng
=0
Av
erag
e
rati
ng
CF
Os
Dif
fere
nce
H0:
dif
fere
nce
=0
H0:
corr
ecte
d
dif
fere
nce
b=
0
(1)
This
firm
tobuil
dcr
edib
ilit
y
wit
hth
eca
pit
alm
ark
et
88
.23
.41
.26
**
*1
.17
0.0
9
(2)
Th
isfi
rmto
con
vey
its
futu
re
gro
wth
pro
spec
tsto
inv
esto
rs
87
.52
.71
.22
**
*0
.90
0.3
2*
**
**
*
(3)
Th
eex
tern
alre
pu
tati
on
of
the
firm
’sm
anag
emen
tte
am
82
.23
.41
.08
**
*0
.95
0.1
3*
*
(4)
Th
isfi
rmto
mai
nta
ino
r
incr
ease
its
sto
ckp
rice
77
.17
.41
.07
**
*1
.06
0.0
1
(5)
Th
isfi
rmto
mai
nta
ino
rre
du
ce
sto
ckp
rice
vo
lati
lity
57
.81
5.3
0.5
3*
**
0.7
4-
0.2
1*
**
**
(6)
Th
isfi
rmto
assu
recu
stom
ers
and
sup
pli
ers
that
its
bu
sin
ess
is
stab
le
41
.22
4.3
0.2
0*
**
0.5
0-
0.3
1*
**
**
*
(7)
This
firm
toac
hie
ve
or
pre
serv
e
ad
esir
edcr
edit
rati
ng
30
.22
8.5
-0
.04
0.0
7-
0.1
1*
**
(8)
Th
isfi
rmto
avo
idv
iola
tin
g
deb
t-co
ven
ants
29
.93
1.3
-0
.06
-0
.28
0.2
2*
**
*
(9)
Th
isfi
rm’s
emplo
yee
sto
achie
ve
bonuse
s
27
.83
4.2
-0
.14
**
0.0
6-
0.2
0*
**
**
Res
po
nd
ents
’an
swer
sco
uld
var
yb
etw
een
-2
(i.e
.,st
rong
lyd
isag
ree)
and
?2
(i.e
.,st
rongly
agre
e).
The
table
show
sth
eper
centa
ge
of
resp
onden
tsw
ho
answ
ered
agre
eor
stro
ng
lyag
ree,
the
per
cen
tag
eo
fre
spo
nd
ents
wh
oan
swer
edd
isag
ree
or
stro
ng
lyd
isag
ree,
and
the
aver
age
rati
ng
.A
hig
her
aver
age
rati
ng
corr
esp
ond
sto
gre
ater
agre
emen
t.T
he
tab
leal
sop
rov
ides
the
aver
age
rati
ng
of
the
pu
bli
cfi
rmC
FO
sd
eriv
edfr
om
Gra
ham
etal
.(2
00
5).
We
calc
ula
teth
ed
iffe
ren
ceas
the
anal
yst
s’av
erag
e
rati
ng
min
us
the
CF
Os’
aver
age
rati
ng
.T
he
firs
td
iffe
ren
cete
stp
rov
ides
the
sign
ifica
nce
of
the
ou
tco
me
of
ad
iffe
ren
ce-o
f-m
eans
t-te
st.
Th
ese
con
dte
stis
the
ou
tco
me
of
anord
ered
logit
regre
ssio
n,
wher
eth
edep
enden
tvar
iable
isth
ean
swer
edval
ue
and
the
indep
enden
tvar
iable
sar
ean
anal
yst
dum
my
that
equal
sone
for
ob
serv
atio
ns
fro
m
ou
ran
aly
stsa
mple
,fo
ur
rev
enu
esd
um
mie
s,an
dn
ine
indu
stry
du
mm
ies.
Th
eco
rrec
ted
dif
fere
nce
b=
0is
the
sign
ifica
nce
of
the
coef
fici
ent
of
the
anal
yst
du
mm
y.
**
*,
**,
and
*den
ote
that
the
dif
fere
nce
sar
esi
gnifi
cant
atth
e1,
5,
and
10
%le
vel
,re
spec
tivel
y
614 A. de Jong et al.
123
Ta
ble
4S
urv
eyre
spo
nse
toth
eq
ues
tio
n:
do
thes
est
atem
ents
des
crib
ew
hy
the
firm
yo
ufo
llo
wsh
ould
try
toav
oid
mis
sin
gan
earn
ings
ben
chm
ark
?
Mis
sing
anea
rnin
gs
ben
chm
ark
hu
rts
this
firm
bec
ause
…A
nal
yst
sam
ple
An
alyst
sv
ersu
sC
FO
s
Per
cen
tag
ree
or
stro
ng
lyag
ree
Per
cen
td
isag
ree
or
stro
ng
lyd
isag
ree
Av
erag
e
rati
ng
H0:
aver
age
rati
ng
=0
Av
erag
e
rati
ng
CF
Os
Dif
fere
nce
H0:
dif
fere
nce
=0
H0:
corr
ecte
d
dif
fere
nce
b=
0
(1)
Itcr
eate
su
nce
rtai
nty
abo
ut
the
firm
’sfu
ture
pro
spec
ts
88
.54
.71
.31
**
*0
.97
0.3
4*
**
**
*
(2)
Th
ere
may
be
pre
vio
usl
yu
nk
no
wn
pro
ble
ms
atth
efi
rm
79
.77
.80
.99
**
*0
.49
0.5
0*
**
**
*
(3)
Itle
ads
toin
crea
sed
scru
tin
yo
fal
l
asp
ects
of
the
firm
’sea
rnin
gs
rele
ases
54
.41
6.2
0.4
8*
**
0.0
70
.41
**
**
**
(4)
Th
efi
rmm
ayla
ckth
efl
exib
ilit
yto
mee
tth
eb
ench
mar
k
42
.02
3.7
0.1
9*
**
-0
.14
0.3
3*
**
**
*
(5)
Itin
crea
ses
the
po
ssib
ilit
yo
f
law
suit
s
8.5
58
.3-
0.7
4*
**
-0
.20
-0
.53
**
**
**
Res
po
nd
ents
’an
swer
sco
uld
var
yb
etw
een
-2
(i.e
.,st
rong
lyd
isag
ree)
and
?2
(i.e
.,st
rongly
agre
e).
The
table
show
sth
eper
centa
ge
of
resp
onden
tsw
ho
answ
ered
agre
eor
stro
ng
lyag
ree,
the
per
cen
tag
eo
fre
spo
nd
ents
wh
oan
swer
edd
isag
ree
or
stro
ng
lyd
isag
ree,
and
the
aver
age
rati
ng
.A
hig
her
aver
age
rati
ng
corr
esp
onds
tog
reat
er
agre
emen
t.T
he
tab
leal
sop
rov
ides
the
aver
age
rati
ng
of
the
pu
bli
cfi
rmC
FO
sd
eriv
edfr
om
Gra
ham
etal
.(2
00
5).
We
calc
ula
teth
ed
iffe
ren
ceas
the
anal
yst
s’av
erag
e
rati
ng
min
us
the
CF
Os’
aver
age
rati
ng
.T
he
firs
td
iffe
ren
cete
stp
rov
ides
the
sign
ifica
nce
of
the
ou
tco
me
of
ad
iffe
ren
ce-o
f-m
eans
t-te
st.
Th
ese
con
dte
stis
the
ou
tco
me
of
anord
ered
logit
regre
ssio
n,
wher
eth
edep
enden
tvar
iable
isth
ean
swer
edval
ue
and
the
indep
enden
tvar
iable
sar
ean
anal
yst
dum
my
that
equal
sone
for
ob
serv
atio
ns
fro
m
ou
ran
aly
stsa
mple
,fo
ur
rev
enu
esd
um
mie
s,an
dn
ine
indu
stry
du
mm
ies.
Th
eco
rrec
ted
dif
fere
nce
b=
0is
the
sign
ifica
nce
of
the
coef
fici
ent
of
the
anal
yst
du
mm
y.
**
*,
**,
and
*den
ote
that
the
dif
fere
nce
sar
esi
gnifi
cant
atth
e1,
5,
and
10
%le
vel
,re
spec
tivel
y
Survey evidence from financial analysts 615
123
not meet analyst forecasts are more likely to be replaced. As can be seen in Table 3,
82.2 % of the analysts agree that firms should achieve earnings benchmarks for the
external reputation of the firm’s management team. The interviews corroborate the
relevance of this perspective. Nearly all the analysts explained that, benchmarks
being strongly based on previous expectations provided by management teams,
meeting benchmarks demonstrates the capabilities of the managers. Meeting
forecasts, observed one analyst, ‘‘provides a signal about the management team.
They should know what is going on in their own firm.’’
Bowen et al. (1995) and Burgstahler and Dichev (1997) argue that firms with
higher earnings can get better terms of trade with stakeholders like customers,
suppliers, and lenders because higher earnings can enhance their reputation for
fulfilling the stakeholders’ claims. Meeting earnings benchmarks can have the same
implications. Our results show that 41.2 % of the analysts view assurance of a stable
business to customers and suppliers to be an important reason for meeting earnings
benchmarks. CFOs attach more importance than analysts suggest to the stakeholder
motivation for meeting earnings benchmarks. Analyst client bases that consist
mainly of one type of stakeholder, investors, might explain their different view. One
alternative view is that analysts do not fully account for CFOs’ stakeholder-related
incentives to meet earnings benchmarks. Consistent with the CFOs’ answers,
analysts do not believe earnings benchmarks to be important with respect to credit
ratings, debt covenants, employee bonuses, and the potential for lawsuits.
Overall, our analysis of analysts’ opinions relative to those of the CFOs indicates
that analysts share CFOs’ beliefs regarding the importance of meeting earnings
benchmarks. We further show that, although they claim to seek reasons for missed
benchmarks and to believe that benchmarks missed for temporary reasons should
not have severe consequences for firm valuation, analysts’ answers regarding
missing/meeting earnings benchmarks suggest that they develop a negative view of
firms that miss short-term earnings targets. A possible explanation for this negative
view, corroborated by our interviews, is that analysts are aware of CFOs’ discretion
to manage earnings to a benchmark.
4 Analysts’ beliefs regarding the valuation implications of earningsmanagement
Empirical evidence suggests that firms use either accounting (i.e., accruals) or real
actions to reduce the probability of missing earnings benchmarks.3 Market rewards
that accrue to firms that meet earnings benchmarks4 depend on the actions taken to
3 See, for example, Ayers et al. (2006) for evidence on using accruals earnings management to meet
earnings benchmarks. See, for example, Bartov (1993) and Dechow and Sloan (1991) for earlier work and
Cohen et al. (2010), Hribar et al. (2006), and Roychowdhury (2006) for more recent work on using real
earnings management to meet benchmarks. Zang (2012) shows that real earnings management and
accruals-based earnings management act as substitutes.4 Note however that benefits are short-lived. Bhojraj et al. (2009) show that, on a three-year horizon,
firms that miss their benchmark but do not manage earnings (real, accruals, or both) tend to outperform
firms that achieve their benchmark by means of earnings management.
616 A. de Jong et al.
123

meet those benchmarks. Rewards are greater, for example, for firms that meet
consensus analyst forecasts by means of real earnings management than for firms
that use accruals management (Chen et al. 2010). Whereas firms that use accruals
management (Bartov et al. 2002) or classification shifting to meet benchmarks earn
a lower, but positive, premium (Athanasakou et al. 2011), the market reaction ceases
to be positive for firms that reduce tax expenses (Gleason and Mills 2008).
Moreover, firms that meet analyst earnings forecasts through share repurchases,
even though doing so helps to forestall extreme declines in share price, tend to be
discounted by analysts (Hribar et al. 2006). In their review, Dechow et al. (2010)
suggest that different responses to earnings management in relation to target beating
may be explained by the fact that some types of earnings management are more
easily detected than others.
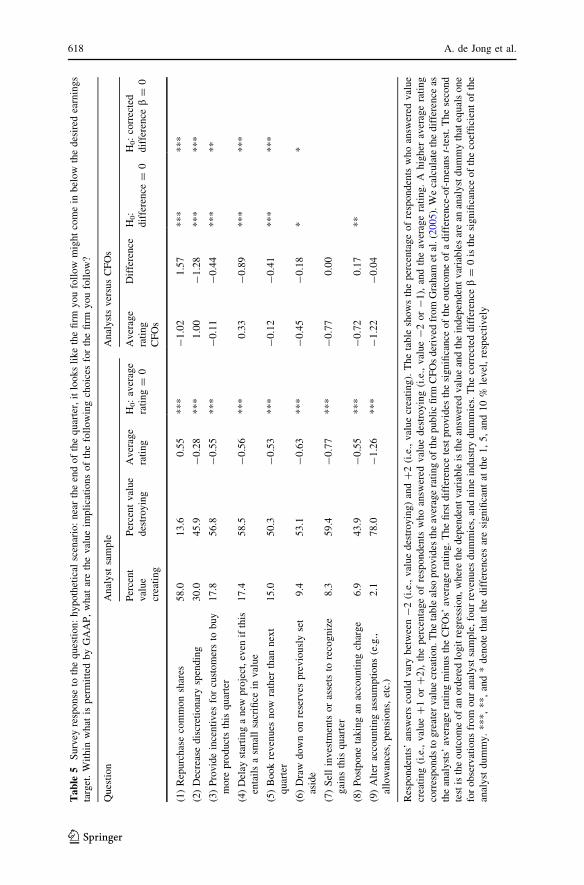
Table 5 reports analysts’ answers to the question regarding the perceived value
implications of employing various within-GAAP earnings management actions to
achieve earnings targets. In comparing analysts’ with CFOs’ answers, it should be
noted that Graham et al. ask CFOs which of the choices their firms might make
rather than the value implications of the choices.
We find that analysts believe that, share repurchases excepted, most types of
earnings management are value destroying. Our results further indicate that,
analysts view real actions more positively than accruals actions to meeting earnings
targets. The top four of the most value-enhancing/least value-destroying choices are
repurchasing common shares (ranked 1), decreasing discretionary spending (ranked
2), providing incentives for customers to buy more products in the present quarter
(ranked 3), and delaying the start of a new project, even if doing so entails a small
sacrifice in value (ranked 4), all of which are real actions. Excepting the decision to
sell investments or assets to recognize gains in the present quarter (ranked 7), the
bottom of the list contains accruals actions.
A comparison of analysts’ responses and the CFO results of Graham et al. reveals
a remarkable correspondence between the actions CFOs might make and the value
implications as perceived by analysts. Although CFOs’ preference for real earnings
management is not surprising,5 analysts’ positive view of real earnings management
is, especially given the impact of real earnings management on firms’ actual cash
flows. One explanation for analysts’ positive view is that they perceive attaining the
earnings benchmark by means of real earnings management to be a positive signal
of future firm performance (e.g., Bartov et al. 2002; Chen et al. 2010).
Three real earnings management actions CFOs are willing to take are considered
by analysts to be value destroying. As noted above, this inconsistency may be
occasioned by the different questions asked to CFOs and analysts. Our results
indicate that the first action, share repurchasing, although viewed by analysts as the
most value-enhancing action firms can take to meet earnings targets (average rating
5 The Graham et al. interviews clarify CFOs’ preference in terms of fear of legal action should regulators
suspect earnings management, which is more apparent with accruals than with real actions. Even when
earnings choices are made within GAAP, regulators can construe the choices to constitute earnings
management with managerial intent to obscure true economic performance (Dechow and Skinner 2000).
The consequences of being targeted for financial misrepresentation are severe for both firm and managers
(Karpoff et al. 2008a, b).
Survey evidence from financial analysts 617
123
Ta
ble
5S
urv
eyre
spo
nse
toth
eq
ues
tio
n:
hy
poth
etic
alsc
enar
io:
nea
rth
een
do
fth
eq
uar
ter,
itlo
ok
sli
ke
the
firm
yo
ufo
llo
wm
igh
tco
me
inb
elow
the
des
ired
earn
ing
s
targ
et.
Wit
hin
wh
atis
per
mit
ted
by
GA
AP
,w
hat
are
the
val
ue
imp
lica
tio
ns
of
the
foll
ow
ing
cho
ices
for
the
firm
yo
ufo
llo
w?
Ques
tion
Anal
yst
sam
ple
Anal
yst
sver
sus
CF
Os
Per
cen
t
val
ue
crea
tin
g
Per
cen
tv
alue
des
troy
ing
Av
erag
e
rati
ng
H0:
aver
age
rati
ng
=0
Av
erag
e
rati
ng
CF
Os
Dif
fere
nce
H0:
dif
fere
nce
=0
H0:
corr
ecte
d
dif
fere
nce
b=
0
(1)
Rep
urc
has
eco
mm
on
shar
es5
8.0
13
.60
.55
**
*-
1.0
21
.57
**
**
**
(2)
Dec
reas
ed
iscr
etio
nar
ysp
endin
g3
0.0
45
.9-
0.2
8*
**
1.0
0-
1.2
8*
**
**
*
(3)
Pro
vid
ein
cen
tiv
esfo
rcu
sto
mer
sto
bu
y
mo
rep
rod
uct
sth
isq
uar
ter
17
.85
6.8
-0
.55
**
*-
0.1
1-
0.4
4*
**
**
(4)
Del
ayst
arti
ng
an
ewp
roje
ct,
even
ifth
is
enta
ils
asm
all
sacr
ifice
inv
alu
e
17
.45
8.5
-0
.56
**
*0
.33
-0
.89
**
**
**
(5)
Boo
kre
ven
ues
no
wra
ther
than
nex
t
qu
arte
r
15
.05
0.3
-0
.53
**
*-
0.1
2-
0.4
1*
**
**
*
(6)
Dra
wd
ow
no
nre
serv
esp
rev
iou
sly
set
asid
e
9.4
53
.1-
0.6
3*
**
-0
.45
-0
.18
**
(7)
Sel
lin
ves
tmen
tso
ras
sets
tore
cog
niz
e
gai
ns
this
qu
arte
r
8.3
59
.4-
0.7
7*
**
-0
.77
0.0
0
(8)
Po
stp
on
eta
kin
gan
acco
un
tin
gch
arg
e6
.94
3.9
-0
.55
**
*-
0.7
20
.17
**
(9)
Alt
erac
cou
nti
ng
assu
mp
tio
ns
(e.g
.,
allo
wan
ces,
pen
sio
ns,
etc.
)
2.1
78
.0-
1.2
6*
**
-1
.22
-0
.04
Res
po
nd
ents
’an
swer
sco
uld
var
yb
etw
een
-2
(i.e
.,v
alu
ed
estr
oy
ing
)an
d?
2(i
.e.,
val
ue
crea
ting).
The
table
show
sth
eper
centa
ge
of
resp
onden
tsw
ho
answ
ered
val
ue
crea
ting
(i.e
.,val
ue
?1
or
?2),
the
per
centa
ge
of
resp
onden
tsw
ho
answ
ered
val
ue
des
troyin
g(i
.e.,
val
ue
-2
or
-1
),an
dth
eav
erag
era
tin
g.
Ah
igh
erav
erag
era
tin
g
corr
esp
on
ds
tog
reat
erv
alu
ecr
eati
on
.T
he
tab
leal
sop
rov
ides
the
aver
age
rati
ng
of
the
pu
bli
cfi
rmC
FO
sd
eriv
edfr
om
Gra
ham
etal
.(2
00
5).
We
calc
ula
teth
ed
iffe
ren
ceas
the
anal
yst
s’av
erag
era
ting
min
us
the
CF
Os’
aver
age
rati
ng
.T
he
firs
td
iffe
ren
cete
stp
rov
ides
the
sig
nifi
can
ceo
fth
eo
utc
om
eo
fa
dif
fere
nce
-of-
mea
ns
t-te
st.
Th
ese
con
d
test
isth
eoutc
om
eof
anord
ered
logit
regre
ssio
n,
wher
eth
edep
enden
tvar
iable
isth
ean
swer
edval
ue
and
the
indep
enden
tv
aria
ble
sar
ean
anal
yst
dum
my
that
equ
als
on
e
for
ob
serv
atio
ns
fro
mo
ur
anal
yst
sam
ple
,fo
ur
rev
enu
esd
um
mie
s,an
dn
ine
ind
ust
ryd
um
mie
s.T
he
corr
ecte
dd
iffe
ren
ceb
=0
isth
esi
gn
ifica
nce
of
the
coef
fici
ent
of
the
anal
yst
du
mm
y.
**
*,
**
,an
d*
den
ote
that
the
dif
fere
nce
sar
esi
gn
ifica
nt
atth
e1
,5
,an
d1
0%
lev
el,
resp
ecti
vel
y
618 A. de Jong et al.
123
equals 0.55), is not favored by CFOs as an option for meeting earnings targets
(average rating equals -1.02). In the interviews, analysts attribute the value effect
of repurchasing to (1) a signal of underpriced stock and (2) repayment of free cash
flows. It is not obvious why a repurchase transaction designed merely to meet
earnings expectations might enhance value. Perhaps analysts are positive about
share repurchases because they are easier to detect, a conjecture consistent with the
market discounting of firms that meet earnings benchmarks by repurchasing shares
(Hribar et al. 2006). The ease with which this type of earnings management can be
unraveled might account for CFOs’ reluctance to take this action.
The two other types of real earnings management for which analysts’ and CFOs’
attitudes differ are reduction in discretionary spending and delay of new projects.
Although analysts, on average, find these two options (with average ratings of
-0.28 and -0.56, respectively) to be value-destroying, CFOs view the actions (with
average ratings of 1.00 and 0.33, respectively) as acceptable for meeting
benchmarks. In contrast to the share repurchasing option, CFOs might prefer these
actions because they are less detectable by analysts and other market participants.
For their part, analysts might be unwilling to admit that they cannot detect
discretionary spending cuts or delayed project initiations undertaken for the sake of
meeting benchmarks.
5 Analysts’ beliefs regarding the consequences of smoothing earnings
There is considerable evidence that many firms smooth their earnings path (see, for
example, Barth et al. 1999, Beidleman 1973; Hand 1989; Myers et al. 2007). In
interviews conducted by Graham et al., CFOs maintain that earnings volatility is
directly related to missing consensus analyst forecasts as earnings benchmarks,
thereby occasioning uncertainty among market participants about firm value. In this
section, we examine how analysts view the consequences of smoothing and whether
they believe firms should sacrifice value to smooth earnings.
5.1 Consequences for firms that smooth their earnings path
Empirical evidence relating earnings smoothing to firm pricing value is mixed.
Although some studies find earnings smoothing to be negatively associated with
cost of equity (Francis et al. 2004) and positively with share price (e.g., Myers et al.
2007; Ronen and Sadan 1981), the positive effect on share price disappears when a
string of earnings increases ends (Myers et al. 2007). Moreover, McInnis’s (2010)
application of asset pricing techniques shows no relation between earnings
smoothness and returns. This finding is in line with Verrecchia’s (2010) view that,
because their motivation is associated with perceived greater wealth, managers’
preference for smooth earnings paths is heuristic.6 Earnings smoothing can also
6 Supporting evidence is the following text from Graham et al. (p. 47): ‘‘Without exception, every CFO
we spoke with prefers a smoother earnings path to a bumpier one, even if the underlying cash flows are
the same.’’
Survey evidence from financial analysts 619
123
Ta
ble
6S
urv
eyre
sponse
toth
eques
tion:
ifth
efi
rmyou
foll
ow
would
smooth
its
earn
ings
pat
h,
what
would
be
the
conse
quen
ces?
Ifth
efi
rmth
atI
foll
ow
wo
uld
smo
oth
its
earn
ing
sp
ath…
An
alyst
sam
ple
An
aly
sts
vs.
CF
Os
Per
cen
tag
ree
or
stro
ng
ly
agre
e
Per
cen
td
isag
ree
or
stro
ng
ly
dis
agre
e
Av
erag
e
rati
ng
H0:
aver
age
rati
ng
=0
Av
erag
e
rati
ng
CF
Os
Dif
fere
nce
H0:
dif
fere
nce
=0
H0:
corr
ecte
d
dif
fere
nce
b=
0
(1)
Itw
ou
ldb
eea
sier
top
red
ict
this
firm
’sfu
ture
earn
ing
s
83
.08
.51
.01
**
*0
.99
0.0
2
(2)
Th
isfi
rmw
ou
ldb
ele
ssri
sky
56
.72
2.3
0.3
7*
**
1.1
8-
0.8
1*
**
**
*
(3)
Th
isfi
rmw
ou
ldas
sure
cust
om
ers/
sup
pli
ers
that
bu
sin
ess
isst
able
43
.82
4.9
0.1
7*
**
0.6
1-
0.4
4*
**
**
*
(4)
Th
isfi
rmw
ou
ldre
du
ceth
ere
turn
that
inves
tors
dem
and
42
.22
5.9
0.1
6*
**
0.5
5-
0.3
9*
**
**
*
(5)
Th
isfi
rmw
ou
ldp
rom
ote
are
pu
tati
on
for
tran
spar
ent
and
accu
rate
report
ing
35
.13
3.3
-0
.06
0.3
2-
0.3
8*
**
**
*
(6)
This
firm
would
achie
ve
or
pre
serv
e
ad
esir
edcr
edit
rati
ng
34
.22
0.6
0.1
0*
0.2
1-
0.1
1*
**
(7)
Th
isfi
rmw
ou
ldco
nv
eyh
igh
erfu
ture
gro
wth
pro
spec
ts
22
.63
8.4
-0
.22
**
*0
.42
-0
.64
**
**
**
(8)
Th
isfi
rmw
ou
ldcl
arif
ytr
ue
eco
no
mic
per
form
ance
19
.94
2.4
-0
.32
**
*-
0.0
5-
0.2
7*
**
**
*
Res
po
nd
ents
’an
swer
sco
uld
var
yb
etw
een
-2
(i.e
.,st
rong
lyd
isag
ree)
and
?2
(i.e
.,st
rongly
agre
e).
The
table
show
sth
eper
centa
ge
of
resp
onden
tsw
ho
answ
ered
agre
eor
stro
ng
lyag
ree,
the
per
cen
tag
eo
fre
spo
nd
ents
wh
oan
swer
edd
isag
ree
or
stro
ng
lyd
isag
ree,
and
the
aver
age
rati
ng
.A
hig
her
aver
age
rati
ng
corr
esp
onds
tog
reat
er
agre
emen
t.T
he
tab
leal
sop
rov
ides
the
aver
age
rati
ng
of
the
pu
bli
cfi
rmC
FO
sd
eriv
edfr
om
Gra
ham
etal
.(2
00
5).
We
calc
ula
teth
ed
iffe
ren
ceas
the
anal
yst
s’av
erag
e
rati
ng
min
us
the
CF
Os’
aver
age
rati
ng
.T
he
firs
td
iffe
ren
cete
stp
rov
ides
the
sign
ifica
nce
of
the
ou
tco
me
of
ad
iffe
ren
ce-o
f-m
eans
t-te
st.
Th
ese
con
dte
stis
the
ou
tco
me
of
anord
ered
logit
regre
ssio
n,
wher
eth
edep
enden
tvar
iable
isth
ean
swer
edval
ue
and
the
indep
enden
tvar
iable
sar
ean
anal
yst
dum
my
that
equal
sone
for
ob
serv
atio
ns
fro
m
ou
ran
aly
stsa
mple
,fo
ur
rev
enu
esd
um
mie
s,an
dn
ine
indu
stry
du
mm
ies.
Th
eco
rrec
ted
dif
fere
nce
b=
0is
the
sign
ifica
nce
of
the
coef
fici
ent
of
the
anal
yst
du
mm
y.
**
*,
**,
and
*den
ote
that
the
dif
fere
nce
sar
esi
gnifi
cant
atth
e1,
5,
and
10
%le
vel
,re
spec
tivel
y
620 A. de Jong et al.
123
reduce the cost of debt and enhance trade terms with suppliers and customers
(Trueman and Titman 1988), help to realize bonus targets (Healy 1985), and protect
managers’ jobs (Fudenberg and Tirole 1995).
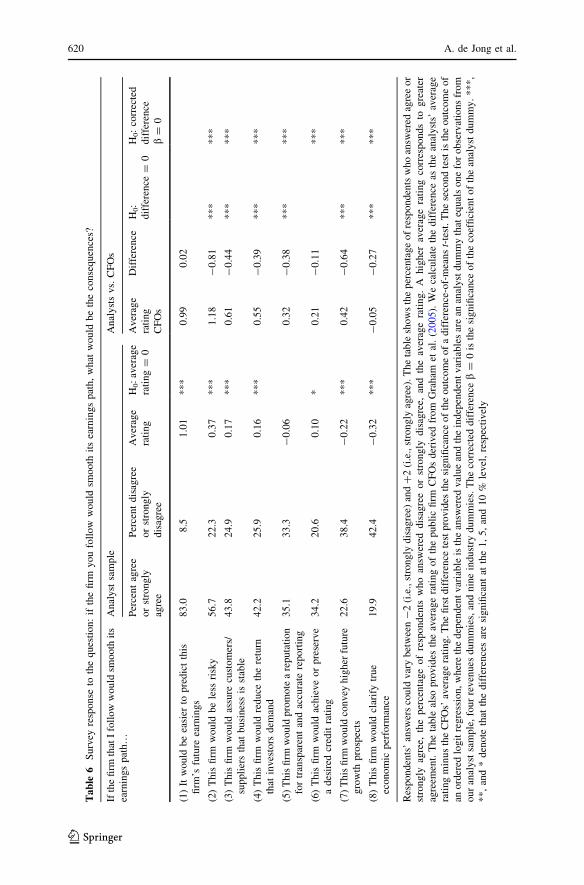
Analysts’ opinions regarding the consequences of earnings smoothing for the
firms they follow are reported in Table 6.
Our main result is that analysts believe in smoothing earnings to reduce
perceived firm riskiness. Smoothed earnings are perceived by 83 % of the analysts
to be easier to predict, by 56.7 % to be less risky, and by 42.2 % to characterize
firms with a lower required return. As one interviewee put it, ‘‘Smoothing lifts the
valuation because it increases predictability, which reduces volatility…. A little bit
makes sense.’’ Although analysts share CFOs’ beliefs regarding these statements,
CFOs’ significantly higher average rating of perceived riskiness and required returns
of firms with smooth earnings paths suggest a more optimistic appraisal of the
consequences of smoothing.
We find disagreement between analysts and CFOs on two consequences of
earnings smoothing. First, a smooth earnings path is perceived to be more
informative of firms’ growth prospects by CFOs (average rating = 0.42) but not by
analysts (average rating = -0.22). Second, the average rating of analysts who find
earnings smoothing to promote firms’ reputation for transparency and accurate
reporting is -0.06, while that of CFOs is 0.32. Thus smoothing is acknowledged by
analysts to make earnings more predictable, but it is not expected to reduce
information asymmetries.
The interviews also surfaced the argument that earnings smoothing substitutes a
black box for what is happening in firms. ‘‘In the long run,’’ explained one analyst,
‘‘it helps their stock price because of predictability, but it hurts our ability to see
what the fair value is.’’ This statement corresponds with analysts’ disagreement with
the survey statement that firms clarify true economic performance by smoothing
earnings (average rating = -0.32). Another interviewee summarized the pros and
cons of smoothing succinctly with the following observation: ‘‘We do not want
them to smooth, but we love smooth earnings paths.’’ Smooth earnings paths,
because analysts associate them with higher firm value, are liked by analysts and
bumpy earnings paths that are smoothed disliked because they impede assessment
of the businesses and,hence the ability to deliver reliable reports.7 We infer from
this paradoxical finding that analysts are not always able to detect CFOs’ earnings
smoothing.
This finding also suggests that analysts are forced to trade off incentives to
maximize forecast accuracy, with a possible reputation loss from overlooking
earnings management. On the one hand, analysts aim to limit their reputational risk
from overlooking earnings management by following firms that do not smooth their
earnings paths; on the other hand, analysts have incentives to maximize forecast
accuracy by following firms with smooth earnings paths.
7 Although our survey does not distinguish between whether smoothing is sustainable, this distinction is
crucial to determine the usefulness of smoothing. If CFOs are good at predicting future performance and
smooth to reflect the average level of expected performance, this can help analysts’ assessment of these
firms’ businesses. But if they smooth temporarily in the face of erratic and declining performance and
they have to take a subsequent big write-down, this does impede analysts’ assessment.
Survey evidence from financial analysts 621
123

5.2 Sacrificing value to avoid bumpy earnings paths
Analysts’ answers to the question of how much value CFOs should sacrifice to avoid
a bumpy earnings path are presented in Table 7 for discrete levels of value sacrifice.
Only one third of the analysts believe firms should not sacrifice value to avoid a
bumpy earnings path. ‘‘I don’t think firms should be that short-sighted,’’ remarked
one analyst. ‘‘The firm may experience a short-term dislocation in the stock price,
but over time they will get credit for having the credibility.’’ About half of the
analysts believe firms should sacrifice a small amount of money to avoid a bumpy
earnings path and 13.2 % (i.e., 12.1 % plus 1.1 %) believe that firms should make a
moderate to large sacrifice. These results suggest that most analysts recognize the
advantages of a smooth earnings path.
We investigate the consistency of the analysts’ responses (in an unreported
regression analysis). In this analysis, we explain the value sacrifice by using the
answers to the questions on the consequences of smoothing (as in Table 6). We
estimate eight ordered logit regressions, adding to each one of eight answers to the
question on the consequences of smoothing (e.g., ‘‘this firm would be less risky’’),
and control for guidance, analyst tenure, portfolio size, firm size, and industry. The
coefficients of the expected consequences are always positive and significant at the
1 % level, which indicates that the more positive analysts’ answers are regarding
Table 7 Survey response to the question: how large a sacrifice in value should the firm you follow make
to avoid a bumpy earnings path?
Analyst
sample
Analysts versus CFOs
Percent of
respondents
Percent of
respondents
CFOs
Difference H0:
difference = 0
H0: corrected
difference
b = 0
None 33.5 5.5 27.9 *** ***
Small sacrifice 53.3 33.6 19.8 *** ***
Moderate sacrifice 12.1 46.9 -34.8 *** ***
Large sacrifice 1.1 14.0 -12.9 *** ***
H0: corrected
difference all groups
(b) = 0
-2.318***
Respondents’ answers could vary between 0 (i.e., none) and ?3 (i.e., large sacrifice). The table shows the
percentage of respondents per answer. The table also provides the percentage of respondents of the public
firm CFOs derived from Graham et al. (2005). We calculate the difference as the analysts’ average rating
minus the CFOs’ average rating. The first difference test provides the significance of the outcome of a
difference-of-means t-test. The second test is the outcome of a binary logit regression, where the
dependent variable is a dummy that equals one if the analyst provided that value as the answer (e.g., for
the answer no sacrifice in value, the dummy is one if the analyst checked ‘‘none’’ and zero otherwise).
The independent variables are an analyst dummy that equals one for observations from our analyst
sample, four revenues dummies, and nine industry dummies. The corrected difference b = 0 is the
significance of the coefficient of the analyst dummy. The corrected difference of all groups is the analyst
coefficient and its significance of an ordered logit regression with the same independent variables as the
previous regression but with the value of the answer that ranges from 0 to 3 as the dependent variable.
***, **, and * denote that the differences are significant at the 1, 5, and 10 % level, respectively
622 A. de Jong et al.
123
their perceived consequences of smoothing, the more likely they are to recommend
larger value sacrifices.
We observe a distinct contrast when we compare with those of the CFOs our
results regarding the question of how much value CFOs should sacrifice to avoid
bumpy earnings. Willingness to make a moderate to large sacrifice is expressed by
60.9 % (i.e., 46.9 % plus 14 %) of the CFOs, compared to 13.2 % of the analysts
who recommend that firms make such sacrifices. The CFOs, claiming ‘‘the market
hates uncertainty,’’ provide share-price related arguments for sacrificing value for a
smooth earnings path (Graham et al., p. 49). This greater willingness to sacrifice
value might be explained by their more optimistic view of the consequences of
smooth earnings paths.
6 Conclusion
Survey evidence reported in Graham et al. suggests that CFOs believe that earnings
management can enhance investor perception of firm value. We survey 306
financial analysts and interview 21 of them to gain insight to their views on earnings
management. We then compare their views with those of the public firm CFOs
derived from the survey data used by Graham et al. to examine whether analysts’
views are in line with those of CFOs.
We first investigate analysts’ beliefs regarding the importance of meeting
earnings benchmarks and demonstrate that analysts generally share the CFOs’
beliefs. We further find that analysts are aware of the CFOs’ discretion in
managing earnings. We examine analysts’ beliefs regarding the value implications
of using different earnings management techniques to reach a benchmark and
document that analysts perceive all earnings management techniques, save share
repurchases, to be value destroying. Interestingly, CFOs, although reluctant to
repurchase shares, are willing to take actions viewed by analysts as value
destroying (including decreasing discretionary spending); this preference might be
explained by analysts’ inability to detect certain earnings management techniques.
Finally, we describe analysts’ beliefs regarding the consequences of earnings
smoothing and find that analysts believe smoothing earnings to reduce the
perceived riskiness of the firm to other stakeholders and to be worth a small
sacrifice in value.
Although our research provides novel insights into analysts’ and investors’
perceptions of firm value, we cannot provide conclusive answers regarding its
implications for actual or intrinsic value. We demonstrate that analysts endorse, to
a degree, CFOs’ value-destroying decision to smooth earnings and manage
earnings to benchmarks. This is because the enhanced investor perception of firm
value that may accrue to these decisions can have real consequences for intrinsic
value, as in reducing a firm’s financing costs. CFOs, in corporate financial
reporting decisions, might balance the negative effects of sacrificing economic
value and positive effects of enhanced investor perception of firm value. Because
our survey evidence cannot measure the net value effects, we leave this issue for
further research.
Survey evidence from financial analysts 623
123
Acknowledgments We thank Anna Gold, Alan Goodacre, Reggy Hooghiemstra, Nancy Huyghebaert,
Teye Marra, Marlene Plumlee, Shiva Rajgopal, Rui Shen, Mathijs van Dijk, Marcel van Rinsum, Yulia
Veld-Merkoulova, and seminar participants at K. U. Leuven, Rotterdam School of Management Erasmus
University, University of Antwerp, University of Groningen, and University of Stirling for helpful
comments. We are grateful to John Graham, Campbell Harvey, and Shiva Rajgopal for providing their
CFO survey data to us. Finally, we are grateful to the financial analysts who took the time to fill out our
survey or to be interviewed by us. The paper was previously entitled ‘‘The demand for corporate financial
reporting: a survey among financial analysts’’.
Appendix 1: Survey and interview design
Survey design
During the period of July to October 2007, we approached the heads of the equity
research departments of 11 of the world’s largest investment banks. Upon
guaranteeing to their compliance departments anonymity for the participating
banks and sell-side analysts, all institutions agreed to participate. Heads of equity
research departments dispatched e-mails requesting that their analysts participate
and providing the link to the survey website. Each institution informed us of the
number of sell-side analysts approached. The total was 638, with a median of 68 per
bank. We offered respondents a copy of the results and donated to a charity of the
respondents’ choice $10 for each completed survey. Responses with fewer than 10
answers were automatically deleted. The 306 usable responses received during the
period of 18 July to 30 October 2007 constituted a response rate of 48 %.8
To participate in the study, analysts had to follow at least one US firm. We start
with three questions. Does the analyst follow at least one firm with an official listing
in the United States? What is the number of firms the analyst follows? How many
years of experience does the analyst have? For respondents who do not follow a US
firm, the survey ends. If an analyst’s portfolio includes at least one US firm, the
following message appears: ‘‘The goal of this survey is to compare your responses
to those of CFOs of US companies. In order to allow such a comparison, we would
like to ask you to answer all subsequent questions for a particular US firm. Please
think of a randomly chosen US firm in your portfolio and answer the following
questions for this specific firm. We will refer to this firm as the firm you follow.’’
This approach enables us to compare the analysts’ opinions with the CFOs’
responses. Seven subsequent screens pose questions about earnings measures,
earnings benchmarks, and earnings smoothing. Not being permitted by the
compliance departments to ask the names of the firms the analysts had chosen,
we requested on the final screen such general information as firm revenue, industry,
number of analysts following, earnings guidance, credit rating, price-earnings ratio,
and number of years the CEO has been in office. The questions on this final screen
enable a comparison of our sample of firms with the sample firms in Graham et al.
The tables in this paper thus present a comparison with the CFOs’ opinions as well
8 The response rate compares favorably with previous studies. For CFOs, Graham et al. and Gibbins,
McCracken, and Salterio (2007) report response rates of 10.4 and 15.1 %, respectively. For analysts,
Block (1999) reports a response rate of 33.7 %.
624 A. de Jong et al.
123
as the results of our analyst survey. The survey is available upon request from the
corresponding author.
A common concern with surveys is lack of correspondence between respondents’
answers and actual opinions. We believe the setup of our survey to minimize this
bias. Although other studies have demonstrated that analysts’ objectivity and
judgment is limited by principal-agent problems between firms and analysts, analyst
career concerns, and behavioral biases, these effects are most relevant in analyst
reports, recommendations, and estimations for specific firms. We do not believe that
these biases play a significant role in our survey setting because the answers do not
affect client and management relations and do not involve a published analysis of a
firm.
Testing for nonresponse bias by comparing the responses of early and late
respondents, we find no evidence of bias. We also test for representativeness bias,
that is, whether the firms chosen by the responding analysts are characteristic of the
universe of US listed firms. To control for differences in numbers of analysts
following firms, we download the numbers of analysts following and sales for all
firms with coverage in the Institutional Brokers Estimate Systems (IBES) and the
Compustat database as of September 2007. Weighting each firm in the Compustat
file with the number of analysts that follow the firm and comparing the summary
statistics of this sample with our survey data, we find our survey to have a slight
overrepresentation of larger firms. The relatively larger firms indicate that our
sample captures the major players that have the greatest effect on the US economy.9
Interview design
We corroborate the survey results and achieve further clarification by means of
interviews conducted with 21 financial analysts in four institutions, a subset of the
investment banks in our survey. All analysts followed mainly US firms. Semi-
structured interviews conducted in person, in June 2008, lasted nearly 7 hours.
Questions followed the sequence of the survey but were asked in a general, open
manner. We requested that the analysts explain their preferences and practices and
asked a number of specific questions regarding survey results that we wished to
clarify. The paper’s emphasis on the survey results is supplemented with additional
insights gleaned from the interviews.
References
Abarbanell, J., & Lehavy, R. (2003). Can stock recommendations predict earnings management and
analysts’ earnings forecast errors? Journal of Accounting Research, 41, 1–31.
Anantharaman, D., & Zhang, Y. (2011). Cover me: Managers’ responses to changes in analyst coverage
in the post-regulation FD period. The Accounting Review, 86, 1851–1885.
9 A detailed description of the nonresponse and representativeness tests is available upon request from
the authors.
Survey evidence from financial analysts 625
123

Athanasakou, V., Strong, N. C., & Walker, M. (2011). The market reward to achieving analyst earnings
expectations: Does managing expectations or earnings matter? Journal of Business Finance &
Accounting, 38, 58–94.
Ayers, B. C., Jiang, J., & Yeung, P. E. (2006). Discretionary accruals and earnings management: An
analysis of pseudo earnings targets. The Accounting Review, 81, 617–652.
Barth, M. E., Elliott, J. A., & Finn, M. W. (1999). Market rewards associated with patterns of increasing
earnings. Journal of Accounting Research, 37, 387–413.
Bartov, E. (1993). The timing of asset sales and earnings manipulation. The Accounting Review, 66,
840–855.
Bartov, E., Givoly, D., & Hayn, C. (2002). The rewards to meeting or beating earnings expectations.
Journal of Accounting and Economics, 33, 173–204.
Beidleman, C. R. (1973). Income smoothing: The role of management. The Accounting Review, 48,
653–667.
Beyer, A. (2008). Financial analysts’ forecast revisions and managers’ reporting behavior. Journal of
Accounting and Economics, 46, 334–348.
Bhojraj, S., Hribar, P., Picconi, M., & McInnis, J. (2009). Making sense of cents: An examination of firms
that marginally miss or beat analyst forecasts. Journal of Finance, 64, 2361–2388.
Block, S. B. (1999). A study of financial analysts: Practice and theory. Financial Analysts Journal, 55,
86–95.
Bowen, R. M., DuCharme, L., & Shores, D. (1995). Stakeholders’ implicit claims and accounting method
choice. Journal of Accounting and Economics, 20, 255–295.
Brown, L. D., & Rozeff, M. (1978). The superiority of analyst forecasts as measures of expectations:
Evidence from earnings. Journal of Finance, 33, 1–16.
Burgstahler, D., & Dichev, I. (1997). Earnings management to avoid earnings decreases and losses.
Journal of Accounting and Economics, 24, 99–126.
Burgstahler, D., & Eames, M. J. (2003). Earnings management to avoid losses and earnings decreases:
Are analysts fooled? Contemporary Accounting Research, 20, 253–294.
Chen, J. Z., Rees, L., Sivaramakrishnan, K. (2010). On the use of accounting versus real earnings
management to meet earnings expectations: A market analysis. Unpublished Working Paper,
University of Colorado at Boulder, Texas A&M University, and University of Houston. http://ssrn.
com/abstract=1070122.
Cohen, D., Mashruwala, R., & Zach, T. (2010). The use of advertising activities to meet earnings
benchmarks: Evidence from monthly data. Review of Accounting Studies, 15, 808–832.
Coles, J. L., Hertzel, M., & Kalpathy, S. (2006). Earnings management around employee stock option
reissues. Journal of Accounting and Economics, 41, 173–200.
Dechow, P. M., Ge, W., & Schrand, C. (2010). Understanding earnings quality: A review of the proxies,
their determinants and their consequences. Journal of Accounting and Economics, 50, 344–401.
Dechow, P. M., & Skinner, D. J. (2000). Earnings management: Reconciling the views of accounting
academics, practitioners, and regulators. Accounting Horizons, 14, 235–250.
Dechow, P. M., & Sloan, R. G. (1991). Executive incentives and the horizon problem. Journal of
Accounting and Economics, 14, 51–89.
DeFond, M. L., & Park, C. W. (1999). The effect of competition on CEO turnover. Journal of Accounting
and Economics, 27, 35–56.
Dutta, S., & Trueman, B. (2002). The interpretation of information and corporate disclosure strategies.
Review of Accounting Studies, 7, 75–96.
Farrell, K. A., & Whidbee, D. A. (2003). Impact of firm performance expectations on CEO turnover and
replacement decisions. Journal of Accounting and Economics, 36, 165–196.
Fischer, P. E., & Stocken, P. (2004). Effect of investor speculation on earnings management. Journal of
Accounting Research, 42, 843–870.
Francis, J., LaFond, R., Olsson, P. M., & Schipper, K. (2004). Cost of equity and earnings attributes. The
Accounting Review, 79, 967–1010.
Fudenberg, D., & Tirole, J. (1995). A theory of income and dividend smoothing based on incumbency
rents. Journal of Political Economy, 103, 75–93.
Gibbins, M., McCracken, S. A., & Salterio, S. E. (2007). The chief financial officer’s perspective on
auditor-client negotiations. Contemporary Accounting Research, 24, 387–422.
Gleason, C. A., & Mills, L. F. (2008). Evidence of differing market responses to beating analysts’ targets
through tax expense decreases. Review of Accounting Studies, 13, 295–318.
626 A. de Jong et al.
123
Graham, J. R., Harvey, C. R., & Rajgopal, S. (2005). The economic implications of corporate financial
reporting. Journal of Accounting and Economics, 40, 3–73.
Hand, J. R. M. (1989). Did firms undertake debt-equity swaps for an accounting paper profit or true
financing gain? The Accounting Review, 64, 587–623.
Healy, P. M. (1985). The effect of bonus schemes on accounting decisions. Journal of Accounting and
Economics, 7, 85–107.
Hribar, P., Jenkins, N. T., & Johnson, W. B. (2006). Stock repurchases as an earnings management
device. Journal of Accounting and Economics, 41, 3–27.
Karpoff, J. M., Lee, D. S., & Martin, G. S. (2008a). The consequences to managers for financial
misrepresentation. Journal of Financial Economics, 88, 193–215.
Karpoff, J. M., Lee, D. S., & Martin, G. S. (2008b). The cost to firms of cooking the books. Journal of
Financial and Quantitative Analysis, 43, 581–612.
Kasznik, R., & McNichols, M. F. (2002). Does meeting earnings expectations matter? Evidence from
analyst forecast revisions and share prices. Journal of Accounting Research, 40, 727–759.
Kim, K., & Schroeder, D. A. (1990). Analysts’ use of managerial bonus incentives in forecasting
earnings. Journal of Accounting and Economics, 13, 3–23.
McInnis, J. (2010). Earnings smoothness, average returns, and implied cost of equity capital. The
Accounting Review, 85, 315–341.
Mittendorf, B., & Zhang, Y. (2005). The role of biased earnings guidance in creating a healthy tension
between managers and analysts. The Accounting Review, 80, 1193–1209.
Mola, S., Rau, P. R., & Khorana, A. (2012). Is there life after the complete loss of analyst coverage?
Accounting Review, (forthcoming) http://ssrn.com/abstract=1573309.
Myers, J. N., Myers, L. A., & Skinner, D. J. (2007). Earnings momentum and earnings management.
Journal of Accounting, Auditing & Finance, 22, 249–284.
Puffer, S. M., & Weintrop, J. B. (1991). Corporate performance and CEO turnover: The role of
performance expectations. Administrative Science Quarterly, 36, 1–19.
Ronen, J., & Sadan, S. (1981). Smoothing income numbers: Objectives and implications. Reading, MA:
Addison-Wesley Publishing Company.
Roychowdhury, S. (2006). Earnings management through real activities manipulation. Journal of
Accounting and Economics, 42, 335–370.
Skinner, D. J., & Sloan, R. G. (2002). Earnings surprises, growth expectations, and stock returns, or,
Don’t let an earnings torpedo sink your portfolio. Review of Accounting Studies, 7, 289–312.
Sloan, R. G. (1996). Do stock prices fully reflect information in accruals and cash flows about future
earnings? The Accounting Review, 71, 289–315.
Trueman, B., & Titman, S. (1988). An explanation for accounting income smoothing. Journal or
Accounting Research, 26, 127–139.
Verrecchia, R. E. (2010). Accounting alchemy. Unpublished working paper, BIS working papers. http://
www.bis.org/publ/work302.pdf.
Womack, K. L. (1996). Do brokerage analysts’ recommendations have investment value? The Journal of
Finance, 51, 137–167.
Zang, A. Y. (2012). Evidence on the trade-off between real activities manipulation and accrual-based
earnings management. The Accounting Review, 87, 675–703.
Survey evidence from financial analysts 627
123