Embed Size (px)
Citation preview
Forging aheadHow do private equity investors create value?A study of 2014 European exits

Forging ahead How do private equity investors create value?
ContentsExecutive summary 1
Key findings 3
Outlook 10
1Forging ahead How do private equity investors create value?
Executive summaryThis is our 10th year of research into how private equity (PE) investors in Europe create value. Analysing the exits from 2005 to 2014 of businesses owned by PE, our studies track PE’s activity and trends, uncover its value creation record and challenge some of the commonly held misperceptions around the industry. This year’s research points to encouraging developments in European PE during 2014, from record-breaking exit figures to an industry in growth mode. It also shows that the industry has demonstrated discipline in the valuations paid for new investments, a critical factor in today’s more competitive market.Following on from the steady recovery seen in 2013, 2014 marked a period of significant, positive change for PE in Europe. In particular, the industry took advantage of improving sentiment around many of Europe’s economies to achieve record-breaking exit levels in 2014. PE exits measured by entry enterprise value (EV) reached the highest value recorded across our studies, comfortably beating the 2006 total. Twenty-nine PE portfolio companies across Europe were listed on public stock markets, the highest total by some margin in our series of studies. These PE-backed IPOs were completed across 10 different European stock markets, a breadth last seen in 2006, arguably one of the most buoyant years in recent history.
IPOs were not the only big story of 2014, with corporate buyers — particularly from North America — returning to acquisitive mode: 2014 saw exits via trade sale increase rapidly from 2013 as companies spotted attractive opportunities in the European PE portfolio. These two trends — receptive public markets and increased corporate M&A activity — converged in 2014, enabling PE to realize significant value for its investors. A total of 16% of the portfolio’s entry EV was exited in 2014 alone, second only to the 21% — recorded in 2006 — over the past decade. PE is working through the exit overhang that became an issue following the onset of the financial crisis.
European PE also gained momentum in new investments, which were up 46% by number on the previous year. The biggest increase came in business acquired from corporate sellers, which increased from 24 in 2013 to 44 in 2014, also a post-downturn high. PE remained an active buyer of businesses from PE sellers, accounting for 49 new investments, while there continued to be very few acquisitions of publicly listed companies, with five take-privates in 2014 similar to the numbers since 2010 and well below the record of 26 in 2006.
While investment pace is on an upward trajectory, our study also points to increasing competitive pressures for PE. New funds raised but not yet invested, or “dry powder,” reached a post-crisis high in 2014; the number of PE firms leading new investments in the European market rose from 53 in 2013 to 79 in 2014. With more active PE firms and

2 Forging ahead How do private equity investors create value?
more money, there is concern that competition for new investments is pushing business valuations too high, with the risk of uneconomic investment returns ahead. Therefore in this year’s study we analysed the data on the effect of competition on PE returns.
Based on entry valuation multiples (the ratio of entry enterprise value to profit, in our study expressed as earnings before interest, taxes, depreciation and amortization (EBITDA)), we found no evidence that paying the highest prices for a portfolio company negatively affects returns. While our analysis found that acquiring a business at a valuation multiple of 8x EBITDA or lower results in higher than average returns, beyond the 8x mark there is little discernible difference in outcome. Investments priced at over 12x EBITDA have achieved similar returns to those prices at 8x-10x EBITDA, as differences in valuation multiple reflect differences in future value creation potential. In addition, we found that the degree of competition when buying a business has little bearing on the investment return — proprietary or off-market investments generated broadly similar investment returns to competitive auctions, where there were a number of buyers that reached final bids.
As our previous studies have demonstrated, PE-backed businesses outperform public company benchmarks, that leads to value creation for its investors. This year’s study finds that PE has maintained a disciplined and selective approach, even in the face of strong competition. PE firms have a well-honed ability to source attractive opportunities and price new investments in a way that takes into account the value creation potential. Together, these features of the PE business model enable it to generate above-market returns for its investors throughout economic and industry cycles.
Overall, European PE has positive momentum behind it, with exit and investment pace reaching healthy levels and strong support from investors. While competitive pressures may mount, PE has demonstrated its ability to adopt a disciplined stance in the face of rising valuations, and to evolve as circumstances change. The industry is now well positioned to take advantage of continued improvements in Europe’s economic outlook, and forge ahead in its value creation journey.
Executive summary

3Forging ahead How do private equity investors create value?
Key findings
4 Forging ahead How do private equity investors create value?
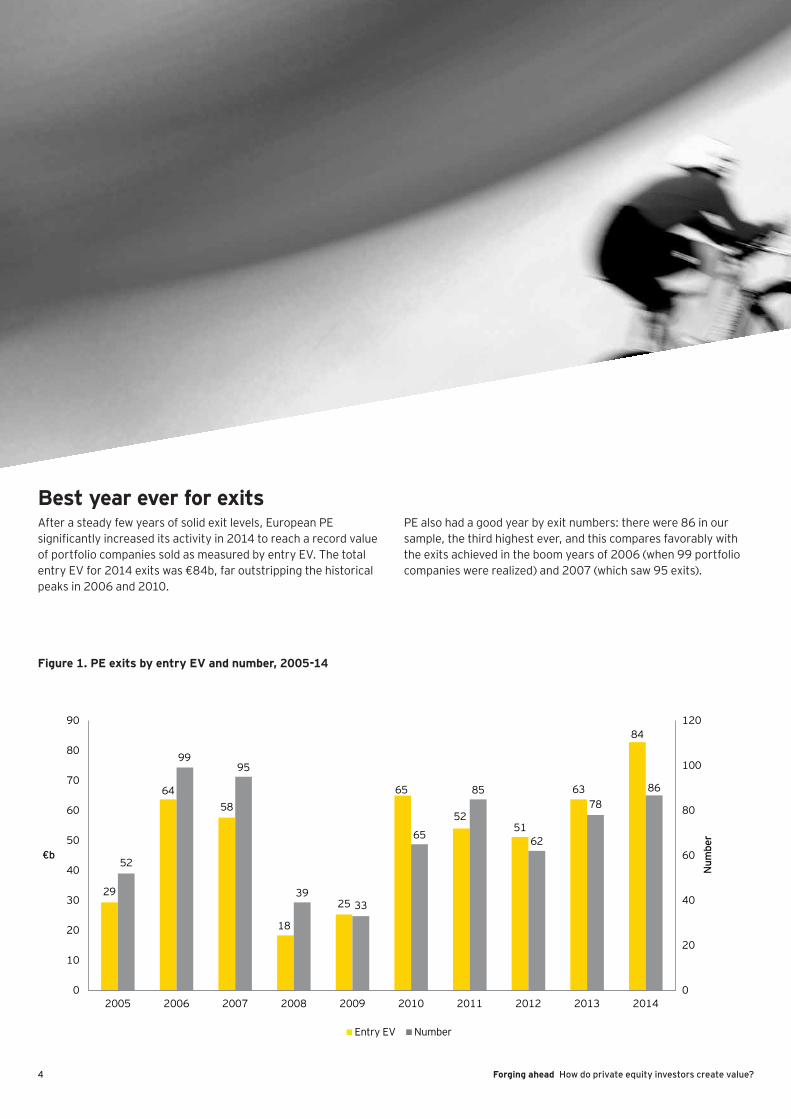
Best year ever for exitsAfter a steady few years of solid exit levels, European PE significantly increased its activity in 2014 to reach a record value of portfolio companies sold as measured by entry EV. The total entry EV for 2014 exits was €84b, far outstripping the historical peaks in 2006 and 2010.
PE also had a good year by exit numbers: there were 86 in our sample, the third highest ever, and this compares favorably with the exits achieved in the boom years of 2006 (when 99 portfolio companies were realized) and 2007 (which saw 95 exits).
Figure 1. PE exits by entry EV and number, 2005-14
29
64 58
18
25
65
52 51
63
84
52
99 95
39 33
65
85
62
78 86
0
20
40
60
80
100
120
0
10
20
30
40
50
60
70
80
90
2005 2006 2007 2008 2009 2010 2011 2012 2013 2014
Num
ber
€b
Entry EV Number
5Forging ahead How do private equity investors create value?
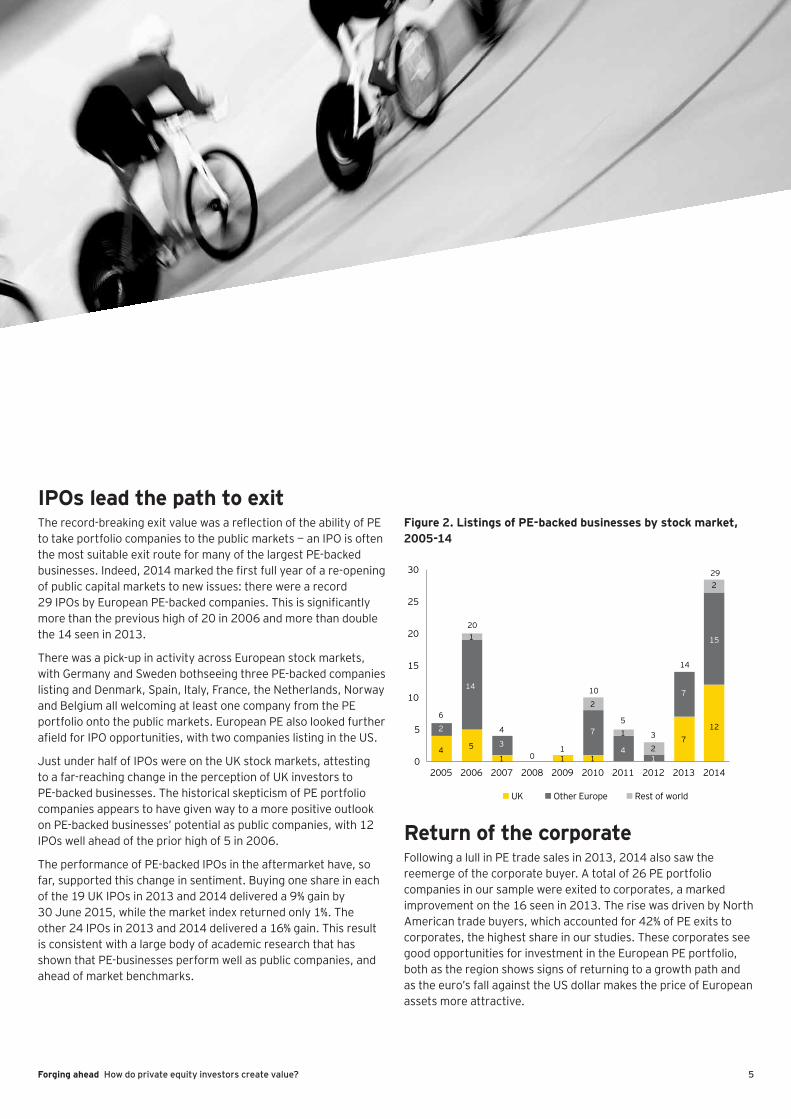
IPOs lead the path to exitThe record-breaking exit value was a reflection of the ability of PE to take portfolio companies to the public markets — an IPO is often the most suitable exit route for many of the largest PE-backed businesses. Indeed, 2014 marked the first full year of a re-opening of public capital markets to new issues: there were a record 29 IPOs by European PE-backed companies. This is significantly more than the previous high of 20 in 2006 and more than double the 14 seen in 2013.
There was a pick-up in activity across European stock markets, with Germany and Sweden bothseeing three PE-backed companies listing and Denmark, Spain, Italy, France, the Netherlands, Norway and Belgium all welcoming at least one company from the PE portfolio onto the public markets. European PE also looked further afield for IPO opportunities, with two companies listing in the US.
Just under half of IPOs were on the UK stock markets, attesting to a far-reaching change in the perception of UK investors to PE-backed businesses. The historical skepticism of PE portfolio companies appears to have given way to a more positive outlook on PE-backed businesses’ potential as public companies, with 12 IPOs well ahead of the prior high of 5 in 2006.
The performance of PE-backed IPOs in the aftermarket have, so far, supported this change in sentiment. Buying one share in each of the 19 UK IPOs in 2013 and 2014 delivered a 9% gain by 30 June 2015, while the market index returned only 1%. The other 24 IPOs in 2013 and 2014 delivered a 16% gain. This result is consistent with a large body of academic research that has shown that PE-businesses perform well as public companies, and ahead of market benchmarks.
Figure 2. Listings of PE-backed businesses by stock market, 2005-14
4
6
5
20
1
4
11
0 1
7
14
122
14
37
41
7
151
2
10
15
2
3
229
0
5
10
15
20
25
30
2005 2006 2007 2008 2009 2010 2011 2012 2013 2014
UK Other Europe Rest of world
Return of the corporateFollowing a lull in PE trade sales in 2013, 2014 also saw the reemerge of the corporate buyer. A total of 26 PE portfolio companies in our sample were exited to corporates, a marked improvement on the 16 seen in 2013. The rise was driven by North American trade buyers, which accounted for 42% of PE exits to corporates, the highest share in our studies. These corporates see good opportunities for investment in the European PE portfolio, both as the region shows signs of returning to a growth path and as the euro’s fall against the US dollar makes the price of European assets more attractive.
6 Forging ahead How do private equity investors create value?
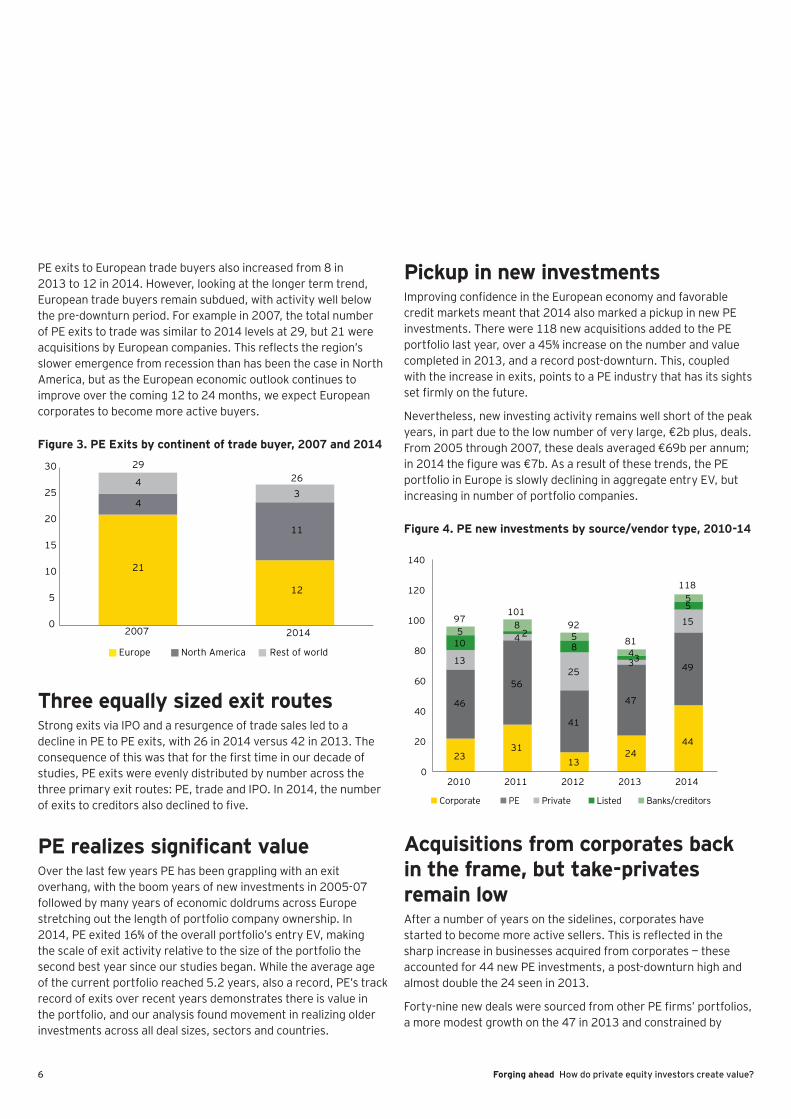
PE exits to European trade buyers also increased from 8 in 2013 to 12 in 2014. However, looking at the longer term trend, European trade buyers remain subdued, with activity well below the pre-downturn period. For example in 2007, the total number of PE exits to trade was similar to 2014 levels at 29, but 21 were acquisitions by European companies. This reflects the region’s slower emergence from recession than has been the case in North America, but as the European economic outlook continues to improve over the coming 12 to 24 months, we expect European corporates to become more active buyers.
Figure 3. PE Exits by continent of trade buyer, 2007 and 2014
21
12
4
11
43
2926
0
5
10
15
20
25
30
2007 2014
Europe North America Rest of world
Three equally sized exit routesStrong exits via IPO and a resurgence of trade sales led to a decline in PE to PE exits, with 26 in 2014 versus 42 in 2013. The consequence of this was that for the first time in our decade of studies, PE exits were evenly distributed by number across the three primary exit routes: PE, trade and IPO. In 2014, the number of exits to creditors also declined to five.
PE realizes significant valueOver the last few years PE has been grappling with an exit overhang, with the boom years of new investments in 2005-07 followed by many years of economic doldrums across Europe stretching out the length of portfolio company ownership. In 2014, PE exited 16% of the overall portfolio’s entry EV, making the scale of exit activity relative to the size of the portfolio the second best year since our studies began. While the average age of the current portfolio reached 5.2 years, also a record, PE’s track record of exits over recent years demonstrates there is value in the portfolio, and our analysis found movement in realizing older investments across all deal sizes, sectors and countries.
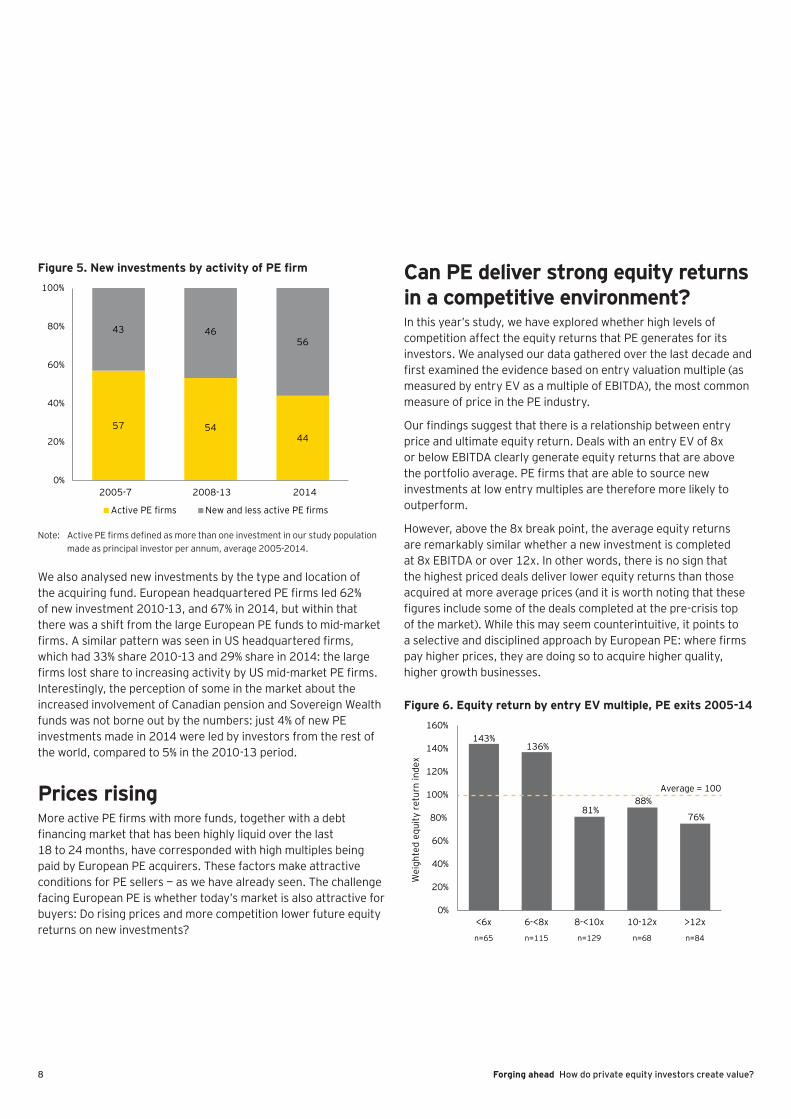
Pickup in new investmentsImproving confidence in the European economy and favorable credit markets meant that 2014 also marked a pickup in new PE investments. There were 118 new acquisitions added to the PE portfolio last year, over a 45% increase on the number and value completed in 2013, and a record post-downturn. This, coupled with the increase in exits, points to a PE industry that has its sights set firmly on the future.
Nevertheless, new investing activity remains well short of the peak years, in part due to the low number of very large, €2b plus, deals. From 2005 through 2007, these deals averaged €69b per annum; in 2014 the figure was €7b. As a result of these trends, the PE portfolio in Europe is slowly declining in aggregate entry EV, but increasing in number of portfolio companies.
Figure 4. PE new investments by source/vendor type, 2010-14
2331
1324
44
46
56
41
47
4913
4
253
15
102
83
5
58
5
4
5
97101
92
81
118
0
20
40
60
80
100
120
140
2010 2011 2012 2013 2014
Corporate PE Private Listed Banks/creditors
Acquisitions from corporates back in the frame, but take-privates remain lowAfter a number of years on the sidelines, corporates have started to become more active sellers. This is reflected in the sharp increase in businesses acquired from corporates — these accounted for 44 new PE investments, a post-downturn high and almost double the 24 seen in 2013.
Forty-nine new deals were sourced from other PE firms’ portfolios, a more modest growth on the 47 in 2013 and constrained by

7Forging ahead How do private equity investors create value?
the high level of activity IPOs markets, which proved to be an attractive alternative exit route during the course of 2014.
Once a well-trodden path for the middle and large deal PE specialists, sourcing deals in the public markets via take-privates has become far less common over recent years. There were just five take-privates of European public companies in 2014 and three in 2013, well below the average of 21 over the period 2004-07. This is not down to the relative performance of this type of transaction: our analysis of equity returns by seller type shows that returns for take-privates are in line with other deal sources. Rather, the longer term sticking points appear to be the implementation of more stringent takeover rules and rising hurdles for due diligence, which have made this type of deal harder to execute, and in the short-term, rising public market valuations which have made it difficult to achieve target returns.
Strong fundraising increases dry powderAs the exit pace has stepped up, distributions to limited partnerships (LPs) have also reached record levels. With a trend for LPs seeking to either maintain or increase their PE allocations, the fundraising market has built momentum over the last 12 to 18 months. Added to this industry dynamic is the stabilization — and even brightening — of the European macroeconomic outlook, encouraging many global investors to see European PE as an attractive opportunity. The strengthening
of the PE fundraising market is leading to the amount of new capital raised increasing faster than the demand for equity in new investments. The result is a rise in dry powder among European buyout funds, which in 2014 reached €130b (US$143b), up 7% on 2013, and another post-downturn record.
Competition intensifiesWhile a strengthening fundraising market is a positive development for European PE, it brings with it fresh challenge in the form of increased competition for deals between PE firms. In this year’s study, we have looked beyond the deal numbers to understand the makeup of the competitive environment.
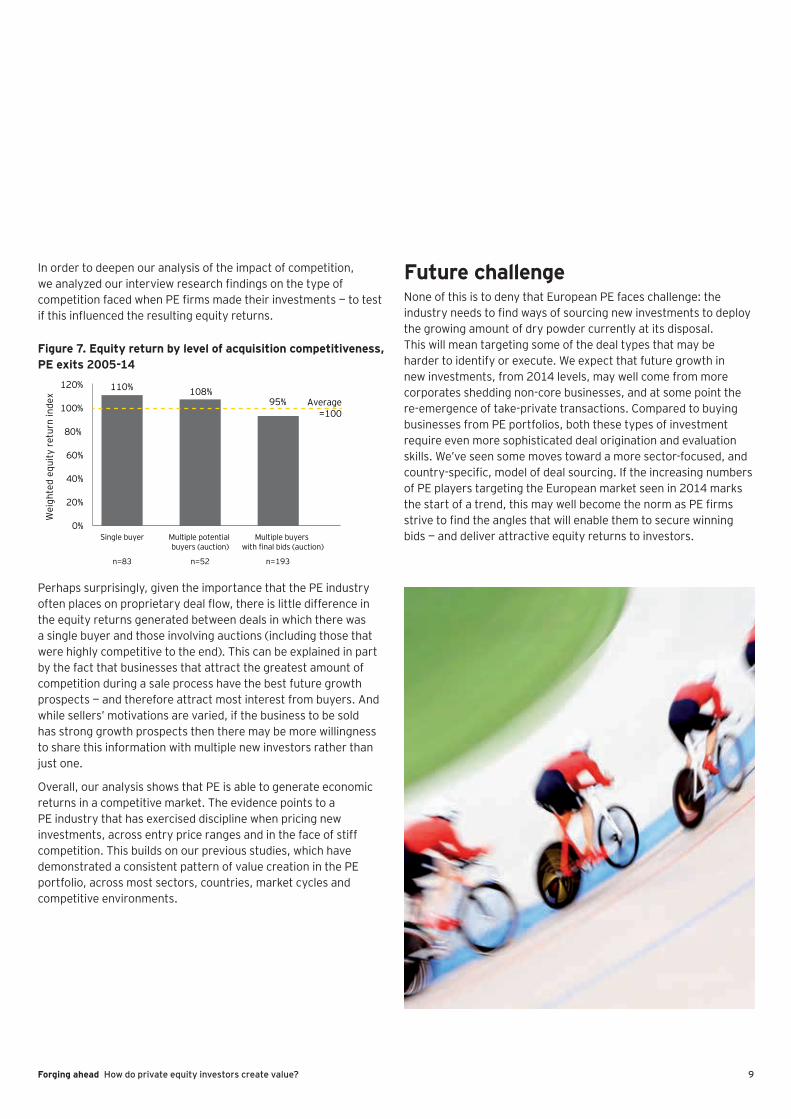
Our results show that the PE industry has run counter to many predictions made in the aftermath of the crisis. Back then, the received wisdom was that the industry would be subject to consolidation. However, our analysis shows the reverse — the number of players targeting the mid-market and large deal range actually increased during 2014: 79 different PE firms led new investments across Europe in 2014, up from 53 in 2013. On another measure of industry structure, we have tracked new investments according to how active the acquiring PE firms had been over the entire 10 years of our studies, i.e., 2005-14. We found that across the 2005-07 boom years, and then the recovery period 2010-13, the most active firms accounted for around 55% of all new European PE investments. Yet in 2014, this proportion fell to just 44%, as less active buyers reentered the market and new PE firms emerged.
8 Forging ahead How do private equity investors create value?
Figure 5. New investments by activity of PE firm
57 5444
43 4656
0%
20%
40%
60%
80%
100%
2005-7 2008-13 2014
Active PE firms New and less active PE firms
Note: Active PE firms defined as more than one investment in our study population made as principal investor per annum, average 2005-2014.
We also analysed new investments by the type and location of the acquiring fund. European headquartered PE firms led 62% of new investment 2010-13, and 67% in 2014, but within that there was a shift from the large European PE funds to mid-market firms. A similar pattern was seen in US headquartered firms, which had 33% share 2010-13 and 29% share in 2014: the large firms lost share to increasing activity by US mid-market PE firms. Interestingly, the perception of some in the market about the increased involvement of Canadian pension and Sovereign Wealth funds was not borne out by the numbers: just 4% of new PE investments made in 2014 were led by investors from the rest of the world, compared to 5% in the 2010-13 period.
Prices risingMore active PE firms with more funds, together with a debt financing market that has been highly liquid over the last 18 to 24 months, have corresponded with high multiples being paid by European PE acquirers. These factors make attractive conditions for PE sellers — as we have already seen. The challenge facing European PE is whether today’s market is also attractive for buyers: Do rising prices and more competition lower future equity returns on new investments?
Can PE deliver strong equity returns in a competitive environment?In this year’s study, we have explored whether high levels of competition affect the equity returns that PE generates for its investors. We analysed our data gathered over the last decade and first examined the evidence based on entry valuation multiple (as measured by entry EV as a multiple of EBITDA), the most common measure of price in the PE industry.
Our findings suggest that there is a relationship between entry price and ultimate equity return. Deals with an entry EV of 8x or below EBITDA clearly generate equity returns that are above the portfolio average. PE firms that are able to source new investments at low entry multiples are therefore more likely to outperform.
However, above the 8x break point, the average equity returns are remarkably similar whether a new investment is completed at 8x EBITDA or over 12x. In other words, there is no sign that the highest priced deals deliver lower equity returns than those acquired at more average prices (and it is worth noting that these figures include some of the deals completed at the pre-crisis top of the market). While this may seem counterintuitive, it points to a selective and disciplined approach by European PE: where firms pay higher prices, they are doing so to acquire higher quality, higher growth businesses.
Figure 6. Equity return by entry EV multiple, PE exits 2005-14
Wei
ghte
d eq
uity
ret
urn
inde
x
143%136%
81%88%
76%
0%
20%
40%
60%
80%
100%
120%
140%
160%
<6x 6-<8x 8-<10x 10-12x >12x
n=65 n=115 n=129 n=68 n=84
Average = 100
9Forging ahead How do private equity investors create value?
In order to deepen our analysis of the impact of competition, we analyzed our interview research findings on the type of competition faced when PE firms made their investments — to test if this influenced the resulting equity returns.
Figure 7. Equity return by level of acquisition competitiveness, PE exits 2005-14
Wei
ghte
d eq
uity
ret
urn
inde
x
110% 108%95%
0%
20%
40%
60%
80%
100%
120%
Single buyer Multiple potential buyers (auction)
Multiple buyers with final bids (auction)
n=83 n=52 n=193
Average=100
Perhaps surprisingly, given the importance that the PE industry often places on proprietary deal flow, there is little difference in the equity returns generated between deals in which there was a single buyer and those involving auctions (including those that were highly competitive to the end). This can be explained in part by the fact that businesses that attract the greatest amount of competition during a sale process have the best future growth prospects — and therefore attract most interest from buyers. And while sellers’ motivations are varied, if the business to be sold has strong growth prospects then there may be more willingness to share this information with multiple new investors rather than just one.
Overall, our analysis shows that PE is able to generate economic returns in a competitive market. The evidence points to a PE industry that has exercised discipline when pricing new investments, across entry price ranges and in the face of stiff competition. This builds on our previous studies, which have demonstrated a consistent pattern of value creation in the PE portfolio, across most sectors, countries, market cycles and competitive environments.
Future challengeNone of this is to deny that European PE faces challenge: the industry needs to find ways of sourcing new investments to deploy the growing amount of dry powder currently at its disposal. This will mean targeting some of the deal types that may be harder to identify or execute. We expect that future growth in new investments, from 2014 levels, may well come from more corporates shedding non-core businesses, and at some point the re-emergence of take-private transactions. Compared to buying businesses from PE portfolios, both these types of investment require even more sophisticated deal origination and evaluation skills. We’ve seen some moves toward a more sector-focused, and country-specific, model of deal sourcing. If the increasing numbers of PE players targeting the European market seen in 2014 marks the start of a trend, this may well become the norm as PE firms strive to find the angles that will enable them to secure winning bids — and deliver attractive equity returns to investors.

10 Forging ahead How do private equity investors create value?
Outlook

11Forging ahead How do private equity investors create value?
Our 10th study of private equity exits paints a picture of an industry in good health — realizations, investments and fundraising figures are all on an upward trend and we expect this to continue over the medium term. The industry’s value creation record and its highly selective approach to new investments continues to attract the interest of LPs seeking to boost their overall returns through PE’s ability to outperform over the long term.Nevertheless, our study also demonstrates that as the landscape has improved it has attracted more participants and so more competition — a trend we anticipate will persist as Europe’s economic outlook continues to brighten and capital continues to flow to PE. There seems little doubt that strong performance under these conditions will rely on firms maintaining discipline in their investment selection and pricing.
Against this backdrop, the most successful PE firms will be those with the strongest origination capability, which are able to identify opportunities at an early stage, unearth opportunities off the beaten track and determine unique angles that will give them an edge in competitive situations. And as we have shown in previous studies, these angles will be based on the quality of management, the scale of business growth potential and the acceleration and incentives of the PE business model.
While the appetite for PE continues to strengthen among LPs — as evidenced by many studies that show allocations continuing to rise — the scale of Europe’s PE industry will be a function of the demand for investment capital. This looks set to increase as M&A activity picks up across Europe and the region is set on a firmer path of economic growth. PE, with its value-creating credentials, is in a strong position to take advantage of the opportunities such an environment has to offer.
12 Forging ahead How do private equity investors create value?
About the studyThe 2014 study provides insights into the performance and methods of PE, based on analysis of the largest European businesses that PE has owned and exited over the past 10 years.Our research identifies all PE investments of European businesses with an entry enterprise value of more than €150m since 2005, whether exited or remaining in portfolio. In total, over the period 2005 through 2014, we have identified 1,174 new acquisitions and 694 exits, leaving a current portfolio at the end of 2014 of 822 businesses that met our criteria. Our dataset also includes mapping of these businesses by PE firm, seller and seller type, sector and country to analyse trends across multiple factors. By applying these criteria at entry, and capturing a complete population of businesses that meet these criteria, our intention is to present a consistent and robust set of facts to analyze PE’s record.
To analyse the performance of businesses under PE ownership, we focus only on exits so that we can measure the entire story from start to finish. We analyze several key performance measures including equity return (defined in this report as equity multiple or equity realized over equity invested), profit growth (defined throughout this report as earnings before interest, tax, depreciation and amortization or EBITDA), and valuation multiple (EV over EBITDA). To measure aggregate economic impact, we report weight averages though our analysis also considers numerical averages and other tests of range of results.
This independent study is built with public data across the whole population and detailed, confidential interviews with former PE owners of the businesses that have exited. Overall, we have performance data for more than two-thirds of the PE exits over our study period, with no discernible bias in the composition of the sample versus the whole population by size, country or sector.
The ability to incorporate data obtained directly from interviews with top PE investors is an important feature of the study. Another is the scope and depth of our research, now in its 10th year. Our study is recognized by many commentators as the authoritative work in this field.

Forging ahead How do private equity investors create value?
Contacts
EMEIASachin DateLondon+44 20 7951 [email protected]
Harry NicholsonLondon+44 20 7951 [email protected]
UKBridget WalshLondon+44 20 7951 [email protected]
BelgiumMarc GunsBrussels+32 2 774 [email protected]
Czech RepublicPeter WellsPrague+420 225 335 [email protected]
FranceHerve JauffretParis+33 1 55 61 07 96 [email protected]
Laurent MajubertParis+33 1 55 61 06 [email protected]
GermanyMichael KunzFrankfurt+49 6196 996 26253 [email protected]
IndiaRajiv MemaniNew Delhi+91 124 671 [email protected]
Mayank RastogiMumbai+91 22 6192 [email protected]
ItalyUmberto NobileMilan+39 02 80 669 [email protected]
LuxembourgOlivier CoekelbergsMunsbach+352 42 124 8424 [email protected]
Middle EastMatthew Benson Dubai+971 4 312 9 [email protected]
NetherlandsMaurice van den HoekAmsterdam+31 88 407 [email protected]
NordicsMichel ErikssonStockholm+46 852 059 [email protected]
PolandBrendan O’MahonyWarsaw+48 22 557 [email protected]
RussiaLeonid SavelievMoscow+7 495 705 [email protected]
South AfricaGraham StokoeJohannesburg+27 11 502 [email protected]
SpainJuan LopezMadrid+34 91 572 [email protected]
TurkeyDemet OzdemirIstanbul+90 212 368 [email protected]
GlobalJeff Bunder+1 212 773 [email protected]
Michael Rogers+1 212 773 [email protected]

EY | Assurance | Tax | Transactions | AdvisoryAbout EYEY is a global leader in assurance, tax, transaction and advisory services. The insights and quality services we deliver help build trust and confidence in the capital markets and in economies the world over. We develop outstanding leaders who team to deliver on our promises to all of our stakeholders. In so doing, we play a critical role in building a better working world for our people, for our clients and for our communities.
EY refers to the global organization, and may refer to one or more, of the member firms of Ernst & Young Global Limited, each of which is a separate legal entity. Ernst & Young Global Limited, a UK company limited by guarantee, does not provide services to clients. For more information about our organization, please visit ey.com.
How EY’s Global Private Equity Sector can help your businessValue creation goes beyond the private equity investment cycle to portfolio company and fund advice. EY’s Global Private Equity Sector offers a tailored approach to the unique needs of private equity funds, their transaction processes, investment stewardship and portfolio companies’ performance. We focus on the market, sector and regulatory issues. If you lead a private equity business, we can help you meet your evolving requirements and those of your portfolio companies, from acquisition to exit, through a Global Private Equity network of 5,000 professionals around the world. Working together, we can help you meet your goals and compete more effectively.
© 2015 EYGM Limited. All Rights Reserved.
EYG No. FR0173
17608.indd (UK) 09/15. Artwork by Creative Services Group Design.
ED 0317
In line with EY’s commitment to minimize its impact on the environment, this document has been printed on paper with a high recycled content.
This material has been prepared for general informational purposes only and is not intended to be relied upon as accounting, tax, or other professional advice. Please refer to your advisors for specific advice.
ey.com/privateequity