Embed Size (px)
Citation preview

How do Individual, Institutional,and Foreign Investors Win and Lose
in Equity Trades? Evidence fromJapann
KEE-HONG BAEw, TAKESHI YAMADA
¼AND KEIICHI ITO§
wQueen’s University, Kingston, Ontario, Canada¼National University of Singapore, Singapore
§Nomura Securities, Tokyo, Japan
ABSTRACT
We investigate the gains and losses from equity trades of individualinvestors, various institutional investors, and foreign investors in the TokyoStock Exchange. We develop a trade-weighted performance measure andexamine the impact of trading intervals, price spreads, and market timing onperformance. We find that different investor types gain or lose from differentsources. For example, we discover that individual investors have poor markettiming ability but potentially gain during short-run trading intervals as theiraverage sell price is consistently higher than the average purchase price. Incontrast, we find that foreign investors consistently generate gains fromtrade due to good market timing, although their average sell price is lowerthan the average purchase price. Also, we find that foreign investors extractsignificant portion of their gains by trading against Japanese institutionalinvestors when Japanese investors trade before their fiscal-year end.
n We received useful suggestions from participants of The 5th Behavioral Economics Workshopco-sponsored by Aoyama Gakuin University and Osaka University Center for Research inBehavioral Economics. For earlier versions of the paper, we thank Junji Kawahara, SrinivasanSankaraguruswamy, Yasuhiko Tanigawa, participants of the NFA/APFA/FMA Annual Meetings,and seminar participants at the Hong Kong University of Science and Technology, KeioUniversity, Musashi University, Nanyang Technological University, National University ofSingapore, and The University of Hong Kong for helpful comments. We appreciate the effortsof Masato Hirota and Hirotaka Kawai of the Tokyo Stock Exchange in answering our questions oninstitutional details. We appreciate Alisa Larson for excellent editorial assistance. Yamadaacknowledges the support during stay at the Graduate School of International Corporate Strategyof Hitotsubashi University and financial support from the National University of SingaporeAcademic Research Grant R-315-000-047-112. The contents expressed in the paper do not reflectopinions of the institutions with which authors are affiliated.
r 2007 The Authors. Journal compilation r International Review of Finance Ltd. 2007. Published by BlackwellPublishing Ltd., 9600 Garsington Road, Oxford OX4 2DQ, UK and 350 Main Street, Malden, MA 02148, USA.
International Review of Finance, 6:3–4, 2006: pp. 129–155
I. INTRODUCTION
A growing number of empirical studies in recent years have examined thetrading behavior of diverse investor types such as individual investors, variousinstitutional investors, and foreign investors.1 These studies have shown thatthere are significant differences in the trading behavior of various investortypes. However, it is not clear whether the different trading behaviors of variousinvestor types result in significant differences in trade performances. In efficientmarkets, we expect no investor types to perform persistently better or worsethan other investor types. Our paper investigates this issue using data thatinclude trades of all investor types that trade on the Tokyo Stock Exchange(TSE). Our paper not only compares the trading performance of all investortypes across the entire equity market but also measures trading gains and lossesfrom different sources. We examine the impact of trading intervals, pricespreads, and market timing on the trading performance of various investortypes. For this purpose, we develop a trade-weighted measure of tradingperformance using buy and sell volumes.
We raise two issues regarding previous studies that examined the tradeperformance of various investor types (see Section II for a review of priorstudies). First, because different studies have measured trade performancesdifferently, it is difficult to compare results from divergent studies and drawgeneral conclusions. Second, prior studies typically examined single measuresof trade performance in each study. However, some investor types might havepoor market timing in the long run but might generate profits by churningstocks in the short run and compensate for the loss from poor market timing. Ifsuch gains outweigh the losses from poor market timing, these types ofinvestors can continue to participate in a competitive market.
The important result of our paper is that we find some investor types showcomparative advantages in different trading abilities. We find that foreigninvestors consistently have better market timing abilities compared with otherdomestic investors. In fact, we provide evidence that foreign investors cannotmake positive trading gains unless they have good market timing abilitybecause foreign investors buy portfolio of stocks at higher average prices thanthe portfolio of stocks they sell. In contrast, we find that individual investorsoffset losses from poor market timing by selling portfolio of shares atsignificantly higher prices than the purchase prices on average. We find that
1 Among other studies, Choe et al. (1999, 2004) examined trading behavior of various investor
types for the Korean equity market; Grinblatt and Keloharju (2000, 2001), for the Finnish
market; and Hamao and Mei (2001), Kamesaka et al. (2003), and Karolyi (2002), for the Japanese
market. Barber and Odean (2000) and Odean (1999) studied the trading of individual investors
in the United States. Cai et al. (2000), Lakonishok et al. (1992), and Nofsinger and Sias (1999)
studied the trading behavior of US institutional investors. Barber and Odean (2003), Cohen
(1999), Cohen et al. (2002), and Griffin et al. (2003) compared trading behavior of individual
investors and institutional investors. For various markets, Bailey et al. (2007), Brennan and Cao
(1997), Froot, et al. (2001), and Seasholes (2000) examined trading of foreign investors.
International Review of Finance
r 2007 The AuthorsJournal compilation r International Review of Finance Ltd. 2007130
individual investors perform better than other investor types for very shorttrading horizons due to the positive price spreads. However, for long-runtrading intervals, we find that the trading gains from market timing dominatethe overall trading performance for various investor types.
One of the interesting aspects of examining equity trades in the TSE duringour observation period (1991–1999) is that foreign investors’ trades significantlyincreased during the period. Because foreign investors do not always have thesame institutional constraints as domestic investors, we are able to examinehow foreign investors and domestic investors interact with each other in theirtrades. We find evidence that foreign investors buy from Japanese domesticinstitutions that sell a large volume of shares possibly for window-dressingpurposes as well as for adjusting their stock ownership near the fiscal year-end(FYE). Our results suggest that foreign investors exploit significant trading gainsfrom domestic institutions that sell shares during the FYE period.
The data from the TSE uniquely suit our objective because the data not onlyrecord buy and sell trades of different investor types but also enable us tocompute trade-weighted average prices of both buy and sell trades for allinvestor types. For each investor type, the trade-weighted average prices reflectthe average selection of stocks traded by each investor type. Also, our data coverportfolio trading across the entire market. Because a sell trade in the marketmust clear every buy trade, we are able to examine the correlations of nettrading gains among all investor groups for the entire market.
This paper is organized as follows. Section II reviews the literature. Section IIIdiscusses the data and provides descriptive statistics on trading by differentinvestor types. Section IV reports correlations of trades among different investortypes, correlations between trades and market returns, and seasonal tradingpatterns. Section V investigates the impacts of trading price spreads, markettiming, and trading frequencies on trade performance for different investortypes. Section VI provides concluding remarks.
II. PRIOR STUDIES OF TRADING PERFORMANCE OF VARIOUSINVESTOR TYPES
Although an extensive number of studies have explored the trading behavior ofvarious investor types, not many studies have addressed their tradingperformances. Among those that have, most studies have found poorperformance of individual investors. For example, Barber and Odean (2000)and Odean (1999) reported that individual investors in the United States tradeexcessively, which results in poor portfolio performance. Barber and Odeanused individual investors’ household portfolio returns and compared themagainst the various benchmarks, including the market portfolio and the multi-factor benchmark. They found that individual investors gain poor net returnsafter adjusting for trading costs. By using market-wide data from the Finnishstock market, Grinblatt and Keloharju (2000) found individual investors do not
How do Investors Win and Lose in Equity Trades?
r 2007 The AuthorsJournal compilation r International Review of Finance Ltd. 2007 131

pick future winning stocks better than domestic institutional investors andforeign investors. Cohen (1999) found that individual investors buy stock frominstitutions after price increases and sell to institutions after price decreases inthe United States, which suggests that individual investors are bad markettimers and institutions are good market timers. In a related study, Cohen et al.(2002) examined the interactions between individuals and institutions in theUS stock market and found that institutions profited from the underreaction ofstock prices by buying shares from individuals in response to good cash flownews. A recent paper by Barber et al. (2007) examine trade performances ofindividual investors and various institutional investors using a comprehensivedata from the Taiwan Stock Exchange. They find that individual investors incurtrading losses after costs due to aggressive trading, whereas institutionalinvestors profit from trade after cost. Altogether, previous empirical resultssuggest that individual investors are generally poor performers of equitytrading.
A number of researchers have also compared the performance of foreigninvestors with domestic investors. However, these studies show mixed results.Seasholes (2000) found that foreigners generally perform well compared withdomestic investors in emerging markets. He found that foreign investors’ tradespredict future price movements and earn abnormal profits. Froot et al. (2001)and Froot and Ramadorai (2001) examined international portfolio flows forvarious countries and also found that foreign investors trades forecast futureequity returns relatively well. Karolyi (2002) and Kamesaka et al. (2003) alsoshowed that foreign investors in the Japanese equity market have good marketpredicting ability of the market index.2 In contrast, other studies have shownthat foreign investors do not necessarily have good trade performance.Dahlquist and Robertsson (2004) suggested foreign investors are not necessarilygood at picking future winning stocks for the Swedish market. Choe et al.(2005) suggested that foreign investors do not have a private informationadvantage over Korean individual investors. They showed that individualinvestors have a higher proportion of buy trades than sell trades preceding largeprice movements, whereas foreigners have a higher proportion of buy tradesthan sell trades after the event. They also showed that foreign investors trade atworse prices than individual investors. While Dvorak (2005) found domesticinvestors have an information advantage over foreign investors on average, healso showed evidence that some global brokerages have better informationbecause of their experience and expertise. In sum, the prior studies show thatwhether foreign investors perform better or worse than domestic investors isinconclusive.
Although several other papers have compared the trading performance ofvarious investor types across the entire equity market (Grinblatt and Keloharju
2 Hamao and Mei (2001) found that foreign investors show insignificant degree of timing ability
in the Japanese stock market during most of the 1980s. On the other hand, Karolyi (2002) and
Kamesaka et al. (2003) used data from the 1990s.
International Review of Finance
r 2007 The AuthorsJournal compilation r International Review of Finance Ltd. 2007132
2000; Karolyi 2002; Kamesaka et al. 2003), most of these studies each examinedonly single aspect of equity trading performance. Our paper examines differentsources of trading performances such as trading prices, market timing, andtrading frequencies of various investor types, which provides us with a morecomplete picture of the performance of various investor types in the entireequity market.3
III. DATA AND SUMMARY STATISTICS
A. Data
We use weekly trading data on the First Section of the TSE. The TSE categorizesthe member securities companies’ brokered trades by classifying trades intothose by individuals, foreigners, and institutions. Institutions are furtherclassified into nonfinancial corporations, mutual funds, insurance companies,and banks. The data comprise the volume (i.e., number of shares traded) andthe amount of trade in yen (f) for both buy and sell trades for each investortype. The TSE reports trades that are aggregated across individual stocks for eachinvestor type. The data cover all trades brokered by TSE’s member securitiescompanies that have a capitalization of at least f3 billion. The data also includethe proprietary trades of these securities companies. Altogether, the dataaccount for approximately 90% of trades in the First Section of the TSE.
Among the domestic institutions, professional fund managers undertake theequity trading for mutual funds, insurance companies, and banks. A large partof trades by banks are by trust banks, which manage equity funds that includecorporate pensions.4 The foreign investors category includes both institutionaland individual investors, but most trades are believed to be from professionalfund managers. On the other hand, individual investors and nonfinancialcorporations mostly consist of investors that are not professional fundmanagers (i.e., nonprofessional investors). Particularly, the equity trading bynonfinancial corporations arises not only through corporate asset managementbut also from adjustment of cross-shareholdings in Japanese corporate groups.It is understood among TSE member firms that one of the functions of theproprietary trading of securities companies is to facilitate the execution ofcustomer orders. Therefore, proprietary trades include both liquidity-providingactivity and the autonomous trades of the member securities firms.
3 A recent study by Barber et al. (2007) is among the few studies that examine stock selection as
well as market timing abilities for different investor types.
4 The bank category also includes trading by commercial banks. Although the nature of equity
trading by commercial banks differs from equity trading by professional fund managers of trust
banks, trading by commercial banks is 10% or less of all trades in this category. Data on the
breakdown of bank trades into commercial and trust banks are available only for September
1996 and later.
How do Investors Win and Lose in Equity Trades?
r 2007 The AuthorsJournal compilation r International Review of Finance Ltd. 2007 133
Our sample period begins with the first week of January 1991 and ends withthe last week of April 1999. We choose 1991 as the beginning of our observationperiod because the period immediately before 1990 is the so-called ‘asset pricebubble’ period in Japan. Because the Japanese government allowed investors toexecute equity trades outside the stock exchanges after April 1999, we chosethis month as the end of our observation period as our data do not includetrades executed outside the TSE. Unless otherwise noted, all data used in thispaper are from the Nomura Research Institute.
B. Descriptive statistics of trades
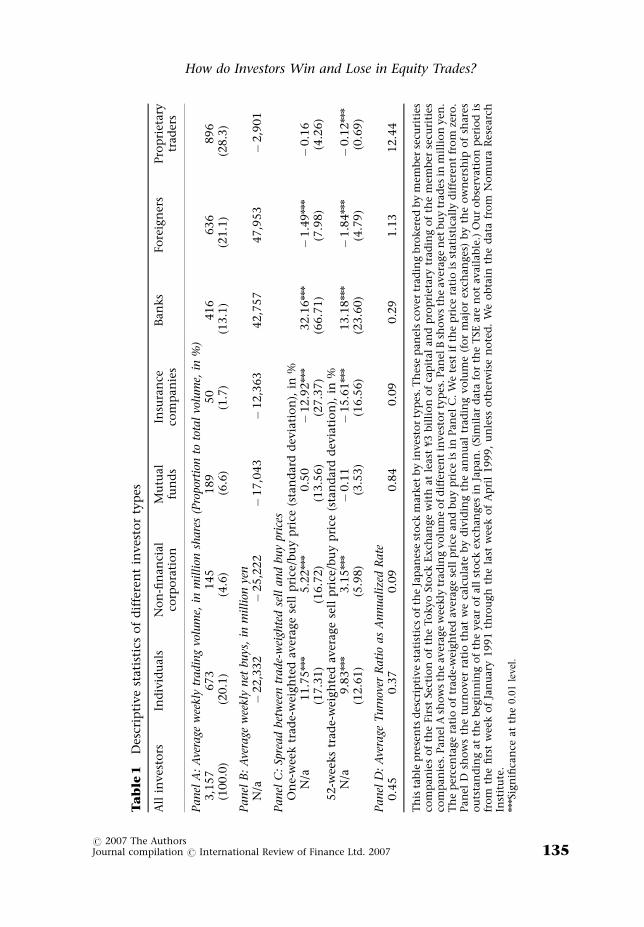
In Table 1, Panel A shows the weekly trading volume of different investor typesand the proportion of that volume to the total trading volume between January1991 and April 1999. Of all investor types, the major traders are the proprietarytraders of securities companies, individuals, foreigners, and banks. Theseinvestors account for between 75% and 80% of the trades. Other investortypes, such as mutual funds, insurance companies, and nonfinancial corpora-tions, account for relatively small shares of the trades. Panel B shows theaverage yen amount of the net buys of different investor types. During ourobservation period, foreign investors and banks were net buyers, and all otherdomestic investors were net sellers on average.
In Table 1, Panel C shows the percentage spread between trade-weightedaverage sell price and trade-weighted average buy price for each investor type(i.e., average sell price/average buy price-1). We calculate the spread for both 1-week trades and accumulated 52-week trades. The 52-week spread has smallerstandard deviations because short-term fluctuations are smoothed out. Fromboth 1-week and 52-week average price spreads, we find that investors such asforeign investors and insurance companies have negative average spreads thatare significantly different from zero, which implies that these investors onaverage lose money from equity turnovers. Other investors such as individualinvestor, nonfinancial corporations and banks have significant positive spreads.Particularly, we find that banks and individual investors have the largestpositive spreads.
In Table 1, Panel D shows the average turnover ratios for each investor type.5
The average turnover of the entire market is 0.45 times per year. The turnoverratio of individual investors (0.37) is lower than the market average.Nonfinancial corporations have a low turnover ratio (0.09), because a largepart of their shares are cross-held among group companies and are not tradedfrequently. Insurance companies also have a low turnover ratio (0.09) as theynaturally have long investment horizons. The turnover ratio of banks (0.29)
5 We calculate the turnover ratio by dividing the annual trading volume (for major exchanges) by
the ownership of shares outstanding at the beginning of the year of all stock exchanges in
Japan. (Similar data for the TSE are not available.) The percentage share of trades for the TSE is
more than eighty-five percent of total trades of all stock exchanges in Japan.
International Review of Finance
r 2007 The AuthorsJournal compilation r International Review of Finance Ltd. 2007134
Ta
ble
1D
escr
ipti
ve
stati
stic
so
fd
iffe
ren
tin
ves
tor
typ
es
All
inves
tors
Ind
ivid
uals
No
n-fi
nan
cial
corp
ora
tio
nM
utu
al
fun
ds
Insu
ran
ceco
mp
an
ies
Ban
ks
Fo
reig
ner
sPro
pri
etary
trad
ers
Panel
A:
Ave
rage
wee
kly
tradin
gvo
lum
e,in
million
share
s(P
ropor
tion
toto
tal
volu
me,
in%
)3,1
57
673
145
189
50
416
636
896
(100.0
)(2
0.1
)(4
.6)
(6.6
)(1
.7)
(13.1
)(2
1.1
)(2
8.3
)
Panel
B:
Ave
rage
wee
kly
net
buys
,in
million
yen
N/a
�22,3
32
�25,2
22
�17,0
43
�12,3
63
42,7
57
47,9
53
�2,9
01
Panel
C:
Spre
ad
bet
wee
ntr
ade-
wei
ghte
dse
lland
buy
pri
ces
On
e-w
eek
trad
e-w
eigh
ted
aver
age
sell
pri
ce/b
uy
pri
ce(s
tan
dard
dev
iati
on
),in
%N
/a11.7
5nnn
5.2
2nnn
0.5
0�
12.9
2nnn
32.1
6nnn
�1.4
9nnn
�0.1
6(1
7.3
1)
(16.7
2)
(13.5
6)
(27.3
7)
(66.7
1)
(7.9
8)
(4.2
6)
52-w
eeks
trad
e-w
eigh
ted
aver
age
sell
pri
ce/b
uy
pri
ce(s
tan
dard
dev
iati
on
),in
%N
/a9.8
3nnn
3.1
5nnn
�0.1
1�
15.6
1nnn
13.1
8nnn
�1.8
4nnn
�0.1
2nnn
(12.6
1)
(5.9
8)
(3.5
3)
(16.5
6)
(23.6
0)
(4.7
9)
(0.6
9)
Panel
D:
Ave
rage
Turn
over
Rati
oas
Annualize
dR
ate
0.4
50.3
70.0
90.8
40.0
90.2
91.1
312.4
4
Th
ista
ble
pre
sen
tsd
escr
ipti
ve
stati
stic
so
fth
eJa
pan
ese
sto
ckm
arket
by
inves
tor
typ
es.T
hes
ep
an
els
cover
trad
ing
bro
ker
edb
ym
ember
secu
riti
esco
mp
anie
so
fth
eFir
stSe
ctio
no
fth
eTo
kyo
Sto
ckExch
an
ge
wit
hat
least
f3
bil
lio
no
fca
pit
al
an
dp
rop
riet
ary
trad
ing
of
the
mem
ber
secu
riti
esco
mp
anie
s.Pan
elA
sho
ws
the
aver
age
wee
kly
trad
ing
vo
lum
eo
fd
iffe
ren
tin
ves
tor
typ
es.Pan
elB
sho
ws
the
aver
age
net
bu
ytr
ad
esin
mil
lio
nyen
.T
he
per
cen
tage
rati
oo
ftr
ad
e-w
eigh
ted
aver
age
sell
pri
cean
db
uy
pri
ceis
inPan
elC
.W
ete
stif
the
pri
cera
tio
isst
ati
stic
all
yd
iffe
ren
tfr
om
zero
.Pan
elD
sho
ws
the
turn
over
rati
oth
at
we
calc
ula
teb
yd
ivid
ing
the
an
nu
al
trad
ing
vo
lum
e(f
or
maj
or
exch
an
ges
)b
yth
eo
wn
ersh
ipo
fsh
ares
ou
tsta
nd
ing
at
the
beg
inn
ing
of
the
yea
ro
fall
sto
ckex
chan
ges
inJa
pan
.(S
imil
ar
data
for
the
TSE
are
no
tavail
ab
le.)
Ou
ro
bse
rvati
on
per
iod
isfr
om
the
firs
tw
eek
of
Jan
uary
1991
thro
ugh
the
last
wee
ko
fA
pri
l1999,
un
less
oth
erw
ise
no
ted
.W
eo
bta
inth
ed
ata
fro
mN
om
ura
Res
earc
hIn
stit
ute
.nnnSi
gn
ifica
nce
at
the0.01level.
How do Investors Win and Lose in Equity Trades?
r 2007 The AuthorsJournal compilation r International Review of Finance Ltd. 2007 135
reflects the low turnover of commercial banks, as their shareholdings are part ofthe cross-holdings of corporate groups (i.e., keiretsu). However, trust banks,whose trading volume is around 90% of the entire trading volume in the Bankscategory, have higher turnover because they are professional fund managers.For example, after 1997, when a breakdown of the data is available, the averageturnover ratio of trust banks is 0.60 per year, compared with 0.14 per year forcommercial banks. Foreigners and mutual funds have higher turnover than themarket average (1.13 for foreigners, 0.84 for mutual funds). The turnover ratioof proprietary traders (12.44) is the highest among all investor types, which isnot surprising given the liquidity-providing role of proprietary traders.
IV. CORRELATIONS AND PATTERNS OF TRADE AMONG INVESTORTYPES
A. Correlations among net buy trades and market returns
In Table 2, Panel A shows the contemporaneous correlations of the volume ofnet buys among different investor types. We find that foreign investors tend totrade in opposite directions to all domestic investors (except for the proprietarytraders), which is indicated by the negative correlations between the net buys offoreigners and those of domestic investors. We also find that nonprofessionalinvestors such as individual investors and nonfinancial corporations tend totrade in opposite directions to all institutional investors including foreigninvestors. In Panel B, we show the correlations between lagged, contempora-neous, and future market returns (i.e., returns on the Tokyo Stock Price Index[TOPIX] of the First Section) and the net buys of different investors. The resultsshow that the net buys of all domestic investors except proprietary traders havenegative correlations with lagged and contemporaneous market returns,whereas the net buys of foreign investors have positive correlation with lagged,contemporaneous, and some future market returns. The results imply thatdomestic investors (other than proprietary traders) buy more than they sellwhen market is falling, whereas foreign investors tend to buy more than theysell when market is rising.6 Also foreign investors’ net buy trade is significantlypositively correlated with future returns, which might imply their good marketpredicting ability.
6 Our results are similar to the findings from other markets, which report momentum trading
patterns of foreign investors (Brennan and Cao 1997; Choe et al. 1999; Grinblatt and Keloharju
2000, 2001; Froot et al. 2001). We note that Japanese institutions appear to follow contrarian
trading patterns (see also Kim and Nofsinger 2005; Karolyi 2002; Kamesaka et al. 2003), which
contrasts with US institutions that follow momentum-trading strategies (Lakonishok et al.
1992; Nofsinger and Sias 1999; Cai et al. 2000).
International Review of Finance
r 2007 The AuthorsJournal compilation r International Review of Finance Ltd. 2007136

Ta
ble
2C
orr
elati
on
sam
on
gth
en
etb
uy
vo
lum
eso
fd
iffe
ren
tin
ves
tor
typ
esan
dm
ark
etre
turn
s
Ind
ivid
uals
No
nfi
nan
cial
corp
ora
tio
nM
utu
al
fun
ds
Insu
ran
ceco
s.B
an
ks
Fo
reig
ner
sPro
pri
etary
trad
ers
Panel
A:
Cor
rela
tion
ofnet
buy
volu
mes
Ind
ivid
uals
1.0
00
No
nfi
nan
cial
corp
.0.3
50nnn
1.0
00
Mu
tual
fun
ds
�0.1
15n
0.2
82nnn
1.0
00
Insu
ran
ceco
mp
an
ies
�0.3
14nnn
0.2
20nnn
0.1
19nn
1.0
00
Ban
ks
�0.1
16nn
0.3
57nnn
0.3
35nnn
0.4
42nnn
1.0
00
Fo
reig
ner
s�
0.4
10nnn
�0.5
71nnn
�0.3
13nnn
�0.2
01nnn
�0.5
33nnn
1.0
00
Pro
pri
etary
trad
ers
�0.2
98nnn
�0.4
17nnn
�0.3
51nnn
�0.2
24nnn
�0.5
02nnn
0.0
31
1.0
00
Panel
B:
Cor
rela
tion
bet
wee
nla
gged
,co
nte
mpor
aneo
us,
and
futu
reT
OPIX
retu
rns
(r)
and
net
buy
volu
me
r t�
4�
0.0
32
�0.0
62
�0.0
26
�0.0
76
�0.0
39
0.1
02nn
�0.0
14
r t�
3�
0.0
15
�0.0
72
�0.0
65
�0.1
23nn
�0.1
29nnn
0.1
62nnn
0.0
17
r t�
2�
0.0
37
�0.1
23nn
�0.1
21nn
�0.0
66
�0.1
66nnn
0.2
10nnn
0.0
41
r t�
1�
0.0
02
�0.1
92nnn
�0.2
74nnn
�0.1
96nnn
�0.2
68nnn
0.2
50nnn
0.1
50nnn
r t�
0.1
96nnn
�0.5
36nnn
�0.2
19nnn
�0.1
98nnn
�0.3
08nnn
0.3
26nnn
0.3
56nnn
r t1
10.0
13
�0.0
35
�0.0
64
�0.0
84n
�0.0
33
0.0
76
�0.0
11
r t1
2�
0.0
72
�0.1
15nn
�0.0
71
�0.0
55
�0.0
86n
0.1
42nnn
0.0
68
r t1
30.0
04
�0.0
43
�0.0
66
�0.0
52
�0.0
19
0.0
84nn
�0.0
23
r t1
4�
0.0
06
�0.0
21
�0.0
13
�0.0
25
�0.1
10
0.0
75
0.0
49
Pan
elA
sho
ws
the
Pea
rso
nco
rrel
atio
no
fth
en
etb
uy
vo
lum
esam
on
gd
iffe
ren
tin
ves
tor
typ
es.
Pan
elB
sho
ws
the
corr
elat
ion
bet
wee
nm
arket
retu
rns
an
dth
en
etb
uy
vo
lum
eso
fvari
ou
sin
ves
tor
typ
es.
Th
ed
ata
com
pri
seth
en
etbu
yvo
lum
eso
fth
eFir
stSe
ctio
no
fth
eTo
kyo
Sto
ckExch
an
ge
that
are
bro
ker
edb
ym
ember
secu
riti
esco
mp
anie
sw
ith
at
least
f3
bil
lio
no
fca
pit
alan
dth
en
etbu
yvo
lum
eso
fth
ep
rop
riet
ary
trad
ing
div
isio
no
fth
em
emb
erco
mp
an
ies.
We
com
pu
tem
ark
etre
turn
sas
wee
kly
log
pri
cech
an
ges
fro
mth
eT
OPIX
.T
he
sam
ple
per
iod
isfr
om
the
firs
tw
eek
of
Jan
uary
1991
thro
ugh
the
last
wee
ko
fA
pri
l1999.
Th
esa
mp
leco
mp
rise
s435
ob
serv
ati
on
s.nSi
gn
ifica
nce
at
the0.10
level
.nnSignificance
atthe0.05
level
.nnnSignificance
atthe0.01
level
.
How do Investors Win and Lose in Equity Trades?
r 2007 The AuthorsJournal compilation r International Review of Finance Ltd. 2007 137
B. Seasonal trading patterns: FYE effect
Several studies have found seasonal trading patters in the Japanese equitymarket during the FYE period. Bremer and Kato (1996) reported that stocks withgains in Japan have higher turnover in March. Kato and Loewenstein (1995)suggested that overall increase in trading volumes of most domestic institutionsaround the FYE could reflect the temporary stock ownership adjustments ofgroup company (keiretsu) firms.7 In our paper, we examine if seasonal tradingpatterns near the FYE affect the trading performance of various investor types.Therefore, in this section we investigate if there are any seasonal patterns of buyand sell trades for different investor types.
We estimate the following regression model for volumes of each investortype:
Volumet ¼ aþX12
j¼1bjMonthDumj;t þ e
t
where X12
j¼1wjbj ¼ 0: ð1Þ
Volumet denotes buy or sell volume data in week t, and MonthDumj, t is a dummyvariable that takes the value of 1 if Volumet is from month j and zero otherwise.The intercept measures the average volume, and bj measures the deviation fromthe average volume for month j. The weight, wj, is the proportion of month j inthe sample. Because we constrain the weighted sum of 12 monthly coefficientsto be zero in the estimation procedure, each coefficient indicates the monthlydeviation from the average volume for the observation period, which is theintercept.
Panels A and B in Table 3 show that during the period from January throughMarch, most domestic institutions sell more than they buy compared withother periods. We find that the sell volume of domestic institutions, particularlythat of banks, is greatest in March. Whereas the adjustments of stock holdingsby institutional investors explain the increase in the overall trading around theFYE (Kato and Loewenstein 1995), a unique Japanese corporate accounting rulemight partly explain the sell trading patterns of domestic institutional investorsbefore the FYE. Under this accounting rule, capital gain is realized andrecognized as income only if the shares are sold. Observers of the Japaneseequity market point to the fact that this rule motivates domestic institutions tosell shares to realize capital gains and to window-dress their profits during the
7 He et al. (2004) showed that US institutions, particularly investment advisors who act as
external managers such as mutual funds, tend to sell loser stock at year-end to window-dress
their portfolios. Ng and Wang (2004) also observed similar year-end trading patterns for small
stocks that are held by US institutions.
International Review of Finance
r 2007 The AuthorsJournal compilation r International Review of Finance Ltd. 2007138

Ta
ble
3Se
aso
nali
tyo
fb
uy
an
dse
llvo
lum
esb
yin
ves
tor
typ
es
Ind
ivid
uals
No
nfi
nan
cial
corp
ora
tio
ns
Mu
tual
fun
ds
Insu
ran
ceco
s.B
an
ks
Fo
reig
ner
sPro
pri
etary
trad
ers
Panel
A:
Seaso
nality
inbuy
volu
mes
Inte
rcep
t339.8
48nnn
60.1
19nnn
85.3
29nnn
16.2
34nnn
220.8
80nnn
348.7
07nnn
446.1
64nnn
Jan
uary
�53.6
40n
�10.2
69n
�17.7
79nn
�2.2
69
�59.7
51nnn
�33.5
67
�86.9
81nnn
Feb
ruary
76.7
30nn
14
.76
9nnn
3.0
56
7.7
08nnn
�12.6
27
40.0
48
54.2
72n
Marc
h1
14
.17
8nnn
37
.53
9nnn
13.3
26
14
.97
1nnn
45
.03
7nnn
11
1.5
60nnn
13
4.6
64nnn
Ap
ril
14
7.7
72nnn
13.3
50nn
18.3
29nn
�3.9
38nn
50
.61
6nnn
40.1
79
64.0
24nn
May
�28.3
84
�10.6
38n
6.7
37
�5.2
90nnn
�5.0
26
�36.1
42
�30.2
81
Jun
e�
17.0
93
�3.2
91
16.9
11n
�1.0
00
22.9
62
9.8
37
22.8
92
July
�49.1
41
�13.3
42nn
�0.5
01
�2.9
73
�18.9
68
�28.8
75
�38.5
82
Au
gu
st�
46.0
48
�10.3
18n
�12.3
54
�3.8
14nn
�24.9
94n
�14.5
28
�46.5
30
Sep
tem
ber
�11.6
72
6.5
75
10.8
03
�0.4
76
18.9
81
�4.7
58
66.5
34nn
Oct
ob
er�
71.3
55nn
�12.3
82nn
�0.8
09
�0.8
69
�15.2
22
�29.3
27
�53.9
90nnn
No
vem
ber
�49.8
45
�9.8
47n
�21.3
89nn
�0.4
25
1.9
84
�41.2
54
�63.9
59nn
Dec
emb
er.
�29.6
49
�5.2
79
�16.0
73n
�2.7
02
0.6
92
�23.7
97
�23.9
13
Ad
just
edR
20.0
84
0.1
31
0.0
26
0.1
63
0.0
75
0.0
40
0.0
84
Wald
test
50.6
9nnn
76.6
2nnn
22.4
0nn
95.4
6nnn
46.3
2nnn
29.0
5nnn
50.9
3nnn
Panel
B:
Seaso
nality
inse
llvo
lum
esIn
terc
ept
333.0
45nnn
84.5
69nnn
103.3
03nnn
33.8
99nnn
195.4
83nnn
315.1
68nnn
449.9
28nnn
Jan
uary
�48.8
08n
�12.3
25n
�21.3
56nn
�0.8
48
�29.2
55n
�41.3
64n
�113.6
68nnn
Feb
ruary
53.8
17n
30
.96
8nnn
22.6
45nn
15
.21
4nnn
42
.94
9nnn
0.7
37
14.7
94
Marc
h8
5.2
20nnn
59
.73
1nnn
38
.00
1nnn
19
.04
1nnn
10
4.9
65nnn
25.0
92
13
9.7
01nnn
Ap
ril
13
6.8
13nnn
1.0
38
25.4
26nn
�5.0
89
22.4
56
41.2
41n
11
0.0
86nnn
May
�18.9
67
�20.3
83nnn
�2.9
22
�0.9
47
�17.3
44
�19.9
58
�30.7
00
Jun
e�
5.0
87
�12.7
31n
9.6
07
�6.9
84
�9.9
90
22.5
43
61.0
80nn
July
�36.0
31
�20.4
17nnn
�2.3
59
�6.5
77
�20.8
88
�25.8
32
�34.4
66
How do Investors Win and Lose in Equity Trades?
r 2007 The AuthorsJournal compilation r International Review of Finance Ltd. 2007 139

Ta
ble
3(c
onti
nued
)
Ind
ivid
uals
No
nfi
nan
cial
corp
ora
tio
ns
Mu
tual
fun
ds
Insu
ran
ceco
s.B
an
ks
Fo
reig
ner
sPro
pri
etary
trad
ers
Au
gu
st�
33.8
10
�9.8
96
�19.4
39n
�8.0
92nn
�22.3
67
�13.7
02
�59.0
13nn
Sep
tem
ber
�9.1
34
19.3
85nn
1.3
49
�4.4
22
14.5
51
5.0
85
48.7
79
Oct
ob
er�
45.3
23
�20.8
88nnn
�17.8
10
�9.2
09nn
�41.0
92nn
8.1
72
�63.3
03nn
No
vem
ber
�44.9
83
�13.2
10n
�23.6
19nn
�1.2
50
�40.8
94nn
12.9
29
�75.7
56nn
Dec
emb
er.
�49.0
34
�5.2
76
�12.5
07
7.2
07n
�11.6
31
�13.2
32
4.0
40
Ad
just
edR
20.0
65
0.1
99
0.0
56
0.0
87
0.1
15
�0.0
04
0.1
22
Wald
test
41.3
7nnn
118.6
0nnn
36.7
5nnn
52.2
1nnn
67.2
6nnn
9.3
471.0
2nnn
Th
ista
ble
pre
sen
tsth
ese
aso
nal
patt
ern
so
fb
uy
an
dse
llvo
lum
eso
fd
iffe
ren
tin
ves
tor
typ
es.
We
esti
mate
the
foll
ow
ing
regre
ssio
nm
od
elfo
rvo
lum
eso
fea
chin
ves
tor
typ
e:
Vol
um
e t¼
aþX 1
2
j¼1b j
Mon
thD
um
j;tþe t;
wh
ere
X 12
j¼1
wjb
j¼
0:
Vol
um
e td
eno
tes
bu
yo
rse
llvo
lum
ed
ata
inw
eek
t,an
dM
onth
Dum
j,tis
ad
um
my
var
iab
leth
at
takes
the
valu
eo
fo
ne
ifV
olum
e tis
fro
mm
on
thjan
dze
roo
ther
wis
e.T
he
inte
rcep
tm
easu
res
the
aver
age
vo
lum
ean
db j
mea
sure
sth
ed
evia
tio
nfr
om
the
aver
age
vo
lum
efo
rm
on
thj.
Th
ew
eigh
t,w
j,is
the
pro
po
rtio
no
fm
on
thjin
the
sam
ple
.V
olu
me
data
are
inw
eekly
freq
uen
cyan
dco
ver
trad
eso
nth
eFir
stSe
ctio
no
fth
eTo
kyo
Sto
ckExch
an
ge.
Th
esa
mp
lep
erio
dis
fro
mJa
nu
ary
1991
thro
ugh
Ap
ril
1999.
Th
esa
mp
leco
mp
rise
s435
ob
serv
ati
on
s.M
arc
his
hig
hli
gh
ted
bec
au
seth
een
do
fM
arc
his
the
fisc
al
yea
r-en
dfo
rm
ost
Jap
anes
eco
mp
anie
s.nSi
gn
ifica
nce
at
the0.10
level
.nnSignificance
atthe0.05
level
.nnnSignificance
atthe0.01
level
.Si
gn
ifica
nt
case
sat
the0.01
level
wit
hp
osi
tive
coef
fici
ents
are
inb
old
chara
cter
s.
International Review of Finance
r 2007 The AuthorsJournal compilation r International Review of Finance Ltd. 2007140
FYE period (see Bremer and Kato 1996).8 Our results in Table 3 are consistentwith this explanation. In contrast, foreign investors are significant buyers inMarch (see Panel A), whereas their sell volume in Panel B does not show anysignificant seasonal patterns. Foreign investors, who do not need to follow thesame tax and accounting rules as domestic investors, could purchase shares atbetter terms before the FYE and improve their trading performance, whereasdomestic institutional investors might sell shares at unfavorable conditions.Individual investors also tend to buy more than they sell in March, which isconsistent with the fact that individual investors do not have any specialincentives to sell shares before end-March.
One might argue that foreign investors buy shares in March before the FYEbased on information. However, because most public information related to thelatest financial reports become available after April, information-based tradingmight not explain the large buy trades of foreign investors in March. Also, theinformation story cannot explain the greater buy trades of individual investorsin March as most individual investors only have access to public information.Therefore, our results suggest that foreign investors and some individualinvestors are timing their buy trades before the FYE when domestic institutionssell their shares.
V. TRADING PRICES, MARKET TIMING, AND TRADING INTERVALS
In this section, we examine trading gains and losses of various investor types. InSection V.A, we develop a new trading performance measure and explain thetest methodology. In Section V.B, we present the results.
A. Performance measures and test methodology
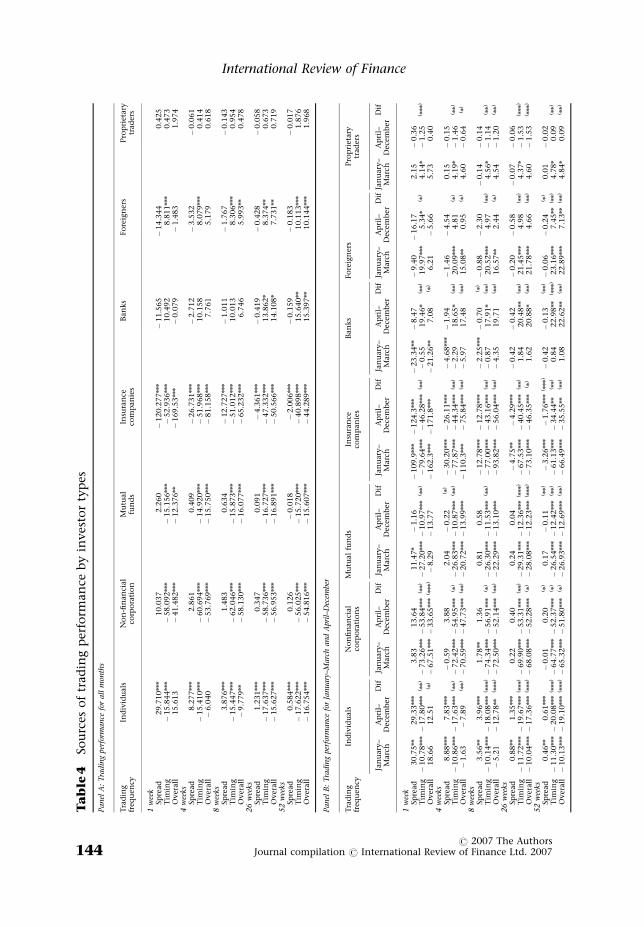
We develop a performance metric that gauges the net trading gains of securitiestrading. We define the net trading gains as net cash inflows generated by trades.Specifically, we define the gains as net cash inflows that increase the level ofportfolio holdings after adjusting for trade size and the number of shares traded.Because trade sizes as well as the level of net buy trades are different for variousinvestor types, we create a standardized measure that compares tradingperformances between different investor types. We assume that investorinitially buys (sells) the portfolios of shares during week t and subsequentlysells (buys) the same number of shares during week t1h. Given the samenumber of shares traded, trade performance is determined by the spread
8 A widely used accounting rule is called teikaho, under which a company or financial institution
can choose between cost or market price, whichever is lower, to value its asset. Particularly,
cross-held shares among keiretsu companies have low acquisition costs if they were purchased at
issue many years previously, which gives the companies greater incentives to sell these shares
when they need to increase profits. Under the new accounting standards that became effective
in fiscal year 2001, securities holdings must be valued at market prices.
How do Investors Win and Lose in Equity Trades?
r 2007 The AuthorsJournal compilation r International Review of Finance Ltd. 2007 141

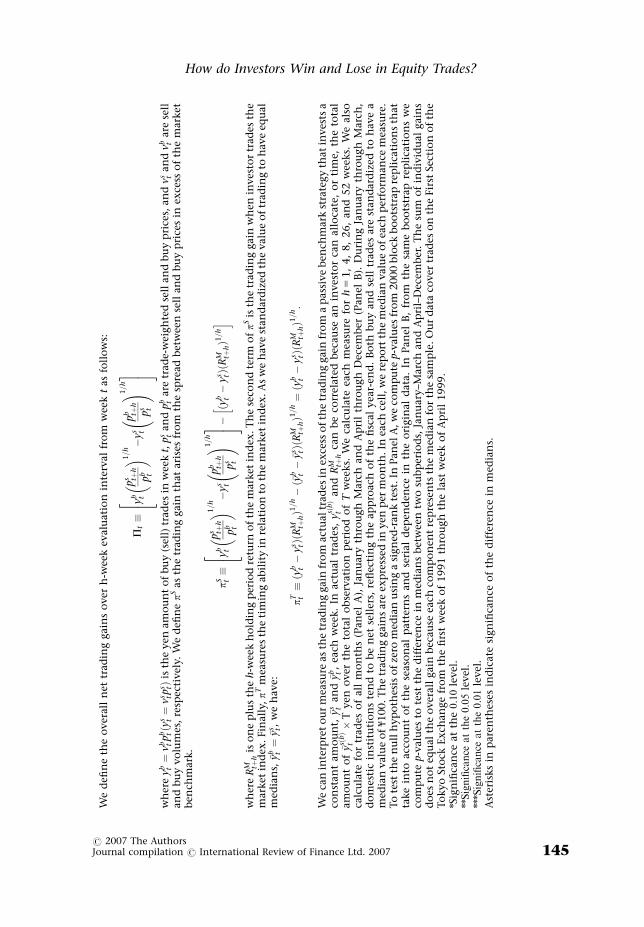
between trade-weighted buy and sell prices. We also standardize the yenamount of buy and sell trades so that the net buy trade (buy minus sell trade) forthe observation period is zero. Therefore, the trade performance is alsodetermined by the allocation (or the timing) of trades over a specified period.An investor could achieve better market timing performance if he/she allocatedmore buy trades than sell trades before increases in market returns. We definethe overall net trading gains over h-week trading horizon as follows:
Pt � ybt
pstþh
pbt
� �1=h
�yst
pbtþh
pst
!1=h24
35 ð2Þ
where ybt ¼ vb
t pbt ðys
t ¼ vst p
stÞ is the yen amount of buy (sell) trades in week t, ps
t andpb
t are trade-weighted sell and buy prices, and vst and vb
t are sell and buy volumes,respectively. The yen amount of buy and sell trades are adjusted to have thesame median values. We use the median instead of the mean because trades areknown to have skewed distributions. This measure assumes that the investorbuys vb
t shares (sells vst shares) at week t and sells (buys) the same volume of
shares at week t1h, but allowing for different selections of shares for each trade.We can interpret
pstþh
pbt
andpb
tþh
pst
as the intertemporal spreads of trade-weightedaverage prices, which reflect the stock selection as well as the trade weights ofshares each investor type chooses to trade.9 Our definition of stock selectionrefers to the choice of stocks that investors choose to buy and sell, whereas theconventional definition used for portfolio performance measurement refers tothe selection of stocks that investors decide to hold in their portfolios at thebeginning of the holding period.
Our performance measure has the following implications. If our overall nettrading gain is positive (negative), P 4 0 (o 0), it implies that the net cash flowfrom trade at time t and t1h increases (decreases) the level of the underlyingportfolio under the assumption that the same number of shares are traded attime t and t1h. In this regard, we analyze net gains that arise from trades ofmarginal investors but not profits that arise from changes in the valuation ofportfolio holdings that might not be actually traded. We decompose P into twocomponents, net-trading gains arising from price spreads and those arising frommarket timing. We define pS as the net trading gains that arise due to(intertemporal) price spreads in excess of trading the market benchmark:
pSt � yb
t
pstþh
pbt
� �1=h
�yst
pbtþh
pst
!1=h24
35� ðyb
t � yst ÞðRM
tþhÞ1=h
h ið3Þ
where RMtþh is one plus the rate of return of the market index over an h-week
interval. As the second term, ðybt � ys
t ÞðRMtþhÞ
1=h, is the net trading gains wheninvestor trades the market index, pS measures the excess gains that arises wheninvestors trade portfolio of stocks that is different from the market portfolio.
9 Using the notation in this section, the contemporary spread between trade-weighted average
sell price and buy price in Table 1, Panel C is ðpst=p
bt � 1Þ � 100.
International Review of Finance
r 2007 The AuthorsJournal compilation r International Review of Finance Ltd. 2007142

We compute pT to measure timing ability in relation to the market index. Aswe have standardized the value of trading to have equal medians, �yb
t ¼ �yst , we
have:
pTt � ðyb
t � yst ÞðRM
tþhÞ1=h � ð�yb
t � �yst ÞðRM
tþhÞ1=h ¼ ðyb
t � yst ÞðRM
tþhÞ1=h: ð4Þ
We can interpret pT as the net trading gains from actual trades in excess of thenet gains from a passive strategy that trades a constant amount, �yb
t and �yst , each
week. In actual trades, ysðbÞt and RM
tþh can be correlated because an investor canallocate, or time, the trades over a period.10 A larger pT implies better timingperformance because the investor buys (sells) before the market returnincreases (decreases). Our timing measure is similar to the portfolio perfor-mance measure developed by Grinblatt and Titman (1993). Because the originalGrinblatt–Titman measure uses the changes in portfolio weights in place oftrades, the interpretation of our measure is slightly different than theirs. In sum,we can express the overall trading profit as a summation of the abovecomponents:
Pt ¼ pSt þ pT
t : ð5Þ
Based on this performance measure, we are able to conduct a test against thenull hypothesis, H0:Pt 5 0. For net gains arising from price spreads, we havethe null hypothesis, H0 : pS
t ¼ 0, which implies that an investor trades themarket benchmark portfolio. For profits arising from market timing, we havethe null hypothesis, H0 : pT
t ¼ 0.We calculate these measures for h 5 1, 4, 8, 26, and 52 weeks over the total
observation period. By comparing the net trading gains for different tradingintervals, we can determine the effect of turnover period on the net gains. Toenable comparisons between trading gains for different trading intervals, allnumbers are expressed in yen per month. In each cell in Table 4, we report themedian net trading gains for each investor type and test the null hypothesis ofzero median using the nonparametric signed-rank test. The sum of the net gainsdoes not equal the overall gains because each component represents the medianfor the sample.
We compute the p-values of the signed-rank test statistics using a blockbootstrap method. We cannot use the conventional standard errors for thesigned-rank tests as the standard signed-rank test assumes independent data. Aswe use overlapping observations, we introduce serial dependence in theperformance measures. Also, we expect seasonal patterns in the performancemeasures arising from seasonal patterns in buy and sell trades (see Section IV.B).Therefore, we use a block bootstrap method which resamples the data in blocksto maintain the serial dependence and periodicity (i.e., seasonality) in the
10 If we use the mean trades to standardize both buy and sell trades, the expectation of pT is the
covariance between trade today and the future market returns, covðybt � ys
t ;RMtþhÞ.
How do Investors Win and Lose in Equity Trades?
r 2007 The AuthorsJournal compilation r International Review of Finance Ltd. 2007 143
Ta
ble
4So
urc
eso
ftr
ad
ing
per
form
an
ceb
yin
ves
tor
typ
es
Panel
A:
Tra
din
gper
form
ance
for
all
mon
ths
Tra
din
gfr
equ
ency
Ind
ivid
uals
No
n-fi
nan
cial
corp
ora
tio
nM
utu
al
fun
ds
Insu
ran
ceco
mp
an
ies
Ban
ks
Fo
reig
ner
sPro
pri
etary
trad
ers
1w
eek
Spre
ad
29.7
10nnn
10.0
37
2.2
60
�120.2
77nnn
�11.5
65
�14.3
44
0.4
25
Tim
ing
�15.8
44nnn
�58.0
92nnn
�15.1
56nnn
�52.9
36nnn
10.4
92
8.8
11nnn
0.4
73
Over
all
15.6
13
�41.4
82nnn
�12.3
76nn
�169.5
3nnn
�0.0
79
�1.4
83
1.9
74
4w
eeks
Spre
ad
8.2
77nnn
2.8
61
0.4
09
�26.7
31nnn
�2.7
12
�3.5
32
�0.0
61
Tim
ing
�15.4
10nnn
�60.6
94nnn
�14.9
20nnn
�51.9
68nnn
10.1
58
8.0
79nnn
0.4
14
Over
all
�6.0
40
�53.7
69nnn
�15.7
50nnn
�81.1
58nnn
7.7
61
5.1
79
0.6
18
8w
eeks
Spre
ad
3.8
76nnn
1.4
83
0.6
34
�12.7
27nnn
�1.0
11
�1.7
67
�0.1
43
Tim
ing
�15.4
47nnn
�62.0
46nnn
�15.8
73nnn
�51.0
12nnn
10.0
13
8.3
06nnn
0.9
54
Over
all
�9.7
79nn
�58.1
30nnn
�16.0
77nnn
�65.2
32nnn
6.7
46
5.9
93nn
0.4
78
26
wee
ksSp
read
1.2
31nnn
0.3
47
0.0
91
�4.3
61nnn
�0.4
19
�0.4
28
�0.0
58
Tim
ing
�17.6
37nnn
�58.7
36nnn
�16.7
27nnn
�47.3
32nnn
13.8
62n
8.3
74nn
0.6
73
Over
all
�15.6
27nnn
�56.9
53nnn
�16.8
91nnn
�50.5
66nnn
14.1
08n
7.7
31nn
0.7
19
52
wee
ksSp
read
0.5
84nnn
0.1
26
�0.0
18
�2.0
06nnn
�0.1
59
�0.1
83
�0.0
17
Tim
ing
�17.6
22nnn
�56.0
25nnn
�15.7
20nnn
�40.8
98nnn
15.6
40nn
10.1
13nnn
1.8
76
Over
all
�16.7
54nnn
�54.8
16nnn
�15.6
07nnn
�44.2
89nnn
15.3
97nn
10.1
44nnn
1.9
68
Panel
B:
Tra
din
gper
form
ance
for
January
–Marc
hand
Apri
l–D
ecem
ber
Tra
din
gfr
equ
ency
Ind
ivid
uals
No
nfi
nan
cial
corp
ora
tio
ns
Mu
tual
fun
ds
Insu
ran
ceco
mp
an
ies
Ban
ks
Fo
reig
ner
sPro
pri
etary
trad
ers
Jan
uary
–M
arc
hA
pri
l–D
ecem
ber
Dif
Jan
uary
–M
arc
hA
pri
l–D
ecem
ber
Dif
Jan
uary
–M
arc
hA
pri
l–D
ecem
ber
Dif
Jan
uary
–M
arc
hA
pri
l–D
ecem
ber
Dif
Jan
uary
–M
arc
hA
pri
l–D
ecem
ber
Dif
Jan
uary
–M
arc
hA
pri
l–D
ecem
ber
Dif
Jan
uary
–M
arc
hA
pri
l–D
ecem
ber
Dif
1w
eek
Spre
ad
30.7
5nn
29.3
3nnn
3.8
313.6
411.4
7n
�1.1
6�
109.9
nnn�
124.3
nnn
�23.3
4nn�
8.4
7�
9.4
0�
16.1
72.1
5�
0.3
6T
imin
g�
10.7
8nnn�
17.8
0nnn
( nn)�
73.2
6nnn�
53.8
4nnn
( nn)�
27.2
0nnn�
10.9
7nnn
( nn)�
79.6
4nnn�
46.2
8nnn
( nn)�
0.5
519.4
6n
( nn)
19.9
7nnn
5.3
4n
( n)
4.1
4n
�1.2
5( nnn)
Over
all
18.6
612.5
1( n
)�
67.5
1nnn�
33.6
5nnn
( nnn)�
8.2
9�
13.7
7�
162.3
nnn�
171.8
nnn
�21.2
6nn
7.0
8( n
)6.2
1�
5.6
65.7
30.4
04
wee
ksSp
read
8.8
8nnn
7.8
3nnn
�0.5
93.8
82.0
4�
0.2
2( n
)�
30.2
0nnn�
26.1
1nnn
�4.6
8nnn�
1.9
4�
1.4
6�
4.5
40.1
5�
0.1
5T
imin
g�
10.8
6nnn�
17.6
3nnn
( nn)�
72.4
2nnn�
54.9
5nnn
( n)�
26.8
3nnn�
10.8
7nnn
( nn)�
77.8
7nnn�
44.3
4nnn
( nn)�
2.2
918.6
5n
( nn)
20.0
9nnn
4.8
1( n
)4.1
9n
�1.4
6( nn)
Over
all
�1.6
3�
7.8
9( nn)�
70.5
9nnn�
47.7
3nnn
( nn)�
20.7
2nnn�
13.9
9nnn
�110.3
nnn
�75.8
4nnn
( nn)�
5.9
717.4
8( nn)
15.0
8nn
0.9
5( n
)4.6
0�
0.6
4( n
)
8w
eeks
Spre
ad
3.5
6nn
3.9
6nnn
1.7
8nn
1.3
60.8
10.5
8�
12.7
8nnn�
12.7
8nnn
�2.2
5nnn�
0.7
0( n
)�
0.8
8�
2.3
0�
0.1
4�
0.1
4T
imin
g�
10.1
4nnn�
18.0
8nnn
( nnn)�
74.3
4nnn�
56.9
1nnn
( n)�
26.3
0nnn�
11.5
3nnn
( nn)�
77.0
0nnn�
43.1
6nnn
( nn)�
0.8
717.9
1n
( nn)
20.5
2nnn
4.9
7( nn)
4.5
6n
�1.1
4( nn)
Over
all
�5.2
1�
12.7
8nn
( nnn)�
72.5
0nnn�
52.1
4nnn
( nn)�
22.2
9nnn�
13.1
0nnn
�93.8
2nnn�
56.0
4nnn
( nn)�
4.3
519.7
1( nn)
16.5
7nn
2.4
4( n
)4.5
4�
1.2
0( nn)
26
wee
ksSp
read
0.8
8nn
1.3
5nnn
0.2
20.4
00.2
40.0
4�
4.7
5nn
�4.2
9nnn
�0.4
2�
0.4
2�
0.2
0�
0.5
8�
0.0
7�
0.0
6T
imin
g�
11.7
2nnn�
19.6
7nnn
( nnn)�
69.9
0nnn�
53.3
1nnn
( nn)�
29.3
1nnn�
12.3
6nnn
( nnn)�
67.5
3nnn�
40.4
5nnn
( nn)
1.8
420.4
8nn
( nn)
21.4
5nnn
4.9
8( nn)
4.3
7n
�1.5
3( nnn)
Over
all�
10.0
4nnn�
17.3
6nnn
( nnn)�
68.0
8nnn�
52.2
8nnn
( n)�
28.0
8nnn�
12.2
3nnn
( nnn)�
73.1
0nnn�
46.3
5nnn
( n)
1.6
220.8
8n
( nn)
21.7
8nnn
4.6
6( nn)
4.6
0�
1.5
3( nnn)
52
wee
ksSp
read
0.4
6nn
0.6
1nnn
�0.0
10.2
0( n
)0.1
7�
0.1
1( nn)
�3.2
6nnn
�1.7
6nnn
( nnn)�
0.4
2�
0.1
3( nn)�
0.0
6�
0.2
4( n
)0.0
1�
0.0
2T
imin
g�
11.3
0nnn�
20.0
8nnn
( nnn)�
64.7
7nnn�
52.3
7nnn
( n)�
26.5
4nnn�
12.4
2nnn
( nn)�
61.1
3nnn�
34.4
4nn
( nn)
0.8
422.9
8nn
( nnn)
23.1
6nnn
7.4
5nn
( nn)
4.7
8n
0.0
9( nn)
Over
all�
10.1
3nnn�
19.1
0nnn
( nnn)�
65.3
2nnn�
51.8
0nnn
( n)�
26.9
3nnn�
12.6
9nnn
( nn)�
66.4
9nnn�
35.5
5nn
( nn)
1.0
822.6
2nn
( nn)
22.8
9nnn
7.1
3nn
( nn)
4.8
4n
0.0
9( nn)
r 2007 The AuthorsJournal compilation r International Review of Finance Ltd. 2007144
International Review of Finance
We
defi
ne
the
over
all
net
trad
ing
gain
so
ver
h-w
eek
evalu
ati
on
inte
rval
fro
mw
eek
tas
foll
ow
s:
Pt�
yb t
ps tþ
h
pb t
�� 1=h�
ys t
pb tþ
h
ps t
! 1=
h2 4
3 5w
her
ey
b t¼
vb tp
b tðy
s t¼
vs tp
s tÞis
the
yen
am
ou
nt
of
bu
y(s
ell)
trad
esin
wee
kt,
ps t
an
dp
b tare
trad
e-w
eigh
ted
sell
an
db
uy
pri
ces,
an
dv
s tan
dv
b tare
sell
an
db
uy
vo
lum
es,
resp
ecti
vel
y.W
ed
efin
epS
as
the
trad
ing
gain
that
ari
ses
fro
mth
esp
read
bet
wee
nse
llan
db
uy
pri
ces
inex
cess
of
the
mar
ket
ben
chm
ark
.
pS t�
yb t
ps tþ
h
pb t
�� 1=h�
ys t
pb tþ
h
ps t
! 1=
h2 4
3 5 �ðy
b t�
ys tÞð
RM tþ
hÞ1=h
hi
wh
ere
RM tþ
his
on
ep
lus
the
h-w
eek
ho
ldin
gp
erio
dre
turn
of
the
mark
etin
dex
.T
he
seco
nd
term
ofpS
isth
etr
ad
ing
gain
wh
enin
ves
tor
trad
esth
em
arket
ind
ex.Fin
all
y,pT
mea
sure
sth
eti
min
gab
ilit
yin
rela
tio
nto
the
mark
etin
dex
.A
sw
eh
ave
stan
dar
diz
edth
evalu
eo
ftr
ad
ing
toh
ave
equ
al
med
ian
s,� y
b t¼
� ys t,
we
have:
pT t�ðy
b t�
ys tÞð
RM tþ
hÞ1=h�ð� y
b t�
� ys tÞð
RM tþ
hÞ1=h¼ðy
b t�
ys tÞð
RM tþ
hÞ1=h:
We
can
inte
rpre
to
ur
mea
sure
as
the
trad
ing
gain
fro
mact
ual
trad
esin
exce
sso
fth
etr
ad
ing
gain
fro
ma
pass
ive
ben
chm
ark
stra
tegy
that
inves
tsa
con
stan
tam
ou
nt,
� ys t
an
d� y
b t,
each
wee
k.
Inact
ual
trad
es,
ysð
bÞ
tan
dR
M tþh
can
be
corr
elat
edbec
au
sean
inves
tor
can
all
oca
te,
or
tim
e,th
eto
tal
am
ou
nt
of
� ysð
bÞ
t�
Tyen
over
the
tota
lo
bse
rvati
on
per
iod
of
Tw
eeks.
We
calc
ula
teea
chm
easu
refo
rh
51,
4,
8,
26,
an
d52
wee
ks.
We
als
oca
lcu
late
for
trad
eso
fall
mo
nth
s(P
an
elA
),Ja
nu
ary
thro
ugh
Marc
han
dA
pri
lth
rou
gh
Dec
emb
er(P
anel
B).
Du
rin
gJa
nu
ary
thro
ugh
Marc
h,
do
mes
tic
inst
itu
tio
ns
ten
dto
be
net
sell
ers,
refl
ecti
ng
the
ap
pro
ach
of
the
fisc
alyea
r-en
d.
Bo
thb
uy
an
dse
lltr
ad
esare
stan
dard
ized
toh
ave
am
edia
nvalu
eo
ff100.T
he
trad
ing
gain
sare
exp
ress
edin
yen
per
mo
nth
.In
each
cell
,w
ere
po
rtth
em
edia
nvalu
eo
fea
chp
erfo
rman
cem
easu
re.
To
test
the
nu
llh
yp
oth
esis
of
zero
med
ian
usi
ng
asi
gn
ed-r
ank
test
.In
Pan
elA
,w
eco
mp
ute
p-v
alu
esfr
om
2000
blo
ckb
oo
tstr
ap
rep
lica
tio
ns
that
take
into
acc
ou
nt
of
the
seaso
nal
patt
ern
san
dse
rial
dep
end
ence
inth
eo
rigin
ald
ata
.In
Pan
elB
,fr
om
the
sam
ebo
ots
trap
rep
lica
tio
ns
we
com
pu
tep-v
alu
esto
test
the
dif
fere
nce
inm
edia
ns
bet
wee
ntw
osu
bp
erio
ds,
Jan
uary
–Marc
han
dA
pri
l–D
ecem
ber
.T
he
sum
of
ind
ivid
ual
gain
sd
oes
no
teq
ual
the
over
all
gain
bec
au
seea
chco
mp
on
ent
rep
rese
nts
the
med
ian
for
the
sam
ple
.O
ur
data
cover
trad
eso
nth
eFir
stSe
ctio
no
fth
eTo
kyo
Sto
ckExch
an
ge
fro
mth
efi
rst
wee
ko
f1991
thro
ugh
the
last
wee
ko
fA
pri
l1999.
nSi
gn
ifica
nce
at
the0.10
level
.nnSignificance
atthe0.05
level
.nnnSignificance
atthe0.01
level
.A
ster
isks
inp
are
nth
eses
ind
icate
sign
ifica
nce
of
the
dif
fere
nce
inm
edia
ns.
r 2007 The AuthorsJournal compilation r International Review of Finance Ltd. 2007 145
How do Investors Win and Lose in Equity Trades?
original sample, as resampling of the data using conventional bootstrap methodinevitably will destroy information included in the sequence of the originaldata.11 To determine the block size for bootstrapping, we first examine the serialdependence of performance measures by fitting an ARMA model after adjustingfor seasonality.12 We find that the maximum lag length among all performancemeasures is 5 weeks. To bootstrap time series data with seasonality, Politis(2003) proposed a method to resample the data in periodic blocks. Our naturalperiodic block length is 52 weeks because our data has monthly patterns. As the52 weeks block length subsumes the serial dependence of 5 weeks identified bythe ARMA model, we randomly resample the original data with replacement inblock length of 52 weeks. As we test the null hypothesis of zero median, wesubtract the median value from the original sample to generate the bootstrapdistribution under the null hypothesis. We conduct 2000 replications for eachcase.
B. Results
In Table 4, Panel A, our result shows that the overall net trading gain, P, for 1week trading interval is greatest for individual investors, which is due to thelarge trading gain arising from price spreads for short trading intervals. Forinitial buy and sell trades, both having median value of f100, average individualinvestors generate a median trading profit of f15.61 for turning over the samenumber of shares 1 week subsequent to the initial trade.13 On the other hand,our result shows that individual investors had a median trading loss of f16.75 ifthey turned over the same number of shares 52 weeks later. Although thepositive gains from the intertemporal price spreads for individual investorscould partly reflect higher risk premium of (possibly smaller) stocks preferred byindividual investors, they reflect the positive spread difference between thetrade-weighted sell and buy prices (see Table 1, Panel C). The positive pricespreads for individual investors might reflect the investors’ disposition to sellwinning investments and hold onto losing investments. Our result is alsoconsistent with the findings by Barber and Odean (2000) for US individualinvestors that show positive abnormal return for short-term round-trip trades.As trading intervals become longer, our result shows that the overall tradinggain of individual investors worsens. Because gains from price spreads becomesrelatively smaller for longer trading intervals, trading losses arising from poormarket timing dominates the overall performances for longer trading intervals.We also observe a similar pattern of trading performances for nonfinancial
11 For general discussion on block bootstrap methods, see Davison and Hinkley (1997).
12 We use the Minimum Information Criterion Method that estimates ARMA with various lag
lengths and tentatively identify the order of the process. See Box et al. (1994).
13 In effect, the median net initial trade is zero yen as we assume each investor type buys and sells
100 yen each. After 1 week, investor sells and buys the same numbers of shares as the initial
trade and generates a median trading gain of 15.61 yen.
International Review of Finance
r 2007 The AuthorsJournal compilation r International Review of Finance Ltd. 2007146

corporations, although their trading gains from price spreads are notstatistically significant.
In contrast, we find that foreign investors have negative trading perfor-mances (while not statistically significant) arising from intertemporal pricespreads. As foreign investors have significant negative price spreads (see Table 1,Panel C), a short-term turnover of their portfolios would not be a sustainabletrading strategy in the long run. In effect, we find that foreign investors havepositive performances arising from good market timing that largely offset thelosses arising from negative price spreads.
Although banks have relatively large positive contemporaneous spreadsbetween sell prices and buy prices (see Table 1, Panel C), we do not find anypositive performance arising from intertemporal price spreads, which must bedue to banks’ poor price spread performance relative to the market movements.However, our result shows that banks have positive market timing perfor-mances that generate significant and positive overall trading gains for longertrading intervals.
Other professional money managers such as mutual funds and insurancecompanies, on the other hand, have trading losses arising from poor markettiming.14 As Japanese mutual funds face considerably higher fund churningratios compared with US and UK mutual funds (see Takehara and Yamada 2004),high levels of fund flows might negatively affect funds’ market timingperformance as fund managers face greater short-term liquidity trading of fundassets. Edelen (1999) found for US mutual funds that funds’ short-term liquiditytrading explains the negative market-timing performance of mutual funds.15
Similarly, the poor performances of insurance companies might be explained byunexpected asset liquidations to meet insurance claims. Our result points to thefact that insurance companies not only have significantly poor market timingperformance but also significantly poor performance from price spreads. Ourresult shows that insurance companies are the only investor type that performsvery poorly in both performances. A caveat is that our trading intervals mightbe too short to evaluate net trading gains of insurance companies as theiraverage holding period could be around 10 years, which we infer from theaverage annual turnover ratio of 0.09 (Table 1, Panel D).
Figure 1 shows overall trading gains (Pt) cumulated over the observationperiod for different investor types. Panel A of Figure 1 shows cumulated profits
14 Also using data from the TSE, Froot et al. (2001) and Kamesaka et al. (2003) found comparable
results of timing performance. Because Kamesaka, Nofsinger, and Kawakita found a similar
result using longer time series from January 1980 to October 1997, the result seems robust for
different observation periods. Hamao and Mei (2001) examined monthly data and found that
banks have better market timing than foreign investors before early 1990s.
15 Cai et al. (1997) discovered that Japanese equity mutual funds show unusually large
underperformance regardless of various benchmarks. Our result points to the fact that poor
market timing might explain part of the underperformance.
How do Investors Win and Lose in Equity Trades?
r 2007 The AuthorsJournal compilation r International Review of Finance Ltd. 2007 147

Panel A: 1 week trading interval
−30000
−25000
−20000
−15000
−10000
−5000
0
5000
10000
15000
20000
Panel B: 4 week trading interval
−30000
−25000
−20000
−15000
−10000
−5000
0
5000
10000
Panel C: 8 week trading interval
−50000
−40000
−30000
−20000
−10000
0
10000
20000
Panel D: 26 week trading interval
−35000
−30000
−25000
−20000
−15000
−10000
−5000
0
5000
10000
15000
Figure1 Cumulated Overall Trading Gains of Different Investor Types for 1, 4, 8, and26 Week Trading Horizons
This figure shows the cumulated overall net trading gains for different investor typesfrom January 1991 to April 1999. We define the overall trading gain over h-week tradinginterval from week t as follows:
Pt � ybt
pstþh
pbt
� �1=h
�yst
pbtþh
pst
!1=h24
35
where ybt ¼ vb
t pbt ðys
t ¼ vst p
stÞ is the yen amount of buy (sell) trades in week t, ps
t and pbt are trade-
weighted sell and buy prices, and vst and vb
t are sell and buy volumes, respectively. Both buyand sell trades are standardized to have a median value of f100. The trading gains are expressedin yen per month. In Panel A, we draw the cumulated gains computed for 1 week tradinghorizon. We observe a downward shift of the cumulative gains for individual investor in thelast week of October 1993, which reflects the post-IPO purchasing price of East Japan RailwayCompany. As the post-IPO price of the share was much higher than average price of the sharesusually traded by individual investors, the trade-weighted purchase price increased by morethan 200% from the previous week. We do not include the graph of cumulated gains forinsurance companies in Panel A (1 week trading interval) and Panel B (4 week trading interval)because the graph does not comfortably fit in the panels due to large negative numbers.
International Review of Finance
r 2007 The AuthorsJournal compilation r International Review of Finance Ltd. 2007148
for 1-week-trading intervals.16 We find that the net trading gains of individualinvestors for a very short trading interval exceed those of other investor typesdue to the large trading gains arising from positive price spreads (see Table 4).17
We do not include the graph of the cumulated gains for insurance companies inPanel A (1 week trading interval) and Panel B (4 week trading interval) becausethe graph does not comfortably fit in the panels due to their large cumulativelosses. In Panels C and D, we draw cumulated gains computed for 8- and 26-week trading intervals for all investor types. The figures confirm the result thatthe impact of price spreads on overall trading performance becomes lessdominant and the impact of market timing becomes more as trading intervalsbecome longer for all investor types.
In Table 4, Panel B, we show trading profits that arise from trades conductedduring January through March and April through December. We find that thenet trading gains of banks worsen during the FYE for both price spreads andmarket timing. This result is consistent with the fact that banks might beobliged to sell near the FYE for accounting purposes as well as for other reasonssuch as adjusting the stock ownership among the group companies (see SectionIV.B). Nonfinancial corporations and insurance companies also perform worseduring FYE because some of them have the same trading incentives as banks tosell equities before the FYE. In contrast, we find very large positive timingperformances for foreign investors during the FYE period. Our result shows thatforeign investors take advantage of the trading opportunities during the FYEperiod to buy up equities from domestic institutions. We note that the markettiming performance of individual investors and proprietary traders alsoimprove during the FYE period, because these investors most likely do nothave special incentives to sell shares during the period and also can maketrading gains by buying from domestic institutions.18
In Table 5, we examine the correlations of overall trade performance (P),market adjusted price spread performance (pS), and timing performance (pT)between various investor types calculated for the trading interval of 8 weeks. Wedo not report results for other trading intervals as the results are qualitatively
16 The downward shift of the cumulative profits for individual investor in the last week of October
1993 reflects the purchasing price of East Japan Railway Company of individual investors
immediately after the IPO. As the post-IPO price of the share was much higher than average
price of the shares usually traded by individual investors, the trade-weighted purchase price
increased by more than 200% from the previous week.
17 The increase in trading profits for individual investors and the decrease for foreign investors
after 1996 might affect the results in Table 4 that use data for the entire observation period. To
check the robustness of the results, we estimate the profit measures for the period before 1995.
We find that, although the absolute magnitudes of pS for individual investors, non-financial
corporations, and foreign investors are smaller before 1995 for shorter trading horizons
compared with the results in Table 4, all crucial signs remain the same and our overall
conclusion is not affected. The results for longer trading horizons are not much different
between before and after 1995.
18 To compute p-values using block bootstrap method for January–March and April–December, we
generate separate bootstrap samples for each period using data from respective months.
How do Investors Win and Lose in Equity Trades?
r 2007 The AuthorsJournal compilation r International Review of Finance Ltd. 2007 149
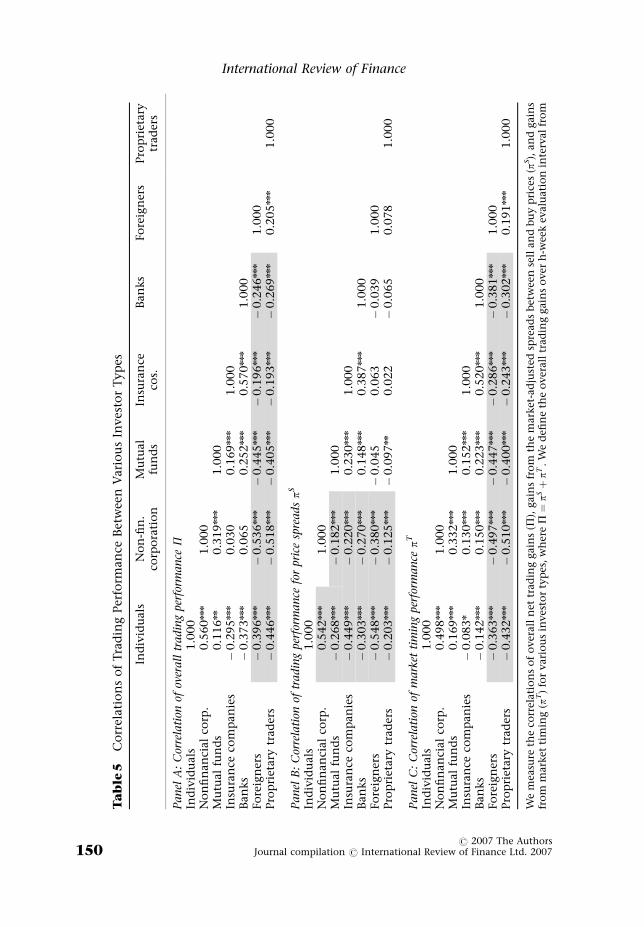
Ta
ble
5C
orr
elati
on
so
fTra
din
gPer
form
an
ceB
etw
een
Vari
ou
sIn
ves
tor
Typ
es
Ind
ivid
uals
No
n-fi
n.
corp
ora
tio
nM
utu
al
fun
ds
Insu
ran
ceco
s.B
an
ks
Fo
reig
ner
sPro
pri
etary
trad
ers
Panel
A:
Cor
rela
tion
ofov
erall
tradin
gper
form
ance
PIn
div
idu
als
1.0
00
No
nfi
nan
cial
corp
.0.5
60nnn
1.0
00
Mu
tual
fun
ds
0.1
16nn
0.3
19nnn
1.0
00
Insu
ran
ceco
mp
an
ies
�0.2
95nnn
0.0
30
0.1
69nnn
1.0
00
Ban
ks
�0.3
73nnn
0.0
65
0.2
52nnn
0.5
70nnn
1.0
00
Fo
reig
ner
s�
0.3
96nnn
�0.5
36nnn
�0.4
45nnn
�0.1
96nnn
�0.2
46nnn
1.0
00
Pro
pri
etary
trad
ers
�0.4
46nnn
�0.5
18nnn
�0.4
05nnn
�0.1
93nnn
�0.2
69nnn
0.2
05nnn
1.0
00
Panel
B:
Cor
rela
tion
oftr
adin
gper
form
ance
for
pri
cesp
readspS
Ind
ivid
uals
1.0
00
No
nfi
nan
cial
corp
.0.5
42nnn
1.0
00
Mu
tual
fun
ds
�0.2
68nnn
�0.1
82nnn
1.0
00
Insu
ran
ceco
mp
an
ies
�0.4
49nnn
�0.2
20nnn
0.2
30nnn
1.0
00
Ban
ks
�0.3
03nnn
�0.2
70nnn
0.1
48nnn
0.3
87nnn
1.0
00
Fo
reig
ner
s�
0.5
48nnn
�0.3
80nnn
�0.0
45
0.0
63
�0.0
39
1.0
00
Pro
pri
etary
trad
ers
�0.2
03nnn
�0.1
25nnn
�0.0
97nn
0.0
22
�0.0
65
0.0
78
1.0
00
Panel
C:
Cor
rela
tion
ofm
ark
etti
min
gper
form
ance
pT
Ind
ivid
uals
1.0
00
No
nfi
nan
cial
corp
.0.4
98nnn
1.0
00
Mu
tual
fun
ds
0.1
69nnn
0.3
32nnn
1.0
00
Insu
ran
ceco
mp
an
ies
�0.0
83n
0.1
30nnn
0.1
52nnn
1.0
00
Ban
ks
�0.1
42nnn
0.1
50nnn
0.2
23nnn
0.5
20nnn
1.0
00
Fo
reig
ner
s�
0.3
63nnn
�0.4
97nnn
�0.4
47nnn
�0.2
86nnn
�0.3
81nnn
1.0
00
Pro
pri
etary
trad
ers
�0.4
32nnn
�0.5
10nnn
�0.4
00nnn
�0.2
43nnn
�0.3
02nnn
0.1
91nnn
1.0
00
We
mea
sure
the
corr
elati
on
so
fo
ver
all
net
trad
ing
gain
s(P
),gain
sfr
om
the
mark
et-a
dju
sted
spre
ad
sbet
wee
nse
llan
dbu
yp
rice
s(p
S),
an
dgain
sfr
om
mar
ket
tim
ing
(pT)
for
vari
ou
sin
ves
tor
typ
es,w
her
eP¼
pSþpT
.W
ed
efin
eth
eo
ver
all
trad
ing
gain
so
ver
h-w
eek
evalu
ati
on
inte
rval
fro
m
International Review of Finance
r 2007 The AuthorsJournal compilation r International Review of Finance Ltd. 2007150
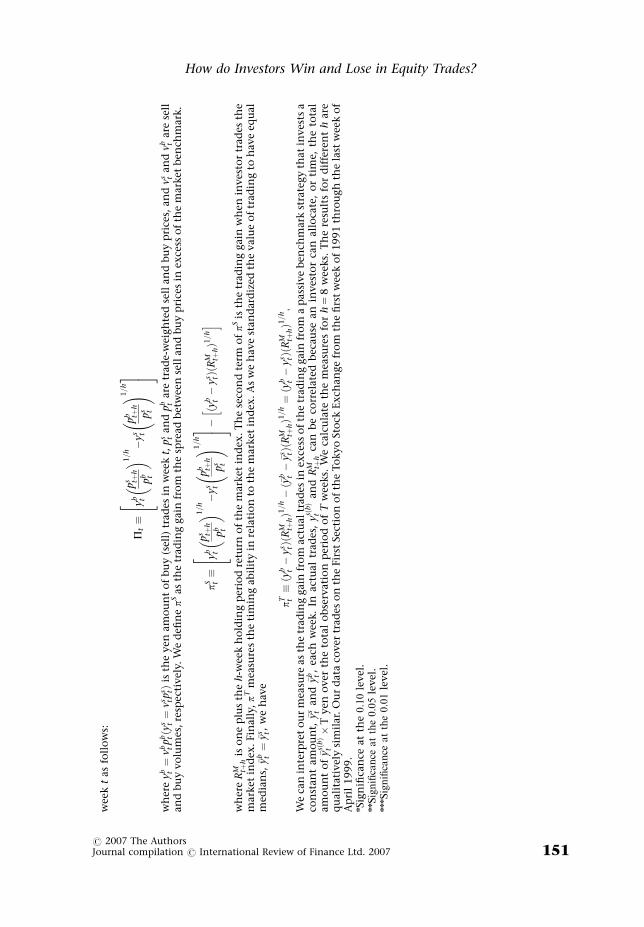
wee
kt
as
foll
ow
s:
Pt�
yb t
ps tþ
h
pb t
�� 1=h�
ys t
pb tþ
h
ps t
! 1=
h2 4
3 5w
her
ey
b t¼
vb tp
b tðy
s t¼
vs tp
s tÞis
the
yen
am
ou
nt
of
bu
y(s
ell)
trad
esin
wee
kt,
ps t
an
dp
b tare
trad
e-w
eigh
ted
sell
an
dbu
yp
rice
s,an
dv
s tan
dv
b tare
sell
an
db
uy
vo
lum
es,re
spec
tivel
y.W
ed
efin
epS
as
the
trad
ing
gain
fro
mth
esp
read
bet
wee
nse
llan
db
uy
pri
ces
inex
cess
of
the
mark
etb
ench
mark
.
pS t�
yb t
ps tþ
h
pb t
�� 1=h�
ys t
pb tþ
h
ps t
! 1=
h2 4
3 5 �ðy
b t�
ys tÞð
RM tþ
hÞ1=h
hi
wh
ere
RM tþ
his
on
ep
lus
the
h-w
eek
ho
ldin
gp
erio
dre
turn
of
the
mar
ket
ind
ex.T
he
seco
nd
term
ofpS
isth
etr
ad
ing
gain
wh
enin
ves
tor
trad
esth
em
ark
etin
dex
.Fin
ally
,pT
mea
sure
sth
eti
min
gab
ilit
yin
rela
tio
nto
the
mark
etin
dex
.A
sw
eh
ave
stan
dar
diz
edth
evalu
eo
ftr
ad
ing
toh
ave
equ
al
med
ian
s,� y
b t¼
� ys t,
we
hav
e
pT t�ðy
b t�
ys tÞð
RM tþ
hÞ1=h�ð� y
b t�
� ys tÞð
RM tþ
hÞ1=h¼ðy
b t�
ys tÞð
RM tþ
hÞ1=h;
We
can
inte
rpre
to
ur
mea
sure
as
the
trad
ing
gain
fro
mact
ualtr
ad
esin
exce
sso
fth
etr
ad
ing
gain
fro
ma
pass
ive
ben
chm
ark
stra
tegy
that
inves
tsa
con
stan
tam
ou
nt,
� ys t
an
d� y
b t,
each
wee
k.
Inact
ual
trad
es,
ysðbÞ
tan
dR
M tþh
can
be
corr
elate
db
ecau
sean
inves
tor
can
all
oca
te,
or
tim
e,th
eto
tal
am
ou
nt
of
� ysð
bÞ
t�
Tyen
over
the
tota
lo
bse
rvati
on
per
iod
of
Tw
eeks.
We
calc
ula
teth
em
easu
res
for
h5
8w
eeks.
Th
ere
sult
sfo
rd
iffe
ren
th
are
qu
ali
tati
vel
ysi
mil
ar.
Ou
rd
ata
cover
trad
eso
nth
eFir
stSe
ctio
no
fth
eTo
kyo
Sto
ckExch
an
ge
fro
mth
efi
rst
wee
ko
f1991
thro
ugh
the
last
wee
ko
fA
pri
l1999.
nSi
gn
ifica
nce
at
the0.10
level
.nnSignificance
atthe0.05
level
.nnnSignificance
atthe0.01
level
.
How do Investors Win and Lose in Equity Trades?
r 2007 The AuthorsJournal compilation r International Review of Finance Ltd. 2007 151
similar. In Table 5, Panel A shows that P for foreign investors and proprietarytraders tend to increase when P for other domestic investors decrease, which isindicated by large and negative correlations of the last two rows of Panel A. Wefind in Panel B of Table 5 that the correlations of net trading gains arising fromprice spreads, pS, are negative between the group of nonprofessional investors(i.e., individual investors and nonfinancial corporations) and the rest ofprofessional investors (see negative correlations of the first two columns inPanel B). These negative correlations imply that profits arising from pricespreads shift between professional and nonprofessional investors. As the trade-weighted prices reflect the selection of stocks being bought and sold, thenegative correlations suggest that professional and nonprofessional investorsselect equities to trade in opposite directions to each other. We find large andnegative correlations of pT between domestic investors and foreign investors,which suggests that trading gains arising from market timing mostly shiftbetween the group of domestic investors and foreign investors (as well asproprietary traders). (See the last two rows of Table 5, Panel C.) As thecorrelation pattern for pT is similar to that of the overall trade performance inPanel A of Table 5, we find that the correlations in market timing performancelargely determines the correlation of the overall performance among differentinvestor types.
VI. CONCLUSION AND DISCUSSION
In this paper, we examine the trading performance of different investor typessuch as individual investors, various institutional investors, and foreigninvestors. We develop a method that gauges the performance of equity tradesof marginal investors. We use data from the TSE that allow us to examineperformances of all investor types across the entire market. Our main resultimplies that different investor types have different sources of equity tradinggains and losses. In particular, we find that average foreign investors make largetrading gains from good market timing but likely to incur minor losses fromnegative spreads between sell and buy prices. On the other hand, we find thatnonprofessional investors such as individual investors make trading gains frompositive spreads between sell and buy prices, especially in the short-term, butlose from bad market timing. The positive price spreads for individual investorsmight reflect the investors’ disposition to sell winning investments and holdonto losing investments. The poor market timing ability of individual investorscould indicate poor ability in predicting market. However, as average individualinvestors can generate gains from short-term turnover of their portfolios, suchgains might justify their continued participation in a competitive equity marketdespite their poor market timing ability.
Our results also shed light on conflicting empirical results regarding foreigninvestors. Some papers have reported results that indicate foreign investorshave good performance in equity trade (Grinblatt and Keloharju 2000;
International Review of Finance
r 2007 The AuthorsJournal compilation r International Review of Finance Ltd. 2007152
Seasholes 2000; Bailey et al. 2007), whereas other papers have found thatforeign investors trade in a manner similar to less informed investors (Dahlquistand Robertsson 2004; Choe et al. 2005). The momentum trading patterns thatwe find for foreign investors hint that these investors are less informed investorswith respect to individual stock information as suggested by Brennan and Cao(1997). Also, we find that foreign investors pay higher average prices for theportfolio of stocks they buy than for the portfolio of stocks they sell. However,because foreign investors draw their trading gains from good market timing, ourresults suggest that they are actually smart traders that seek more trading gainsfrom macromanagement (e.g., market prediction and/or asset allocation) thanfrom micromanaging (e.g., stock picking) of their portfolios. Our result isconsistent with the recent findings by Thomas et al. (2004) that showed thatthe performances of US investors’ international portfolio depend on thesuccessful exploitation of public information and not on private information.
Our paper also finds that trading gains and losses arise from trades betweeninvestors that have different institutional backgrounds. During the monthsbefore the FYE, domestic institutions, particularly banks, sell a significantlylarge number of shares for possibly window-dressing purposes and for adjustingtheir stock ownership among the group (keiretsu) firms. On the other hand,foreign investors take advantage of this trading opportunity and buy up a largeamount of shares from domestic institutions on favorable terms. Our resultshows that foreign investors generate significant trading gains during thisperiod. Individual investors also benefit to a lesser extent because they, too, arenot subject to the institutional constraints that institutions face.
Takeshi YamadaNUS Business [email protected]
REFERENCES
Bailey, W., C. X. Mao, and K. Sirdom (2007). ‘Investment Restrictions and the Cross-Border Flow of Information: Some Empirical Evidence’, Journal of InternationalMoney and Finance, 26, 1–25.
Barber, B. M., and T. Odean (2000), ‘Trading is Hazardous to Your Wealth: TheCommon Stock Investment Performances of Individual Investors’, Journal ofFinance, 55, 773–806.
Barber, B. M., and T. Odean (2003). ‘All that Glitters: The Effect of Attention and Newson the Buying Behavior of Individual and Institutional Investors’, Review ofFinancial Studies, forthcoming.
Barber, B. M., Y.-T. Lee, Y.-J. Liu, and T. Odean (2007). ‘Is the Aggregate InvestorReluctant to Realise Losses? Evidence from Taiwan’, European Financial Management,13, 423–447.
Box, G. E. P., and G. M. Jenkins, and G. C. Reinsel (1994), Time Series Analysis:Forecasting and Control, 3rd edn. Englewood Cliffs, NJ: Prentice Hall.
How do Investors Win and Lose in Equity Trades?
r 2007 The AuthorsJournal compilation r International Review of Finance Ltd. 2007 153

Bremer, M., and K. Kato (1996), ‘Trading Volume for Winners and Losers on the TokyoStock Exchange’, Journal of Financial and Quantitative Analysis, 31, 127–42.
Brennan, M., and H. Cao (1997), ‘International Portfolio Investment Flows’, Journal ofFinance, 52, 1851–80.
Cai, J., K. C. Chan, and T. Yamada (1997), ‘The Performance of Japanese MutualFunds’, The Review of Financial Studies, 10, 237–73.
Cai, F., G. Kaul, and L. Zheng (2000). Institutional Trading and Stock Returns. Workingpaper, University of Michigan Business School, Ann Arbor, MI.
Choe, H., B. C. Kho, and R. Stulz (1999), ‘Do Foreign Investors Destabilize StockMarkets? The Korean Experience in 1997’, Journal of Financial Economics, 54, 227–64.
Choe, H., B. C. Kho, and R. Stulz (2005), ‘Do Domestic Investors Have an Edge? TheTrading Experience of Foreign Investors in Korea’, Review of Financial Studies, 18,795–829.
Cohen, R. B. (1999). Asset Allocation Decisions of Individuals and Institutions.Working paper, Harvard Business School, Cambridge, MA.
Cohen, R. B., P. A. Gompers, and T. Vuolteenaho (2002), ‘Who Underreacts to Cash-Flow News? Evidence from Trading Between Individuals and Institutions’, Journal ofFinancial Economics, 66, 409–62.
Dahlquist, M., and G. Robertsson (2004), ‘A Note on Foreigners’ Trading and PriceEffects across Firms’, Journal of Banking and Finance, 28, 615–32.
Davison, A. C., and D. V. Hinkley (1997), Bootstrap Methods and their Applications.Cambridge: Cambridge University Press.
Dvorak, T. (2005), ‘Do Domestic Investors have an Informational Advantage?’, Journalof Finance, 60, 817–39.
Edelen, R. M. (1999), ‘Investor Flows and the Assessed Performance of Open-EndMutual Funds’, Journal of Financial Economics, 53, 439–66.
Froot, K. A., B. Garvey, and N. Sosner (2001), ‘Winners and Losers in Japanese Equities:A Study in the Interaction between Foreigners and Domestics, Global ResearchInsights, March 13
Froot, K. A., P. G. J. O’Connell, and M. S. Seasholes (2001), ‘The Portfolio Flows ofInternational Investors’, Journal of Financial Economics, 59, 151–93.
Froot, K. A., and T. Ramadorai (2001). The Information Content of InternationalPortfolio Flows. NBER Working Paper Series, No. 8472.
Griffin, J. M., J. H. Harris, and S. Topaloglu (2003), ‘The Dynamics of Institutional andIndividual Trading’, Journal of Finance, 58, 2285–320.
Grinblatt, M., and M. Keloharju (2000), ‘The Investment Behavior and Performance ofVarious Investor-Types: A Study of Finland’s Unique Data Set’, Journal of FinancialEconomics, 55, 43–67.
Grinblatt, M., and M. Keloharju (2001), ‘What Makes Investors Trade?’, Journal ofFinance, 56, 589–616.
Grinblatt, M., and S. Titman (1993), ‘Performance Measurement Without Benchmarks:An Examination Of Mutual Fund Returns’, Journal of Business, 66, 47–68.
Hamao, Y., and J. Mei (2001), ‘Living with the ‘‘Enemy’’: An Analysis of ForeignInvestment in the Japanese Equity Market’, Journal of International Money andFinance, 20, 715–35.
He, J., L. Ng, and Q. Wang (2004), ‘Quarterly Trading Patterns of FinancialInstitutions’, Journal of Business, 77, 493–509.
Kamesaka, A., J. R. Nofsinger, and H. Kawakita (2003), ‘Investment Patterns andPerformance of Investor groups in Japan’, Pacific-Basin Finance Journal, 11, 1–22.
Karolyi, G. A. (2002), ‘Did the Asian Financial Crisis Scare Foreign Investors Out ofJapan?’, Pacific-Basin Finance Journal, 10, 411–42.
Kato, K., and U. Loewenstein (1995), ‘The Ex-Dividend-Day Behavior of Stock Prices:The Case of Japan’, Review of Financial Studies, 8, 817–47.
International Review of Finance
r 2007 The AuthorsJournal compilation r International Review of Finance Ltd. 2007154
Kim, K., and J. R. Nofsinger (2005), ‘Institutional Herding, Business Groups, andEconomic Regimes: Evidence from Japan’, Journal of Business, 78, 213–242.
Lakonishok, J., A. Shleifer, and R. W. Vishny (1992), ‘The Impact of InstitutionalTrading on Stock Prices’, Journal of Financial Economics, 32, 23–43.
Ng, L., and Q. Wang (2004), ‘Institutional Trading and the Turn-of-the-Year Effect’,Journal of Financial Economics, 74, 343–66.
Nofsinger, J. R., and R. W. Sias (1999), ‘Herding and Feedback Trading by Institutionaland Individual Investors’, Journal of Finance, 54, 2263–95.
Odean, T. (1999), ‘Do Investors Trade Too Much?’, American Economic Review, 89, 1279–98.
Politis, D. N. (2003), ‘The Impact of Bootstrap Methods on Time Series Analysis’,Statistical Science, 18, 219–30.
Seasholes, M. S. (2000). Smart Foreign Traders in Emerging Markets. Working paper,Harvard University, Cambridge, MA.
Takehara, H., and T. Yamada (2004). The Impact of Fund Turnover on Japanese MutualFund Performance. Working paper, NUS Business School.
Thomas, C. P., F. E. Warnock, and J. Wongswan (2004). The Performance ofInternational Portfolios. Working paper, Board of Governors of the Federal ReserveSystem. (International Finance Discussion Paper, Number 817.)
How do Investors Win and Lose in Equity Trades?
r 2007 The AuthorsJournal compilation r International Review of Finance Ltd. 2007 155