Embed Size (px)
Citation preview
How Deep Is Your Blue?—Coloured Chemistry with Smartphones
Daniel Bengtsson · Lilla Jónás · Miroslaw Los
Marc Montangero · Márta Gajdosné Szabó
How Deep Is Your Blue?—Coloured Chemistry with Smartphones 21
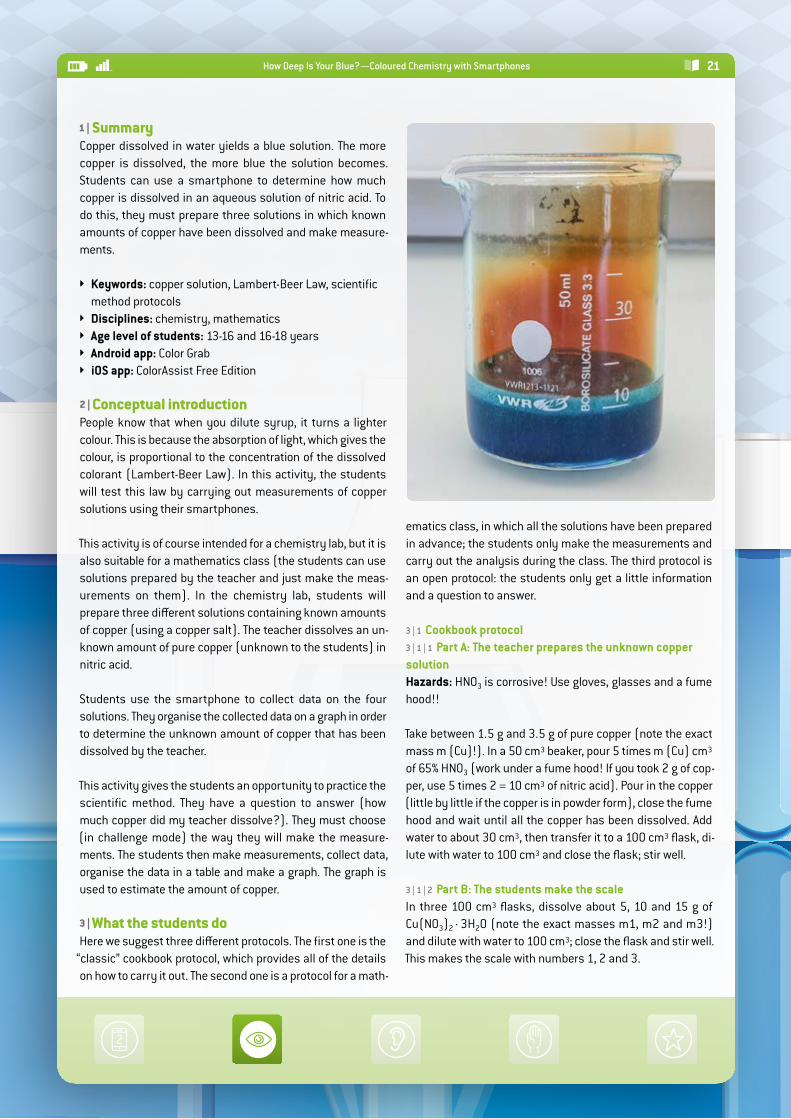
1 | SummaryCopper dissolved in water yields a blue solution. The more copper is dissolved, the more blue the solution becomes. Students can use a smartphone to determine how much copper is dissolved in an aqueous solution of nitric acid. To do this, they must prepare three solutions in which known amounts of copper have been dissolved and make measure-ments.
Î Keywords: copper solution, Lambert-Beer Law, scientific method protocols
Î Disciplines: chemistry, mathematics Î Age level of students: 13-16 and 16-18 years Î Android app: Color Grab Î iOS app: ColorAssist Free Edition
2 | Conceptual introduction People know that when you dilute syrup, it turns a lighter colour. This is because the absorption of light, which gives the colour, is proportional to the concentration of the dissolved colorant (Lambert-Beer Law). In this activity, the students will test this law by carrying out measurements of copper solutions using their smartphones.
This activity is of course intended for a chemistry lab, but it is also suitable for a mathematics class (the students can use solutions prepared by the teacher and just make the meas-urements on them). In the chemistry lab, students will prepare three different solutions containing known amounts of copper (using a copper salt). The teacher dissolves an un-known amount of pure copper (unknown to the students) in nitric acid.
Students use the smartphone to collect data on the four solutions. They organise the collected data on a graph in order to determine the unknown amount of copper that has been dissolved by the teacher.
This activity gives the students an opportunity to practice the scientific method. They have a question to answer (how much copper did my teacher dissolve?). They must choose (in challenge mode) the way they will make the measure-ments. The students then make measurements, collect data, organise the data in a table and make a graph. The graph is used to estimate the amount of copper.
3 | What the students doHere we suggest three different protocols. The first one is the
“classic” cookbook protocol, which provides all of the details on how to carry it out. The second one is a protocol for a math-
ematics class, in which all the solutions have been prepared in advance; the students only make the measurements and carry out the analysis during the class. The third protocol is an open protocol: the students only get a little information and a question to answer.
3 | 1 Cookbook protocol3 | 1 | 1 Part A: The teacher prepares the unknown copper solutionHazards: HNO3 is corrosive! Use gloves, glasses and a fume hood!!
Take between 1.5 g and 3.5 g of pure copper (note the exact mass m (Cu)!). In a 50 cm3 beaker, pour 5 times m (Cu) cm3 of 65% HNO3 (work under a fume hood! If you took 2 g of cop-per, use 5 times 2 = 10 cm3 of nitric acid). Pour in the copper (little by little if the copper is in powder form), close the fume hood and wait until all the copper has been dissolved. Add water to about 30 cm3, then transfer it to a 100 cm3 flask, di-lute with water to 100 cm3 and close the flask; stir well.
3 | 1 | 2 Part B: The students make the scaleIn three 100 cm3 flasks, dissolve about 5, 10 and 15 g of Cu(NO3)2∙3H2O (note the exact masses m1, m2 and m3!) and dilute with water to 100 cm3; close the flask and stir well. This makes the scale with numbers 1, 2 and 3.
How Deep Is Your Blue?—Coloured Chemistry with Smartphones22
You can also replace Cu(NO3)2·3H2O with CuSO4·5H2O (do not change the quantities) or with anhydrous CuSO4 (use about 3.3 g, 6.6 g and 10 g in this case).
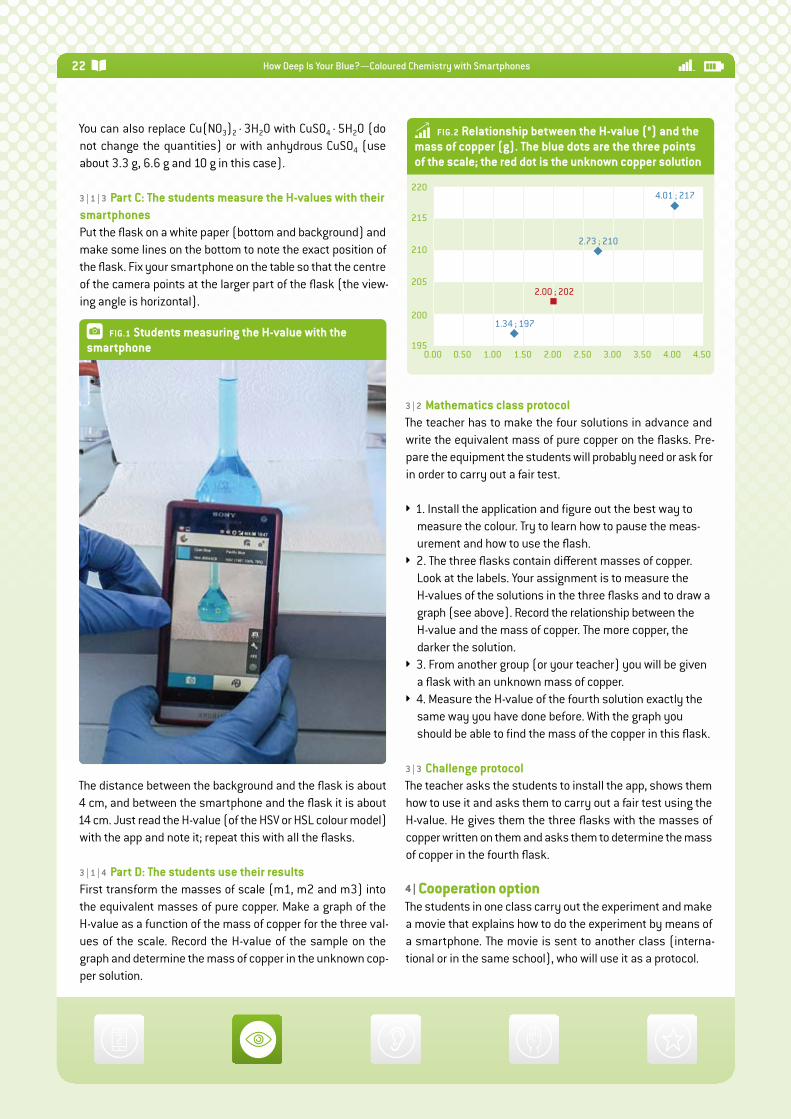
3 | 1 | 3 Part C: The students measure the H-values with their smartphonesPut the flask on a white paper (bottom and background) and make some lines on the bottom to note the exact position of the flask. Fix your smartphone on the table so that the centre of the camera points at the larger part of the flask (the view-ing angle is horizontal).
The distance between the background and the flask is about 4 cm, and between the smartphone and the flask it is about 14 cm. Just read the H-value (of the HSV or HSL colour model) with the app and note it; repeat this with all the flasks.
3 | 1 | 4 Part D: The students use their resultsFirst transform the masses of scale (m1, m2 and m3) into the equivalent masses of pure copper. Make a graph of the H-value as a function of the mass of copper for the three val-ues of the scale. Record the H-value of the sample on the graph and determine the mass of copper in the unknown cop-per solution.
3 | 2 Mathematics class protocolThe teacher has to make the four solutions in advance and write the equivalent mass of pure copper on the flasks. Pre-pare the equipment the students will probably need or ask for in order to carry out a fair test.
Î 1. Install the application and figure out the best way to measure the colour. Try to learn how to pause the meas-urement and how to use the flash.
Î 2. The three flasks contain different masses of copper. Look at the labels. Your assignment is to measure the H-values of the solutions in the three flasks and to draw a graph (see above). Record the relationship between the H-value and the mass of copper. The more copper, the darker the solution.
Î 3. From another group (or your teacher) you will be given a flask with an unknown mass of copper.
Î 4. Measure the H-value of the fourth solution exactly the same way you have done before. With the graph you should be able to find the mass of the copper in this flask.
3 | 3 Challenge protocolThe teacher asks the students to install the app, shows them how to use it and asks them to carry out a fair test using the H-value. He gives them the three flasks with the masses of copper written on them and asks them to determine the mass of copper in the fourth flask.
4 | Cooperation optionThe students in one class carry out the experiment and make a movie that explains how to do the experiment by means of a smartphone. The movie is sent to another class (interna-tional or in the same school), who will use it as a protocol.
nj FIG.1 Students measuring the H-value with the smartphone 195
0.00 0.50 1.00 4.504.003.503.002.502.001.50
200
205
210
215
220
1.34 ; 197
2.73 ; 210
4.01 ; 217
2.00 ; 202
FIG.2 Relationship between the H-value (°) and the mass of copper (g). The blue dots are the three points of the scale; the red dot is the unknown copper solution
How Deep Is Your Blue?—Coloured Chemistry with Smartphones 23
5 | ConclusionIn this experiment, students will learn:
Î that the higher the concentration of copper ions, the more blue the solution.
Î how to follow a precise protocol and how to identify an unknown solution using their own scale.
Î how to use a smartphone colour identification app.
Students face several difficulties in this experiment. In particu-lar, when they use the app the viewing angle should be per-fectly horizontal in order to yield reproducible measurements.
All of the measurements (scale and sample) should be done simultaneously in order to avoid different lighting conditions.
5 | 1 FeedbackStudents:
Î “Different from other labs.” Î “Mix of chemistry and technology. WOW!” Î “The protocol is easy to understand and to follow.” Î “It was interesting to have to use our smartphones in
the chemistry lab.” Î “We loved using our smartphones during the lab.
Combining technology and chemistry was great!”
A teacher’s experience:“Yes, I think it’s a good idea to practise making our own inves-tigations. I try as often as I can to let my students investigate a phenomenon and try to understand it. Instead of a protocol, I give them a question or a problem they should find an
answer to. I call it an open experiment. They should try some-thing out and try to keep as many variables as possible unchanged. A fair test.
In this case I show them the three flasks and tell them that you can measure the colour with a smartphone. This value or code can be used in a shop when you buy paint. Then I ask them to plan the experiment as precisely and fairly as they can! I exaggerate and show them really bad ways of doing it. I also show them how to hold the device in front of the solu-tion, in a light or dark place, and how to keep the way they measure the value as equal and fair as possible.
They install the app and I help them to make it work. I show them how to pause the app and how to get the H-value. Then they plan how to measure and I give them the equipment they ask for—for example, a lamp, a ruler or a white sheet of paper.
Then they measure the three flasks and find out the mass of pure copper from me. If you have older pupils you tell them the mass of CuNO3/CuSO4 and they have to calculate how much pure copper they have. They make a table with the values they have. They receive millimetre graph paper so they can plot the graph. Then they can see how much copper the unknown flask contains by plotting the line connecting the three known values in the graph.
My pupils put a certain amount of copper in a flask without telling me the mass. Then I pour nitric acid into the flask and
How Deep Is Your Blue?—Coloured Chemistry with Smartphones24
dilute the solution to 100 cm3 after the metal has been total-ly dissolved.
Now they can measure the H-value in the fourth flask. From their value I can tell how much copper it contains.”
5 | 2 What does the app do?It measures a colour and expresses its values in terms of a colour model (RGB, HSV, LAB etc.). This can be useful when you want to buy paint of a particular colour; you can measure the colour with your smartphone and ask the paint shop for the same colour.
5 | 3 Why use the HSV or HSL colour model?The RGB system is the most commonly used colour model, but these values are not related to the wavelength of the colour. This system uses only one wavelength of each prima-ry colour. The hue value (H) of the HSV or HSL colour model distinguishes between the different blues (navy blue, deep sky blue, pacific blue etc.). This value can be used instead of absorption in a certain range of concentration (it doesn‘t work if the solution is too dilute or too concentrated).
5 | 4 Can this app be used for other experiments?Although we did not try it, we think the same procedure could be used with other coloured solutions (potassium perman-ganate, food colouring solutions etc.). You just have to identi-fy the range of concentrations for which the H-value is proportional to the concentration of each coloured substance.
We have tried to use it with a well-known colour experiment: red cabbage. Unfortunately, this was not possible, because the different colours of red cabbage do not show any linear variation of the pH in terms of wavelength. Therefore there is no way to model the whole pH range. We also tried to differ-entiate the hues between pH 3 and 10, but the app was not able to do so. The app can therefore only give us the “basic” colour of red cabbage (pink, purple, green, yellow) and we can then deduce a range of possible pH values, but we usual-ly do that by using our eyes. So it makes no sense to use the smartphone for this purpose.
ǖ How to use the app
ǖ How to plot the measurements


![IEEE COMMUNICATIONS SURVEYS & TUTORIALS 41static.tongtianta.site/paper_pdf/8e31c96e-72c3-11e... · smartphones for ill-conceived purposes [500]. Deep learning is being exploited for](https://img.dokumen.tips/doc/110x75/5f8baf600f4ea761cf55530b/ieee-communications-surveys-tutorials-smartphones-for-ill-conceived-purposes.jpg)