Embed Size (px)
Citation preview
Hotspot Analysis with GeoMedia Grid Shaun Falconer
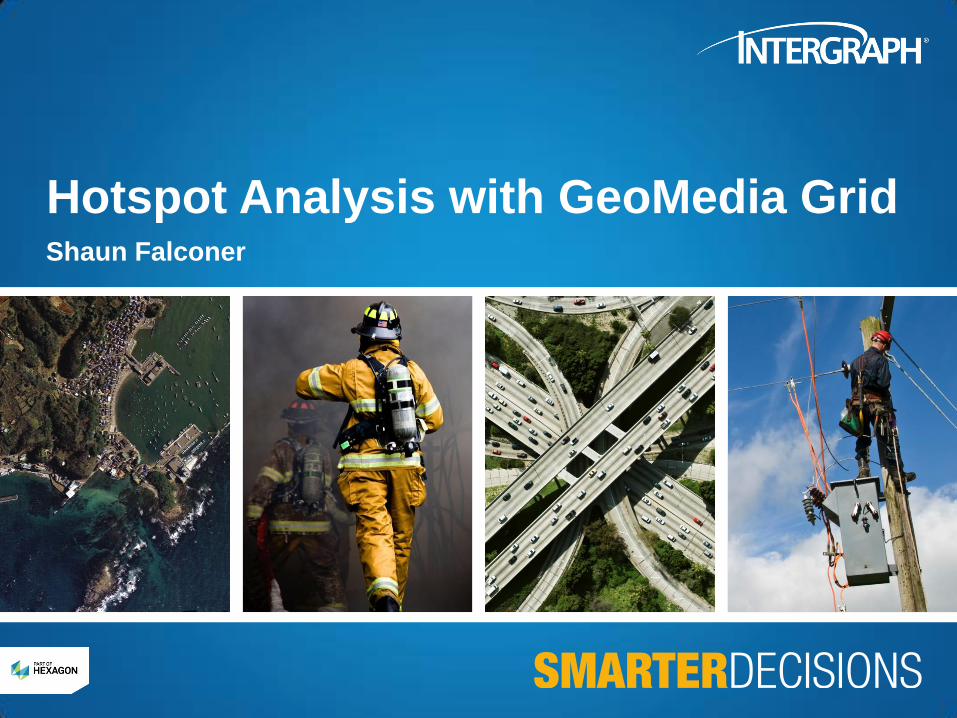
What is hot spot analysis?
• A method of detecting and presenting
patterns in data
• Common approaches
– Point map
– Thematic map
– Density estimation map
Density
Clusters
Patterns
Concentrations
Sparse input
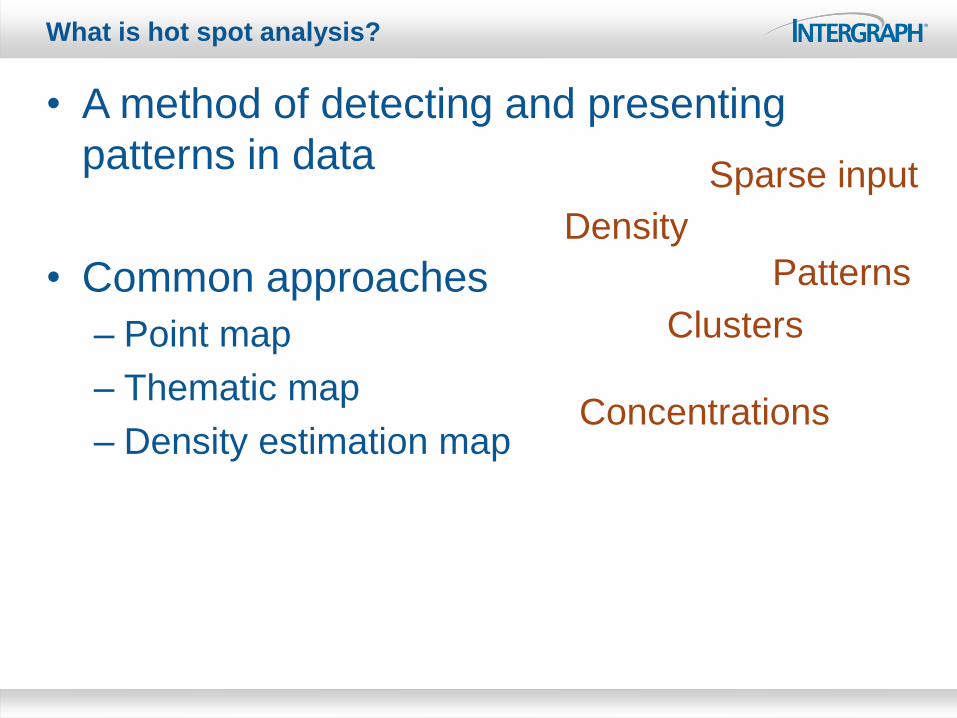
Point Map
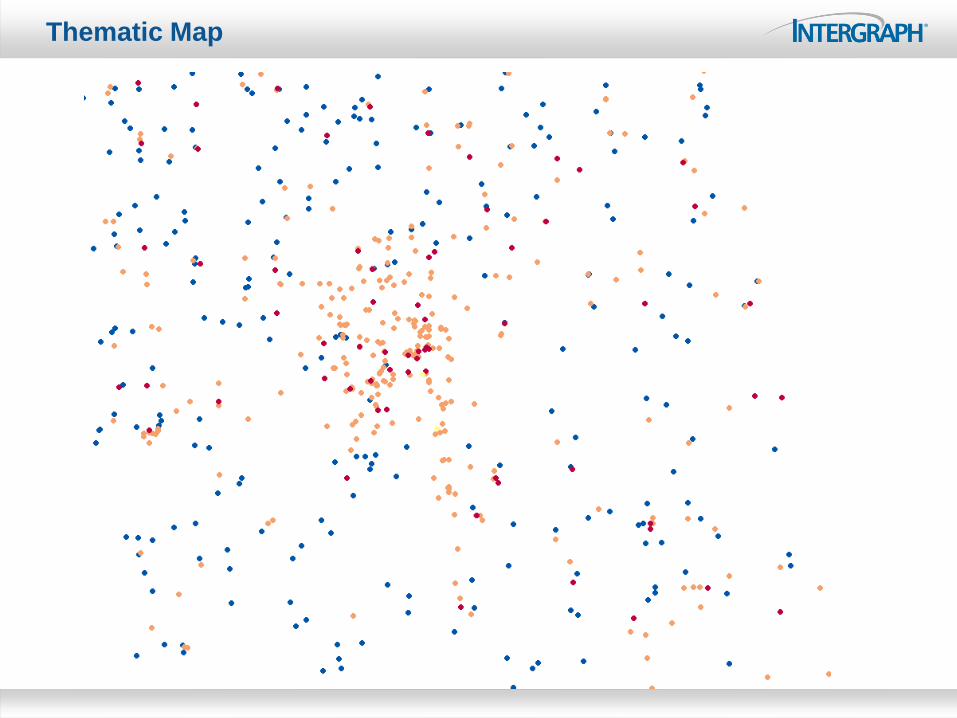
Thematic Map

Hotspots from Density map
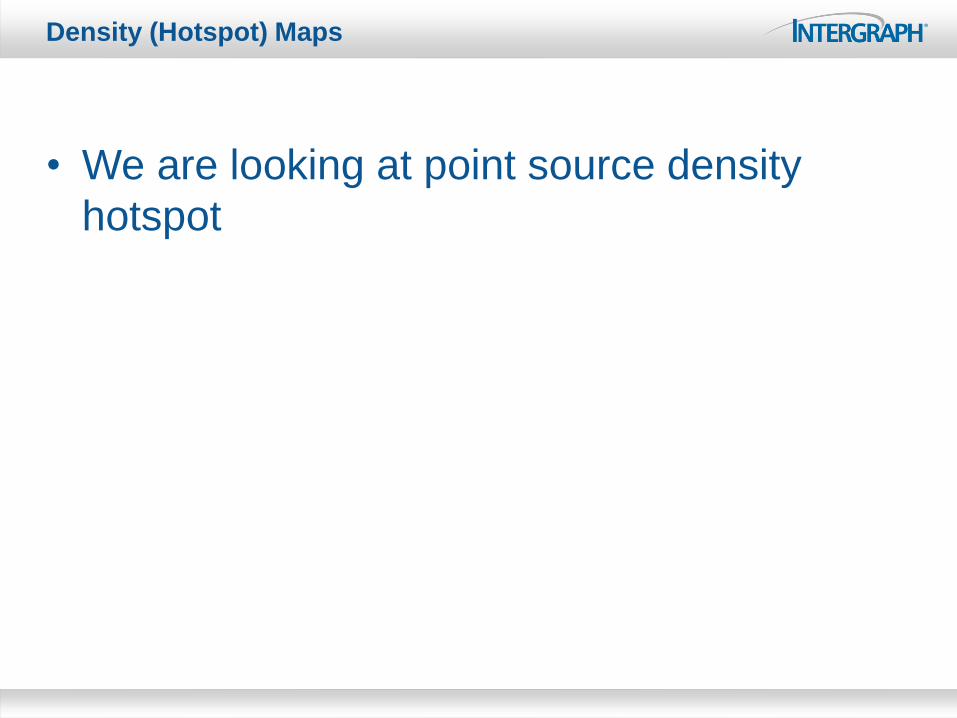
Density (Hotspot) Maps
• We are looking at point source density
hotspot
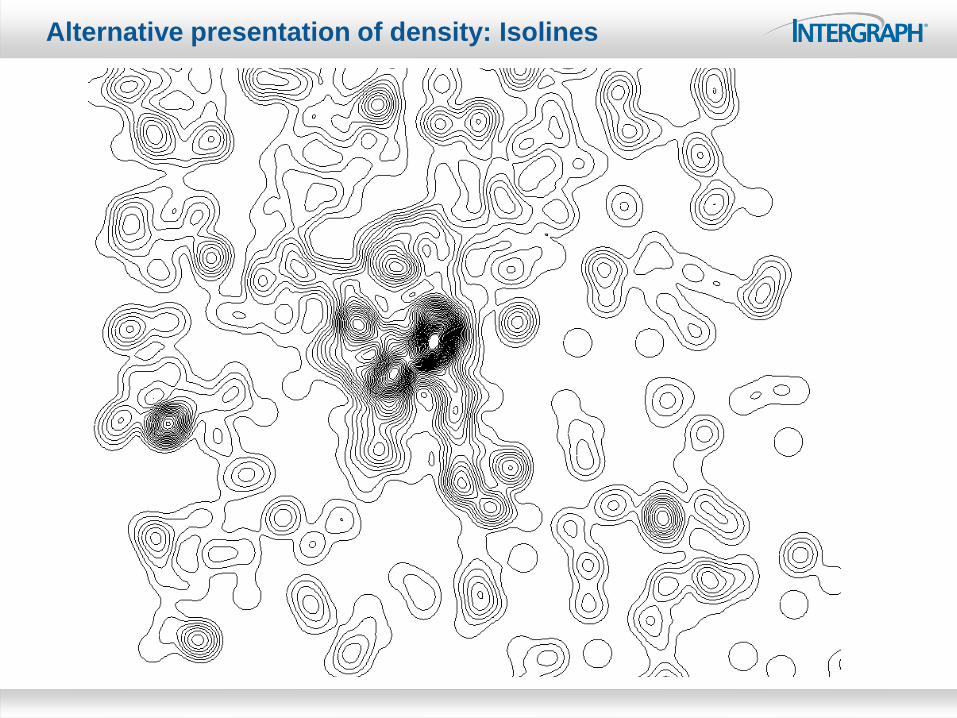
Alternative presentation of density: Isolines
Some examples
• Crime event analysis
• Asset or utility analysis e.g. outage location analysis e.g. repair analysis
• Epidemiological events (pandemic locations)
• Transportation events e.g. accident location analysis
• Earthquake events e.g. hotspot of earthquake by magnitude
• Bore hole samples by Magnesium level
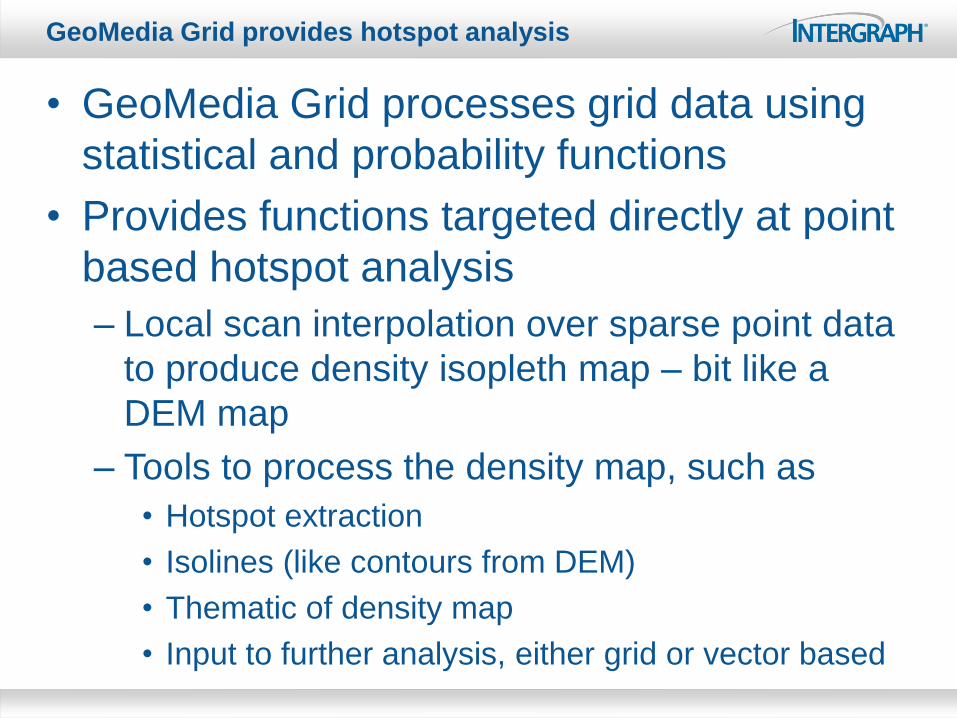
GeoMedia Grid provides hotspot analysis
• GeoMedia Grid processes grid data using
statistical and probability functions
• Provides functions targeted directly at point
based hotspot analysis
– Local scan interpolation over sparse point data
to produce density isopleth map – bit like a
DEM map
– Tools to process the density map, such as
• Hotspot extraction
• Isolines (like contours from DEM)
• Thematic of density map
• Input to further analysis, either grid or vector based
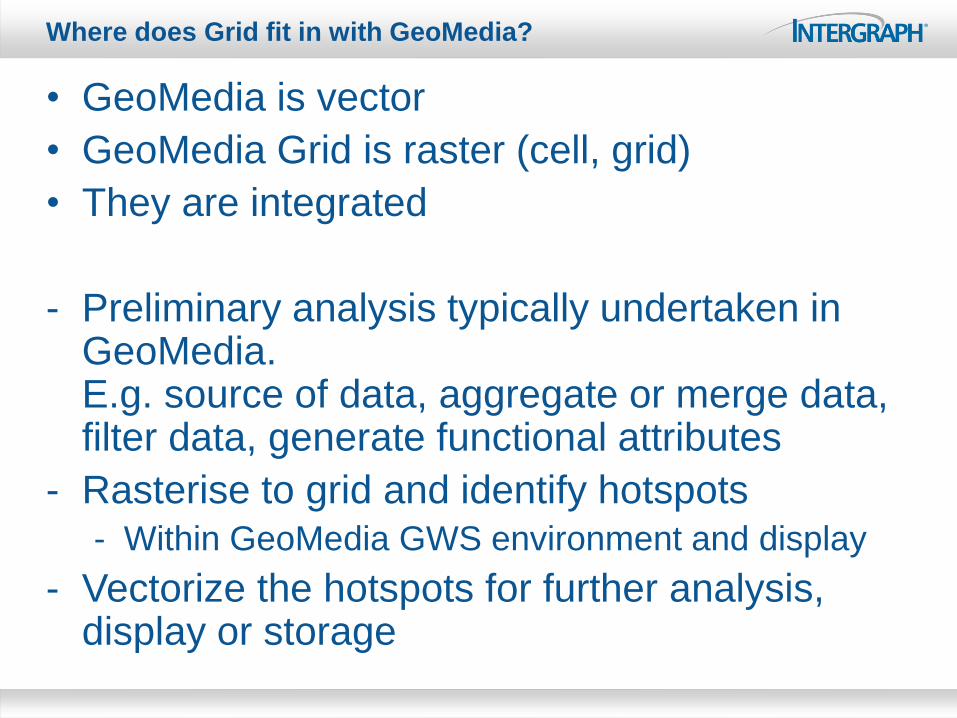
Where does Grid fit in with GeoMedia?
• GeoMedia is vector
• GeoMedia Grid is raster (cell, grid)
• They are integrated
- Preliminary analysis typically undertaken in GeoMedia. E.g. source of data, aggregate or merge data, filter data, generate functional attributes
- Rasterise to grid and identify hotspots
- Within GeoMedia GWS environment and display
- Vectorize the hotspots for further analysis, display or storage

A quick walk through …
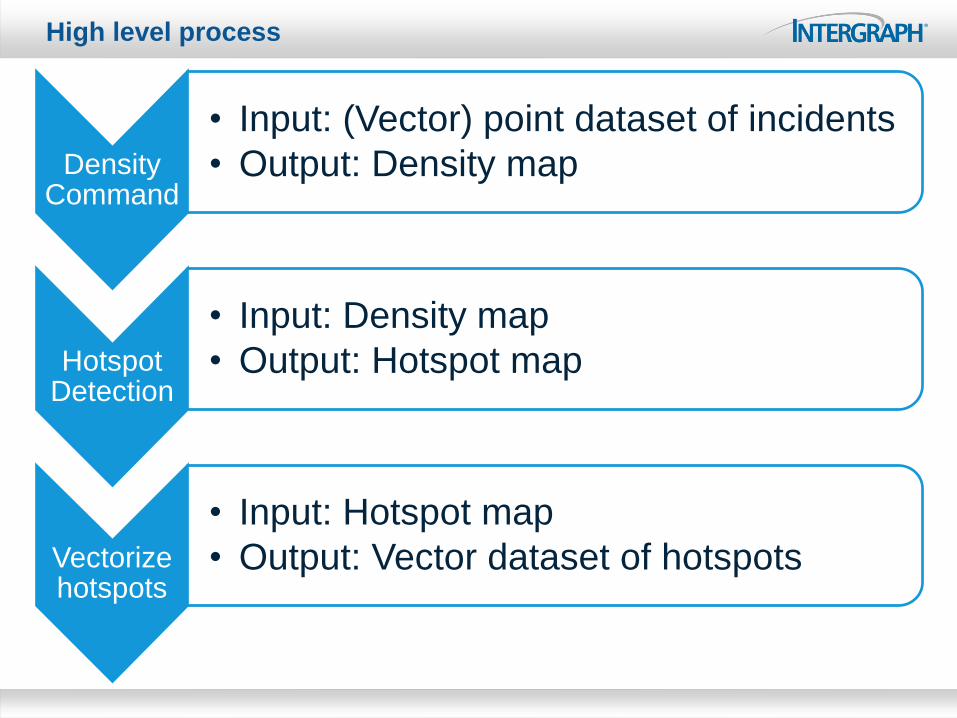
High level process
Density Command
• Input: (Vector) point dataset of incidents
• Output: Density map
Hotspot Detection
• Input: Density map
• Output: Hotspot map
Vectorize hotspots
• Input: Hotspot map
• Output: Vector dataset of hotspots
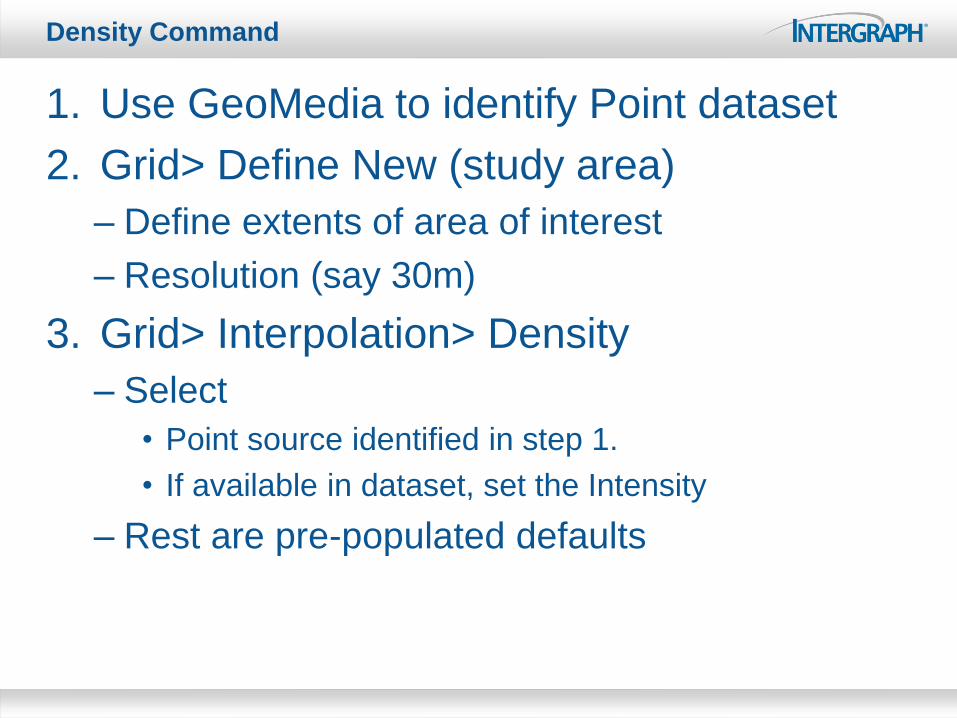
Density Command
1. Use GeoMedia to identify Point dataset
2. Grid> Define New (study area)
– Define extents of area of interest
– Resolution (say 30m)
3. Grid> Interpolation> Density
– Select
• Point source identified in step 1.
• If available in dataset, set the Intensity
– Rest are pre-populated defaults
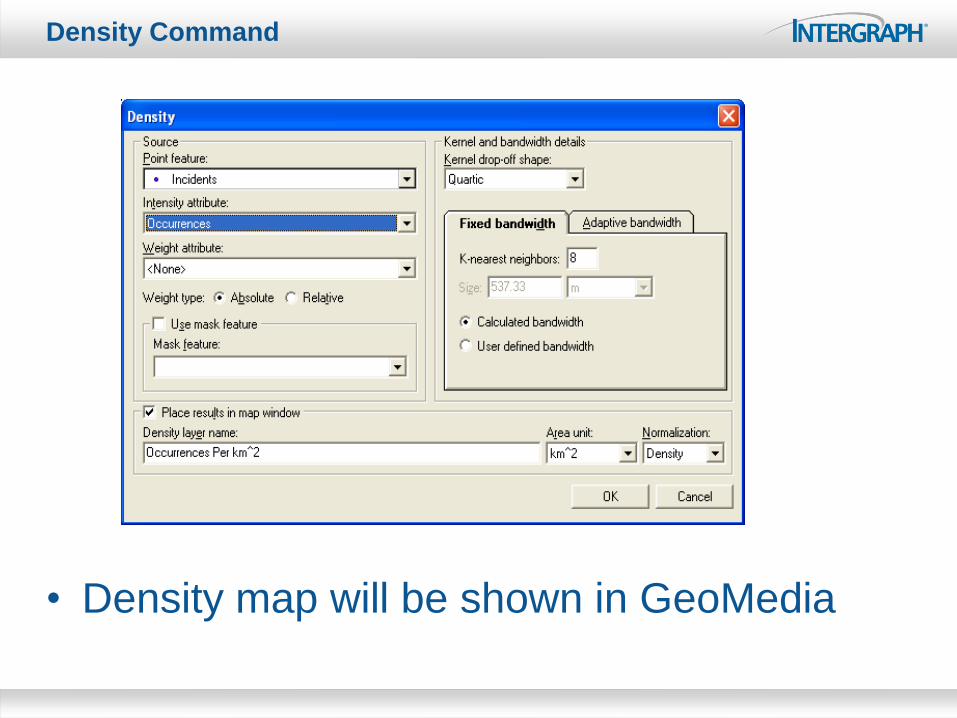
Density Command
• Density map will be shown in GeoMedia
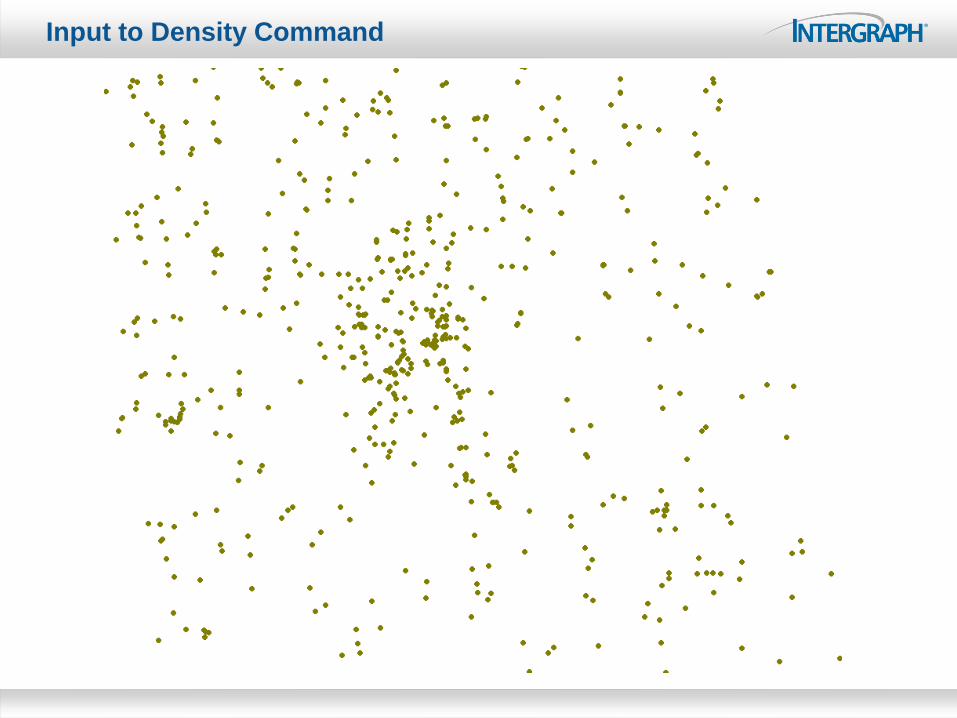
Input to Density Command
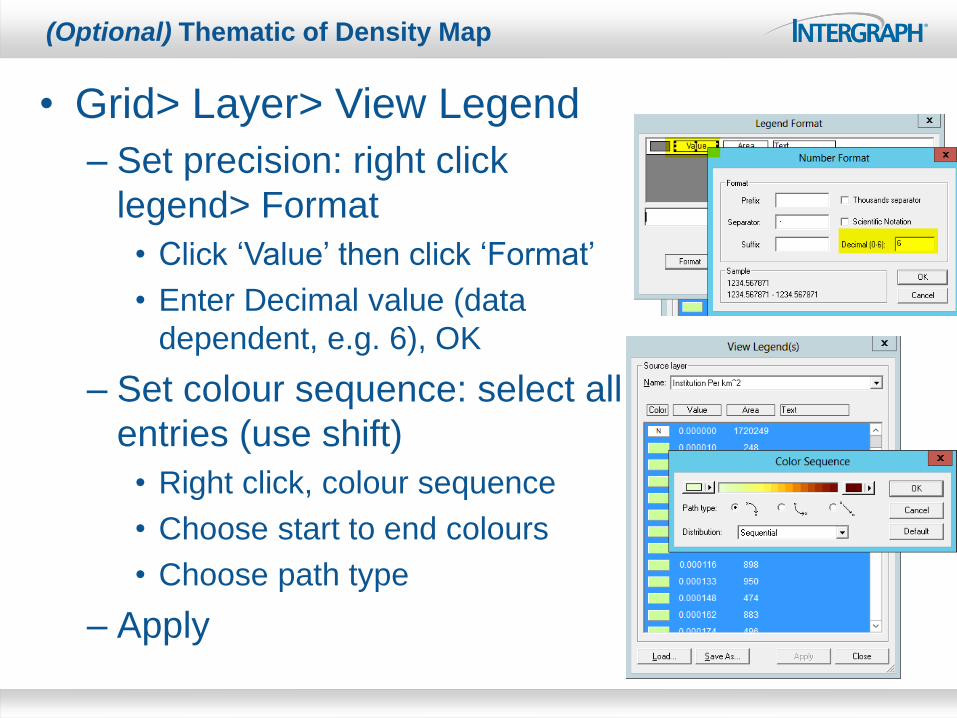
(Optional) Thematic of Density Map
• Grid> Layer> View Legend
– Set precision: right click
legend> Format
• Click ‘Value’ then click ‘Format’
• Enter Decimal value (data
dependent, e.g. 6), OK
– Set colour sequence: select all
entries (use shift)
• Right click, colour sequence
• Choose start to end colours
• Choose path type
– Apply
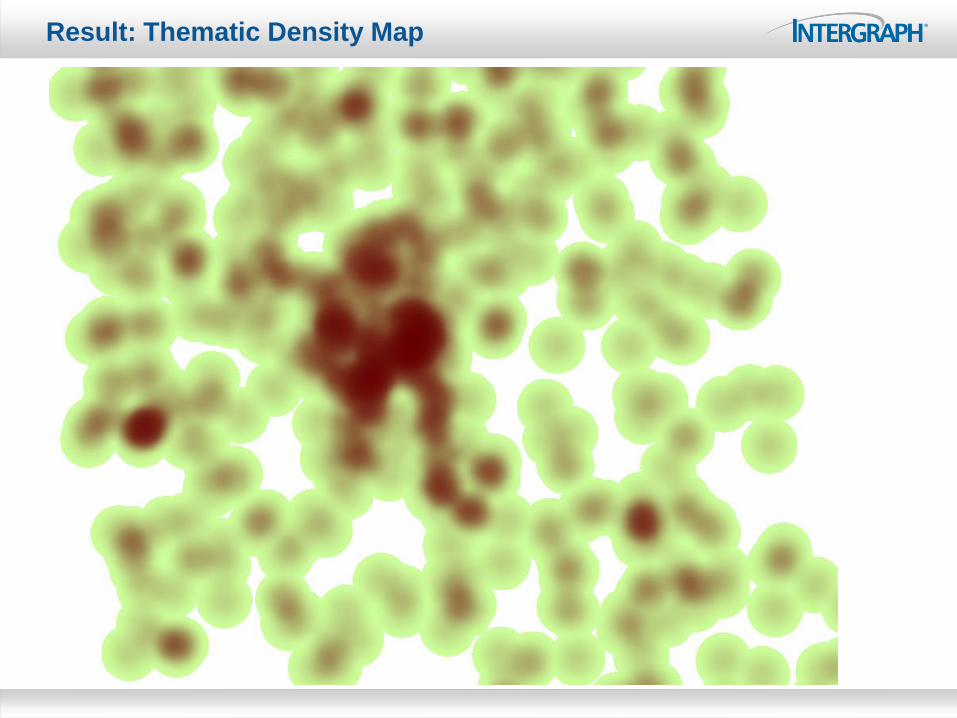
Result: Thematic Density Map
Hotspot Detection
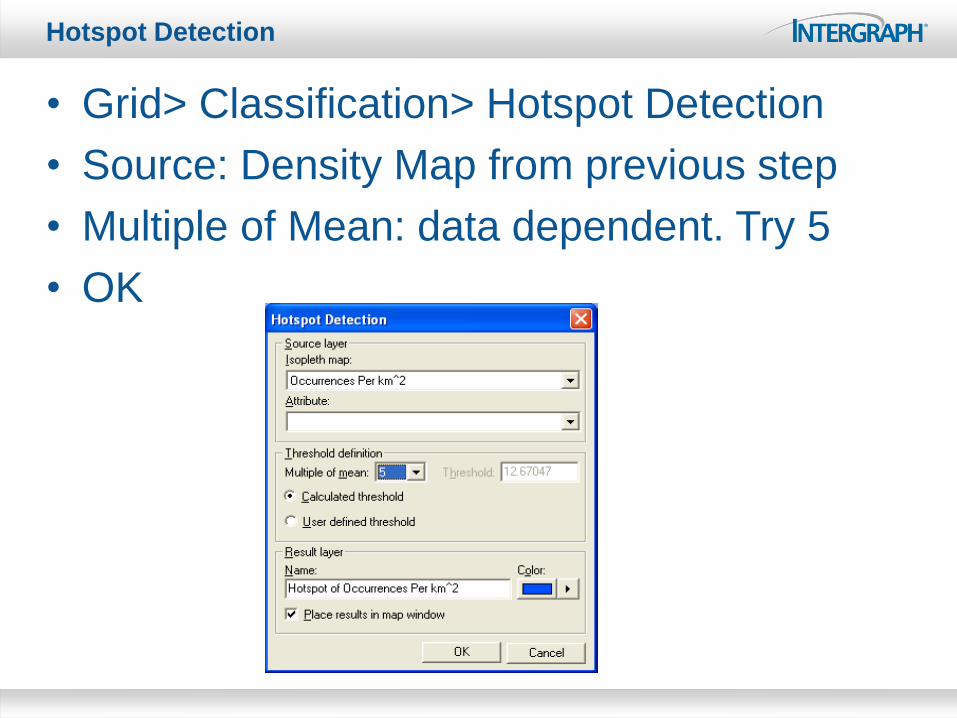
• Grid> Classification> Hotspot Detection
• Source: Density Map from previous step
• Multiple of Mean: data dependent. Try 5
• OK
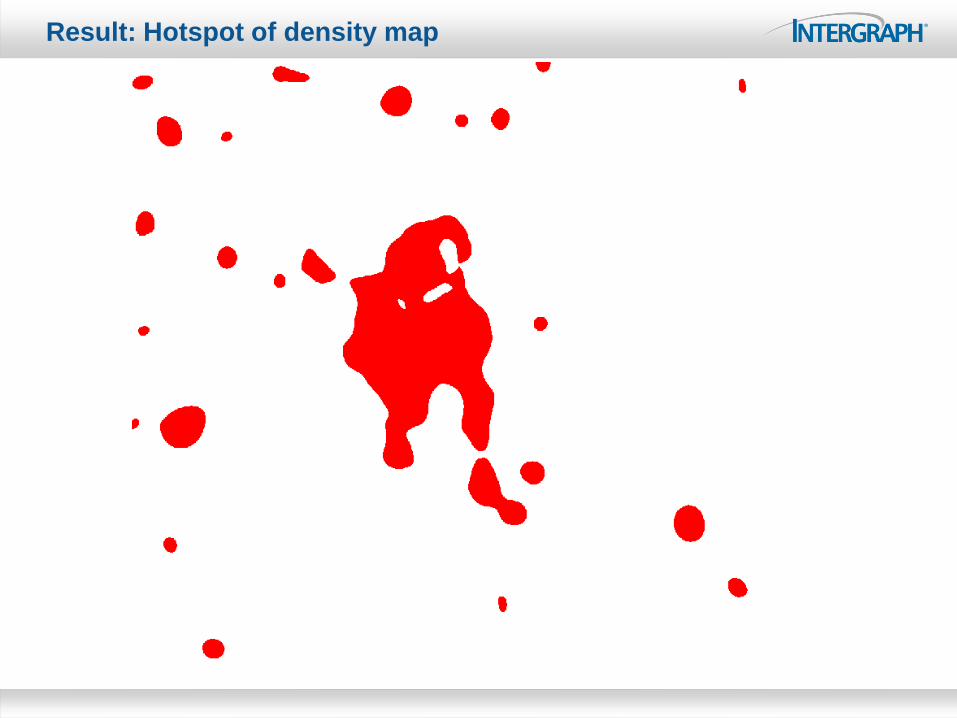
Result: Hotspot of density map
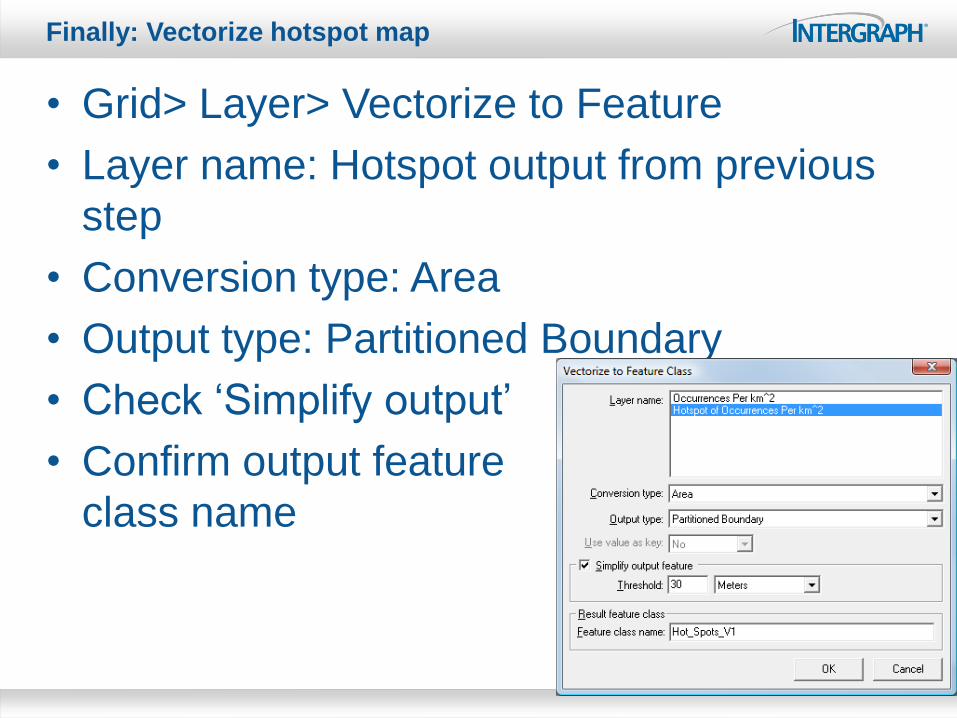
Finally: Vectorize hotspot map
• Grid> Layer> Vectorize to Feature
• Layer name: Hotspot output from previous
step
• Conversion type: Area
• Output type: Partitioned Boundary
• Check ‘Simplify output’
• Confirm output feature
class name
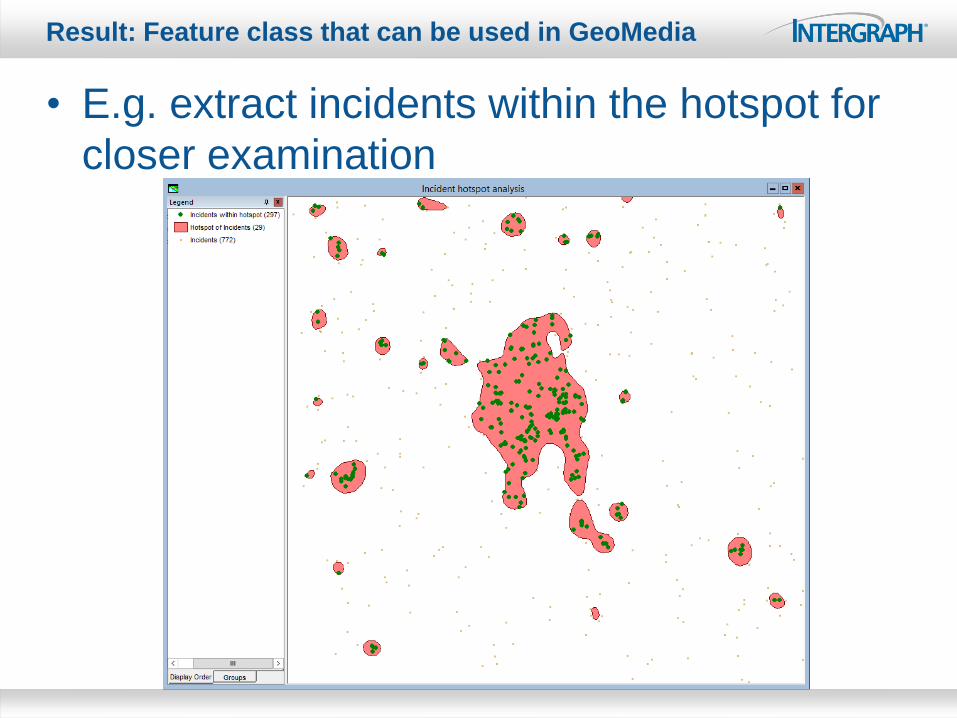
Result: Feature class that can be used in GeoMedia
• E.g. extract incidents within the hotspot for
closer examination

Some theory …
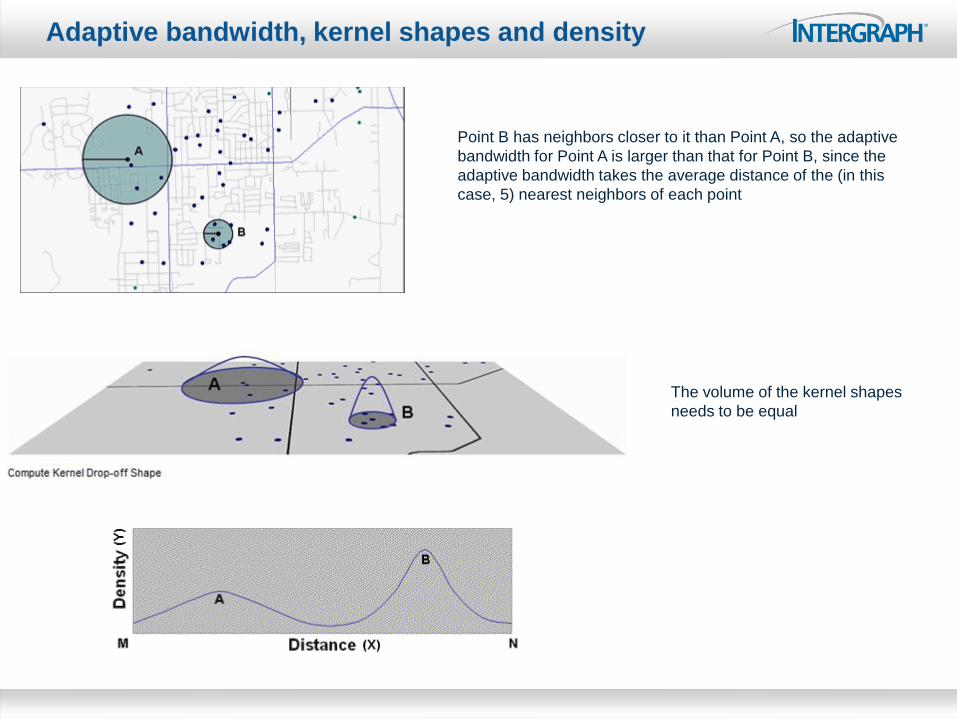
Adaptive bandwidth, kernel shapes and density
The volume of the kernel shapes
needs to be equal
Point B has neighbors closer to it than Point A, so the adaptive
bandwidth for Point A is larger than that for Point B, since the
adaptive bandwidth takes the average distance of the (in this
case, 5) nearest neighbors of each point
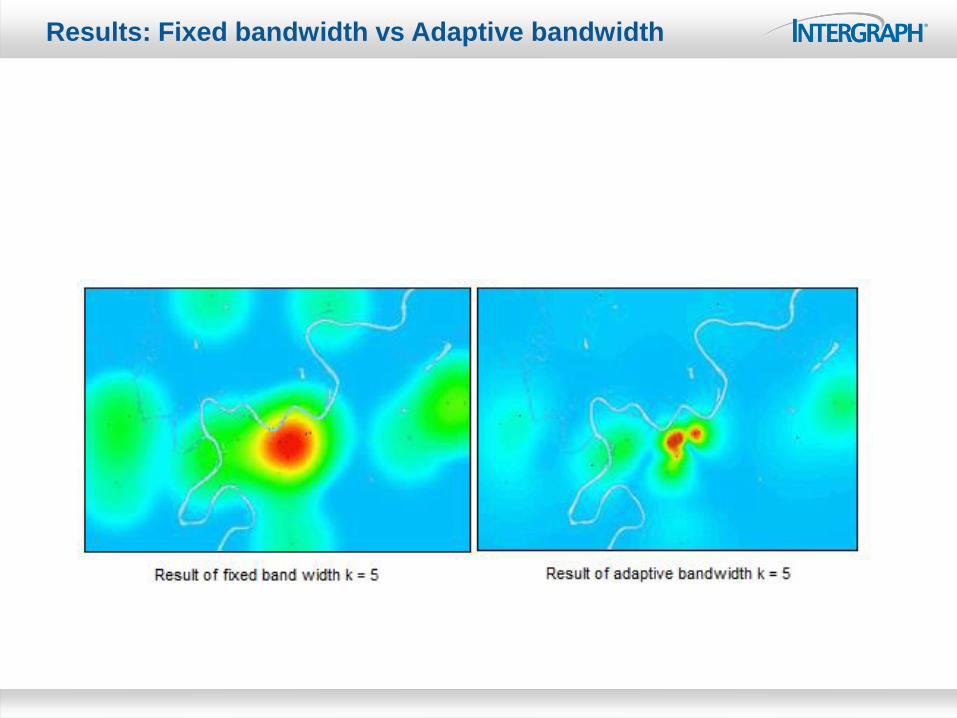
Results: Fixed bandwidth vs Adaptive bandwidth
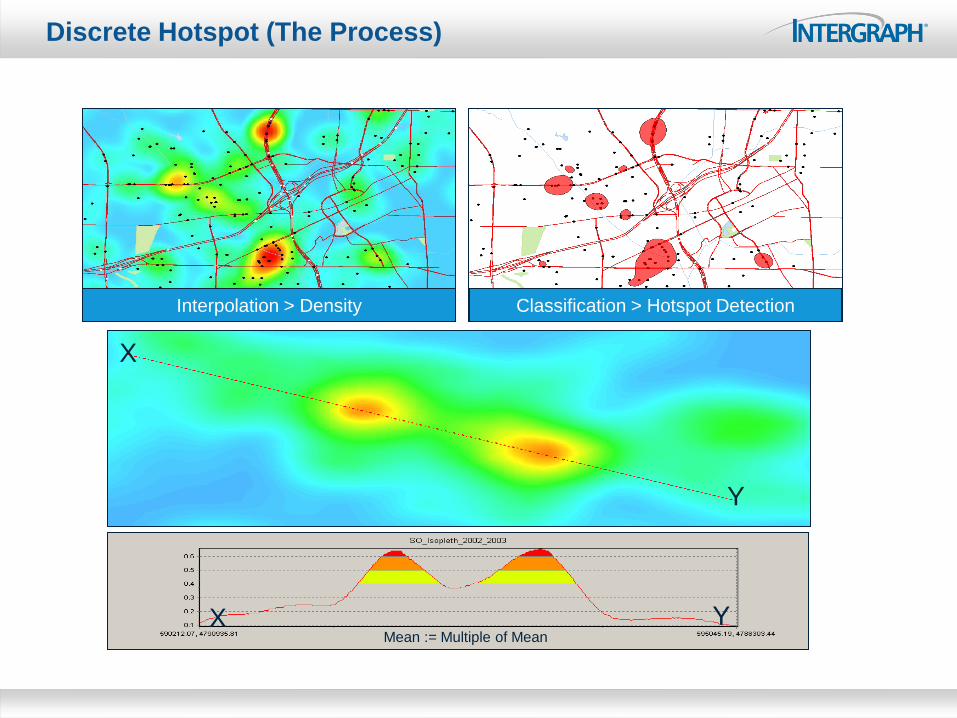
Discrete Hotspot (The Process)
Mean := Multiple of Mean
Classification > Hotspot Detection Interpolation > Density
X
Y
Y X
Where does GeoMedia Incident Analyst fit in?
• GeoMedia Incident Analyst is an extension
that uses GeoMedia and GeoMedia Grid
principally targeted at crime analysis
workflows, that incorporates hotspot
analysis in the workflow.
3D hotspot maps
• Thematic 3D maps further augments understanding of spatial phenomena
• GeoMedia Grid with GeoMedia 3D can be used to create 3D hotspot maps
• 3D thematic maps allow map readers to understand relationships within seemingly unconnected/unrelated data
• Webinar was held on 10 September – look for recording shortly at http://geospatial.intergraph.com/Resources/webinars/ArchivedWebinars.aspx

Questions?