Embed Size (px)
Citation preview
Honey, Routinization Shrunk My Wage!
Native-Immigrant Wage Gaps and the Growing Importance of Social Skills
Tao Song†
October 9, 2017
Abstract
The gap between native and immigrant wages in the U.S. has increased significantly since the
1980s. While part of this may be attributable to declines in the relative quality of immigrant labor,
this paper explores whether the growing importance of social skills also played a role. Using
historical routine employment share to measure cities’ likely technology adoption and its process
of replacing routine labor, I show that local labor markets that specialized in routine tasks
experienced differential increases in native-immigrant wage gaps. This is consistent with the
hypothesis that native workers have a comparative advantage in U.S.-specific social skills, and the
returns to these skills have increased as a result of technology replacing routine labor. Results do
not seem to be driven by selective migration between cities but are strongly related to immigrants’
English language abilities as well as other measures of their social assimilation.
JEL Codes: J150, J240, J310, J610, J710, O330, R230 Key words: immigration, wage gap, routinization, job polarization, social skills, technology change
† Tao Song: Department of Economics, Sewanee: The University of the South, 735 University Avenue, Sewanee, TN, 37383 email: [email protected]. Phone: 1-860-771-3700. Website: www.taosong.me
1
1. Introduction
Throughout U.S. history, the native-born have earned higher wages than the foreign-born
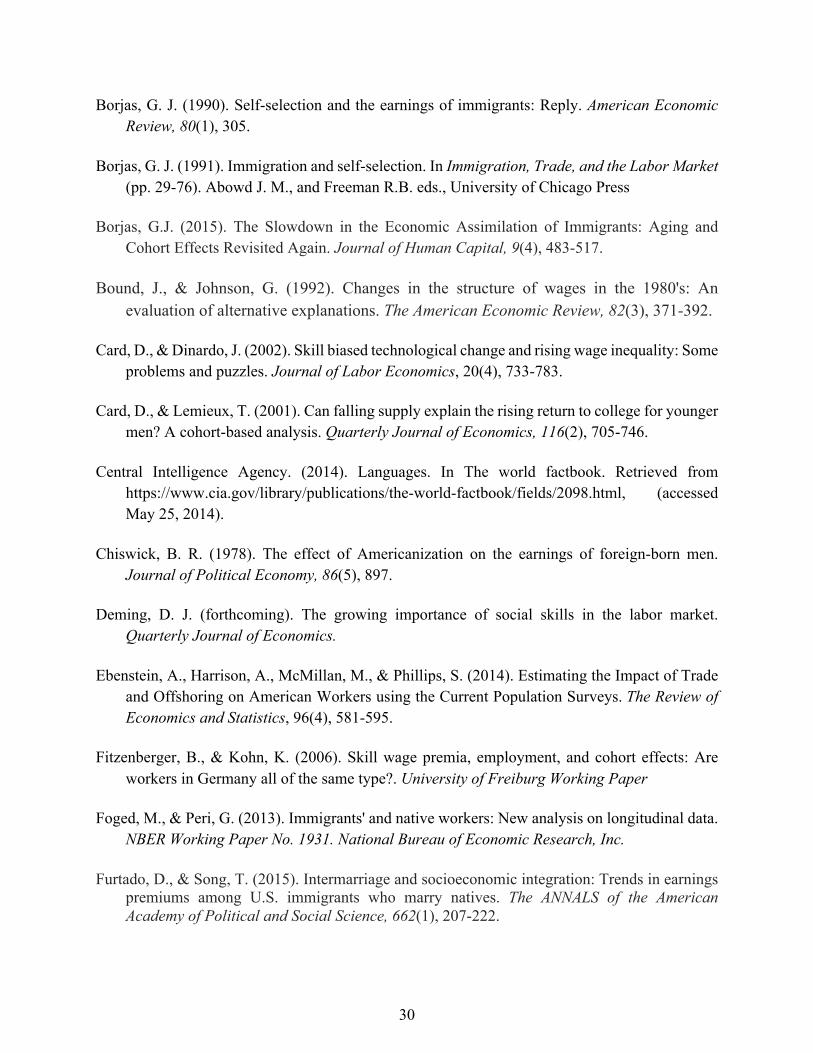
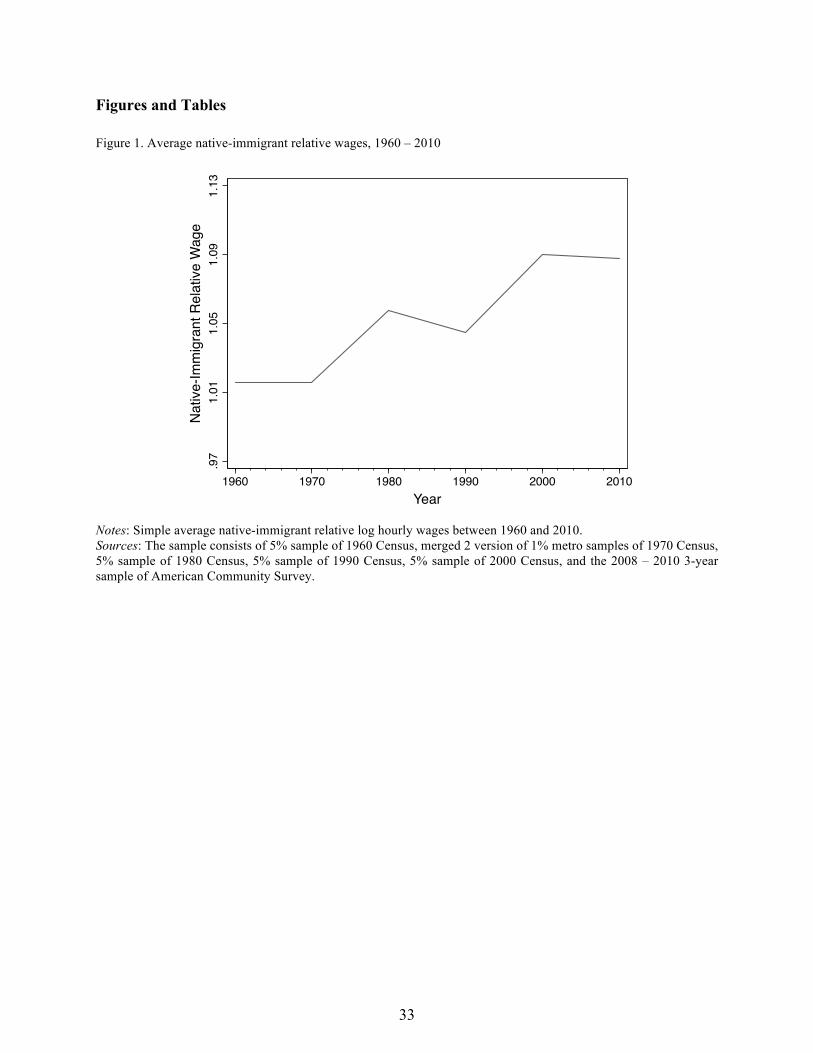
(Chiswick, 1978; Alba and Nee, 2003), but these wage gaps have been increasing significantly
since the 1980s (Figure 1). While a simple explanation is that the more recent cohorts of
immigrants have worse human capital characteristics than earlier cohorts, an alternative is that
market circumstances have changed in a way that disproportionately rewards skills in which
natives have a comparative advantage. This would increase wage gaps between natives and
immigrants even if the recent cohorts of immigrants had the same human capital characteristics as
the earlier cohorts. This paper formally tests the hypothesis that the growing returns to U.S.-
specific social skills is an important factor driving the increase in native-immigrant wage gaps.
There is evidence that the more recent cohorts of immigrants have worse language skills
and lower education levels when compared to natives, and in a series of papers (Borjas, 1990;
1991; 2015), Borjas suggests that these changing characteristics might explain the slower rates of
assimilation of the more recent cohorts. In this paper, I start by showing that the part of the wage
gap that cannot be fully explained by differences in observable characteristics between natives and
immigrants also increased since the 1980s. I then use cross-city variation in historical routine task
shares to explore whether native-immigrant wage gaps increased more in cities that were more
likely to have undergone a more extensive process of technology replacing routine labor, i.e. the
routinization process.
A growing body of work documents that the labor market increasingly rewards social
skills, and a vast literature suggests that this phenomenon is likely to be a product of routinization
2
caused by skill biased technological change.1 The canonical model of skill biased technological
change developed by Acemoğlu and Autor (2011) categorizes labor input by tasks and argues that
the diffusion of technology greatly reduces the cost of accomplishing routine, codifiable job tasks.
The skills and tasks that cannot be substituted away by automation, such as those relying on social-
interaction and abilities to read and react to others based on tacit knowledge, are instead
complemented by it. As a result, the U.S. labor market has seen growing demand for social skills
relative to routine physical skills (Acemoğlu and Autor, 2011; Autor and Dorn, 2013; Autor et al.,
2015; Deming, forthcoming). Similar empirical evidence can also be found in UK (Card and
Lemieux, 2001), Germany (Fitzenberger and Kohn, 2006), and other OCED countries (Atkinson,
2008).
A separate literature investigating immigrants’ labor market success highlights the
importance of host-country-specific social skills. Simple economic theory states that successful
transactions occur when buyers and sellers can mutually agree on a price for a good or service that
leaves both parties better off, and the process of arrival at such agreement depends critically on
the ability of parties to efficiently communicate with one another (Lazear, 1999). While a common
language is an obvious prerequisite for effective communication, other types of cultural differences
might forestall mutually beneficial transactions (Vigdor, 2015). For example, a Chinese seller
accustomed to a culture where price haggling is the norm might set the price of goods higher than
the “true” price. In response, buyers in the U.S. might walk away from a viable transaction after
seeing the high list price. Empirically, immigrants who have higher English proficiency are found
to be better substitutes for native workers in the U.S. (Lewis, 2013) and earn higher wages than
1 See the following seminal works for a comprehensive survey of the increasing returns to education and social skills: Katz and Murphy, 1992; Bound and Johnson, 1992; Autor et al., 1998; Autor et al., 2003; Acemoğlu and Autor, 2011; and Deming, forthcoming.
3
immigrants with worse English language skills (Bleakley and Chin, 2004). Using marriage to a
native as a measure of social assimilation, Furtado and Song (2015) show that the returns to social
assimilation have increased over the past three decades even when holding constant English
language fluency. Consistent with the idea that immigrants have a comparative advantage in
manual-physical labor-intensive occupations and natives have a comparative advantage in social-
cognitive occupations, several researchers have shown that natives increasingly pursue jobs more
intensive in communication and language tasks in response to immigrant inflows (Peri and
Sparber, 2009; Foged and Peri, 2013).
This paper contributes to both of these literatures by linking the changes in native-
immigrant wage gaps with the routinization process of local labor markets. I argue that native-
born workers in the U.S. are relatively better endowed with U.S.-specific social skills because of
the language and culture advantages they have over immigrants. Therefore, routinization, which
increases the relative price of such skills, is a likely additional factor explaining the growth of
native-immigrant wage gaps.
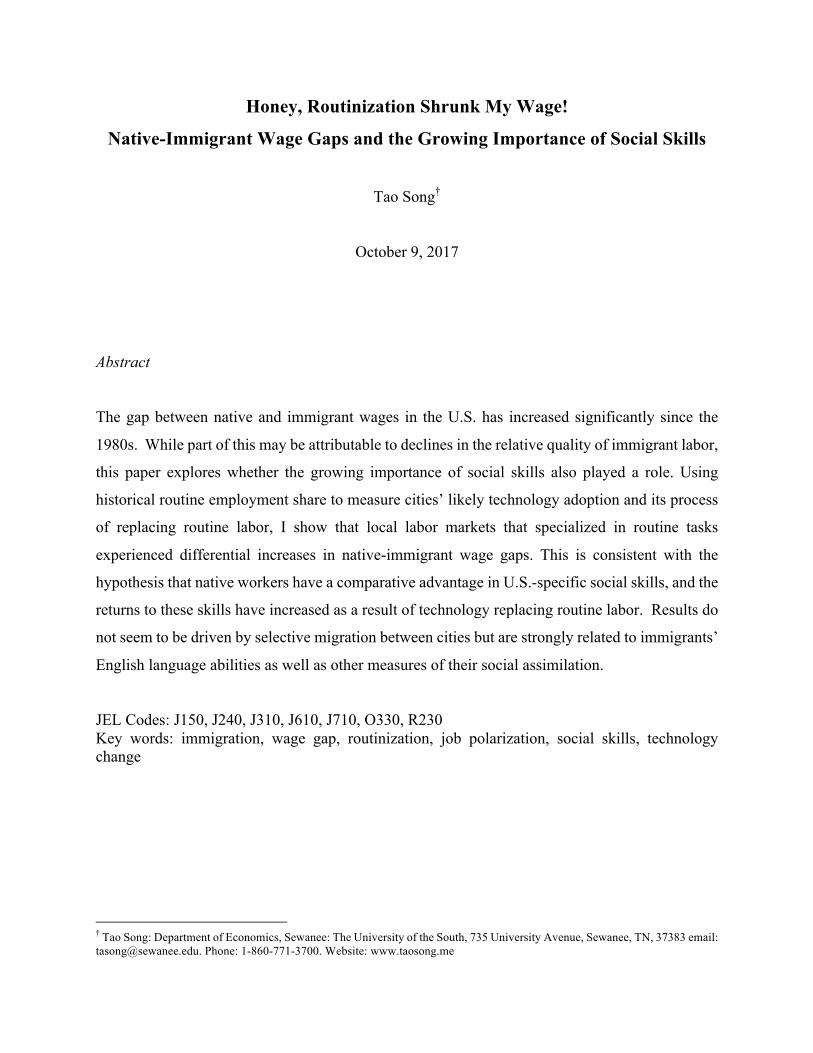
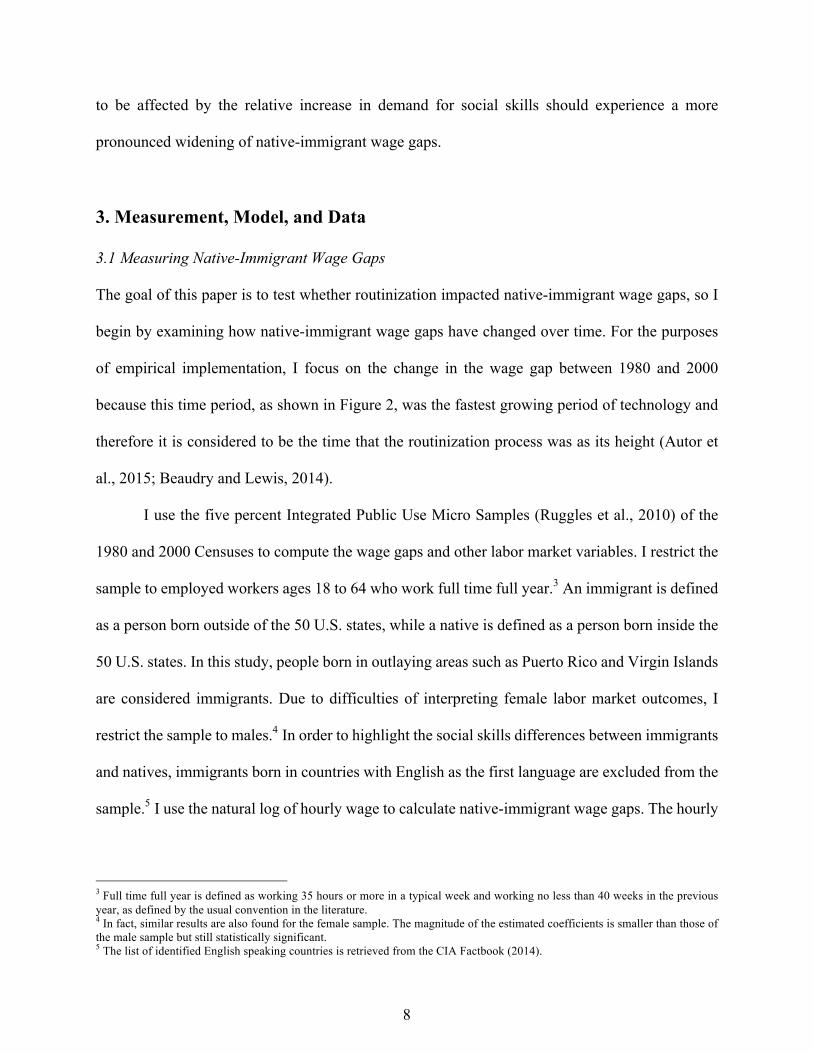
Figures 1 and 2 show that the native-immigrant wage gap movement matches closely with
the recent technological development in the United States. During the 1960s and the 1970s, both
the average native-immigrant relative wages and output in IT industries were relatively stable.
Starting in 1980, both increased significantly and continued to grow in the next two decades until
leveling off in the early 2000s. These patterns may be suggestive of a potential link between
routinization induced by technological change and native-immigrant wage gaps, but to provide a
clearer causal analysis, I examine whether U.S. cities that were likely to have been most strongly
affected by the routinization process between 1980 and 2000 also had the largest increases in
native-immigrant wage gaps.
4
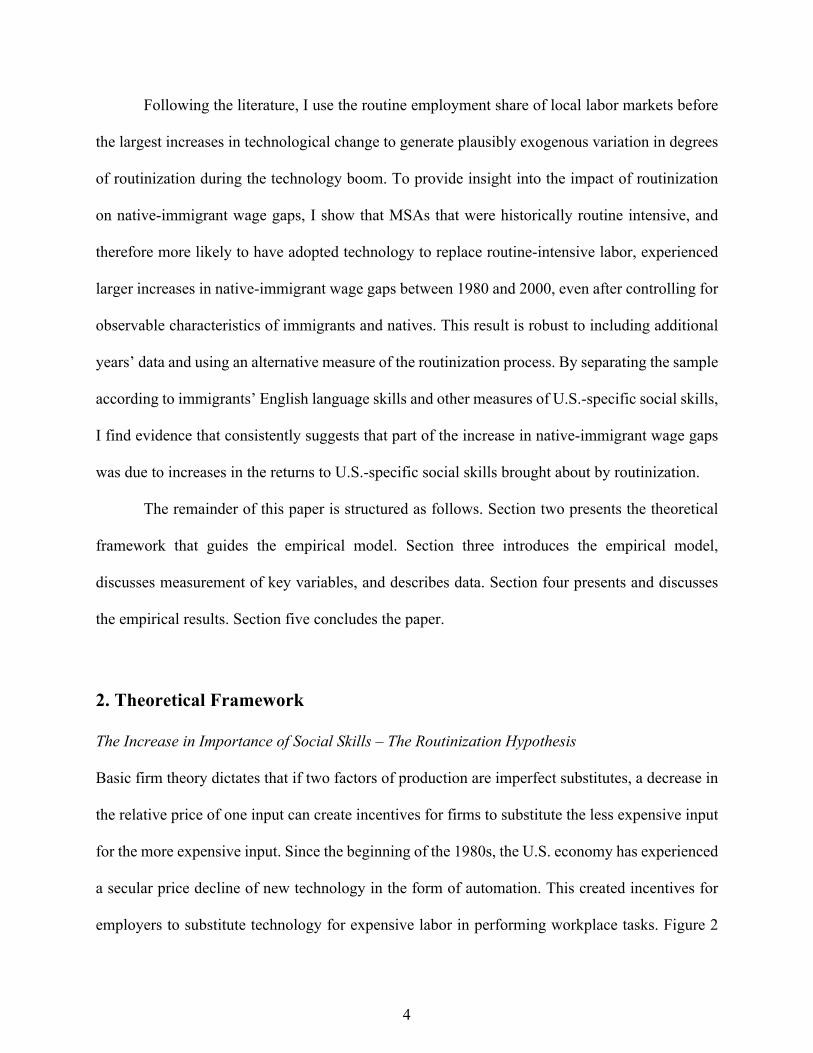
Following the literature, I use the routine employment share of local labor markets before
the largest increases in technological change to generate plausibly exogenous variation in degrees
of routinization during the technology boom. To provide insight into the impact of routinization
on native-immigrant wage gaps, I show that MSAs that were historically routine intensive, and
therefore more likely to have adopted technology to replace routine-intensive labor, experienced
larger increases in native-immigrant wage gaps between 1980 and 2000, even after controlling for
observable characteristics of immigrants and natives. This result is robust to including additional
years’ data and using an alternative measure of the routinization process. By separating the sample
according to immigrants’ English language skills and other measures of U.S.-specific social skills,
I find evidence that consistently suggests that part of the increase in native-immigrant wage gaps
was due to increases in the returns to U.S.-specific social skills brought about by routinization.
The remainder of this paper is structured as follows. Section two presents the theoretical
framework that guides the empirical model. Section three introduces the empirical model,
discusses measurement of key variables, and describes data. Section four presents and discusses
the empirical results. Section five concludes the paper.
2. Theoretical Framework
The Increase in Importance of Social Skills – The Routinization Hypothesis
Basic firm theory dictates that if two factors of production are imperfect substitutes, a decrease in
the relative price of one input can create incentives for firms to substitute the less expensive input
for the more expensive input. Since the beginning of the 1980s, the U.S. economy has experienced
a secular price decline of new technology in the form of automation. This created incentives for
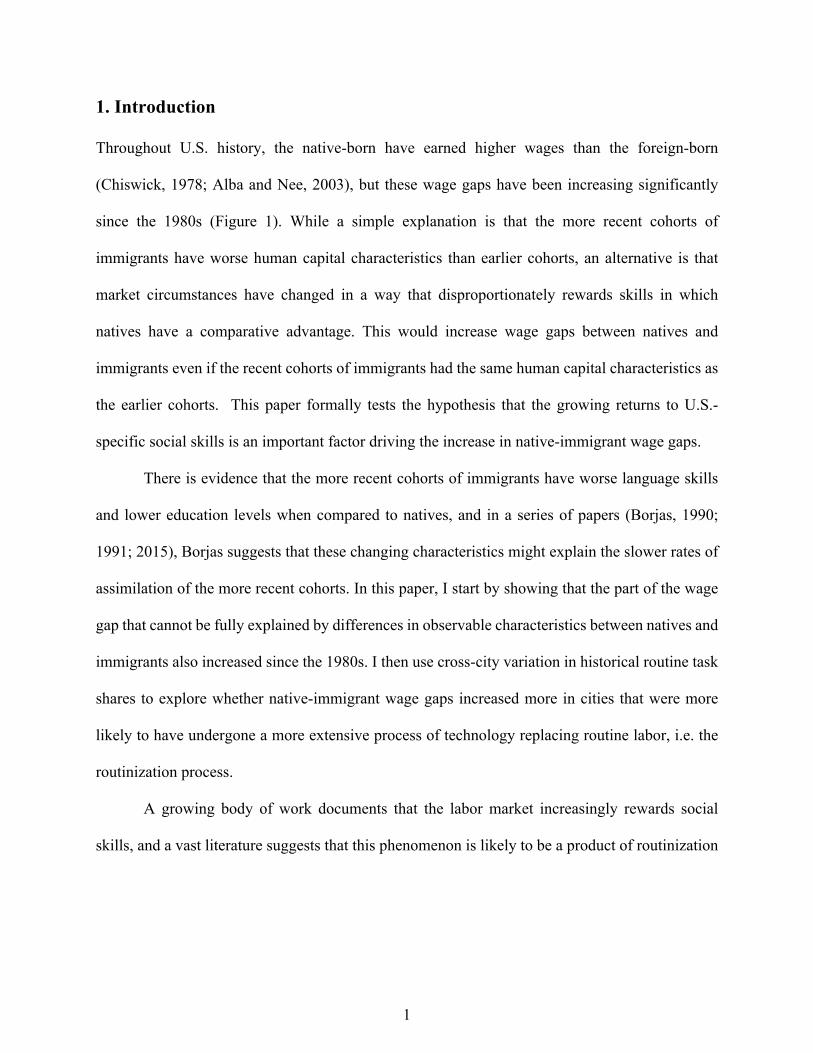
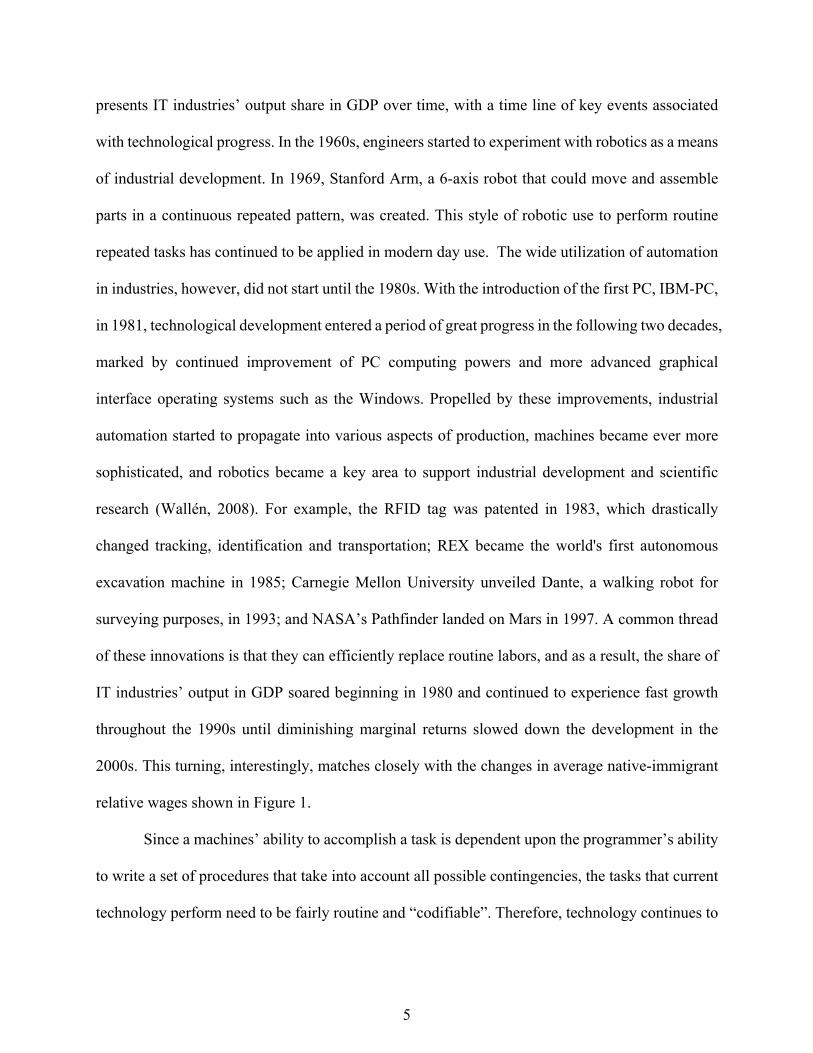
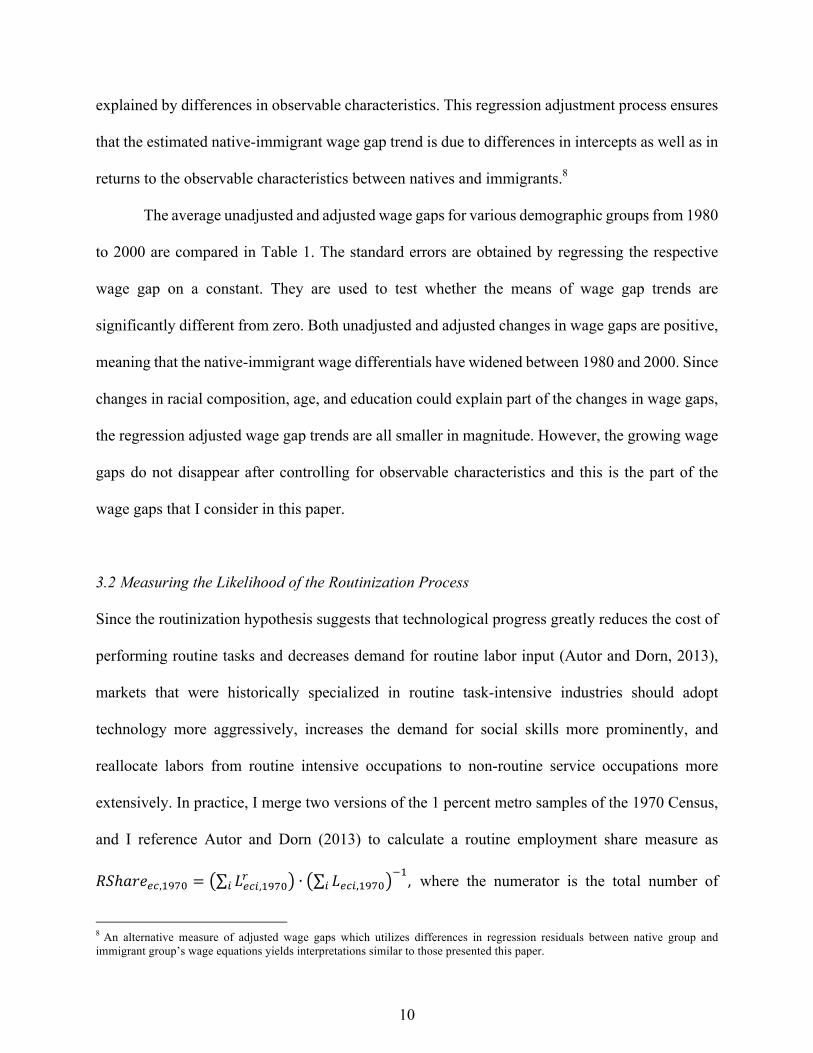
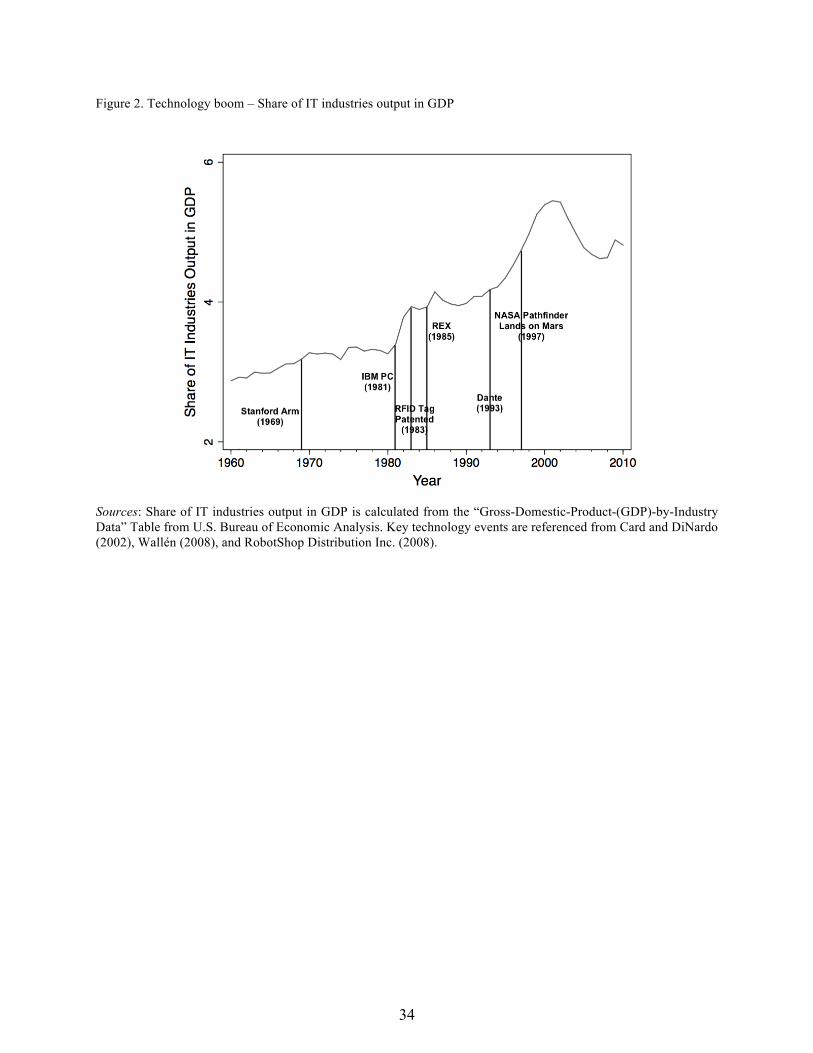
employers to substitute technology for expensive labor in performing workplace tasks. Figure 2
5
presents IT industries’ output share in GDP over time, with a time line of key events associated
with technological progress. In the 1960s, engineers started to experiment with robotics as a means
of industrial development. In 1969, Stanford Arm, a 6-axis robot that could move and assemble
parts in a continuous repeated pattern, was created. This style of robotic use to perform routine
repeated tasks has continued to be applied in modern day use. The wide utilization of automation
in industries, however, did not start until the 1980s. With the introduction of the first PC, IBM-PC,
in 1981, technological development entered a period of great progress in the following two decades,
marked by continued improvement of PC computing powers and more advanced graphical
interface operating systems such as the Windows. Propelled by these improvements, industrial
automation started to propagate into various aspects of production, machines became ever more
sophisticated, and robotics became a key area to support industrial development and scientific
research (Wallén, 2008). For example, the RFID tag was patented in 1983, which drastically
changed tracking, identification and transportation; REX became the world's first autonomous
excavation machine in 1985; Carnegie Mellon University unveiled Dante, a walking robot for
surveying purposes, in 1993; and NASA’s Pathfinder landed on Mars in 1997. A common thread
of these innovations is that they can efficiently replace routine labors, and as a result, the share of
IT industries’ output in GDP soared beginning in 1980 and continued to experience fast growth
throughout the 1990s until diminishing marginal returns slowed down the development in the
2000s. This turning, interestingly, matches closely with the changes in average native-immigrant
relative wages shown in Figure 1.
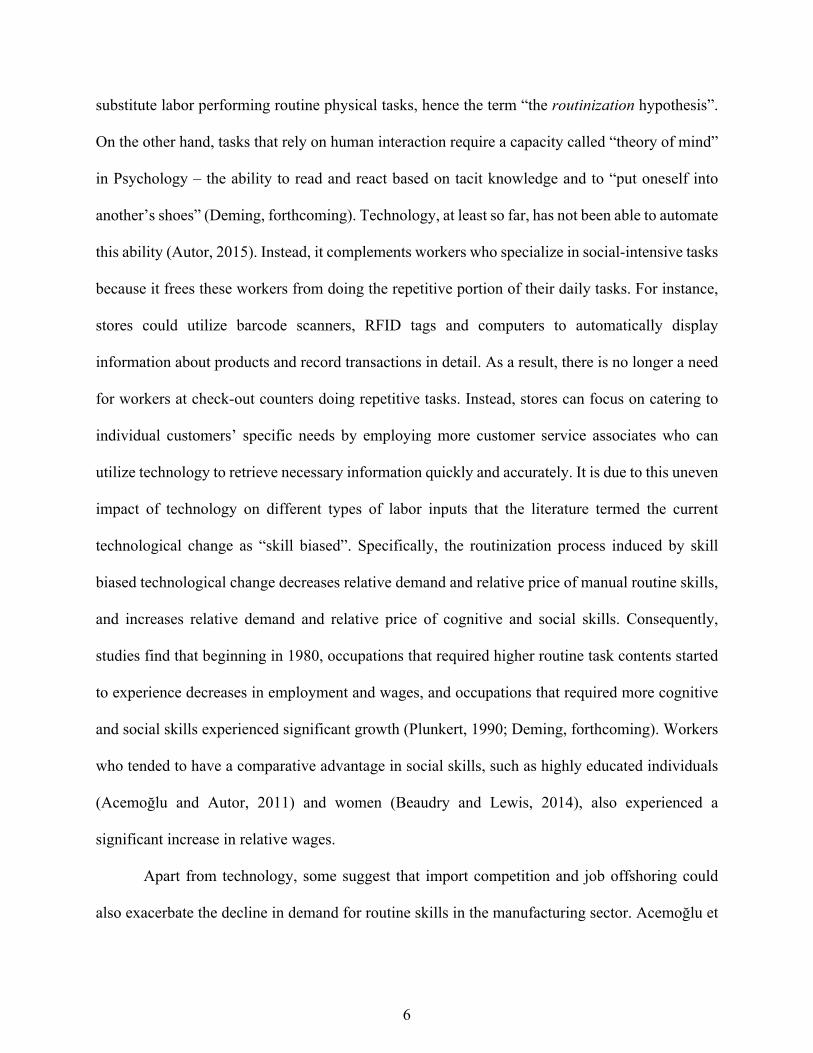
Since a machines’ ability to accomplish a task is dependent upon the programmer’s ability
to write a set of procedures that take into account all possible contingencies, the tasks that current
technology perform need to be fairly routine and “codifiable”. Therefore, technology continues to
6
substitute labor performing routine physical tasks, hence the term “the routinization hypothesis”.
On the other hand, tasks that rely on human interaction require a capacity called “theory of mind”
in Psychology – the ability to read and react based on tacit knowledge and to “put oneself into
another’s shoes” (Deming, forthcoming). Technology, at least so far, has not been able to automate
this ability (Autor, 2015). Instead, it complements workers who specialize in social-intensive tasks
because it frees these workers from doing the repetitive portion of their daily tasks. For instance,
stores could utilize barcode scanners, RFID tags and computers to automatically display
information about products and record transactions in detail. As a result, there is no longer a need
for workers at check-out counters doing repetitive tasks. Instead, stores can focus on catering to
individual customers’ specific needs by employing more customer service associates who can
utilize technology to retrieve necessary information quickly and accurately. It is due to this uneven
impact of technology on different types of labor inputs that the literature termed the current
technological change as “skill biased”. Specifically, the routinization process induced by skill
biased technological change decreases relative demand and relative price of manual routine skills,
and increases relative demand and relative price of cognitive and social skills. Consequently,
studies find that beginning in 1980, occupations that required higher routine task contents started
to experience decreases in employment and wages, and occupations that required more cognitive
and social skills experienced significant growth (Plunkert, 1990; Deming, forthcoming). Workers
who tended to have a comparative advantage in social skills, such as highly educated individuals
(Acemoğlu and Autor, 2011) and women (Beaudry and Lewis, 2014), also experienced a
significant increase in relative wages.
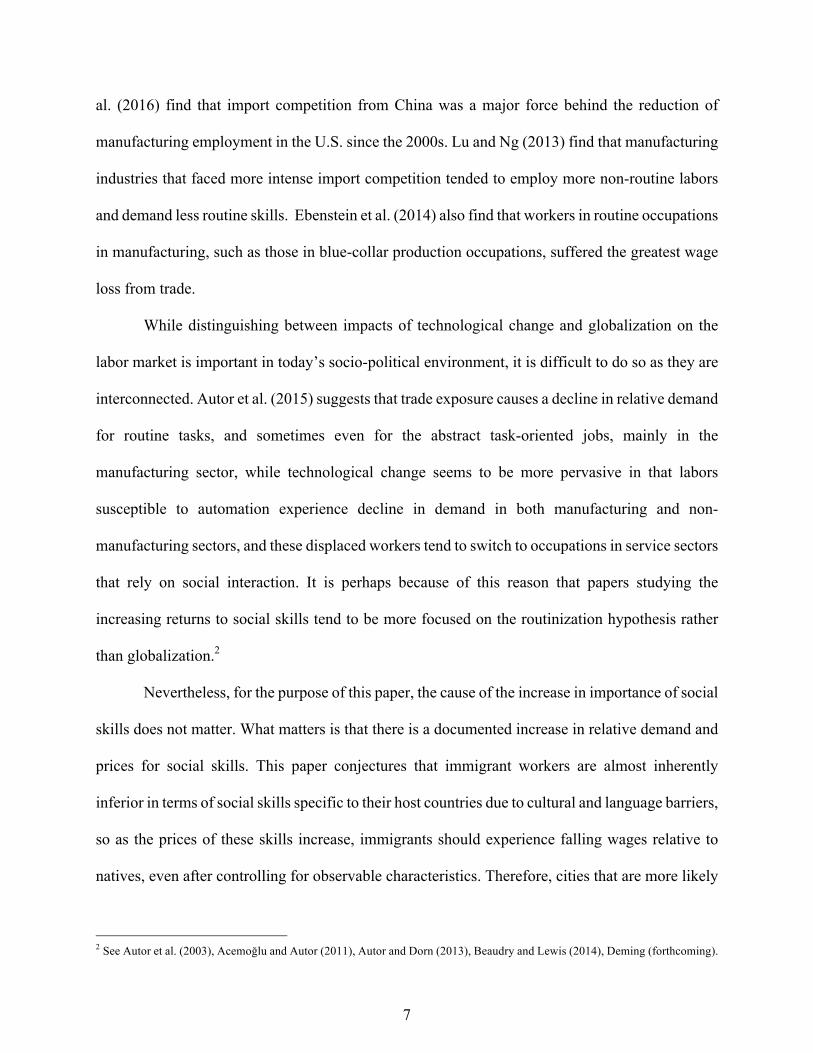
Apart from technology, some suggest that import competition and job offshoring could
also exacerbate the decline in demand for routine skills in the manufacturing sector. Acemoğlu et
7
al. (2016) find that import competition from China was a major force behind the reduction of
manufacturing employment in the U.S. since the 2000s. Lu and Ng (2013) find that manufacturing
industries that faced more intense import competition tended to employ more non-routine labors
and demand less routine skills. Ebenstein et al. (2014) also find that workers in routine occupations
in manufacturing, such as those in blue-collar production occupations, suffered the greatest wage
loss from trade.
While distinguishing between impacts of technological change and globalization on the
labor market is important in today’s socio-political environment, it is difficult to do so as they are
interconnected. Autor et al. (2015) suggests that trade exposure causes a decline in relative demand
for routine tasks, and sometimes even for the abstract task-oriented jobs, mainly in the
manufacturing sector, while technological change seems to be more pervasive in that labors
susceptible to automation experience decline in demand in both manufacturing and non-
manufacturing sectors, and these displaced workers tend to switch to occupations in service sectors
that rely on social interaction. It is perhaps because of this reason that papers studying the
increasing returns to social skills tend to be more focused on the routinization hypothesis rather
than globalization.2
Nevertheless, for the purpose of this paper, the cause of the increase in importance of social
skills does not matter. What matters is that there is a documented increase in relative demand and
prices for social skills. This paper conjectures that immigrant workers are almost inherently
inferior in terms of social skills specific to their host countries due to cultural and language barriers,
so as the prices of these skills increase, immigrants should experience falling wages relative to
natives, even after controlling for observable characteristics. Therefore, cities that are more likely
2 See Autor et al. (2003), Acemoğlu and Autor (2011), Autor and Dorn (2013), Beaudry and Lewis (2014), Deming (forthcoming).
8
to be affected by the relative increase in demand for social skills should experience a more
pronounced widening of native-immigrant wage gaps.
3. Measurement, Model, and Data
3.1 Measuring Native-Immigrant Wage Gaps
The goal of this paper is to test whether routinization impacted native-immigrant wage gaps, so I
begin by examining how native-immigrant wage gaps have changed over time. For the purposes
of empirical implementation, I focus on the change in the wage gap between 1980 and 2000
because this time period, as shown in Figure 2, was the fastest growing period of technology and
therefore it is considered to be the time that the routinization process was as its height (Autor et
al., 2015; Beaudry and Lewis, 2014).
I use the five percent Integrated Public Use Micro Samples (Ruggles et al., 2010) of the
1980 and 2000 Censuses to compute the wage gaps and other labor market variables. I restrict the
sample to employed workers ages 18 to 64 who work full time full year.3 An immigrant is defined
as a person born outside of the 50 U.S. states, while a native is defined as a person born inside the
50 U.S. states. In this study, people born in outlaying areas such as Puerto Rico and Virgin Islands
are considered immigrants. Due to difficulties of interpreting female labor market outcomes, I
restrict the sample to males.4 In order to highlight the social skills differences between immigrants
and natives, immigrants born in countries with English as the first language are excluded from the
sample.5 I use the natural log of hourly wage to calculate native-immigrant wage gaps. The hourly
3 Full time full year is defined as working 35 hours or more in a typical week and working no less than 40 weeks in the previous year, as defined by the usual convention in the literature. 4 In fact, similar results are also found for the female sample. The magnitude of the estimated coefficients is smaller than those of the male sample but still statistically significant. 5 The list of identified English speaking countries is retrieved from the CIA Factbook (2014).

9
wage variable is constructed by dividing annual inflation adjusted wages by total hours worked.
The total working hours variable is calculated by multiplying hours worked in a typical week with
the number of weeks worked in a year. I further restrict the sample to people with hourly wages
between 2 and 200 dollars, measured in 1999 dollars. I use Census-provided person weights
throughout.
Native-immigrant wage gaps are constructed separately for the 118 MSAs that are
consistent across the sample years and for the four education groups - high school dropouts, high
school graduates, those with some college education (but less than four years) and four-year
college graduates.6 Given the changes in immigrant composition in these two years, I use a
regression adjustment process adopted in Beaudry and Lewis (2014) to ensure that the wage gap
variable compares wages between otherwise similar native born and immigrants in terms of
observable characteristics.
I first estimate the equation ln#$%&'
= )*+ )
,-$%&'
+ .$%&'
, where ln#$%&'
is the natural
log of the hourly wage of person / who belongs to education group 0 and native-immigrant status
1 (where 1 = 2 indicates natives and 1 = 3 indicates immigrants) during year 4 . The vector
-$%&'
contains age, age squared, and a series of race indicators.7 I estimate the equation for natives
and immigrants, and for each education group separately. The wage gap is then evaluated at the
city-education level immigrant mean -%56'
where 7 denotes city, and the adjusted native-
immigrant wage gap in education group 0 in city 7 during year 4 is given by 89:;%6'
= ()*
=−
)*
5) + ()
,
=− )
,
5)-
%56', and ∆89:;
%6= 89:;
%6,B***− 89:;
%6,,CD*. I use this measure because
I am interested in the impact of routinization on the part of the wage gap that cannot be fully
6 This paper further categorizes two broad education groups: individuals with at most a high school degree are considered to be low-skilled, while individuals with at least some college education are considered as high-skilled. 7 I identify four race groups in this paper: whites, blacks, Asians, and Hispanics.
10
explained by differences in observable characteristics. This regression adjustment process ensures
that the estimated native-immigrant wage gap trend is due to differences in intercepts as well as in
returns to the observable characteristics between natives and immigrants.8
The average unadjusted and adjusted wage gaps for various demographic groups from 1980
to 2000 are compared in Table 1. The standard errors are obtained by regressing the respective
wage gap on a constant. They are used to test whether the means of wage gap trends are
significantly different from zero. Both unadjusted and adjusted changes in wage gaps are positive,
meaning that the native-immigrant wage differentials have widened between 1980 and 2000. Since
changes in racial composition, age, and education could explain part of the changes in wage gaps,
the regression adjusted wage gap trends are all smaller in magnitude. However, the growing wage
gaps do not disappear after controlling for observable characteristics and this is the part of the
wage gaps that I consider in this paper.
3.2 Measuring the Likelihood of the Routinization Process
Since the routinization hypothesis suggests that technological progress greatly reduces the cost of
performing routine tasks and decreases demand for routine labor input (Autor and Dorn, 2013),
markets that were historically specialized in routine task-intensive industries should adopt
technology more aggressively, increases the demand for social skills more prominently, and
reallocate labors from routine intensive occupations to non-routine service occupations more
extensively. In practice, I merge two versions of the 1 percent metro samples of the 1970 Census,
and I reference Autor and Dorn (2013) to calculate a routine employment share measure as
EFℎHI0%6,,CJ*
= K%6$,,CJ*
L
$∙ K
%6$,,CJ*$
N,
,where the numerator is the total number of
8 An alternative measure of adjusted wage gaps which utilizes differences in regression residuals between native group and immigrant group’s wage equations yields interpretations similar to those presented this paper.
11
hours worked by people in “routine occupations” who belong to education group 0 in MSA 7 in
year 1970. 9 The denominator is the total employed hours in all occupations. Intuitively,
EFℎHI0%6,,CJ*
measures the routine employment share of education group0 in MSA 7 in year
1970, and it should correlate positively with technology adoption of that MSA-education cell after
1980. The scale of EFℎHI0%6,,CJ*
ranges from 0.08 to 0.71, with a median of 0.49.
This measure makes two small adjustments to the index adopted in Autor and Dorn (2013).
First, I use the 1970 sample instead of the 1950 sample to construct the routine employment share
variable. The technical reason is that the 1970 sample has a larger sample size. Moreover, I argue
that a city’s routine employment share immediately before the technology change should have the
largest impact on its routinization tendency after the technology change.10 Second, I calculate the
routine employment share within education and MSA cells instead of just within the geographical
unit. The education distribution of immigrants is largely bimodal in the sense that, relative to
natives, high percentages of immigrants than natives have less than a high school degree and more
than a college education (Baum and Flores, 2011). It is unlikely that the routine concentration of
workers in the low skill group in 1970 would have any significant effect on the routinization
process of the high skill groups between 1980 and 2000, and vice versa. Thus, using this measure,
I effectively identify the impact from routinization within skill groups.
To test whether EFℎHI0%6,,CJ*
measures the routinization process likelihood well, I follow
Autor and Dorn (2013) in considering the relationship between this baseline routine share and
9 The routine occupations categorization follows Autor and Dorn (2013). Administrative support, retail sales, precision production, craft workers, machine operators, and assemblers are routine intensive occupations; managers, technicians, financiers, public safety are considered high skill non-routine cognitive occupations; while transportation, construction, mining professions, farmers, and service occupations are considered low skill non-routine manual occupations. This grouping method is developed through a procedure where the authors merge job task requirements from the fourth edition of the US Department of Labor’s Dictionary of Occupational Titles (DOT) to the corresponding Census occupation classifications to measure each occupation’s routine intensity, and then separate routine intensive occupations from non-routine intensive occupations accordingly. 10 In fact, replacing EFℎHI0
%6,,CJ* by EFℎHI0
%6,,CP* in my model estimations do not change the results, but the estimated
coefficient of the key independent variable becomes less statistically significant.
12
future changes in the shares of a city’s employment that are in the low skill service sector and
within routine task occupations. Results in Table 2 suggest that, regardless of whether baseline
shares are computed within education-MSA cells or just MSA-cells, routine task shares in 1970,
just like routine task shares in 1950, can successfully predict the job polarization of local labor
markets where routine employment falls and low skill service sector employment rises. 11
Therefore, I consider EFℎHI0%6,,CJ*
to be a good indicator of local labor markets’ routinization
process.
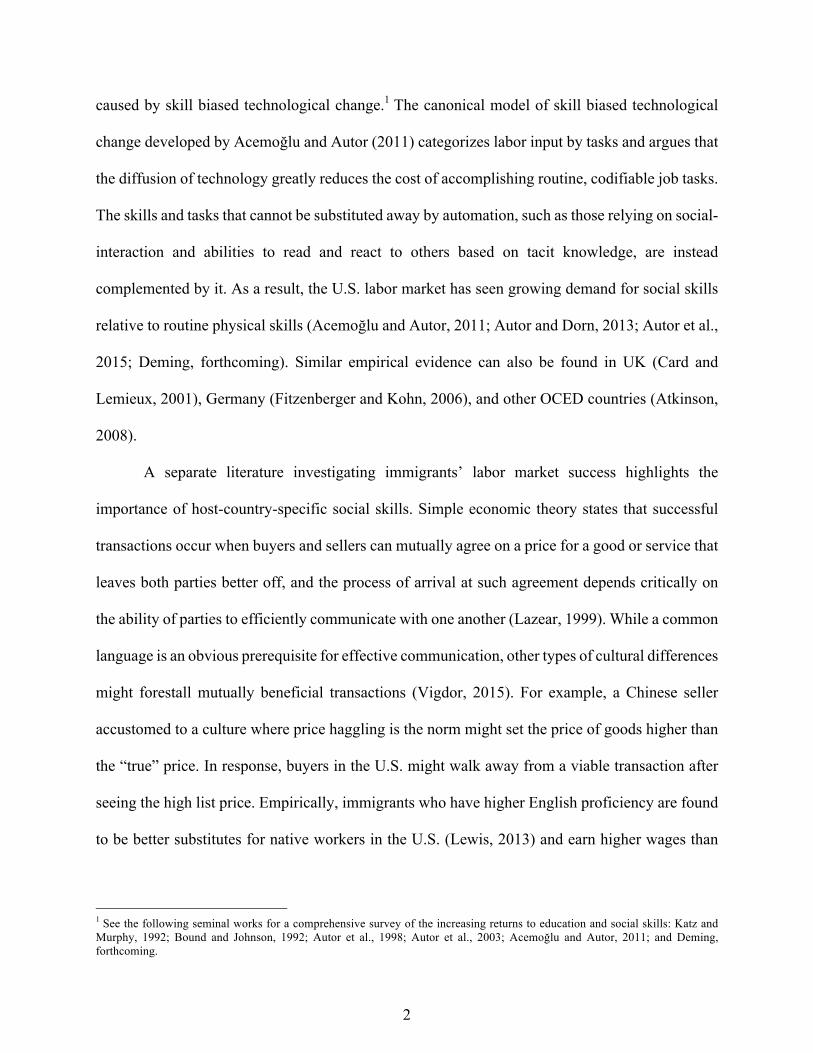
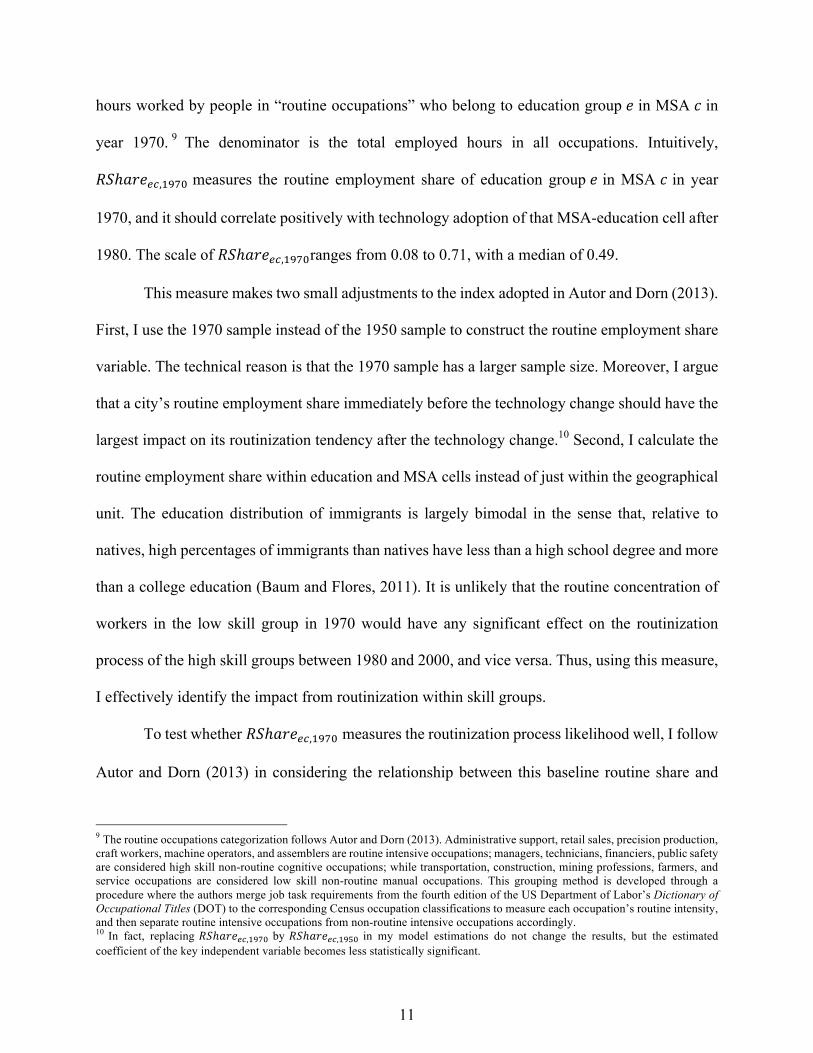
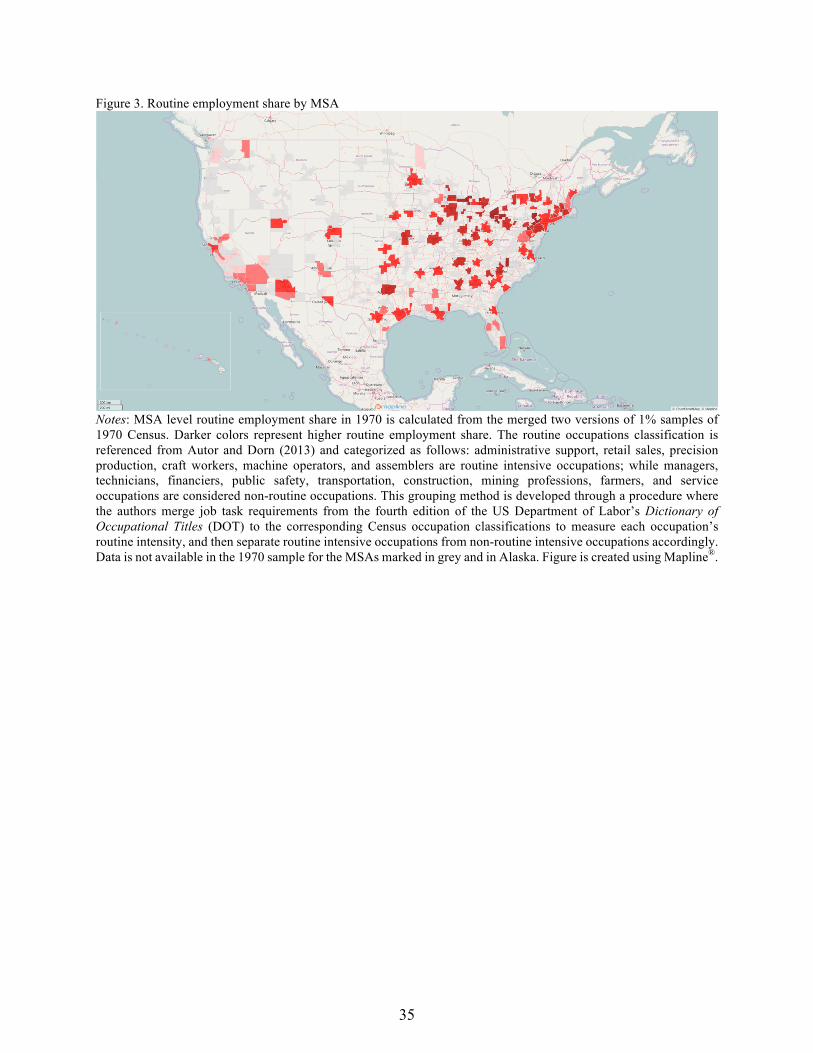
To provide a visual representation of different degrees of routine employment shares across
geographical regions, I aggregate the routine employment shares into the MSA level and present
the map of the United States according to each MSA’s share of routine employment in 1970 in
Figure 3. The most routine intensive cities were mostly in the “Rustbelt” states of Illinois, Indiana,
Ohio, Pennsylvania, and Michigan, and the least routine intensive cities were the cities specializing
services, such as Las Vegas.12 In addition, I present the top and bottom five MSAs ranked by
EFℎHI06,,CJ*
in Table 3. Routine intensive MSAs are all industry-heavy cities and non-routine
MSAs are all service oriented.
3.3 Model
Having obtained the measures of changes in native-immigrant wage gaps ∆89:;%6
and
routinization process likelihood EFℎHI0%6,,CJ*
, I use an empirical model similar to an analysis by
Beaudry and Lewis (2014) on technology’s impact on the gender wage gaps to test routinization’s
impact on changes in native-immigrant wage gaps:
11 The larger variation of EFℎHI0
%6,,CJ* (0.180) comparing to that of EFℎHI0
6,,CJ* (0.055) is the reason for the smaller point
estimates in the second column. 12 Grey colored MSAs are the ones not included in this study – due to either lack of necessary data or inconsistencies across samples.
13
1 ∆89:;%6= R
*+ R
,EFℎHI0
%6,,CJ*+ R
BS6+ R
TU6+ V
W+ X
%6,
where the coefficient of interest, R,, measures the impact of routinization on changes in adjusted
native-immigrant wage gaps within MSA-education cells. I expect a positive and statistically
significant estimated R,if native-immigrant wage gaps increased more in cities that were more
likely to adopt technology to replace routine labor. Since I use the 1970 sample to calculate
EFℎHI0%6,,CJ*
, reverse causality is not a problem because the change in native-immigrant wage
gaps from 1980 to 2000 cannot dictate the occupational structure in 1970. However, I acknowledge
that markets of different routine intensity might have different social and cultural stance towards
immigration, which could cause deterministic trends in wage gaps development. I will address this
potential bias in Section 4.
Following Beaudry and Lewis (2014), I include a vector of city level business cycle and
composition controls in 1980: S6. It contains city level unemployment rate, share of Hispanic
workers, share of black workers, and share of immigrant workers as well as its square form. State
fixed effects are labeled VW where Y denotes states.
In some specifications, I also follow Beaudry and Lewis (2014) and include industry
composition controls U6
, which are shares of employment in durable and nondurable
manufacturing industries, and shares of employment in high skill and low skill service sectors in
1980. Their interaction terms with a broad education group dummy (high school degree or less)
are also included because industry mix could have different wage effects on individuals of different
education levels (Beaudry and Lewis, 2014). These controls account for any changes in native-
immigrant wage gaps that might be driven by changes in industrial composition, for example, as a
result of changes in the characteristics of immigrant labor in a particular city. However, I do not
include these controls in all specifications because industry expansion or contraction due to
14
technological change could be a potential mechanism driving the increase in native-immigrant
wage gaps. For example, as robots started replacing workers, cities heavily invested in toy
manufacturing industries in 1970 might move towards more service-oriented industries which
would reward natives’ skills relatively more. Ultimately, I include these controls in my preferred
model specification as a strategy to be conservative not only because it follows the model
specification in Beaudry and Lewis (2014) but also because it would control for any industry-wide
effects that might not be associated with the routinization process. Therefore, the estimated results
might be considered the lower bound of routinization’s impact.13
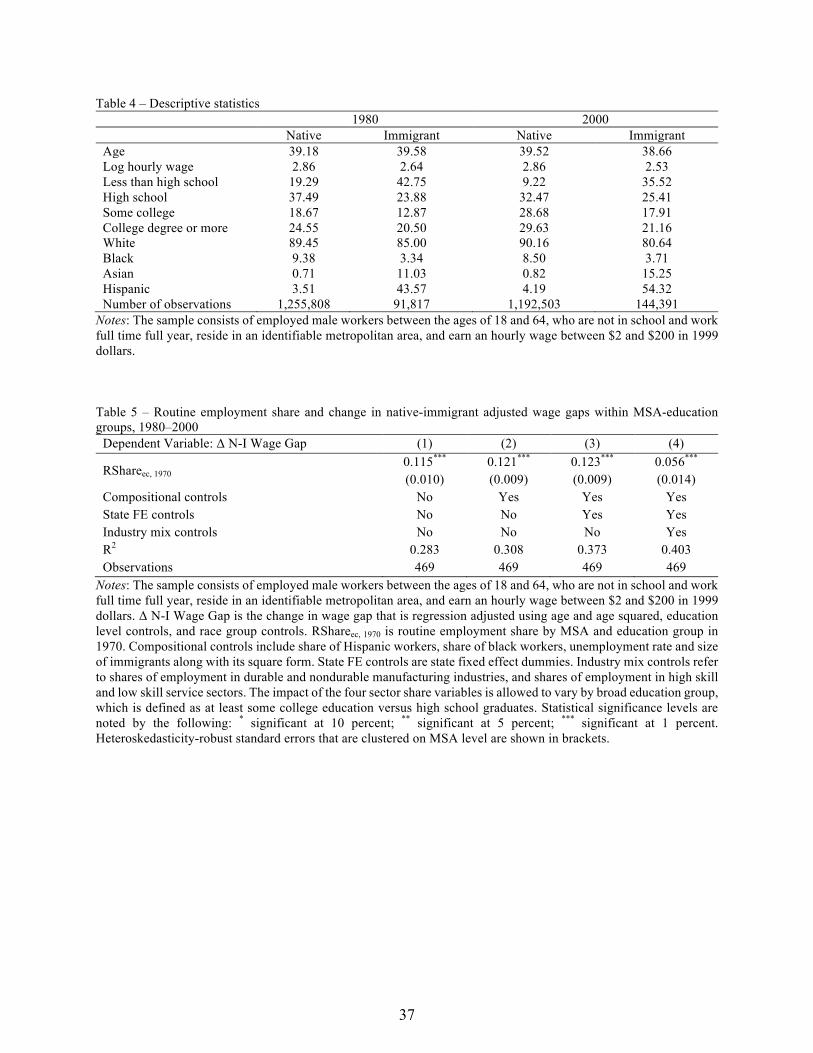
Table 4 presents summary statistics for the key demographic characteristics of immigrants
and natives for the years 1980 and 2000. In the two decades after 1980, the natives’ average real
wage has been stagnant while immigrants’ average real wage has decreased, causing the increase
in observed wage gaps. Natives have become more educated as the share of natives with at least a
college degree increased by 20.7 percent, while the share of natives without a high school diploma
decreased sharply by 52.2 percent. At the same time, immigrant population continued to grow but
their concentration in both high and low tails of education distribution remained steady. Over the
two decades, there has been an increase in the shares of Hispanic and Asian immigrants but a
decrease in the share of white immigrants.
4. Empirical Results
4.1 Baseline Regression Results
Table 5 shows OLS estimates of (1), that is, the effect of initial routine employment on the changes
in adjusted native-immigrant wage differentials between 1980 and 2000, the standard errors are
13 The estimated impact of routinization on native-immigrant wage gaps is consistently larger in magnitude without industry composition controls in all estimations presented in this paper.
15
clustered at the MSA level and are heteroskedasticity-robust. Having EFℎHI0%6,,CJ*
as the sole
independent variable, column 1’s positive estimated coefficient on EFℎHI0%6,,CJ*
shows that the
widening native-immigrant wage gaps are associated with cities’ historical routine intensities. The
estimated coefficient implies that each additional percentage point increase in routine employment
share in 1970 is associated with a 0.115 percentage point increase in native-immigrant wage gaps
between 1980 and 2000.
Since immigrants’ labor market outcomes are particularly sensitive to business cycle
fluctuations (Orrenius and Zavodny, 2010), the estimated coefficient in this specification might
overestimate the effect of technology if the routine intensive cities were also the cities that did not
perform well economically after 1980. In order to remedy this concern, the second column adds
MSA level business cycle and composition controls. The estimated coefficient barely grows to
0.121, which is not significantly different from 0.115, meaning business cycle and labor supply
factors did not affect native-immigrant wage gaps growth.
In column 3, I add state fixed effects to the model. The benefit of including state fixed
effects is that they control for any state-level characteristics that could potentially affect
immigrants and natives differently. As shown in Figure 3, cities that are most routine-intensive are
mostly concentrated in the rustbelt states. It is therefore possible that the estimated results are
driven by the economic slow-down of these rustbelt states since the 1980s for reasons unrelated to
routinization. The estimated coefficient increases marginally to 0.123 with the state fixed effects,
suggesting that state-specific characteristics do not meaningfully influence native-immigrant
relative wages.14
14 Empirical results also hold when excluding observations from the rustbelt states of Pennsylvania, West Virginia, Ohio, Indiana, Michigan, Illinois, and Iowa.
16
Finally, I include the industry mix controls in column 4. Since this specification holds
constant the share of the labor force working in manufacturing, for example, it measures only the
impact of routinization on wage differentials within sectors. This specification does not allow for
the possibility that as robots replace workers, fewer manufacturing jobs become available in a city
forcing workers into other jobs where their skills are less rewarded. Including these controls
decreases the estimated coefficient to 0.056, and it is significantly different from the estimated
coefficient in column 3 at 1 percent level. This significant drop is not surprising because the
estimated coefficient should decrease if immigrants were disproportionally concentrated in
manufacturing industries that were negatively impacted by routinization. Since I elect to follow
the literature and include the industry mix controls in my preferred specification, I interpret the
estimated coefficient 0.056 as the lower bound of routinization’s effect, and I expect the true effect
of routinization to be between 0.056 and 0.123.
The results in the last column in Table 5 imply that if routine employment share of
education group 0 in city 7 increases by one percentage point in 1970, immigrants belonging to
that group would experience at least a 0.056 percentage point increase in wage gap from 1980 to
2000. This suggests that cities and education groups that were more likely to routinize the
production process with technology experienced bigger increases in native-immigrant wage gaps.
This offers the first piece of evidence suggesting that the increase in relative price of social skills
induced by routinization may have been one of the reasons why we observe an increase in native-
immigrant wage gaps since the 1980s.15 In the following section, I continue to use the model
15 These results are robust to further adjustments in weights according to the share of workers in each education levels in the local labor market. An alternative difference-in-difference regression was carried out using MSAs with above average EFℎHI0
%6,,CJ* as
the treatment group, similar interpretation was drawn.
17
specification with the full set of controls, including the industry mix variables, as the preferred
model, and I interpret all estimated coefficients to be the lower bound of the impact of routinization.
4.2 Causal Relationship or Internal Migration?
All of the empirical analyses discussed thus far rely on the argument that routinization had
significant impacts on local labor markets. Since the main regression is based on a reduced form
model, it is possible that what I observe is merely the effect of changes in labor skill compositions
that are correlated with both 1970 routine employment shares and changes in wage gaps. That is,
if immigrants and native born exhibited distinct sorting behaviors according to skills in routine
intensive cities, then the interpretation that increased prices in U.S.-specific social skills induced
by routinization was the reason for the increase in native-immigrant wage gaps would become
more problematic. In this section, I perform additional analyses to parse out whether the positive
relationship between routine employment shares and changes in wage gaps is the result of
compositional changes of labor input in different labor markets or indeed represents a causal
relationship.
It is possible that a routine intensive city in 1970 could attract immigrants and natives of
different types. It could be that more low skill immigrants, conditional on their formal schooling,
moved to routine intensive cities for better job prospects. It is also possible that a city adopting
technology more aggressively would be more attractive to high skill natives, again conditional on
formal schooling. Either of these selective migration behaviors could cause a widening of wage
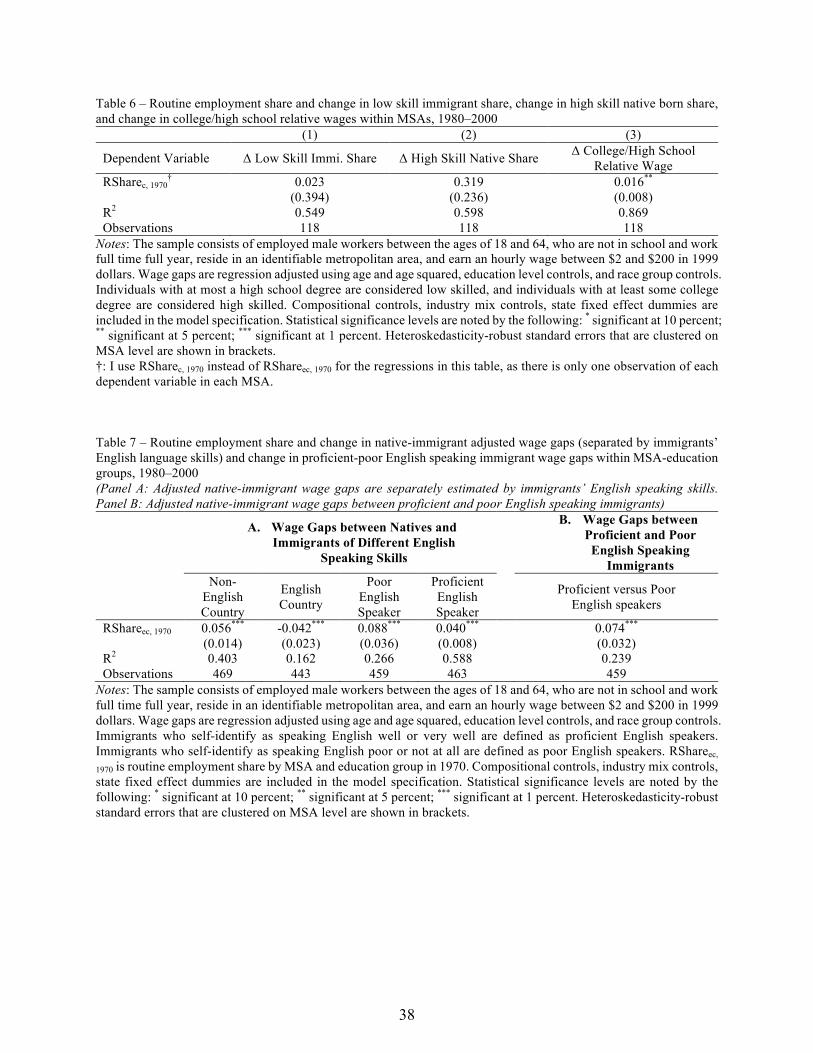
gaps for reasons unrelated to the changing skill prices induced by routinization. To examine this
possibility, Column 1 of Table 6 presents the result from a regression of changes in low skill (in
terms of education level) immigrant share within MSAs between 1980 and 2000 on 1970 routine

18
share. 16 The estimate of coefficient is negative and statistically insignificant, which means that
routine intensive cities did not experience any differentially large inflow of low skill immigrants
since 1980. Column 2 shows the regression results when I use changes in high skill (also in terms
of education level) native born share between 1980 and 2000 as the dependent variable. The
insignificance of this estimated coefficient suggests that high skill natives were not moving
systematically to cities with high 1970 routine shares. Although it is still possible that these cities
attract more immigrants with worse unobserved skills or more natives with better unobserved
skills, it seems unlikely that the relationship would be different between observed and unobserved
skills.17
As an additional test that my estimates are actually measuring impacts of routinization, I
use my data and empirical technique to test a standard result in the literature (Acemoğlu and Autor,
2011; Beaudry and Lewis, 2014): routinization yields higher skill wage premiums. If my findings
do reflect a causal relationship between routinization and native-immigrant wage gaps, then
historically routine intensive cities should also experience increases in college wage premiums.
The last column of Table 6 presents the regression results when I use changes in college/high-
school adjusted relative wages between 1980 and 2000 as the dependent variable.18 The positive
and statistically significant estimated coefficient on the 1970 routine share variable implies that
cities that were historically routine intensive also experienced growing skill premiums.
To summarize, I could not find any evidence suggesting that the observed wage gaps trend
was caused by potential geographical sorting behaviors of native born and immigrants. All of the
16 I use EFℎHI0
6,,CJ* instead of EFℎHI0
%6,,CJ* as the key independent variable because there is only one observation of skill
composition change within a MSA. 17 I also re-estimate model (1) with only workers who have not moved in the past 5 years to address the differential migration pattern concerns, the estimated coefficient of interest decreases marginally to 0.043, but it is still statistically significant at 10% level. 18 A similar adjustment process is adopted, and it controls for age, age squared and racial composition.
19
evidence presented in this section is consistent with the argument that part of the increase in native-
immigrant wage gaps was driven by routinization.
4.3 Heterogeneous Effects
Having presented evidence that routinization led to increasing native-immigrant wage
differentials, I now examine whether changes in the price of U.S.-specific communication skills
drove this relationship.
Even at the most basic level, U.S.-specific communication and social skills rely on English
speaking abilities. Therefore, I start by directly comparing the wage trends of immigrants of
different English language skills. In theory, if the positive estimated coefficient observed in the
baseline regression indeed represents an increase in social skill prices, then the increase in wage
gaps in routine intensive cities should be driven by immigrants who do not speak English well.
The first two columns in Section A of Table 7 directly test this conjecture by comparing the
changes in native-immigrant wage gaps between immigrants from non-English speaking countries
and immigrants from countries that have English as first language. Recall that my original sample
consists only of immigrants from non-English speaking countries, the first column of Table 7 is
directly replicated from the results in the last column of Table 5. If I carry out the same regression
with a sample of immigrants from English speaking countries, then the estimated coefficient on
the routine employment share should not be as big as what is observed in the first column. In fact,
column 2 of Section A shows that the routine share estimate is negative and statistically significant
when using the sample with only immigrants from English speaking countries. One explanation
for why immigrants from English speaking countries experienced a decrease in wage gaps in
routine intensive cities is that immigrants from English speaking countries might have better
20
communication and social skills than native born as they are comfortable navigating at least two
social and cultural environments. Given that they do not have language barriers, it is very
reasonable that these unobservable social and communication skills would be more valued in cities
that underwent the routinization process more intensely.
In the next two columns in Section A of Table 7, I separate the sample of immigrants from
non-English speaking countries into two sub-categories: immigrants who identify themselves as
speaking English well or very well, and immigrants who identify themselves as speaking English
poorly or not at all. Following the same reasoning, I propose that more proficient English speakers
should experience a less negative impact from routinization. The results suggest that each
additional percentage point increase in routine employment share in a local labor market in 1970
would cause immigrants who did not speak English well to experience a 0.088 percentage point
increase in wage gaps between 1980 and 2000, while immigrants who spoke English well would
only experience a 0.040 percentage point increase.
Lastly, if routine intensive cities did experience a differential increase in returns to
communication skills, then the wage gaps between immigrants with different levels of English
mastery should also increase in these cities. I regress the changes in adjusted wage gaps between
proficient English speaking immigrants and poor English speaking immigrants against routine
employment shares, and present the results in Section B of Table 7. The positive estimated
coefficient of 0.074 suggests that the wage gaps between immigrants of high and low English
language skills also increased significantly in cities that were more likely to have undergone an
extensive routinization process.
Communication in a work setting requires more than just a textbook ability to speak the
dominant language. Sharing ideas about complex concepts and motivating and coordinating teams
21
at work also require a knowledge of the culture and social norms in the host country. I use measures
of social assimilation beyond English language ability to separate immigrant groups, and present
Table 8 to show impacts of 1970 routine shares on changes in native-immigrant wage gaps among
immigrants of different levels of likely social integration. Throughout, the sample of natives is the
same.
I first categorize immigrants’ potential U.S.-specific social skills according to their age of
arrival in the United States. Immigrants’ social and language assimilation paths depend strongly
on their age of arrival (Bleakley and Chin, 2010), and immigrants who migrated to the U.S. before
the age of 18 could be considered “half-natives” because they grew up and went to school in the
U.S. Therefore, they should have relatively better labor market outcomes, when compared to other
immigrants, in areas that highly value social skills. In practice, I divide the sample into immigrants
that migrated before or at the age of 18 and immigrants that migrated after the age of 18 and re-
estimate the model. As can be seen in columns 1 and 2 of Table 8, immigrants migrating after the
age of 18 suffered a higher increase in wage gaps when living in high routine share cities, while
“half-natives” experienced a significantly tamer impact with only a marginally significant
estimated coefficient.
Next, I compare how the relationship between 1970 routine shares and changes in native-
immigrant wage gaps differs by how long the immigrants have lived in the United States. Similar
to the argument above, long-time immigrants have had more time to acclimate themselves into the
host country’s social and cultural settings than new immigrants, so they should experience a less
negative impact from routinization. The third and fourth columns present the regression results
when I separate the sample into immigrants who have lived in the U.S. for at least 15 years and
those who have lived in the U.S. for less than 15 years. The bigger and more statistically significant
22
estimated coefficient for new immigrants is consistent with the conjecture that the increase in
returns to U.S.-specific social skills could explain part of the widening native-immigrant wage
gaps.
In the same vein, immigrants who are married to natives, often termed intermarried
immigrants, should not experience significantly negative effects from routinization because they
are more socially assimilated into the host country than immigrants married to other immigrants
(Furtado and Theodoropoulos, 2010; Furtado and Song, 2015). Furtado and Song (2015) find that
intermarriage wage premiums have increased from 1980 to 2000 even when allowing the value of
education and English-speaking ability to vary over time, and suggest that the patterns might be
driven by increase in demand for social and management skills in the U.S. labor market. I follow
this reasoning and separate intermarried immigrants from other married immigrants in calculating
the native-immigrant wage gaps, and present the results of the two regressions in the columns 5
and 6 of Table 8, respectively. The estimated coefficient for intermarried immigrants is statistically
insignificant as expected while immigrants that are married to other immigrants experienced a
significantly larger wage gap increase.19
The last four columns of Table 8 categorize immigrants by their potential contact with their
ethnic peers.20 It is likely that immigrants who live in large ethnic enclaves and have more frequent
interactions with their ethnic peers would have less exposure to U.S. culture and social norms, and
therefore lack U.S.-specific social skills. I use the share of co-ethnics within an MSA to measure
the ethnic enclave size, and I use the isolation index of an ethnic group within an MSA to measure
19 Restricting the sample of native born to only married natives in these two estimations neither changes the sign and significance of the estimated coefficients nor the interpretation. 20 I define ethnic groups by immigrants’ country of origin.
23
the potential contact probability between two co-ethnics.21 I consider immigrants with above-
median ethnic enclave size or above-median isolation index as immigrants with less potential U.S.-
specific social skills. While I acknowledge that immigrants who live in larger ethnic enclaves or
have more frequent interactions with their ethnic peers might not depend on their U.S.-specific
social skills as much as their counterparts, results show that these immigrants still suffered wider
native-immigrant wage gaps than immigrants who did not have significant ties with their ethnic
peers.
To summarize, in Table 8, I construct various samples to parse out the potential U.S.-
specific social skills among immigrants. I test whether immigrants who are more likely to have
better social and communication skills experienced less negative impacts from routinization. The
empirical results consistently show that they did, and therefore might be considered as more
evidence suggesting that the increasing returns to U.S.-specific social skills brought about by
routinization was a factor causing the growing native-immigrant wage gaps.
4.4 Alternative Explanations and Robustness Checks
Having shown several pieces of evidence supporting routinization as driving the increase in native-
immigrant wage gaps, I address several alternative explanations for the results. First, suppose that
in 1970 some cities experienced a random positive demand shock for goods produced by routine
intensive industries and that immigrants were over-represented in these industries. After 1970,
21 I calculate the isolation index as 8FZ
&6'=
[\]^_`
[\]^_a]abc,d
×
[\]^_`
_]_^cba`]f`
N
[\]^_a]abc,d
_]_^cba`]fa]abc,d
`
5$= ,,
[\]^_a]abc,d
_]_^cba`]fghbcciga,d
N
[\]^_a]abc,d
_]_^cba`]fa]abc,d
, where 1Ij.k$ is the population of immigrants
from ethnic group 1 living in tract / ; 1Ij.k'l'mn,6
is the population of immigrants from ethnic group 1 living in MSA 7 ; kjk.oH4/j2
$ is the total population in tract /; kjk.oH4/j2
'l'mn,6 is the total population in MSA 7; kjk.oH4/j2
W5mnn%W',6 is the
population of the tract with the least residents in MSA 7. Hence 8FZ&6'
is the MSA-level isolation index according to country of origin, calculated based on tract-level data. The calculation method is referenced from Glaeser et al. (2008), and I use the tract level information in Table PCT019 of Summary Tape File 3 of 2000 Census to construct the isolation index (U.S. Census Bureau, 2016).
24
local economies would tend to converge back to the pre-shock equilibrium. Subsequently, demand
and relative wages of immigrant workers would decrease in those cities as well. This scenario
would cause a false positive relationship between 1970 routine employment shares and changes in
native-immigrant wage gaps afterwards.
Another potential concern is that changes in native-immigrant wage differentials are driven
by changes in labor market discrimination. While I account for the state-wide discrimination
against immigrants by including state fixed effects, there may still be within-state discrimination
changes over time. For example, Austin and Dallas have drastically different cultures, even though
they are both located in Texas. Discrimination and prejudice may have evolved in different ways
in these two cities between 1980 and 2000, in a way that was systematically related to their 1970
routine shares.
In order to address these two concerns at the same time, I perform a placebo regression
estimating the relationship between changes in native-immigrant wage gaps from 1970 to 1980
and the 1970 routine employment shares. If the aforementioned two scenarios were true, I should
observe a similar positive relationship between the wage gap growth and routine employment
share. On the other hand, if my results are driven by routinization induced by technological change,
which started in 1980, then 1970 routine shares should not lead to increases in wage gaps before
1980. I replicate the original 1980 – 2000 results to column 1 in Panel A of Table 9 for ease of
comparison, and I present the placebo regression results in column 2 in Panel A. The statistically
insignificant estimated coefficient suggests that the positive relationship between the wage gap
trend after the 1980s and the routine employment share in 1970 was not caused by random shocks
or discrimination.
25
To further put the spurious relationship concerns to rest, I estimate the relationship between
changes in adjusted native-immigrant wage gaps from 1950 to 1970 and the 1970 routine
employment shares. Again, since technological changes started in the 1980s, the routine intensity
of cities in 1970 should not retroactively predict wage gap changes before 1970. The statistically
insignificant estimated coefficient in the third column of Panel A in Table 9 is offered as
confirmation.
Estimations thus far have only focused on the wage gap changes from 1980 to 2000, one
could argue that it was a coincidental positive relationship between changes in native-immigrant
wage gaps and routinization. I can re-estimate the model using additional years of data to address
this concern. In practice, I use the five percent sample for the 1990 Census, the merged 3-year 1
percent samples of American Community Survey for 2005-2007, and the merged 3-year 1 percent
samples of American Community Survey for 2008-2010. In Panel A of Table 10, I estimate the
relationship between 1970 routine employment shares and changes in adjusted native-immigrant
wage gaps for the periods from 1980 to 2005 – 2007, from 1980 to 2008 – 2010, and from 1990
to 2008 – 2010. The positive and statistically significant estimated coefficients are robust in all
time periods after 1980, suggesting that the positive relationship observed for the 1980 – 2000
period is not a coincidence.
In order to ensure that the findings so far are not driven by the choice of measurement on
routinization, I develop an additional measure by taking nation-wide routine intensity levels of
industries into consideration. According to Autor and Dorn (2013), areas that were historically
specialized in routine task intensive industries should adopt technology and displace routine labor
more quickly. It is possible that the same industry might have different routine intensity in different
geographic regions before the technology boom, but it is also reasonable to suppose that an
26
industry, no matter where they are located, might have a similar tendency to adopt the same
technology to replace routine labors during the technology boom. Therefore, EFℎHI0%6,,CJ*
could
potentially be a noisy measure in that the same industry adopting the same amount of technology
could have different values of EFℎHI0%6,,CJ*
in different cities. I could sidestep this potential
problem by first measuring the general routine intensity of an industry calculated from its nation-
wide routine employment share. I first separate 231 industries into ten broad industry groups:
construction; manufacturing; transport and utilities; wholesale trade; retail trade; finance,
insurance and real-estate; business services; personal services and entertainment; professional
services; and public administration. Then, I calculate each industry group’s nation-wide routine
employment share in 1970 as EFp,,CJ*
= K$p,,CJ*
L
$∙ K
$p,,CJ*$
N,
,where the numerator is
total number of hours worked by people in “routine occupations” in industry q in 1970, and the
denominator is total number of hours employed in industry q in 1970. Thus, an industry that
requires more routine labor input would have a bigger EFp,,CJ*
.
EFp,,CJ*
is then assigned to each individual according to the industry group they belong to,
and then I take the average of EFp,,CJ*
by MSA and education group and call this variable routine
intensity index E82r0s%6,,CJ*
for education group 0 in MSA 7. For example, suppose in 1970
there are only two cities 7 and r and two industries q and t in an economy. Industry q is more
routine intensive and requires 80 percent of total labor input to be routine labor (EFp= 0.8), while
industry t is less routine intensive and requires only 20 percent of routine labor input (EFx= 0.2).
Suppose city 7 employs five people from education group 0 with two working in industry q and
the rest working in industry t , while city r has five workers in education group 0 with one
working in industry q and four working in industry t . Then E82r0s%6,,CJ*
=*.D×Bz*.B×T
P
=
27
0.44, and E82r0s%|,,CJ*
=*.D×,z*.B×}
P
= 0.32 . Intuitively, E82r0s%6,,CJ*
uses national level
routine intensity of industries to measure the routine intensity of a MSA-education group, and
therefore estimates the general routinization tendency of industries.
In Panel B of Tables 9 and 10, I test the robustness of the empirical results over all the
previously estimated time periods using E82r0s%6,,CJ*
. Despite magnitude differences due to
different scales, I consistently find the same positive relationship between E82r0s%6,,CJ*
and the
various wage gap changes after 1980 without observing any meaningful relationship for the wage
gap changes before 1980.
5. Conclusion
Motivated by the concurrent movement of native-immigrant wage gaps and technological
advancement since the 1980s, this paper asks whether the increasing returns to social skills induced
by technology’s routinization process plays a role in explaining recent increases in native-
immigrant wage gaps. In particular, if the routinization process increased the returns to U.S.-
specific social skills, and natives have a comparative advantage in these skills, then it may have
increased native-immigrant wage gaps even holding constant human capital characteristics of both
immigrants and natives.
Consistent with this hypothesis, I show that markets that were historically routine intensive,
and therefore more likely to adopt technology to substitute routine labor, experienced more
prominent increases in native-immigrant wage gaps. The positive relationship does not seem to be
driven by selective migration between cities, and the basic result survives several mechanism
checks, placebo regressions, and an alternative routinization measure. Taken together, the results
in this paper provide rather strong evidence suggesting that indeed native workers have enjoyed
28
better labor market outcomes than immigrants because they are highly endowed with U.S.-specific
social skills, which have become more highly rewarded in the labor market.
This paper has several implications for immigration policy. Concerns about the “quality”
of recent immigrants and how they are not assimilating economically at the same speed as earlier
cohorts have garnered significant media attention. Borjas (2015) suggests that part of the decline
in economic assimilation in recent waves of immigrants is due to their slower rates of human
capital accumulation, particularly slower English language skill acquisition. My results suggest
that even if the recent cohorts acquired English language skills at the same speed as the earlier
cohorts of immigrants, they would still have had lower wages and potentially slower wage growth
due to changes in the U.S. labor market. To address this issue, government’s immigrant assistance
programs might prioritize training for English language skills as well as other social and
communication skills. Policies designed specifically to improve immigrants’ social capital might
be especially cost effective if they decrease immigrants’ need for safety net programs.
Furthermore, such policies could reduce long term inequality between natives and immigrants as
immigrants become better able to invest in their children’s education and health (Lassem and
Sanders, 2013).
The results in this paper also have implications for policies unrelated to immigration. While
a large literature has pointed to the increasing returns to schooling as a result of routinization, a
growing literature has focused on the returns to cognitive and social skills (Deming, forthcoming).
The results in this paper reinforce the idea that social skills have become increasingly important,
suggesting that these skills should be given more priority in the education of all students, not just
the foreign born.
29
References
Acemoğlu, D., & Autor, D. (2011) Skills, tasks and technologies: Implications for employment and earnings. In Handbook of Labor Economics (Volume 4 ed., pp. 1043). Ashenfelter O. and Card D. eds., Amsterdam: Elsevier.
Acemoglu, Autor, Dorn, Hanson, & Price. (2016). Import Competition and the Great US Employment Sag of the 2000s. Journal of Labor Economics, 34, S141.
Alba, R. D., & Nee, V. (2003). Remaking the American mainstream: Assimilation and contemporary immigration. Cambridge, Mass: Harvard University Press.
Atkinson, A. (2008). The changing distribution of earnings in OECD Countries. The Rodolfo De Benedetti Lecture Series
Autor, D.H. (2015). Why are there still so many jobs? The history and future of workplace automation. Journal of Economic Perspectives, 29(3), 3-30.
Autor, D. H., & Dorn, D. (2013). The growth of low-skill service jobs and the polarization of the US labor market. American Economic Review, 103(5), 1553-1597.
Autor, D. H., Dorn, D., & Hanson, G. (2015). Untangling trade and technology: Evidence from local labour markets. Economic Journal, 125(584), 621-646.
Autor, D. H., Katz, L. F., & Krueger, A. B. (1998). Computing inequality: Have computers changed the labor market? Quarterly Journal of Economics, 113(4), 1169-1213.
Autor, D. H., Levy, F., & Murnane, R. J. (2003). The skill content of recent technological change: An empirical exploration. Quarterly Journal of Economics, 118(4), 1279-1333.
Baum, S., & Flores, S. (2011). Higher education and children in immigrant families. The Future of Children, 21(1), 171-193.
Beaudry, P., & Lewis, E. (2014). Do male-female wage differentials reflect differences in the return to skill? Cross-city evidence from 1980-2000. American Economic Journal: Applied Economics, 6(2), 178-194.
Bleakley, H., & Chin, A. (2004). Language skills and earnings: Evidence from childhood immigrants. The Review of Economics and Statistics, 86(2), 481-496.
Bleakley, H., & Chin, A. (2010). Age at arrival, English proficiency, and social assimilation among US immigrants. American Economic Journal, 2(1), 165-192.
30
Borjas, G. J. (1990). Self-selection and the earnings of immigrants: Reply. American Economic Review, 80(1), 305.
Borjas, G. J. (1991). Immigration and self-selection. In Immigration, Trade, and the Labor Market (pp. 29-76). Abowd J. M., and Freeman R.B. eds., University of Chicago Press
Borjas, G.J. (2015). The Slowdown in the Economic Assimilation of Immigrants: Aging and Cohort Effects Revisited Again. Journal of Human Capital, 9(4), 483-517.
Bound, J., & Johnson, G. (1992). Changes in the structure of wages in the 1980's: An evaluation of alternative explanations. The American Economic Review, 82(3), 371-392.
Card, D., & Dinardo, J. (2002). Skill biased technological change and rising wage inequality: Some problems and puzzles. Journal of Labor Economics, 20(4), 733-783.
Card, D., & Lemieux, T. (2001). Can falling supply explain the rising return to college for younger men? A cohort-based analysis. Quarterly Journal of Economics, 116(2), 705-746.
Central Intelligence Agency. (2014). Languages. In The world factbook. Retrieved from https://www.cia.gov/library/publications/the-world-factbook/fields/2098.html, (accessed May 25, 2014).
Chiswick, B. R. (1978). The effect of Americanization on the earnings of foreign-born men. Journal of Political Economy, 86(5), 897.
Deming, D. J. (forthcoming). The growing importance of social skills in the labor market. Quarterly Journal of Economics.
Ebenstein, A., Harrison, A., McMillan, M., & Phillips, S. (2014). Estimating the Impact of Trade and Offshoring on American Workers using the Current Population Surveys. The Review of Economics and Statistics, 96(4), 581-595.
Fitzenberger, B., & Kohn, K. (2006). Skill wage premia, employment, and cohort effects: Are workers in Germany all of the same type?. University of Freiburg Working Paper
Foged, M., & Peri, G. (2013). Immigrants' and native workers: New analysis on longitudinal data. NBER Working Paper No. 1931. National Bureau of Economic Research, Inc.
Furtado, D., & Song, T. (2015). Intermarriage and socioeconomic integration: Trends in earnings premiums among U.S. immigrants who marry natives. The ANNALS of the American Academy of Political and Social Science, 662(1), 207-222.
31
Furtado, D., & Theodoropoulos, N. (2009). I'll marry you if you get me a job: Marital assimilation and immigrant employment rates. International Journal of Manpower 30 (1-2): 116-26.
Glaeser, E., Cutler, D., & Vigdor, J. (2008). Is the melting pot still hot? Explaining the resurgence of immigrant segregation. Review of Economics and Statistics, 90(3), 478-497.
Katz, L. F., & Murphy, K. M. (1992). Changes in relative wages, 1963-1987: Supply and demand factors. Quarterly Journal of Economics, 107(1), 35.
Lazear, E. (1999). Culture and Language. Journal of Political Economy, 107(S6), S95-S126.
Lessem, R., & Sanders, C. (2013). Decomposing the native-immigrant wage gap in the United States. 2013 Meeting Papers No. 19206. Society for Economic Dynamics.
Lewis, E. (2013). Immigrant-native substitutability and the role of language. In Immigration, Poverty, and Socioeconomic Inequality. Card D. and Raphael S. eds., New York: Russell Sage Foundation.
Lu, Y., & Ng, T. (2013). Import competition and skill content in U.S. Manufacturing industries. Review of Economics and Statistics, 95(4), 1404-1417
Orrenius, P. & Zavodny, M. (2010). Immigrants' employment outcomes over the business cycle. IZA DP 5354. IDEAS Working Paper Series from RePEc
Peri, G., & Sparber, C. (2009). Task specialization, immigration, and wages. American Economic Journal, 1(3), 135-169.
Plunkert, L. M. (1990). The 1980's: A decade of job growth and industry shifts. Monthly Labor Review, 113(9), 3.
RobotShop Distribution Inc. (2008). History of robotics: timeline. (2008). Retrieved from http://www.robotshop.com/media/files/PDF/timeline.pdf
Ruggles, J. S., Alexander, T., Genadek, K., Goeken R., Schroeder, M. B. and Sobek M. (2010) Integrated Public Use Microdata Series: Version 5.0 [Machine-readable database]. Minneapolis: University of Minnesota.
U.S. Bureau of Economic Analysis (2016), “Gross-Domestic-Product-(GDP)-by-Industry Data Table”, http://www.bea.gov/industry/gdpbyind_data.htm (accessed April 2, 2016).
32
U.S. Census Bureau; Census 2000, Summary File 3, Table PCT019; generated by Tian Lou and Tao Song, using American FactFinder, http://factfinder2.census.gov, (accessed 10 May, 2016)
Vigdor, J.L. (2015). The civic and cultural assimilation of immigrants to the United States. In Immigration: From Social Science to Public Policy. Powell B. ed., Oxford University Press.
Wallén, J. (2008). The History of the Industrial Robot. Technical report from Automatic Control at Linköpings universitet. LiTH-ISY-R, 2008.
33
Figures and Tables
Figure 1. Average native-immigrant relative wages, 1960 – 2010
Notes: Simple average native-immigrant relative log hourly wages between 1960 and 2010. Sources: The sample consists of 5% sample of 1960 Census, merged 2 version of 1% metro samples of 1970 Census, 5% sample of 1980 Census, 5% sample of 1990 Census, 5% sample of 2000 Census, and the 2008 – 2010 3-year sample of American Community Survey.
.97
1.01
1.05
1.09
1.13
Nat
ive-
Imm
igra
nt R
elat
ive
Wag
e
1960 1970 1980 1990 2000 2010Year
34
Figure 2. Technology boom – Share of IT industries output in GDP
Sources: Share of IT industries output in GDP is calculated from the “Gross-Domestic-Product-(GDP)-by-Industry Data” Table from U.S. Bureau of Economic Analysis. Key technology events are referenced from Card and DiNardo (2002), Wallén (2008), and RobotShop Distribution Inc. (2008).
35
Figure 3. Routine employment share by MSA
Notes: MSA level routine employment share in 1970 is calculated from the merged two versions of 1% samples of 1970 Census. Darker colors represent higher routine employment share. The routine occupations classification is referenced from Autor and Dorn (2013) and categorized as follows: administrative support, retail sales, precision production, craft workers, machine operators, and assemblers are routine intensive occupations; while managers, technicians, financiers, public safety, transportation, construction, mining professions, farmers, and service occupations are considered non-routine occupations. This grouping method is developed through a procedure where the authors merge job task requirements from the fourth edition of the US Department of Labor’s Dictionary of Occupational Titles (DOT) to the corresponding Census occupation classifications to measure each occupation’s routine intensity, and then separate routine intensive occupations from non-routine intensive occupations accordingly. Data is not available in the 1970 sample for the MSAs marked in grey and in Alaska. Figure is created using Mapline®.

36
Table 1 – Native-immigrant wage gaps descriptive statistics, 1980 – 2000 Unadj. Δ N-I Wage Gap SE Adj. Δ N-I Wge Gap SE Overall Sample 0.096 0.010 0.035 0.002 High school drop outs 0.083 0.023 0.073 0.003 High school diploma 0.114 0.023 0.042 0.003 Some college 0.123 0.017 0.023 0.004 At least college degree 0.066 0.021 0.003 0.003
Notes: The sample consists of employed male workers between the ages of 18 and 64, who are not in school and work full time full year, reside in an identifiable metropolitan area, and earn an hourly wage between $2 and $200 in 1999 dollars. The unadjusted wage gap is the change in average inflation adjusted wage gap between 1980 and 2000, and the adjusted wage gap is regression adjusted using age and age squared, education level controls, and race group controls. SE are standard errors obtained from regressing the wage gap against a constant. Table 2 – Routine employment share and changes in low skill service employment and in routine employment, 1980 – 2000
RSharec, 1970 RShareec, 1970
Δ Low skill service employment share 0.272***
(0.023) 0.007*
(0.004)
Δ Routine employment share -0.668***
(0.038) -0.018**
(0.008) Notes: The sample consists of employed male workers between the ages of 18 and 64, who are not in school and work full time full year, and reside in an identifiable metropolitan area. Dependent variables are change in low skill service employment share from 1980 to 2000 and change in routine employment share from 1980 to 2000. RSharec, 1970 is routine employment share by MSA in 1970, RShareec, 1970 is routine employment share by MSA-education group in 1970. Statistical significance levels are noted by the following: * significant at 10 percent; ** significant at 5 percent; *** significant at 1 percent. Table 3 – Top and bottom five MSAs by routine employment share
Top 5 Bottom 5 Jersey City, NJ Las Vegas, NV Wilkes-Barre-Hazelton, PA Salinas-Sea Side-Monterey, CA Lorain-Elyria, OH Santa Barbara-Santa Maria-Lompoc, CA Reading, PA Fresno, CA York, PA West Palm Beach-Boca Raton-Delray Beach, FL
Notes: The sample consists of employed male workers between the ages of 18 and 64, who are not in school and work full time full year, reside in an identifiable metropolitan area, and earn an hourly wage between $2 and $200 in 1999 dollars.
37
Table 4 – Descriptive statistics 1980 2000 Native Immigrant Native Immigrant
Age 39.18 39.58 39.52 38.66 Log hourly wage 2.86 2.64 2.86 2.53 Less than high school 19.29 42.75 9.22 35.52 High school 37.49 23.88 32.47 25.41 Some college 18.67 12.87 28.68 17.91 College degree or more 24.55 20.50 29.63 21.16 White 89.45 85.00 90.16 80.64 Black 9.38 3.34 8.50 3.71 Asian 0.71 11.03 0.82 15.25 Hispanic 3.51 43.57 4.19 54.32 Number of observations 1,255,808 91,817 1,192,503 144,391
Notes: The sample consists of employed male workers between the ages of 18 and 64, who are not in school and work full time full year, reside in an identifiable metropolitan area, and earn an hourly wage between $2 and $200 in 1999 dollars. Table 5 – Routine employment share and change in native-immigrant adjusted wage gaps within MSA-education groups, 1980–2000
Dependent Variable: Δ N-I Wage Gap (1) (2) (3) (4)
RShareec, 1970 0.115*** (0.010)
0.121*** (0.009)
0.123*** (0.009)
0.056*** (0.014)
Compositional controls No Yes Yes Yes State FE controls No No Yes Yes Industry mix controls No No No Yes R2 0.283 0.308 0.373 0.403 Observations 469 469 469 469
Notes: The sample consists of employed male workers between the ages of 18 and 64, who are not in school and work full time full year, reside in an identifiable metropolitan area, and earn an hourly wage between $2 and $200 in 1999 dollars. Δ N-I Wage Gap is the change in wage gap that is regression adjusted using age and age squared, education level controls, and race group controls. RShareec, 1970 is routine employment share by MSA and education group in 1970. Compositional controls include share of Hispanic workers, share of black workers, unemployment rate and size of immigrants along with its square form. State FE controls are state fixed effect dummies. Industry mix controls refer to shares of employment in durable and nondurable manufacturing industries, and shares of employment in high skill and low skill service sectors. The impact of the four sector share variables is allowed to vary by broad education group, which is defined as at least some college education versus high school graduates. Statistical significance levels are noted by the following: * significant at 10 percent; ** significant at 5 percent; *** significant at 1 percent. Heteroskedasticity-robust standard errors that are clustered on MSA level are shown in brackets.
38
Table 6 – Routine employment share and change in low skill immigrant share, change in high skill native born share, and change in college/high school relative wages within MSAs, 1980–2000
(1) (2) (3)
Dependent Variable Δ Low Skill Immi. Share Δ High Skill Native Share Δ College/High School Relative Wage
RSharec, 1970† 0.023
(0.394) 0.319
(0.236) 0.016**
(0.008) R2 0.549 0.598 0.869 Observations 118 118 118
Notes: The sample consists of employed male workers between the ages of 18 and 64, who are not in school and work full time full year, reside in an identifiable metropolitan area, and earn an hourly wage between $2 and $200 in 1999 dollars. Wage gaps are regression adjusted using age and age squared, education level controls, and race group controls. Individuals with at most a high school degree are considered low skilled, and individuals with at least some college degree are considered high skilled. Compositional controls, industry mix controls, state fixed effect dummies are included in the model specification. Statistical significance levels are noted by the following: * significant at 10 percent; ** significant at 5 percent; *** significant at 1 percent. Heteroskedasticity-robust standard errors that are clustered on MSA level are shown in brackets. †: I use RSharec, 1970 instead of RShareec, 1970 for the regressions in this table, as there is only one observation of each dependent variable in each MSA. Table 7 – Routine employment share and change in native-immigrant adjusted wage gaps (separated by immigrants’ English language skills) and change in proficient-poor English speaking immigrant wage gaps within MSA-education groups, 1980–2000 (Panel A: Adjusted native-immigrant wage gaps are separately estimated by immigrants’ English speaking skills. Panel B: Adjusted native-immigrant wage gaps between proficient and poor English speaking immigrants)
A. Wage Gaps between Natives and
Immigrants of Different English Speaking Skills
B. Wage Gaps between Proficient and Poor English Speaking
Immigrants
Non-
English Country
English Country
Poor English Speaker
Proficient English Speaker
Proficient versus Poor English speakers
RShareec, 1970 0.056*** (0.014)
-0.042*** (0.023)
0.088*** (0.036)
0.040*** (0.008) 0.074***
(0.032) R2 0.403 0.162 0.266 0.588 0.239 Observations 469 443 459 463 459
Notes: The sample consists of employed male workers between the ages of 18 and 64, who are not in school and work full time full year, reside in an identifiable metropolitan area, and earn an hourly wage between $2 and $200 in 1999 dollars. Wage gaps are regression adjusted using age and age squared, education level controls, and race group controls. Immigrants who self-identify as speaking English well or very well are defined as proficient English speakers. Immigrants who self-identify as speaking English poor or not at all are defined as poor English speakers. RShareec,
1970 is routine employment share by MSA and education group in 1970. Compositional controls, industry mix controls, state fixed effect dummies are included in the model specification. Statistical significance levels are noted by the following: * significant at 10 percent; ** significant at 5 percent; *** significant at 1 percent. Heteroskedasticity-robust standard errors that are clustered on MSA level are shown in brackets.
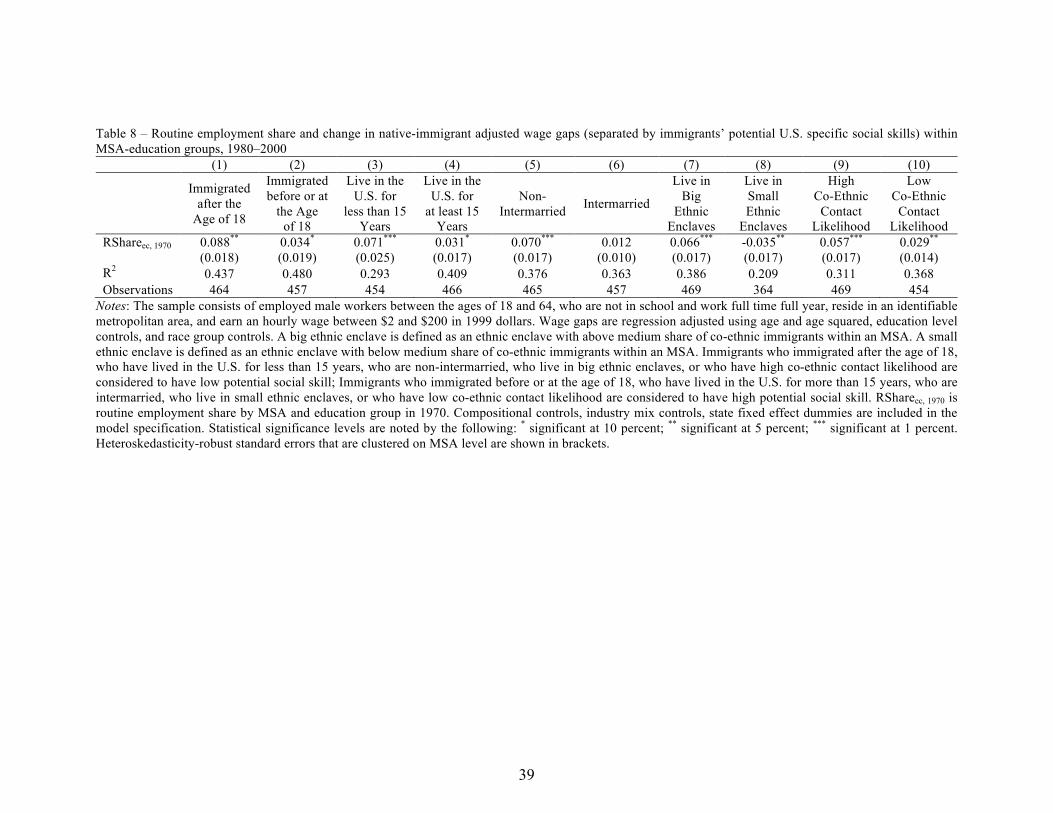
39
Table 8 – Routine employment share and change in native-immigrant adjusted wage gaps (separated by immigrants’ potential U.S. specific social skills) within MSA-education groups, 1980–2000
(1) (2) (3) (4) (5) (6) (7) (8) (9) (10) Immigrated
after the Age of 18
Immigrated before or at
the Age of 18
Live in the U.S. for
less than 15 Years
Live in the U.S. for
at least 15 Years
Non-Intermarried Intermarried
Live in Big
Ethnic Enclaves
Live in Small Ethnic
Enclaves
High Co-Ethnic
Contact Likelihood
Low Co-Ethnic
Contact Likelihood
RShareec, 1970 0.088** (0.018)
0.034* (0.019)
0.071*** (0.025)
0.031* (0.017)
0.070*** (0.017)
0.012 (0.010)
0.066*** (0.017)
-0.035** (0.017)
0.057*** (0.017)
0.029** (0.014)
R2 0.437 0.480 0.293 0.409 0.376 0.363 0.386 0.209 0.311 0.368 Observations 464 457 454 466 465 457 469 364 469 454
Notes: The sample consists of employed male workers between the ages of 18 and 64, who are not in school and work full time full year, reside in an identifiable metropolitan area, and earn an hourly wage between $2 and $200 in 1999 dollars. Wage gaps are regression adjusted using age and age squared, education level controls, and race group controls. A big ethnic enclave is defined as an ethnic enclave with above medium share of co-ethnic immigrants within an MSA. A small ethnic enclave is defined as an ethnic enclave with below medium share of co-ethnic immigrants within an MSA. Immigrants who immigrated after the age of 18, who have lived in the U.S. for less than 15 years, who are non-intermarried, who live in big ethnic enclaves, or who have high co-ethnic contact likelihood are considered to have low potential social skill; Immigrants who immigrated before or at the age of 18, who have lived in the U.S. for more than 15 years, who are intermarried, who live in small ethnic enclaves, or who have low co-ethnic contact likelihood are considered to have high potential social skill. RShareec, 1970 is routine employment share by MSA and education group in 1970. Compositional controls, industry mix controls, state fixed effect dummies are included in the model specification. Statistical significance levels are noted by the following: * significant at 10 percent; ** significant at 5 percent; *** significant at 1 percent. Heteroskedasticity-robust standard errors that are clustered on MSA level are shown in brackets.
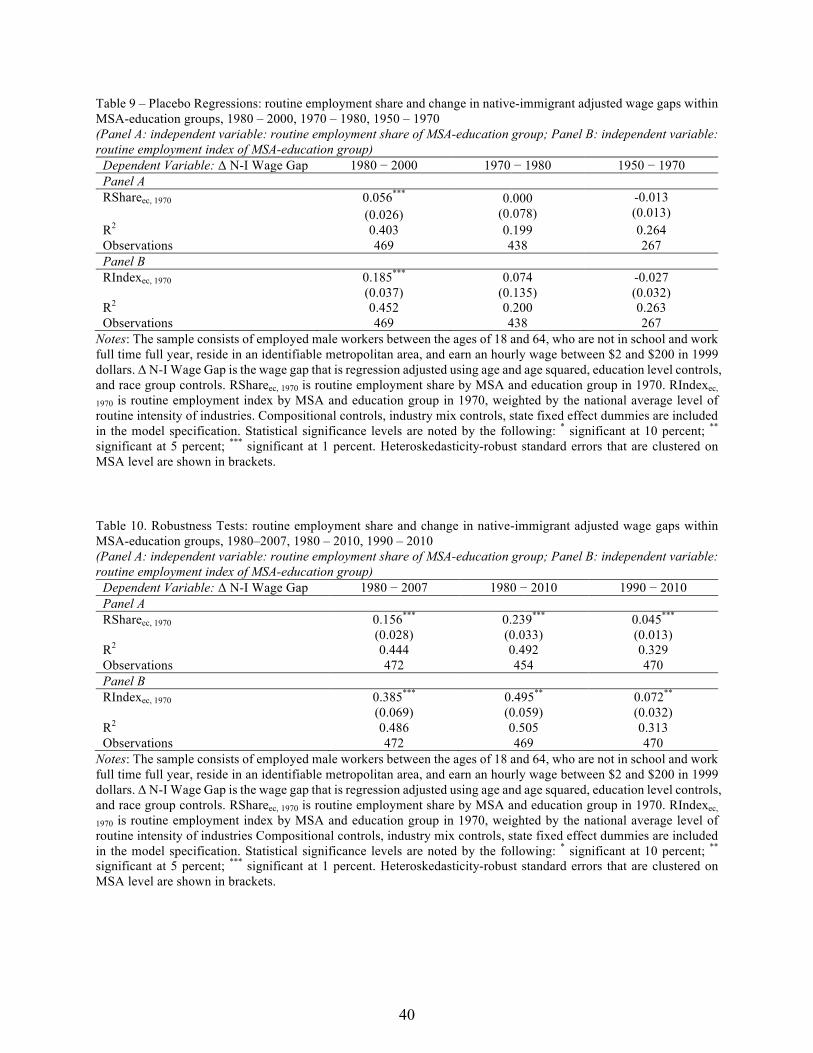
40
Table 9 – Placebo Regressions: routine employment share and change in native-immigrant adjusted wage gaps within MSA-education groups, 1980 – 2000, 1970 – 1980, 1950 – 1970 (Panel A: independent variable: routine employment share of MSA-education group; Panel B: independent variable: routine employment index of MSA-education group)
Dependent Variable: Δ N-I Wage Gap 1980 − 2000 1970 − 1980 1950 − 1970 Panel A RShareec, 1970 0.056***
(0.026) 0.000
(0.078) -0.013 (0.013)
R2 0.403 0.199 0.264 Observations 469 438 267 Panel B RIndexec, 1970 0.185***
(0.037) 0.074
(0.135) -0.027 (0.032)
R2 0.452 0.200 0.263 Observations 469 438 267
Notes: The sample consists of employed male workers between the ages of 18 and 64, who are not in school and work full time full year, reside in an identifiable metropolitan area, and earn an hourly wage between $2 and $200 in 1999 dollars. Δ N-I Wage Gap is the wage gap that is regression adjusted using age and age squared, education level controls, and race group controls. RShareec, 1970 is routine employment share by MSA and education group in 1970. RIndexec,
1970 is routine employment index by MSA and education group in 1970, weighted by the national average level of routine intensity of industries. Compositional controls, industry mix controls, state fixed effect dummies are included in the model specification. Statistical significance levels are noted by the following: * significant at 10 percent; ** significant at 5 percent; *** significant at 1 percent. Heteroskedasticity-robust standard errors that are clustered on MSA level are shown in brackets. Table 10. Robustness Tests: routine employment share and change in native-immigrant adjusted wage gaps within MSA-education groups, 1980–2007, 1980 – 2010, 1990 – 2010 (Panel A: independent variable: routine employment share of MSA-education group; Panel B: independent variable: routine employment index of MSA-education group)
Dependent Variable: Δ N-I Wage Gap 1980 − 2007 1980 − 2010 1990 − 2010 Panel A RShareec, 1970 0.156***
(0.028) 0.239*** (0.033)
0.045*** (0.013)
R2 0.444 0.492 0.329 Observations 472 454 470 Panel B RIndexec, 1970 0.385***
(0.069) 0.495** (0.059)
0.072** (0.032)
R2 0.486 0.505 0.313 Observations 472 469 470
Notes: The sample consists of employed male workers between the ages of 18 and 64, who are not in school and work full time full year, reside in an identifiable metropolitan area, and earn an hourly wage between $2 and $200 in 1999 dollars. Δ N-I Wage Gap is the wage gap that is regression adjusted using age and age squared, education level controls, and race group controls. RShareec, 1970 is routine employment share by MSA and education group in 1970. RIndexec,
1970 is routine employment index by MSA and education group in 1970, weighted by the national average level of routine intensity of industries Compositional controls, industry mix controls, state fixed effect dummies are included in the model specification. Statistical significance levels are noted by the following: * significant at 10 percent; ** significant at 5 percent; *** significant at 1 percent. Heteroskedasticity-robust standard errors that are clustered on MSA level are shown in brackets.


![Global Elem WB Print and Work (With Key) [Shrunk]](https://img.dokumen.tips/doc/110x75/55cf9251550346f57b9583ae/global-elem-wb-print-and-work-with-key-shrunk.jpg)


![Global Elementary SB Intro-Unit 4 [Shrunk]](https://img.dokumen.tips/doc/110x75/55cf9033550346703ba3d653/global-elementary-sb-intro-unit-4-shrunk.jpg)


![1300 Edi Full Aug 2006 First Part[Shrunk+]](https://img.dokumen.tips/doc/110x75/54565d48b1af9fa30c8b4675/1300-edi-full-aug-2006-first-partshrunk.jpg)


![NewHeadWay Academic Skills Level 1 TG [Shrunk]](https://img.dokumen.tips/doc/110x75/577cd9301a28ab9e78a2f077/newheadway-academic-skills-level-1-tg-shrunk.jpg)
![Global_Begin_WB_-_Print_and_Work_(with_key) [shrunk].pdf](https://img.dokumen.tips/doc/110x75/577c7a721a28abe054953711/globalbeginwb-printandworkwithkey-shrunkpdf.jpg)
![A Way With Words 3 [Shrunk]](https://img.dokumen.tips/doc/110x75/55cf85f3550346484b930aae/a-way-with-words-3-shrunk.jpg)


![Global Pre-int TB Intro [shrunk].pdf](https://img.dokumen.tips/doc/110x75/577c776b1a28abe0548c0189/global-pre-int-tb-intro-shrunkpdf.jpg)


![Global Intermediate SB Intro-Unit 4 [Shrunk]](https://img.dokumen.tips/doc/110x75/5530570c4a79598f328b46ff/global-intermediate-sb-intro-unit-4-shrunk.jpg)
![NHW Academic Skills Level 3 TG [Shrunk]](https://img.dokumen.tips/doc/110x75/577cd8a81a28ab9e78a1ab05/nhw-academic-skills-level-3-tg-shrunk.jpg)