Embed Size (px)
Citation preview

Homer1a is a core brain molecular correlateof sleep lossStephanie Maret*, Stephane Dorsaz*, Laure Gurcel*, Sylvain Pradervand†, Brice Petit*, Corinne Pfister*,Otto Hagenbuchle†, Bruce F. O’Hara‡, Paul Franken*, and Mehdi Tafti*§
*Center for Integrative Genomics and †Lausanne DNA Array Facility, University of Lausanne, Genopode, CH-1015 Lausanne, Switzerland; and ‡Departmentof Biology, University of Kentucky, Lexington, KY 40506-0225
Communicated by Michael Rosbash, Brandeis University, Waltham, MA, October 24, 2007 (received for review October 15, 2007)
Sleep is regulated by a homeostatic process that determines its needand by a circadian process that determines its timing. By using sleepdeprivation and transcriptome profiling in inbred mouse strains, weshow that genetic background affects susceptibility to sleep loss atthe transcriptional level in a tissue-dependent manner. In the brain,Homer1a expression best reflects the response to sleep loss. Time-course gene expression analysis suggests that 2,032 brain transcriptsare under circadian control. However, only 391 remain rhythmic whenmice are sleep-deprived at four time points around the clock, sug-gesting that most diurnal changes in gene transcription are, in fact,sleep–wake-dependent. By generating a transgenic mouse line, weshow that in Homer1-expressing cells specifically, apart fromHomer1a, three other activity-induced genes (Ptgs2, Jph3, and Nptx2)are overexpressed after sleep loss. All four genes play a role inrecovery from glutamate-induced neuronal hyperactivity. The consis-tent activation of Homer1a suggests a role for sleep in intracellularcalcium homeostasis for protecting and recovering from the neuronalactivation imposed by wakefulness.
homeostasis � microarray � mRNA tagging � sleep deprivation �sleep function
Two main processes regulate sleep. A homeostatic processregulates sleep need and intensity according to the time
spent awake or asleep. A circadian process regulates the appro-priate timing of sleep and wakefulness across the 24-h day. Ahighly reliable index of the homeostatic process is provided bythe amplitude and prevalence of delta (1- to 4-Hz) oscillationsin the electroencephalogram (EEG) of nonrapid eye movement(NREM) sleep (hereafter, ‘‘delta power’’). Delta power is highat sleep onset and decreases during sleep, in parallel with sleepdepth. Sleep deprivations and naps induce a predictable increaseor decrease, respectively, in delta power during subsequentsleep. The interaction between homeostatic and circadian pro-cesses is mathematically described in the two-process model ofsleep regulation, which provides a framework for prediction andinterpretation of a large body of experimental data (1).
Among hypotheses concerning the physiological function ofwaking-induced changes in sleep, the most compelling suggests thatsleep plays a key role in synaptic plasticity (2, 3). More specifically,EEG delta power during NREM sleep has been shown to play acritical role in learning-induced plasticity (4–6). In general, theprediction is that local neural activation due to specific behavioral(cognitive) demands imposes a burden on the brain which neces-sitates sleep and which is reflected by the EEG delta power.
On the basis of mathematical modeling and experimental data,we have shown that sleep need, as indexed by the EEG delta power,is under genetic control (7), which is of direct relevance forexplaining the interindividual vulnerability to sleep loss in humansubjects (8, 9). However, deciphering the molecular bases of sleepneed is rendered difficult because the contributions of the homeo-static and circadian processes are difficult to separate and becausethe impact of genetic background on brain gene expression is poorlyunderstood. From a series of gene-profiling experiments, we herereport a comprehensive transcriptome analysis that specifically
takes these interacting factors into account. We show that short-term sleep loss induces changes in brain gene expression for a fewgenes only. These genes are all part of a highly specific pathwayinvolved in neuronal protection and recovery after waking-inducedglutamate overstimulation.
ResultsWe have previously reported (7) that the dynamics of sleep needvaries strongly among inbred mouse strains, with AKR/J (AK) miceshowing a dramatic increase in delta power after 6-h sleep depri-vation, whereas DBA/2J (D2) mice have a blunted response.Through quantitative linkage analysis, a significant quantitativetrait locus (QTL) was identified on mouse chromosome 13 (Dps1:delta power in slow-wave sleep 1) that explains �50% of variancein delta power after sleep deprivation in BXD recombinant inbredlines (RIs) derived from inbred mouse strains C57BL/6J (B6) andD2 (7). The best polymorphic marker associated was D13Mit126 at46.5 cM (95% CI � 25 cM), suggesting a large QTL region (�38Mb). However, based on the most recent high-resolution, single-nucleotide polymorphism (SNP) genetic map of BXD RIs (10)(http://gscan.well.ox.ac.uk/gs/strains.cgi), the smallest differentialregion corresponds to an 11-Mb sequence flanked by SNPsrs3669221 and rs397202. According to the Ensemble database (Musmusculus release 46), this region contains 33 known genes, 15potential unknown coding sequences, and three pseudogenes.Among these, the short splice variant of the Homer1 (Homer1a)gene is the only transcript in the region that was previously reportedto be among the up-regulated genes after sleep deprivation (11–14).However, the specificity of this finding, compared with other geneexpression changes after sleep loss, has not yet been established.
To confirm and verify whether differences in sleep need betweenmouse strains are regulated at the transcriptional level, mice ofthree genotypes (AK, B6, and D2) were deprived of sleep by gentlehandling [see supporting information (SI) Materials and Methods]for 6 h, starting at light onset, and killed at the same time of day[Zeitgeber time (ZT)6] with their non-sleep-deprived controls.Because it is believed that sleep fulfills a brain-specific function, wealso sampled the liver as a peripheral reference organ. Microarrayresults were analyzed by a two-way ANOVA, with strain andcondition as main factors. Venn diagrams summarizing the data areshown in Fig. 1 A and B and suggest that very few genes showconsistent changes in expression across genetic backgrounds. Weuse the terms ‘‘consistent’’ and ‘‘reliable’’ hereafter only for tran-
Author contributions: S.D. and L.G. contributed equally to this work; O.H., P.F., and M.T.designed research; S.M., S.D., L.G., B.P., C.P., O.H., and B.F.O. performed research; S.M., S.D.,L.G., S.P., B.F.O., P.F., and M.T. analyzed data; and S.M., S.D., L.G., S.P., P.F., and M.T. wrotethe paper
The authors declare no conflict of interest.
Data deposition: The data reported in this paper have been deposited in the GeneExpression Omnibus (GEO) database, www.ncbi.nlm.nih.gov/geo (accession no. GSE9444).
§To whom correspondence should be addressed. E-mail: [email protected].
This article contains supporting information online at www.pnas.org/cgi/content/full/0710131104/DC1.
© 2007 by The National Academy of Sciences of the USA
20090–20095 � PNAS � December 11, 2007 � vol. 104 � no. 50 www.pnas.org�cgi�doi�10.1073�pnas.0710131104
scripts either increased or decreased in all three inbred strains andacross experimental conditions.
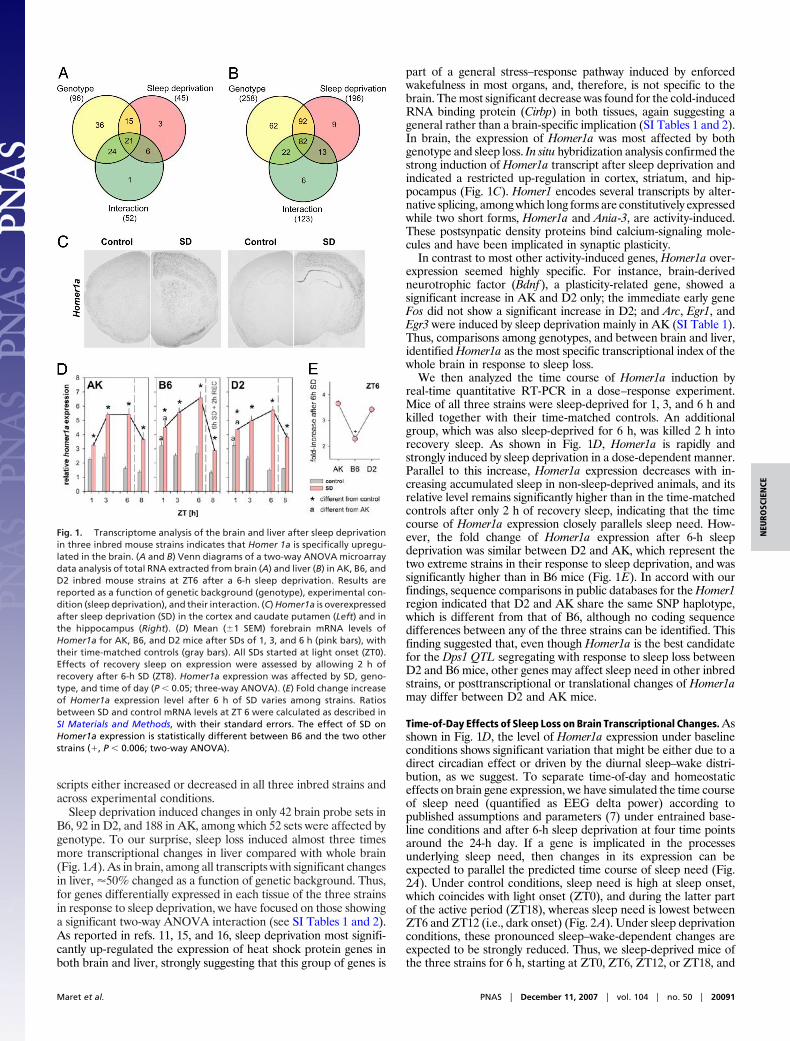
Sleep deprivation induced changes in only 42 brain probe sets inB6, 92 in D2, and 188 in AK, among which 52 sets were affected bygenotype. To our surprise, sleep loss induced almost three timesmore transcriptional changes in liver compared with whole brain(Fig. 1A). As in brain, among all transcripts with significant changesin liver, �50% changed as a function of genetic background. Thus,for genes differentially expressed in each tissue of the three strainsin response to sleep deprivation, we have focused on those showinga significant two-way ANOVA interaction (see SI Tables 1 and 2).As reported in refs. 11, 15, and 16, sleep deprivation most signifi-cantly up-regulated the expression of heat shock protein genes inboth brain and liver, strongly suggesting that this group of genes is
part of a general stress–response pathway induced by enforcedwakefulness in most organs, and, therefore, is not specific to thebrain. The most significant decrease was found for the cold-inducedRNA binding protein (Cirbp) in both tissues, again suggesting ageneral rather than a brain-specific implication (SI Tables 1 and 2).In brain, the expression of Homer1a was most affected by bothgenotype and sleep loss. In situ hybridization analysis confirmed thestrong induction of Homer1a transcript after sleep deprivation andindicated a restricted up-regulation in cortex, striatum, and hip-pocampus (Fig. 1C). Homer1 encodes several transcripts by alter-native splicing, among which long forms are constitutively expressedwhile two short forms, Homer1a and Ania-3, are activity-induced.These postsynpatic density proteins bind calcium-signaling mole-cules and have been implicated in synaptic plasticity.
In contrast to most other activity-induced genes, Homer1a over-expression seemed highly specific. For instance, brain-derivedneurotrophic factor (Bdnf), a plasticity-related gene, showed asignificant increase in AK and D2 only; the immediate early geneFos did not show a significant increase in D2; and Arc, Egr1, andEgr3 were induced by sleep deprivation mainly in AK (SI Table 1).Thus, comparisons among genotypes, and between brain and liver,identified Homer1a as the most specific transcriptional index of thewhole brain in response to sleep loss.
We then analyzed the time course of Homer1a induction byreal-time quantitative RT-PCR in a dose–response experiment.Mice of all three strains were sleep-deprived for 1, 3, and 6 h andkilled together with their time-matched controls. An additionalgroup, which was also sleep-deprived for 6 h, was killed 2 h intorecovery sleep. As shown in Fig. 1D, Homer1a is rapidly andstrongly induced by sleep deprivation in a dose-dependent manner.Parallel to this increase, Homer1a expression decreases with in-creasing accumulated sleep in non-sleep-deprived animals, and itsrelative level remains significantly higher than in the time-matchedcontrols after only 2 h of recovery sleep, indicating that the timecourse of Homer1a expression closely parallels sleep need. How-ever, the fold change of Homer1a expression after 6-h sleepdeprivation was similar between D2 and AK, which represent thetwo extreme strains in their response to sleep deprivation, and wassignificantly higher than in B6 mice (Fig. 1E). In accord with ourfindings, sequence comparisons in public databases for the Homer1region indicated that D2 and AK share the same SNP haplotype,which is different from that of B6, although no coding sequencedifferences between any of the three strains can be identified. Thisfinding suggested that, even though Homer1a is the best candidatefor the Dps1 QTL segregating with response to sleep loss betweenD2 and B6 mice, other genes may affect sleep need in other inbredstrains, or posttranscriptional or translational changes of Homer1amay differ between D2 and AK mice.
Time-of-Day Effects of Sleep Loss on Brain Transcriptional Changes. Asshown in Fig. 1D, the level of Homer1a expression under baselineconditions shows significant variation that might be either due to adirect circadian effect or driven by the diurnal sleep–wake distri-bution, as we suggest. To separate time-of-day and homeostaticeffects on brain gene expression, we have simulated the time courseof sleep need (quantified as EEG delta power) according topublished assumptions and parameters (7) under entrained base-line conditions and after 6-h sleep deprivation at four time pointsaround the 24-h day. If a gene is implicated in the processesunderlying sleep need, then changes in its expression can beexpected to parallel the predicted time course of sleep need (Fig.2A). Under control conditions, sleep need is high at sleep onset,which coincides with light onset (ZT0), and during the latter partof the active period (ZT18), whereas sleep need is lowest betweenZT6 and ZT12 (i.e., dark onset) (Fig. 2A). Under sleep deprivationconditions, these pronounced sleep–wake-dependent changes areexpected to be strongly reduced. Thus, we sleep-deprived mice ofthe three strains for 6 h, starting at ZT0, ZT6, ZT12, or ZT18, and
Fig. 1. Transcriptome analysis of the brain and liver after sleep deprivationin three inbred mouse strains indicates that Homer 1a is specifically upregu-lated in the brain. (A and B) Venn diagrams of a two-way ANOVA microarraydata analysis of total RNA extracted from brain (A) and liver (B) in AK, B6, andD2 inbred mouse strains at ZT6 after a 6-h sleep deprivation. Results arereported as a function of genetic background (genotype), experimental con-dition (sleep deprivation), and their interaction. (C) Homer1a is overexpressedafter sleep deprivation (SD) in the cortex and caudate putamen (Left) and inthe hippocampus (Right). (D) Mean (�1 SEM) forebrain mRNA levels ofHomer1a for AK, B6, and D2 mice after SDs of 1, 3, and 6 h (pink bars), withtheir time-matched controls (gray bars). All SDs started at light onset (ZT0).Effects of recovery sleep on expression were assessed by allowing 2 h ofrecovery after 6-h SD (ZT8). Homer1a expression was affected by SD, geno-type, and time of day (P � 0.05; three-way ANOVA). (E) Fold change increaseof Homer1a expression level after 6 h of SD varies among strains. Ratiosbetween SD and control mRNA levels at ZT 6 were calculated as described inSI Materials and Methods, with their standard errors. The effect of SD onHomer1a expression is statistically different between B6 and the two otherstrains (�, P � 0.006; two-way ANOVA).
Maret et al. PNAS � December 11, 2007 � vol. 104 � no. 50 � 20091
NEU
ROSC
IEN
CE
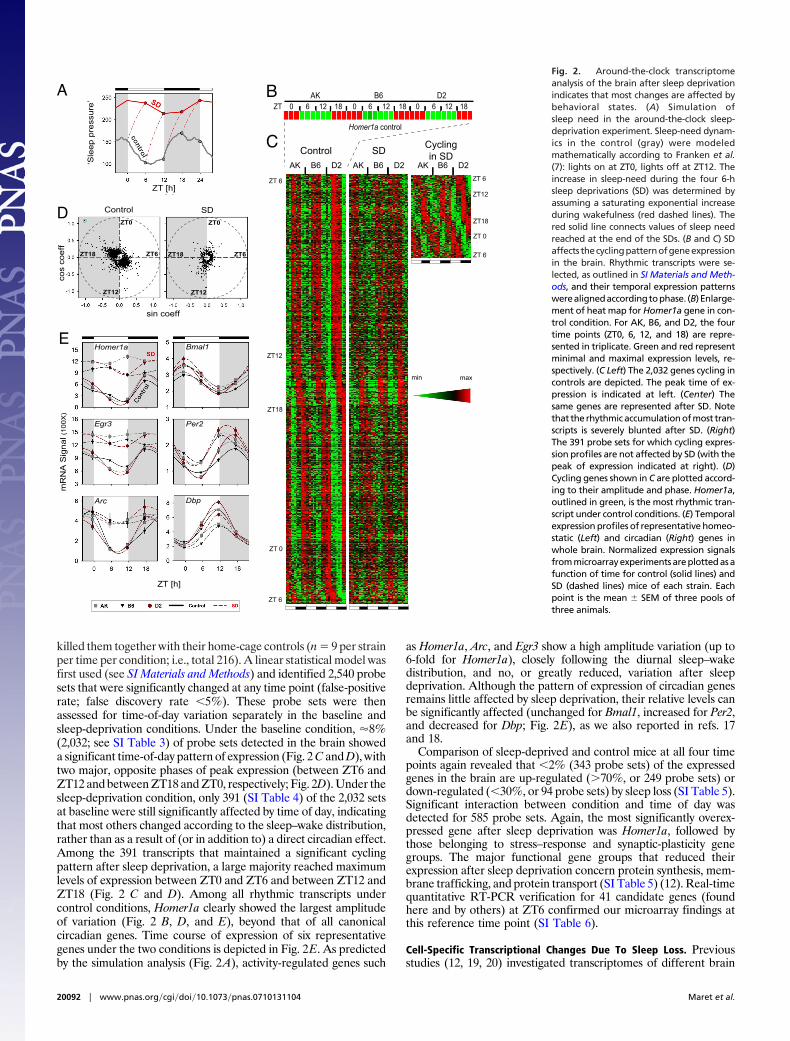
killed them together with their home-cage controls (n � 9 per strainper time per condition; i.e., total 216). A linear statistical model wasfirst used (see SI Materials and Methods) and identified 2,540 probesets that were significantly changed at any time point (false-positiverate; false discovery rate �5%). These probe sets were thenassessed for time-of-day variation separately in the baseline andsleep-deprivation conditions. Under the baseline condition, �8%(2,032; see SI Table 3) of probe sets detected in the brain showeda significant time-of-day pattern of expression (Fig. 2 C and D), withtwo major, opposite phases of peak expression (between ZT6 andZT12 and between ZT18 and ZT0, respectively; Fig. 2D). Under thesleep-deprivation condition, only 391 (SI Table 4) of the 2,032 setsat baseline were still significantly affected by time of day, indicatingthat most others changed according to the sleep–wake distribution,rather than as a result of (or in addition to) a direct circadian effect.Among the 391 transcripts that maintained a significant cyclingpattern after sleep deprivation, a large majority reached maximumlevels of expression between ZT0 and ZT6 and between ZT12 andZT18 (Fig. 2 C and D). Among all rhythmic transcripts undercontrol conditions, Homer1a clearly showed the largest amplitudeof variation (Fig. 2 B, D, and E), beyond that of all canonicalcircadian genes. Time course of expression of six representativegenes under the two conditions is depicted in Fig. 2E. As predictedby the simulation analysis (Fig. 2A), activity-regulated genes such
as Homer1a, Arc, and Egr3 show a high amplitude variation (up to6-fold for Homer1a), closely following the diurnal sleep–wakedistribution, and no, or greatly reduced, variation after sleepdeprivation. Although the pattern of expression of circadian genesremains little affected by sleep deprivation, their relative levels canbe significantly affected (unchanged for Bmal1, increased for Per2,and decreased for Dbp; Fig. 2E), as we also reported in refs. 17and 18.
Comparison of sleep-deprived and control mice at all four timepoints again revealed that �2% (343 probe sets) of the expressedgenes in the brain are up-regulated (�70%, or 249 probe sets) ordown-regulated (�30%, or 94 probe sets) by sleep loss (SI Table 5).Significant interaction between condition and time of day wasdetected for 585 probe sets. Again, the most significantly overex-pressed gene after sleep deprivation was Homer1a, followed bythose belonging to stress–response and synaptic-plasticity genegroups. The major functional gene groups that reduced theirexpression after sleep deprivation concern protein synthesis, mem-brane trafficking, and protein transport (SI Table 5) (12). Real-timequantitative RT-PCR verification for 41 candidate genes (foundhere and by others) at ZT6 confirmed our microarray findings atthis reference time point (SI Table 6).
Cell-Specific Transcriptional Changes Due To Sleep Loss. Previousstudies (12, 19, 20) investigated transcriptomes of different brain
ZT 0 6 12 18 0 6 12 18 0 6 12 18
Homer1a control
AK B6 D2
Control SDD
BA
E
ZT 6
ZT12
ZT18
ControlCyclingin SD
CAK B6 D2AK B6 D2AK B6 D2
min
SD
max
sin coeff
ffe
oc soc
ZT 0
ZT 6
ZT12
ZT18
ZT 0
ZT0
ZT6
ZT12
ZT18
ZT 6
ZT 6
ZT0
ZT6
ZT12
ZT18
’er
usser
p p
eel
S‘
ZT [h]
la
ngi
S A
NR
m)
X0
01(
ZT [h]
Homer1a
Egr3
Arc
Bmal1
Per2
Dbp
Fig. 2. Around-the-clock transcriptomeanalysis of the brain after sleep deprivationindicates that most changes are affected bybehavioral states. (A) Simulation ofsleep need in the around-the-clock sleep-deprivation experiment. Sleep-need dynam-ics in the control (gray) were modeledmathematically according to Franken et al.(7): lights on at ZT0, lights off at ZT12. Theincrease in sleep-need during the four 6-hsleep deprivations (SD) was determined byassuming a saturating exponential increaseduring wakefulness (red dashed lines). Thered solid line connects values of sleep needreached at the end of the SDs. (B and C) SDaffects thecyclingpatternofgeneexpressionin the brain. Rhythmic transcripts were se-lected, as outlined in SI Materials and Meth-ods, and their temporal expression patternswerealignedaccordingtophase. (B)Enlarge-ment of heat map for Homer1a gene in con-trol condition. For AK, B6, and D2, the fourtime points (ZT0, 6, 12, and 18) are repre-sented in triplicate. Green and red representminimal and maximal expression levels, re-spectively. (C Left) The 2,032 genes cycling incontrols are depicted. The peak time of ex-pression is indicated at left. (Center) Thesame genes are represented after SD. Notethat the rhythmic accumulation of most tran-scripts is severely blunted after SD. (Right)The 391 probe sets for which cycling expres-sion profiles are not affected by SD (with thepeak of expression indicated at right). (D)Cycling genes shown in C are plotted accord-ing to their amplitude and phase. Homer1a,outlined in green, is the most rhythmic tran-script under control conditions. (E) Temporalexpression profiles of representative homeo-static (Left) and circadian (Right) genes inwhole brain. Normalized expression signalsfrom microarray experiments are plotted as afunction of time for control (solid lines) andSD (dashed lines) mice of each strain. Eachpoint is the mean � SEM of three pools ofthree animals.
20092 � www.pnas.org�cgi�doi�10.1073�pnas.0710131104 Maret et al.
structures, rather than the whole brain. In contrast to most otherorgans, the brain is a highly heterogeneous tissue, with specializedregions and nuclei having very different functional roles. Whole-brain transcriptome, therefore, suffers several potential limitations,including dilution of low copy-number transcripts and missing thosewith opposing patterns of transcriptional changes among brainregions. On the other hand transcriptome analysis of selectedregions also has drawbacks because of our limited knowledge ofexactly where functionally significant molecular changes can beexpected and because, even in well defined regions, cell types varygreatly. To overcome these limitations, we chose to analyze changesin mRNA profiles of those neurons that are selectively and specif-ically activated by sleep deprivation. To this end, we used a modifiedmRNA tagging technique originally established in Caenorhabditiselegans and Drosophila (21–23).
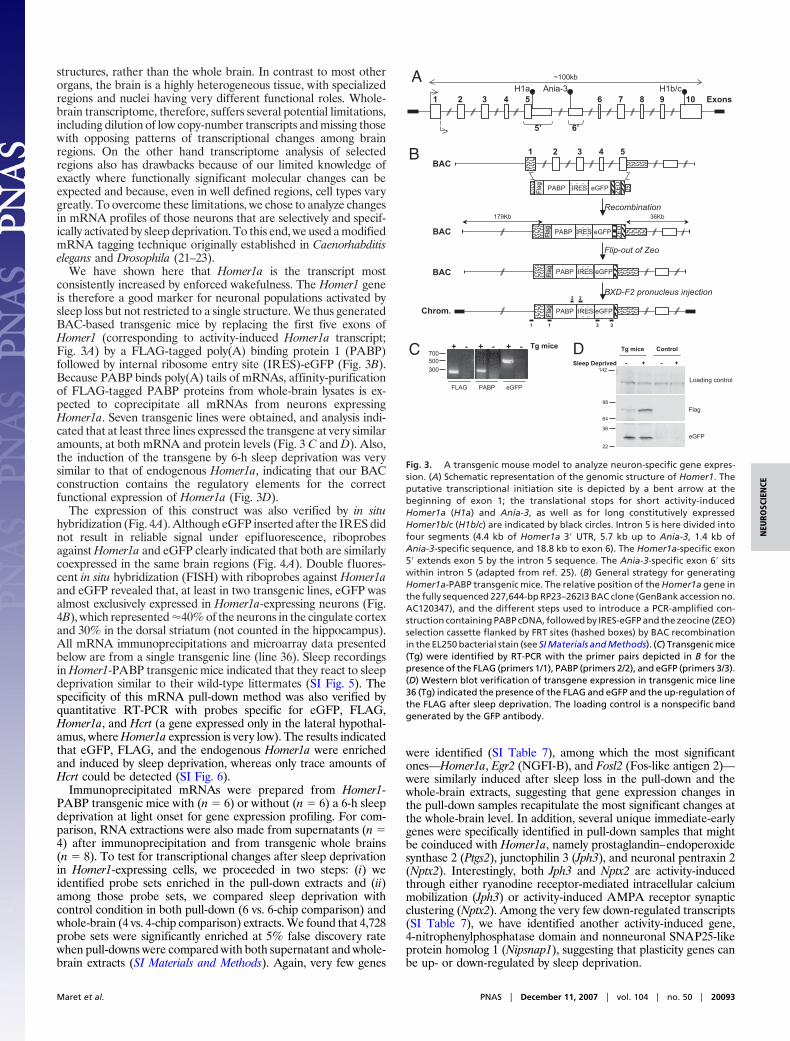
We have shown here that Homer1a is the transcript mostconsistently increased by enforced wakefulness. The Homer1 geneis therefore a good marker for neuronal populations activated bysleep loss but not restricted to a single structure. We thus generatedBAC-based transgenic mice by replacing the first five exons ofHomer1 (corresponding to activity-induced Homer1a transcript;Fig. 3A) by a FLAG-tagged poly(A) binding protein 1 (PABP)followed by internal ribosome entry site (IRES)-eGFP (Fig. 3B).Because PABP binds poly(A) tails of mRNAs, affinity-purificationof FLAG-tagged PABP proteins from whole-brain lysates is ex-pected to coprecipitate all mRNAs from neurons expressingHomer1a. Seven transgenic lines were obtained, and analysis indi-cated that at least three lines expressed the transgene at very similaramounts, at both mRNA and protein levels (Fig. 3 C and D). Also,the induction of the transgene by 6-h sleep deprivation was verysimilar to that of endogenous Homer1a, indicating that our BACconstruction contains the regulatory elements for the correctfunctional expression of Homer1a (Fig. 3D).
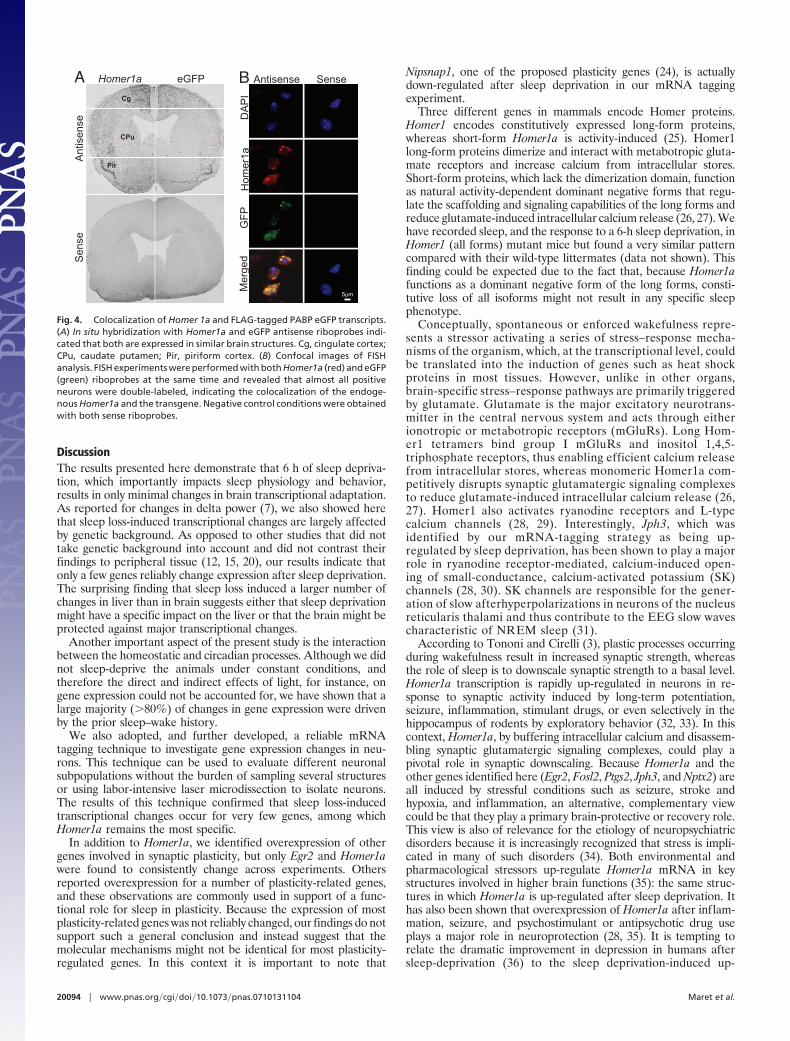
The expression of this construct was also verified by in situhybridization (Fig. 4A). Although eGFP inserted after the IRES didnot result in reliable signal under epifluorescence, riboprobesagainst Homer1a and eGFP clearly indicated that both are similarlycoexpressed in the same brain regions (Fig. 4A). Double fluores-cent in situ hybridization (FISH) with riboprobes against Homer1aand eGFP revealed that, at least in two transgenic lines, eGFP wasalmost exclusively expressed in Homer1a-expressing neurons (Fig.4B), which represented �40% of the neurons in the cingulate cortexand 30% in the dorsal striatum (not counted in the hippocampus).All mRNA immunoprecipitations and microarray data presentedbelow are from a single transgenic line (line 36). Sleep recordingsin Homer1-PABP transgenic mice indicated that they react to sleepdeprivation similar to their wild-type littermates (SI Fig. 5). Thespecificity of this mRNA pull-down method was also verified byquantitative RT-PCR with probes specific for eGFP, FLAG,Homer1a, and Hcrt (a gene expressed only in the lateral hypothal-amus, where Homer1a expression is very low). The results indicatedthat eGFP, FLAG, and the endogenous Homer1a were enrichedand induced by sleep deprivation, whereas only trace amounts ofHcrt could be detected (SI Fig. 6).
Immunoprecipitated mRNAs were prepared from Homer1-PABP transgenic mice with (n � 6) or without (n � 6) a 6-h sleepdeprivation at light onset for gene expression profiling. For com-parison, RNA extractions were also made from supernatants (n �4) after immunoprecipitation and from transgenic whole brains(n � 8). To test for transcriptional changes after sleep deprivationin Homer1-expressing cells, we proceeded in two steps: (i) weidentified probe sets enriched in the pull-down extracts and (ii)among those probe sets, we compared sleep deprivation withcontrol condition in both pull-down (6 vs. 6-chip comparison) andwhole-brain (4 vs. 4-chip comparison) extracts. We found that 4,728probe sets were significantly enriched at 5% false discovery ratewhen pull-downs were compared with both supernatant and whole-brain extracts (SI Materials and Methods). Again, very few genes
were identified (SI Table 7), among which the most significantones—Homer1a, Egr2 (NGFI-B), and Fosl2 (Fos-like antigen 2)—were similarly induced after sleep loss in the pull-down and thewhole-brain extracts, suggesting that gene expression changes inthe pull-down samples recapitulate the most significant changes atthe whole-brain level. In addition, several unique immediate-earlygenes were specifically identified in pull-down samples that mightbe coinduced with Homer1a, namely prostaglandin–endoperoxidesynthase 2 (Ptgs2), junctophilin 3 (Jph3), and neuronal pentraxin 2(Nptx2). Interestingly, both Jph3 and Nptx2 are activity-inducedthrough either ryanodine receptor-mediated intracellular calciummobilization (Jph3) or activity-induced AMPA receptor synapticclustering (Nptx2). Among the very few down-regulated transcripts(SI Table 7), we have identified another activity-induced gene,4-nitrophenylphosphatase domain and nonneuronal SNAP25-likeprotein homolog 1 (Nipsnap1), suggesting that plasticity genes canbe up- or down-regulated by sleep deprivation.
B
C
PABPFLAG
500
300
700Tg mice+ -+ - + -
eGFP
D
eGFP36
22
98
64
142
Flag
Sleep Deprived
Tg mice
- + - +
Control
5’ 6’
Recombination
Flip-out of Zeo
IRES eGFPPABP
Fla
g
ZE
O
179Kb 36Kb
BAC
BXD-F2 pronucleus injection
BAC
IRES eGFPPABP
Fla
g
ZE
O
1 2 3 54
BAC
IRES eGFPPABP
Fla
g
11
2 2
3 3
Chrom.
IRES eGFPPABP
Fla
g
AAnia-3
1H1a H1b/c
2 3 6 7 8 9 1054 Exons
~100kb
Loading control
Fig. 3. A transgenic mouse model to analyze neuron-specific gene expres-sion. (A) Schematic representation of the genomic structure of Homer1. Theputative transcriptional initiation site is depicted by a bent arrow at thebeginning of exon 1; the translational stops for short activity-inducedHomer1a (H1a) and Ania-3, as well as for long constitutively expressedHomer1b/c (H1b/c) are indicated by black circles. Intron 5 is here divided intofour segments (4.4 kb of Homer1a 3� UTR, 5.7 kb up to Ania-3, 1.4 kb ofAnia-3-specific sequence, and 18.8 kb to exon 6). The Homer1a-specific exon5� extends exon 5 by the intron 5 sequence. The Ania-3-specific exon 6� sitswithin intron 5 (adapted from ref. 25). (B) General strategy for generatingHomer1a-PABP transgenic mice. The relative position of the Homer1a gene inthe fully sequenced 227,644-bp RP23–262I3 BAC clone (GenBank accession no.AC120347), and the different steps used to introduce a PCR-amplified con-struction containing PABP cDNA, followed by IRES-eGFP and the zeocine (ZEO)selection cassette flanked by FRT sites (hashed boxes) by BAC recombinationin the EL250 bacterial stain (see SI Materials and Methods). (C) Transgenic mice(Tg) were identified by RT-PCR with the primer pairs depicted in B for thepresence of the FLAG (primers 1/1), PABP (primers 2/2), and eGFP (primers 3/3).(D) Western blot verification of transgene expression in transgenic mice line36 (Tg) indicated the presence of the FLAG and eGFP and the up-regulation ofthe FLAG after sleep deprivation. The loading control is a nonspecific bandgenerated by the GFP antibody.
Maret et al. PNAS � December 11, 2007 � vol. 104 � no. 50 � 20093
NEU
ROSC
IEN
CE
DiscussionThe results presented here demonstrate that 6 h of sleep depriva-tion, which importantly impacts sleep physiology and behavior,results in only minimal changes in brain transcriptional adaptation.As reported for changes in delta power (7), we also showed herethat sleep loss-induced transcriptional changes are largely affectedby genetic background. As opposed to other studies that did nottake genetic background into account and did not contrast theirfindings to peripheral tissue (12, 15, 20), our results indicate thatonly a few genes reliably change expression after sleep deprivation.The surprising finding that sleep loss induced a larger number ofchanges in liver than in brain suggests either that sleep deprivationmight have a specific impact on the liver or that the brain might beprotected against major transcriptional changes.
Another important aspect of the present study is the interactionbetween the homeostatic and circadian processes. Although we didnot sleep-deprive the animals under constant conditions, andtherefore the direct and indirect effects of light, for instance, ongene expression could not be accounted for, we have shown that alarge majority (�80%) of changes in gene expression were drivenby the prior sleep–wake history.
We also adopted, and further developed, a reliable mRNAtagging technique to investigate gene expression changes in neu-rons. This technique can be used to evaluate different neuronalsubpopulations without the burden of sampling several structuresor using labor-intensive laser microdissection to isolate neurons.The results of this technique confirmed that sleep loss-inducedtranscriptional changes occur for very few genes, among whichHomer1a remains the most specific.
In addition to Homer1a, we identified overexpression of othergenes involved in synaptic plasticity, but only Egr2 and Homer1awere found to consistently change across experiments. Othersreported overexpression for a number of plasticity-related genes,and these observations are commonly used in support of a func-tional role for sleep in plasticity. Because the expression of mostplasticity-related genes was not reliably changed, our findings do notsupport such a general conclusion and instead suggest that themolecular mechanisms might not be identical for most plasticity-regulated genes. In this context it is important to note that
Nipsnap1, one of the proposed plasticity genes (24), is actuallydown-regulated after sleep deprivation in our mRNA taggingexperiment.
Three different genes in mammals encode Homer proteins.Homer1 encodes constitutively expressed long-form proteins,whereas short-form Homer1a is activity-induced (25). Homer1long-form proteins dimerize and interact with metabotropic gluta-mate receptors and increase calcium from intracellular stores.Short-form proteins, which lack the dimerization domain, functionas natural activity-dependent dominant negative forms that regu-late the scaffolding and signaling capabilities of the long forms andreduce glutamate-induced intracellular calcium release (26, 27). Wehave recorded sleep, and the response to a 6-h sleep deprivation, inHomer1 (all forms) mutant mice but found a very similar patterncompared with their wild-type littermates (data not shown). Thisfinding could be expected due to the fact that, because Homer1afunctions as a dominant negative form of the long forms, consti-tutive loss of all isoforms might not result in any specific sleepphenotype.
Conceptually, spontaneous or enforced wakefulness repre-sents a stressor activating a series of stress–response mecha-nisms of the organism, which, at the transcriptional level, couldbe translated into the induction of genes such as heat shockproteins in most tissues. However, unlike in other organs,brain-specific stress–response pathways are primarily triggeredby glutamate. Glutamate is the major excitatory neurotrans-mitter in the central nervous system and acts through eitherionotropic or metabotropic receptors (mGluRs). Long Hom-er1 tetramers bind group I mGluRs and inositol 1,4,5-triphosphate receptors, thus enabling efficient calcium releasefrom intracellular stores, whereas monomeric Homer1a com-petitively disrupts synaptic glutamatergic signaling complexesto reduce glutamate-induced intracellular calcium release (26,27). Homer1 also activates ryanodine receptors and L-typecalcium channels (28, 29). Interestingly, Jph3, which wasidentified by our mRNA-tagging strategy as being up-regulated by sleep deprivation, has been shown to play a majorrole in ryanodine receptor-mediated, calcium-induced open-ing of small-conductance, calcium-activated potassium (SK)channels (28, 30). SK channels are responsible for the gener-ation of slow afterhyperpolarizations in neurons of the nucleusreticularis thalami and thus contribute to the EEG slow wavescharacteristic of NREM sleep (31).
According to Tononi and Cirelli (3), plastic processes occurringduring wakefulness result in increased synaptic strength, whereasthe role of sleep is to downscale synaptic strength to a basal level.Homer1a transcription is rapidly up-regulated in neurons in re-sponse to synaptic activity induced by long-term potentiation,seizure, inflammation, stimulant drugs, or even selectively in thehippocampus of rodents by exploratory behavior (32, 33). In thiscontext, Homer1a, by buffering intracellular calcium and disassem-bling synaptic glutamatergic signaling complexes, could play apivotal role in synaptic downscaling. Because Homer1a and theother genes identified here (Egr2, Fosl2, Ptgs2, Jph3, and Nptx2) areall induced by stressful conditions such as seizure, stroke andhypoxia, and inflammation, an alternative, complementary viewcould be that they play a primary brain-protective or recovery role.This view is also of relevance for the etiology of neuropsychiatricdisorders because it is increasingly recognized that stress is impli-cated in many of such disorders (34). Both environmental andpharmacological stressors up-regulate Homer1a mRNA in keystructures involved in higher brain functions (35): the same struc-tures in which Homer1a is up-regulated after sleep deprivation. Ithas also been shown that overexpression of Homer1a after inflam-mation, seizure, and psychostimulant or antipsychotic drug useplays a major role in neuroprotection (28, 35). It is tempting torelate the dramatic improvement in depression in humans aftersleep-deprivation (36) to the sleep deprivation-induced up-
esnesitnA
esneS
A Homer1a eGFP
Pir
CPu
Cg
de greM
IP
AD
PF
Ga1re
moH
B Antisense Sense
5µm
Fig. 4. Colocalization of Homer 1a and FLAG-tagged PABP eGFP transcripts.(A) In situ hybridization with Homer1a and eGFP antisense riboprobes indi-cated that both are expressed in similar brain structures. Cg, cingulate cortex;CPu, caudate putamen; Pir, piriform cortex. (B) Confocal images of FISHanalysis. FISH experiments were performed with both Homer1a (red) and eGFP(green) riboprobes at the same time and revealed that almost all positiveneurons were double-labeled, indicating the colocalization of the endoge-nous Homer1a and the transgene. Negative control conditions were obtainedwith both sense riboprobes.
20094 � www.pnas.org�cgi�doi�10.1073�pnas.0710131104 Maret et al.
regulation of Homer1a. In conclusion, converging evidence stronglyimplicates Homer1a as a brain-coping marker against stressors, andour findings suggest that Homer1a might represent the molecularlink between sleep, cognition, and neuropsychiatric disorders.
Materials and MethodsAnimal Handling. All experiments were performed in accor-dance with the protocols approved by the Ethical Committeeof the State of Vaud Veterinary Office, Switzerland. Sleep-deprivation and sleep-recording procedures are described in SIMaterials and Methods.
cRNA Preparation, cDNA Microarray Hybridization, and Real-TimeRT-PCR. For the first experiment, we isolated total RNA from wholebrain and liver by using the RNAXEL kit (Eurobio), treated theRNA with DNase, and cleaned it using RNeasy columns (Qiagen).Equal quantities of total RNA from three individual mice of eachstrain were pooled in triplicate (nine mice of each strain in eachcondition). A hybridization mixture containing 15 �g of biotin-ylated cRNA was hybridized to GeneChip Mouse Expression Set430. Chips were washed, scanned, and analyzed with AffymetrixGeneSpring software.
For the around-the-clock microarray experiment, RNA fromwhole brain was isolated and purified with the RNeasy Lipid TissueMidi kit (Quiagen) and DNase-treated. All RNA quantities wereassessed with a NanoDrop ND-1000 spectrophotometer, and thequality of RNA was controlled on Agilent 2100 bioanalyzer chips.Equal amounts of total RNA were pooled from three mice withineach of the 24 experimental groups (three strains, two conditions,4 ZT � 24; in triplicate: 24 � 3 � 72 chips). Three micrograms ofeach of these pools were used to perform the chip array experiment,according to the Affymetrix Gene Expression procedure. Twelvemicrograms of biotinylated cRNA from each sample were frag-mented and hybridized to GeneChip Mouse 430 2.0 arrays, accord-ing to standard procedures. Microarray analyses and qPCR verifi-cations were performed as reported in SI Materials and Methods.
Immunoblot and in Situ Hybridization. Total protein extract wasprepared with RIPA lysis buffer. Protein concentration was calcu-
lated by using the bicinchoninic acid assay (Pierce) with BSA as astandard. Eighty micrograms of each fraction were analyzed bySDS/PAGE, followed by Western blotting using antibodies asfollows: mouse anti-tubulin 1/1,000 (Santa Cruz), goat anti-Homer1a 1/200 (Santa Cruz), mouse anti-Flag M2 1/300 (affinity-purified; Sigma), and rabbit anti-GFP 1/2,500 (AbCam). Secondaryantibodies were all coupled with HRP, except for the anti-goatantibody, which was IRDye800-conjugated for Lycor analysis.
In situ hybridizations with coronal cryosections of 12 �m wereperformed according to Allen Brain Atlas protocols (enzymaticBCIP/NBT revelation) (37). All reagents and solutions were pur-chased and prepared based on Eurexpress II in situ hybridizationconsortium instructions. GFP and Homer1a riboprobes were syn-thesized by in vitro transcription on a linearized pGEM-Easy vector(Promega) containing the corresponding sequences. The cDNAinsert of this plasmid was generated by RT-PCR from mouse brainRNA, using the following primers: Homer1a forward, 5�-GCTGTCAGAAGCTTAGGATGTG-3�; Homer1a reverse,5�-AAAGTGCAGAAAGTCCAGCAGC-3�; GFP forward, 5�-GAGCTGGACGGCGACGTAAACG-3�; and GFP reverse, 5�-AGGACCATGTGATCGCGCTTCTC-3�.
FISH was performed as described in ref. 38, using anti-DIG-POD 1/600 (Roche), anti-FLU-AP 1/100 (Roche), and SA-Alexa488 (Molecular Probes) and counterstained with DAPI (Sigma).
Transgenic and mRNA Tagging. Transgenic mice were generated asdescribed in Fig. 3. See SI Materials and Methods for details.
We thank K. Harshman, A. Paillusson, and M. Bueno for assistance inmicroarray and real-time RT-PCR analyses at the Lausanne DNA ArrayFacility; P. Descombes, M. Docquier, D. Chollet, and C. Delucinge forassistance in microarray and real-time RT-PCR analyses at the GenevaGenomics Platform, National Center for Competence in Research Frontiersin Genetics; S. Excoffier for help in the transgenic construction; P. Seeburg,M. Schwarz (Max Planck Institute, Heidelberg, Germany), and P. Worley(Johns Hopkins School of Medicine, Baltimore, MD) for providing Homer1mutant mice; and A. Vassali for constructive discussions. This work wassupported by the Swiss National Science Foundation and the State of Vaud(M.T.) and in part by National Institutes of Mental Health Grant MH67752(to P.F.).
1. Dijk DJ, Franken P (2005) in Principles and Practice of Sleep Medicine, edsKryeger TH, Roth TH, Dement W (Saunders, Philadelphia), pp 418–434.
2. Krueger JM, Obal F (1993) J Sleep Res 2:63–69.3. Tononi G, Cirelli C (2006) Sleep Med Rev 10:49–62.4. Huber R, Ghilardi MF, Massimini M, Ferrarelli F, Riedner BA, Peterson MJ,
Tononi G (2006) Nat Neurosci 9:1169–1176.5. Marshall L, Helgadottir H, Molle M, Born J (2006) Nature 444:610–613.6. Molle M, Marshall L, Gais S, Born J (2004) Proc Natl Acad Sci USA
101:13963–13968.7. Franken P, Chollet D, Tafti M (2001) J Neurosci 21:2610–2621.8. Van Dongen HP, Baynard MD, Maislin G, Dinges DF (2004) Sleep 27:423–433.9. Tucker AM, Dinges DF, Van Dongen HP (2007) J Sleep Res 16:170–180.
10. Shifman S, Bell JT, Copley RR, Taylor MS, Williams RW, Mott R, Flint J(2006) PLoS Biol 4:e395.
11. Cirelli C, Gutierrez CM, Tononi G (2004) Neuron 41:35–43.12. Mackiewicz M, Shockley KR, Romer MA, Galante RJ, Zimmerman JE,
Naidoo N, Baldwin DA, Jensen ST, Churchill GA, Pack A (2007) PhysiolGenomics 31:441–457.
13. Nelson SE, Duricka DL, Campbell K, Churchill L, Krueger JM (2004) NeurosciLett 367:105–108.
14. Huber R, Tononi G, Cirelli C (2007) Sleep 30:129–139.15. Terao A, Steininger TL, Hyder K, Apte-Deshpande A, Ding J, Rishipathak D,
Davis RW, Heller HC, Kilduff TS (2003) Neuroscience 116:187–200.16. Wisor JP, Morairty SR, Huynh NT, Steininger TL, Kilduff TS (2006) Neuroscience
141:371–378.17. Franken P, Thomason R, Heller HC, O’Hara BF (2007) BMC Neurosci 8:87.18. Wisor JP, O’Hara BF, Terao A, Selby CP, Kilduff TS, Sancar A, Edgar DM,
Franken P (2002) BMC Neurosci 3:20.19. Cirelli C, Faraguna U, Tononi G (2006) J Neurochem 98:1632–1645.20. Terao A, Greco MA, Davis RW, Heller HC, Kilduff TS (2003) Neuroscience
120:1115–1124.
21. Roy PJ, Stuart JM, Lund J, Kim SK (2002) Nature 418:975–979.22. Kunitomo H, Uesugi H, Kohara Y, Iino Y (2005) Genome Biol 6:R17.23. Yang Z, Edenberg HJ, Davis RL (2005) Nucleic Acids Res 33:e148.24. Satoh K, Takeuchi M, Oda Y, Deguchi-Tawarada M, Sakamoto Y, Matsubara
K, Nagasu T, Takai Y (2002) Genes Cells 7:187–197.25. Bottai D, Guzowski JF, Schwarz MK, Kang SH, Xiao B, Lanahan A, Worley
PF, Seeburg PH (2002) J Neurosci 22:167–175.26. Worley PF, Zeng W, Huang G, Kim JY, Shin DM, Kim MS, Yuan JP, Kiselyov
K, Muallem S (2007) Cell Calcium 42:363–371.27. Xiao B, Tu JC, Worley PF (2000) Curr Opin Neurobiol 10:370–374.28. Kakizawa S, Kishimoto Y, Hashimoto K, Miyazaki T, Furutani K, Shimizu H,
Fukaya M, Nishi M, Sakagami H, Ikeda A, et al. (2007) EMBO J 26:1924–1933.29. Yamamoto K, Sakagami Y, Sugiura S, Inokuchi K, Shimohama S, Kato N
(2005) Eur J Neurosci 22:1338–1348.30. Moriguchi S, Nishi M, Komazaki S, Sakagami H, Miyazaki T, Masumiya H,
Saito SY, Watanabe M, Kondo H, Yawo H, et al. (2006) Proc Natl Acad Sci USA103:10811–10816.
31. Blethyn KL, Hughes SW, Toth TI, Cope DW, Crunelli V (2006) J Neurosci26:2474–2486.
32. Tappe A, Klugmann M, Luo C, Hirlinger D, Agarwal N, Benrath J, Ehren-gruber MU, During MJ, Kuner R (2006) Nat Med 12:677–681.
33. Kato A, Ozawa F, Saitoh Y, Fukazawa Y, Sugiyama H, Inokuchi K (1998) J BiolChem 273:23969–23975.
34. Southwick SM, Vythilingam M, Charney DS (2005) Annu Rev Clin Psychol1:255–291.
35. Szumlinski KK, Kalivas PW, Worley PF (2006) Curr Opin Neurobiol 16:251–257.
36. Giedke H, Schwarzler F (2002) Sleep Med Rev 6:361–377.37. Lein ES, Hawrylycz MJ, Ao N, Ayres M, Bensinger A, Bernard A, Boe AF,
Boguski MS, Brockway KS, Byrnes EJ, et al. (2007) Nature 445:168–176.38. Ishii T, Omura M, Mombaerts P (2004) J Neurocytol 33:657–669.
Maret et al. PNAS � December 11, 2007 � vol. 104 � no. 50 � 20095
NEU
ROSC
IEN
CE