Embed Size (px)
Citation preview
Home-Based Workers: Worker and Work Characterist ics
Diane M. Masuo University of Hawaii at Manoa
Rosemary Walker Michigan State University
Marilyn M. Furry The Pennsylvania State University
ABSTRACT: The purpose of the study reported here is to describe the worker and work characteristics of 899 home-based business owners and wage earners, using
This article reports results from the Cooperative Regional Research Project, NE-167, entitled, "At-Home Income Generation: Impact on Management, Productivity and Sta- bility in Rural and Urban Families," partially supported by Cooperative States Re- search Service, U.S. Department of Agriculture and the Experiment Stations at the University of Hawaii, Iowa State University, Lincoln University (Missouri), Michigan State University, Cornell University (New York), The Ohio State University, The Pennsylvania State University, Utah State University, and University of Vermont. Appreciation is expressed to Ana Marie Vargas and Johnny M. H. On for their assist- ance with the computer analyses, and to Florence Abe, Laraine Hoffman, and Meesok Lee for their help in the final preparation of this article. The authors acknowledge the patience and helpful suggestions of two anonymous reviewers.
Diane M. Masuo is Assistant Professor in the Department of Human Resources, 2515 Campus Road, Miller Hall, University of Hawaii at Manoa, Honolulu, HI 96822-2218. Her current research interests include home-based employment, multiple farm income families, and computer-based education. She received her Ph.D. from Oregon State University.
Rosemary Walker is Associate Professor in the Department of Family and Child Ecology, Michigan State University, East Lansing, MI 48824-1030. Her current re- search interests include home-based employment, economic adjustments of farm fami- lies, and the interrelationship of management to an individual's quality of life. She received her Ph.D. from Purdue University.
Marilyn M. Furry is Assistant Professor in the Agricultural and Extension Educa- tion Department, 323 Agricultural Administration Building, The Pennsylvania State University, University Park, PA 16802-2601. Her primary areas of research are rural households, the impact of employment on a family, learning theories as applied to financial education, retirement, and home-based employment. She received her Ph.D. from The Pennsylvania State University.
Journal of Family and Economic Issues, Vol. 13(3), Fall 1992 �9 1992 Human Sciences Press, Inc. 245
246 Journal of Family and Economic Issues
a definition tha t excludes farmers, hobbyists, and persons taking work home from a job located elsewhere. Contrary to predictions by futurists of an influx of white-collar workers from the office to home, the home-based workers in this research are more likely to be market ing and sales persons, contractors, or mechanical and t ransportat ion workers. Full- or part- t ime employment status, home tenure, seasonality of work, and occupation are significantly associated with ownership status. Findings show signifi- cant group differences on age, education, years in the community, household size, and net annual home-based income. Business owners, on average, are older, have less edu- cation, come from larger households, have lived in thei r communities more years, and have lower net annua l home-based incomes than thei r wage earner counterparts.
KEY WORDS: home-based employment, working at home.
Introduction
Changes in the nature of office work, the composition of the labor force, and the structure of economic markets, as well as the elimina- tion of restrictions on commercial home-based employment, have led to increased interest in working at home (Kraut, 1988). Despite the attention being given to home-based work, there is little representa- tive data available because definitions of the sample groups have var- ied from study to study. The study reported here will help provide base-line data on home-based workers because of the representative nature of the sample studied and the carefully set criteria for identi- fying the sample.
The purpose of this study is to present a current profile of home- based workers, with a special focus on a comparison of worker and work characteristics of two categories of at-home workers: business owners and wage earners. These categories are chosen because the terms of their employment and the conditions of their work differ con- siderably (Christensen, 1987; Dangler, 1986; Gringeri, 1990; Katz & Kemnitzer, 1984).
Reasons Underlying Interest in Home-Based Employment
Of the four factors that have contributed to increased interest in working at home, the first is the changing nature of office work. To- day, information processing is central to the operation of most offices. As the cost of computers and telecommunications equipment has dropped, it has become more feasible for white-collar workers to work out of the home.
The second factor is the changing composition of the labor force.
Diane M. Masuo, Rosemary Walker and Marilyn M. Furry 247
Today's labor force is made up of an increasing number of women with young children and self-employed workers, two groups that find home-based work to be an ideal arrangement. In 1987 more than half of all women in the labor force had children under 1 year old (U.S. Department of Labor, 1988). By 1994 it is predicted that three out of four school age children will have a working mother. For women with young children, working at home may provide an opportunity to earn money while meeting family care responsibilities. Between 1976 and 1989 the number of persons in the U.S. working for themselves in- creased to the point that, by 1989, more than 10 million people in the U.S. were self-employed. Of that number, however, only the non- agricultural segment showed a steady increase over the period. Agri- cultural self-employment has shown a steady decline since 1980 (U.S. Bureau of the Census, 1991, Table No. 647). Becker (1984), using 1983 household survey data from the Current Population Survey, found that self-employed workers, as compared to wage and salary workers, were older, more skilled, and more financially well-endowed. Among older workers, self-employment was used to supplement a re- tirement income.
Economic markets are no longer limited by geographic boundaries. Therefore, in order to compete in the global marketplace, U.S. busi- nesses have increased their productivity by replacing workers with machines and subcontracting work out to self-employed and home- based independent contractors (Christensen, 1987, 1989; Katz & Kemnitzer, 1984), also known as industrial home workers (Dangler, 1986; Gringeri, 1990). The home-based clerical workers in Chris- tensen's (1987) sample traded a dependable salary for an undepend- able hourly or piece rate; earned less than they had before in the office; lost all health, pension, sick leave and vacation benefits; be- came responsible for paying their own Social Security taxes; and were isolated from and left out of the mainstream of company communica- tion. The industrial home workers in Gringeri's (1990) study experi- enced substandard working conditions, which included more work-re- lated injuries during the uncompensated adjustment period. In sum, operating costs can be reduced by utilizing independent home-based subcontractors and industrial home workers who are not covered by minimum wage and workers' compensation laws, health and safety standards, or Social Security benefits.
Renewed interest in home-based employment also came in the early 1980s when the U.S. Department of Labor lifted its long stand- ing ban on practically all types of home-based work and replaced it
248 Journa l of Family a n d E c o n o m i c I s s u e s
with a certification system. By 1989, prohibitions remained only for the women's apparel industry and for hazardous jobs in the jewelry industry (Hukill, 1990).
Previous Research in Home-Based Employment
Home-Based Work Trends in the United States
Latest estimates of the number of nonfarm home-based workers in the United States have varied from 8.4 million (Horvath, 1986) to 25 million (Ambry, 1988; Silver, 1989) persons. The number has de- pended on how "work at home" was defined. The descriptions also have varied considerably due to the distinct samples studies.
Home-based workers have been increasing in number, albeit mod- estly. Between 1980 and 1985 the number of home-based workers who worked exclusively at home increased from 1.5 million to approx- imately 1.8 million, an increase of 300,000 (Horvath, 1986), compared to an 8 million increase in the civilian nonagricultural labor force (U.S. Department of Labor, 1990). The picture has changed, however, when the increase has been measured in percentage terms. Home- based employment increased by 20% as compared to 8.3% for the en- tire civilian work force. Based on 1983 Current Population Survey data and May 1985 Bureau of Labor Statistics data, predictions have been made that home-based employment will increase, largely due to the rise in self-employment, including sole proprietorships, limited partnerships, and incorporations (Becker, 1984; Christensen, 1988).
Futurists, high technology companies, and researchers in the late 1970s and early 1980s predicted a massive migration of workers from office to home (Ambry, 1988; Farmanfarmaian, 1989; Nilles, 1975; Toffier, 1980). According to the 1980 Census, there were approx- imately 181,000 home-based clerical workers in the United States. By May 1985, the Bureau of Labor Statistics reported a home-based cler- ical work force of 246,000 people who worked 8 hours or more as home-based secretaries, stenographers, and typists. Of this number, 35,000 worked full-time (35 hours or more) in these occupations (Kraut & Grambsch, 1987). Support for the growing incidence of home-based clerical workers came from a 1985 National Survey on Women and Home-based Work. Of the 14,000 white-collar Family Circle magazine respondents comprising the nonrandom sample, 53% worked at home and 42% wanted to work at home (Christensen, 1989).
Diane M. Masuo, Rosemary Walker and Marilyn M. Furry 249
Methodological Problems in Surveying Home-Based Workers
Methodological problems in surveying home-based workers have delayed efforts to accurately identify employment trends and provide information on whether home-based employment should be encour- aged or not (Pratt, 1987). One major problem has been the definition of home-based worker.
Since 1960, the decennial census, conducted by the Bureau of the Census, has based its count of home-based workers on the response, "work at home" to a question about means of transportation to work. The count was limited to home workers whose principal place of work in their primary job was their home. Thus, farmers were included. On the other hand, in the May 1985 Current Population Survey by the U.S. Bureau of Labor Statistics, home-based workers included any per- son who took work home as a part of his or her regular job. By that definition, home workers included occasional workers and farmers. With farmers being the only certain overlap between the two sets of data, only data on the farming segment were comparable.
It was difficult to compare data collected on home workers because definitions of "work at home" have varied from inclusive to exclusive. Also, much of the data collected on home-based employment came from nonequivalent populations. This was an artifact of the changing nature of home-based work. Segments of the home-based worker pop- ulation, such as persons who worked primarily at home, full-time and part-time workers, occasional workers, and moonlighters, were either not counted or were under- or over-counted.
Demographic Profiles Based on Recent Surveys
Despite the fact that descriptive analyses of home-based workers in the United States have been flawed by methodological problems or limited in scope, profiles have been developed on three nationally rep- resentative data sets. These set have included data from the 1985 Current Population Survey, the 1984 Panel Study of Income Dy- namics, and the 1980 Census.
1985 Current Population Survey. According to data obtained from the Bureau of Labor Statistics' May 1985 Current Population Survey (CPS), there were 18 million home-based workers in 1985 (Horvath, 1986). Of that number, 17.3 million were nonfarm home workers. Home-based workers were broadly defined as farmers and individuals
250 Journal of Family and Economic Issues
who took work home to do as part of their regularly scheduled work on a primary job. Therefore, teachers and managers taking home work were included. Moonlighters and persons working at home on a second job or business, however, were not counted.
Although the gender split was close, a larger proportion of home- based workers were men (55%). Women, however, accounted for two- thirds of those working exclusively at home. Most of the home workers were between 35 and 44 years old, but homework appealed to older workers, particularly those over age 55.
A breakdown by nonagricultural industries indicated that among those working full-time, the largest proportion of workers, from high- est to lowest, came from the following industry categories: services, wholesale and retail trade, and finance, insurance, and real estate. In the services industry, which included educational, professional, busi- ness and repair (business management, consulting, computer), and social services (child care)jobs, the majority of workers were wage earners, regardless of the number of hours they worked per week.
With respect to jobs, 55% of the home-based workers held jobs in managerial and professional occupations; 29% were in technical, sales, and administrative support fields; 6% were in services; 7% were engaged in production, craft, and repair jobs; and finally, 3% were operators, fabricators, and laborers (machine operators, assemblers, and inspectors).
In sum, full-time employed home-based workers in the 1985 Cur- rent Population Survey tended to be unincorporated business owners, whereas part-time workers were wage and salary employees. Female workers were most numerous in the services industry, where they were employed full-time as wage earners. Of five selected nonfarm occupations, the largest number of workers were in a managerial and professional specialty, followed by workers in technical, sales, and ad- ministrative support.
1984 Panel Study of Income Dynamics (PSID). Another profile of home-based workers was provided by Heck (1987), using household data obtained from the 1984 PSID. Her sample consisted of 6,744 in- dividual workers. In her study of the likelihood of employed men and women being in home-based work, Heck (1987) defined home-based work as those employment situations in which the worker either did not travel to his or her place of employment or the amount of time spent on travel varied. The likelihood of being involved in home- based work was positively related to age, absence of children, pres-
Diane M. Masuo, Rosemary Walker and Marilyn M. Furry 251
ence of children under age 6, being self employed, and being a farmer. Decreased participation was associated with minority status, higher total family labor income, having a high school education or less, and working longer hours.
1980 Census. According to the 1980 Census, the home-based cleri- cal work force of 181,000 people was predominantly white, self-em- ployed (including sole proprietorships, limited partnerships, and in- corporated businesses), and was more likely to have come from a group experiencing difficulty finding work outside the home (moth- ers, the elderly, the disabled, and rural residents). A May 1985 up- date by the U.S. Bureau of Labor Statistics has documented an in- crease to 246,000 clerical workers and has pointed out that 85.8%, or 211,000, of those jobs were part-time (Kraut & Grambsch, 1987).
Studies Comparing Workers by Ownership Status
Home-based workers have been categorized by ownership status of the business into business owners and wage earners (Pratt, 1987). It has not been possible to accurately compare home-based business owners and wage earners between studies because of definitional problems, limited sampling, or the limited scope of the studies. For example, Horvath (1986) has reported 1985 CPS results for business owners (self-employed) and wage earners in home-based employment only for the services industry, so comparisons could not be made with other industries or occupations.
Two researchers tried to make generalizations about home-based workers using small limited samples. Gringeri (1990) interviewed 78 industrial home workers living in two rural communities in the upper Midwest who assembled various kinds of screws and bolts for General Motors vehicles. Lozano (1989) interviewed 35 San Francisco Bay area home-based workers in either electronic manufacture or busi- ness service industries who manufactured electronic components for a producer of scientific instrumentation. The results from these two studies were not generalizable to other business owners and wage earners because of the limited samples used. There was evidence, though, that the home workers who were earners often shared all the risks of business ownership with few or none of its benefits (Chris- tensen, 1985; Foegen, 1984; Gringeri, 1990; Lozano, 1989). Wages among industrial home workers were often substandard; Social Secu- rity insurance was either not paid for by the employer or was de-
252 Journal of Family and Economic Issues
ducted f rom the worke r ' s piece ra te ; work- re l a t ed injur ies were not covered; and worke r s m a y h a v e incur red se tup costs for r e t ro f i t t i ng the i r homes and for t r a i n i n g in the ea r ly per iods of work for which t hey were not r e imbursed .
In conclusion, compar i sons of home-based worke r s be tween samples and over t i m e were h a m p e r e d by incons is ten t def ini t ions be tween studies, l imi ted sampl ing , or the l imi ted scope of the research . The s tudy repor ted he re should he lp to fill a void in w h a t is known abou t these worke r s because the s a m p l i n g t echn ique was des igned to iden- t i fy households wi th worke r s who m e t specif ical ly ident if ied c r i t e r i a for home-based work. Addi t ional ly , the n a t u r e of the sample a l lowed genera l i za t ion to n ine s ta tes , exc luding me t ropo l i t an areas .
M e t h o d o l o g y a n d D a t a
The Data
The data for this study were from a nine-state project focused on house- holds in which at least one individual generated income by working at or from the home. During spring 1989, 30-minute telephone interviews were conducted with the household manager in 899 households in which there was home-based employment (Stafford, Winter, Duncan, & Genalo, 1992). The unit of analysis was the household and the data were weighted by the rela- tive importance in the population of the respective states and the rural and urban areas in the states (Stafford et al., 1992). For more information on sampling, methodology, and definitions, see Stafford et al. (1992). Goals of the project were to identify a profile of home-based employment families and their communities; to study management behavior and strategies in these households; and to study the relationships among work activities, work envi- ronments, and family functioning. The focus of this article is to profile home- based workers and to compare similarities and differences between business owners and wage earners.
The sample was selected from a list of nine states' household telephone numbers obtained from Survey Sampling, Inc. of Fairfield, Connecticut, as explained by Stafford et al. (1992). The sample was stratified by location of work, with urban counties defined as having at least one city with a popula- tion of 25,000 or more and the remaining counties identified as rural. The counties comprising the metropolitan cities of Detroit, New York, and Phila- delphia were excluded because of the research team's interest in residents of rural areas and smaller cities. The Iowa State University Statistical Labora- tory made screening calls in February 1989 to identify households containing at least one home-based worker, defined as a person at least 18 years of age who worked in or from the home to earn income for a minimum of 312 hours over the past 12 months (without an office or other regular workplace off the property for this job). This definition was used to exclude hobbyists and thOse
Diane M. Masuo, Rosemary Walker and Marilyn M. Furry 253
who occasionally brought home work as an extension of their jobs. Addi- tionally, farmers were not included unless they sold their products at retail or added value to their products.
The demographics reported in this study refer to the entire sample of 899 home-based workers. In instances where there were multiple home-based workers in a household, the person working the highest number of hours was designated as the worker of interest, unless the household manager was the home-based worker. In that case the household manager's home-based work hours were used if they met the minimum hours criteria of 312 hours per year. For further information and definitions, see Stafford et al. (1992).
Research Variables
To provide a framework for understanding home-based employment, the variables were divided into two categories, those related to the worker (in- cluding selected household characteristics) and those related to the work or employment situation. The variables describing the workers were gender, age, highest education level attained (years), marital status (married or not), household size, home tenure (own home or not), and years lived in the com- munity. There were cases of missing values for age (4 cases) and marital status (1 case) and, therefore, these observations were excluded from individ- ual analyses for these two variables.
Seven variables described the work situation. Ownership status was cate- gorized as business owner or wage earner (working as an employee). Sea- sonality pertained to whether or not the work was seasonal. The hours worked per week variable was created by dividing the annual hours worked by 50 (assuming a 50-week work year). Consistent with the definitions of part-time and full-time work used by the U.S. Department of Labor (1991), the employment status variable was created. If the average hours worked per week were less than 35 hours, employment status was part-time; otherwise, it was full-time. Years in home-based work and net annual home-based in- come were continuous variables. When net income was negative for a busi- ness owner, it was coded as zero. The net incomeS were not reported for 28% of the owners and 15% of the earners. In these cases of missing values on the income variable, net income was imputed, as described by Stafford et al. (1992).
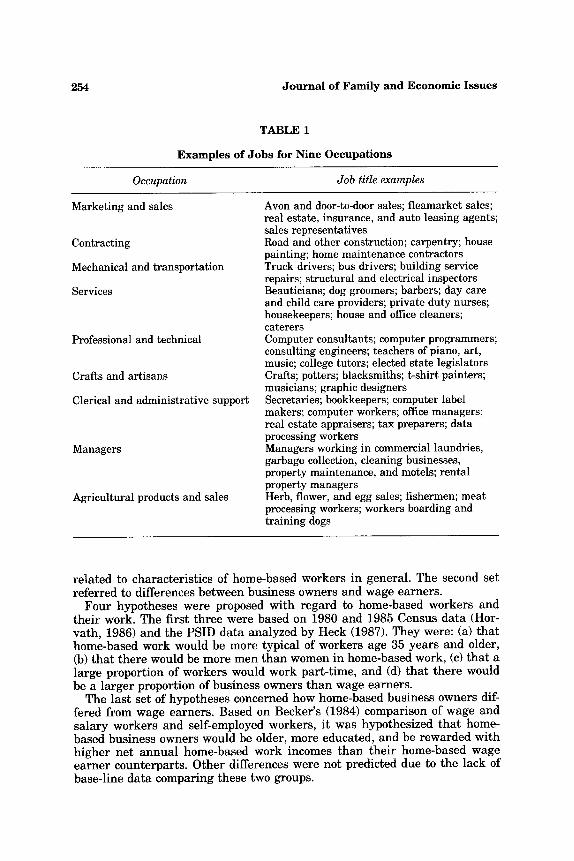
Respondents provided job titles, which were then classified into one of nine occupational categories, based on the Standard Occupational Classification Manual (U.S. Department of Commerce, 1980). The categories were market- ing and sales, contracting, mechanical and transportation, services, profes- sional and technical, crafts and artisans, clerical and administrative support, managers, and agricultural products and sales. Table 1 presents examples of jobs related to each of the occupational categories.
Research Hypotheses
Based on government surveys of similar populations of self-employed and home-based workers, hypotheses were formulated. The first set of hypotheses
254 Journal of Family and Economic Issues
TABLE 1
Examples of Jobs for Nine Occupations
Occupation Job title examples
Marketing and sales Avon and door-to-door sales; fleamarket sales;
Contracting
Mechanical and transportation
Services
Professional and technical
Crafts and artisans
Clerical and administrative support
Managers
Agricultural products and sales
real estate, insurance, and auto leasing agents; sales representatives Road and other construction; carpentry; house painting; home maintenance contractors Truck drivers; bus drivers; building service repairs; structural and electrical inspectors Beauticians; dog groomers; barbers; day care and child care providers; private duty nurses; housekeepers; house and office cleaners; caterers Computer consultants; computer programmers; consulting engineers; teachers of piano, art, music; college tutors; elected state legislators Crafts; potters; blacksmiths; t-shirt painters; musicians; graphic designers Secretaries; bookkeepers; computer label makers; computer workers; office managers; real estate appraisers; tax preparers; data processing workers Managers working in commercial laundries, garbage collection, cleaning businesses, property maintenance, and motels; rental property managers Herb, flower, and egg sales; fishermen; meat processing workers; workers boarding and training dogs
related to characteristics of home-based workers in general. The second set referred to differences between business owners and wage earners.
Four hypotheses were proposed with regard to home-based workers and their work. The first three were based on 1980 and 1985 Census data (Hor- vath, 1986) and the PSID data analyzed by Heck (1987). They were: (a) tha t home-based work would be more typical of workers age 35 years and older, (b) tha t there would be more men than women in home-based work, (c) tha t a large proportion of workers would work part-time, and (d) tha t there would be a larger proportion of business owners than wage earners.
The last set of hypotheses concerned how home-based business owners dif- fered from wage earners. Based on Becker's (1984) comparison of wage and salary workers and self-employed workers, it was hypothesized tha t home- based business owners would be older, more educated, and be rewarded with higher net annual home-based work incomes than their home-based wage earner counterparts. Other differences were not predicted due to the lack of base-line data comparing these two groups.
Diane M. Masuo, Rosemary Walker and Marilyn M. Furry 255
Analysis
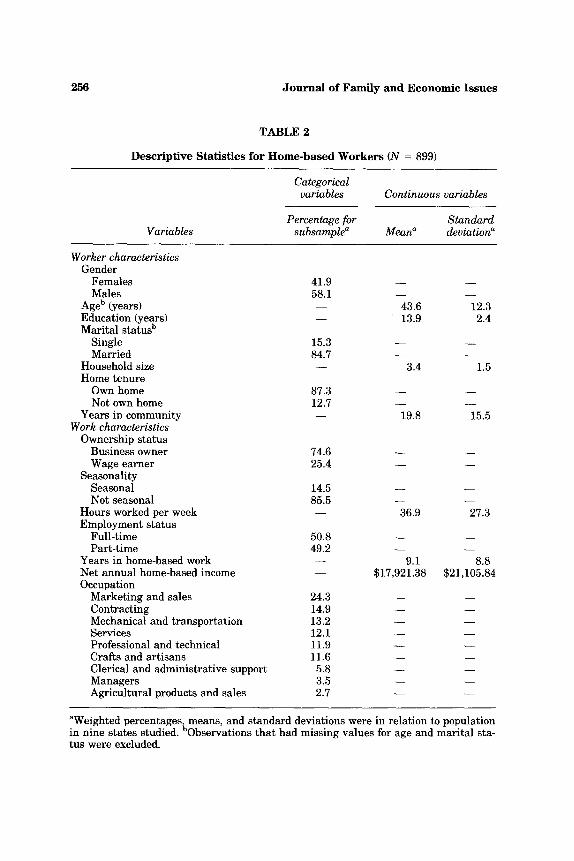
The profile of the 899 home-based workers in this study is reported in Ta- ble 2 by weighted percentages, means, and standard deviations. The data were weighted to represent the rural and urban nature of the population in the nine states studied.
To measure the association between selected categorical variables and own- ership status, either business owner or wage earner, chi-square tests were used. The analysis of variance procedure (ANOVA) was employed to test the difference in means of the continuous variables by ownership status. In anti- cipation that the unequal sizes of the two ownership status categories would inflate coefficients and lead to larger F values, a correction was made for the unbalanced design (SAS Institute, Inc., 1989). A probability level of .05 or less was selected to determine significant associations between variables or significant differences in the means.
R e s u l t s
This section begins with a presentation and discussion of findings related to Table 2, the profile of home-based workers. Next, it pre- sents findings in Tables 3 through 5 tha t pertain to the similarities and differences between business owners and wage earners.
The data confirmed two hypotheses related to the characteristics of the home-based workers (see Table 2). A greater proportion of the sample consisted of men than women (58.1% versus 41.9%). Addi- tionally, on average, the workers were older than 35 years, with a mean age of almost 44 years. Other worker characteristics reported in Table 2 include: (a) mean education was 13.9 years; (b) nearly 85% of the workers were married; (c) average household size was 3.4 people; (d) most workers (87.3%) were home owners; and (e) on average, most had lived in the community nearly 20 years.
With regard to work characteristics presented in Table 2, as hy- pothesized, business owners predominated, but slightly more individ- uals worked full-time. The work was generally not seasonal. The av- erage number of hours worked per week was 36.9, and the average years in home-based work was slightly over 9. The average net in- come from home-based work was $17,921.38 per year. The occupa- tions most often represented (in descending order by percentage dis- tribution) were market ing and sales, contracting, and mechanical and transportation. In fact, these three occupational categories accounted for more than 50% of all the workers.
256 J o u r n a l o f F a m i l y a n d E c o n o m i c I s s u e s
T A B L E 2
D e s c r i p t i v e Stat i s t i c s for H o m e - b a s e d Workers (N = 8 9 9 )
Categorical variables Continuous variables
Percentage for Standard Variables subsample a Mean a deviation a
Worker characteristics G e n d e r
F e m a l e s 4 1 . 9 - - - -
M a l e s 5 8 . 1 - - - -
A g e b ( y e a r s ) - - 4 3 . 6 1 2 . 3
E d u c a t i o n ( y e a r s ) - - 1 3 . 9 2 . 4 M a r i t a l s t a t u s b
S i n g l e 1 5 . 3 - - - -
M a r r i e d 8 4 . 7 - - - -
H o u s e h o l d s i z e - - 3 . 4 1 .5 H o m e t e n u r e
O w n h o m e 8 7 . 3 - - - -
N o t o w n h o m e 1 2 . 7 - - - -
Y e a r s i n c o m m u n i t y - - 1 9 . 8 1 5 . 5 Work characteristics
O w n e r s h i p s t a t u s
B u s i n e s s o w n e r 7 4 . 6 - - - -
W a g e e a r n e r 2 5 . 4 - - - - S e a s o n a l i t y
S e a s o n a l 1 4 . 5 - - - -
N o t s e a s o n a l 8 5 . 5 - - - -
H o u r s w o r k e d p e r w e e k - - 3 6 . 9 2 7 . 3
E m p l o y m e n t s t a t u s
F u l l - t i m e 5 0 . 8 - - - - P a r t - t i m e 4 9 . 2 - - - -
Y e a r s i n h o m e - b a s e d w o r k - - 9 .1 8 . 8
N e t a n n u a l h o m e - b a s e d i n c o m e - - $ 1 7 , 9 2 1 . 3 8 $ 2 1 , 1 0 5 . 8 4
O c c u p a t i o n M a r k e t i n g a n d s a l e s 2 4 . 3 - - - -
C o n t r a c t i n g 1 4 . 9 - - - - M e c h a n i c a l a n d t r a n s p o r t a t i o n 1 3 . 2 - - - - S e r v i c e s 1 2 . 1 - - - -
P r o f e s s i o n a l a n d t e c h n i c a l 1 1 . 9 - - - -
C r a f t s a n d a r t i s a n s 1 1 . 6 - - - - C l e r i c a l a n d a d m i n i s t r a t i v e s u p p o r t 5 . 8 - - - -
M a n a g e r s 3 . 5 - - - - A g r i c u l t u r a l p r o d u c t s a n d s a l e s 2 .7 - - - -
a W e i g h t e d p e r c e n t a g e s i m e a n s , a n d s t a n d a r d d e v i a t i o n s w e r e i n r e l a t i o n to p o p u l a t i o n i n n i n e s t a t e s s t u d i e d . O b s e r v a t i o n s t h a t h a d m i s s i n g v a l u e s f o r a g e a n d m a r i t a l s t a - t u s w e r e e x c l u d e d .
Diane M. Masuo, Rosemary Walker and Marilyn M. Furry 257
TABLE 3
Selected Variables by Ownership Status
B u s i n e s s o w n e r W a g e earner (n = 670 a) (n = 2 2 9 ~)
V a r i a b l e s n a P e r c e n t a n a P e r c e n t ~ d f 22
W o r k e r charac te r i s t i c s Gender
Females 279 41.7 98 42.7 1 0.08 Males 391 58.3 131 57.3
Mari ta l s ta tus b Marr ied 569 85.0 192 83.9 1 0.16 Not marr ied 100 15.0 37 16.1
Home tenure Own home 599 89.4 186 81.1 1 10.58" Not own home 71 10.6 43 18.9
W o r k charac t e r i s t i c s Seasonality
Seasonal 120 17.9 11 4.7 1 23.89** Not seasonal 550 82.1 218 95.3
Employment s ta tus Full-t ime 317 47.4 139 61.0 1 12.48"* Par t - t ime 353 52.6 90 39.0
aWeighted numbers and percentages. s ta tus was excluded. *p<.01. **p<.001.
bObservation tha t had missing value for mar i ta l
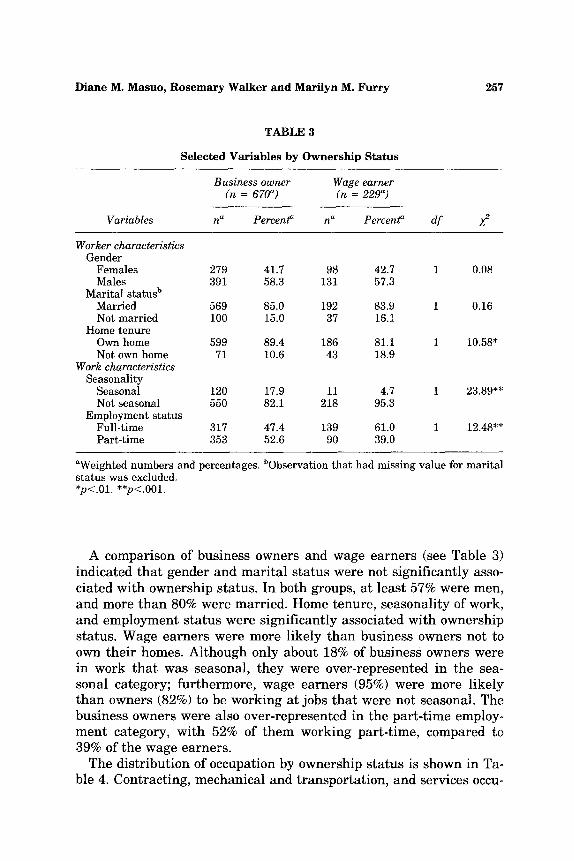
A comparison of business owners and wage earners (see Table 3) indicated tha t gender and marital status were not significantly asso- ciated with ownership status. In both groups, at least 57% were men, and more than 80% were married. Home tenure, seasonality of work, and employment status were significantly associated with ownership status. Wage earners were more likely than business owners not to own their homes. Although only about 18% of business owners were in work tha t was seasonal, they were over-represented in the sea- sonal category; furthermore, wage earners (95%) were more likely than owners (82%) to be working at jobs that were not seasonal. The business owners were also over-represented in the part-time employ- ment category, with 52% of them working part-time, compared to 39% of the wage earners.
The distribution of occupation by ownership status is shown in Ta- ble 4. Contracting, mechanical and transportation, and services occu-
258 Journal of F~mily and Economic Issues
TABLE 4
Occupation by Ownership Status
B u s i n e s s o w n e r W a g e e a r n e r (n = 670 a) (n = 2 2 9 a)
O c c u p a t i o n n a P e r c e n t ~ n a P e r c e n t ~ d f Z 2
Market ing and sales 98.6 14.7 119.6 52.3 Contract ing 121.6 18.1 11.9 5.2 Mechanical and t ransporta t ion 103.9 15.5 14.5 6.3 Services 102.4 15.3 6.6 2.9 Professional and technical 77.0 11.5 30.3 13.3 Crafts and ar t i sans 99.7 14.8 4.9 2.2 Clerical and adminis t ra t ive support 26.5 4.0 26.1 11.4 Managers 20.1 3.0 11.0 4.8 Agricultural products and sales 20.5 3.1 3.6 1.6
8 194.40"
aWeighted numbers and percentages. *p<.001.
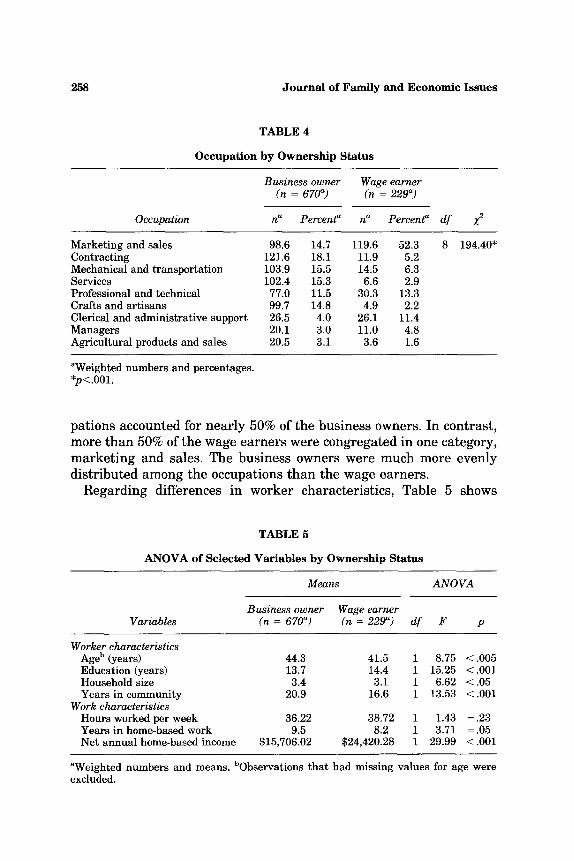
pations accounted for nearly 50% of the business owners. In contrast, more than 50% of the wage earners were congregated in one category, market ing and sales. The business owners were much more evenly distributed among the occupations than the wage earners.
Regarding differences in worker characteristics, Table 5 shows
TABLE 5
ANOVA of Selected Variables by Ownership Status
M e a n s A N O V A
B u s i n e s s o w n e r W a g e earner V a r i a b l e s (n = 670 a) (n = 2 2 9 ~) d f F p
W o r k e r charac ter i s t i c s Age h (years) 44.3 41.5 1 8.75 < .005 Education (years) 13.7 14.4 1 15.25 < .001 Household size 3.4 3.1 1 6.62 < .05 Years in community 20.9 16.6 1 13.53 < .001
W o r k charac ter i s t i c s Hours worked per week 36.22 38.72 1 1.43 = .23 Years in home-based work 9.5 8.2 1 3.71 = .05 Net annua l home-based income $15,706.02 $24,420.28 1 29.99 < .001
aWeighted numbers and means, bObservations t ha t had missing values for age were excluded.
Diane M. Masuo, Rosemary Walker and Marilyn M. Furry 259
that, consistent with the hypothesis, the business owners were, on average, about 3 years older than wage earners. Counter to the pre- diction, however, was the finding tha t wage earners were slightly more educated. The household size of the wage earners was slightly smaller, and they had lived in their communities about four years less than the business owners.
The net annual income from home-based work of business owners was significantly lower than that of wage earners, a difference of al- most $9,000. This finding was contrary to the predicted difference. Some interesting information came to light in exploring this income difference between the two groups. The range of incomes for the busi- ness owners was greater than for the wage earners (0 to $150,000 and 0 to $100,000, respectively). The difference in median income was smaller ($5,000) than the difference in mean income; median income of the business owners was about $9,000 compared to $14,000 for the wage earners.
A major purpose of this research was to compare profiles of busi- ness owners and wage earners. Compared to wage earners, business owners were older, had lived longer in their communities, were more likely to own their homes, to be involved in seasonal work, and to be part-time workers. Although involved in a variety of occupations, the business owners were much less likely than the wage earners to be in market ing and sales occupations. Additionally, their home-based work incomes were considerably lower.
In contrast, wage earners were younger, less likely to be working in seasonal jobs, and more likely to be working full-time. They were more likely to be in market ing and sales jobs, earning, on average, about $9,000 more than their business owner counterparts.
D i s c u s s i o n
This study presents a current profile of a carefully defined group of workers who work primarily at home. Clearly, a majority of these workers are men, are married, and are business owners. Business owners and wage earners differ in several significant worker and work characteristics. The findings tha t the work of business owners is more likely to be seasonal and part-time are consistent with their lower mean incomes. The lower incomes may also be associated with the nature of their predominant occupations (contracting, mechanical and transportation, and services), which can be cyclical and affected
260 Journal of Family and Economic Issues
by weather conditions. Two of the findings seem to be related: the owners have lived in their communities longer and are more likely to be homeowners, which perhaps signifies a degree of community at- tachment. It may be that a successful home-based business relies on community contacts in addition to the need for stability of location, in order to recover the start-up costs associated with business owner- ship.
One major contribution of this study is to dispel predictions by fu- turists, high technology companies, and researchers of white-collar workers (Ambry, 1988; Farmanfarmaian, 1989; Nilles, 1975; Toffier, 1980) that a massive migration of white-collar workers from office to home is occurring. Quite the contrary, this study finds that home- based workers living in the nine states studied (excluding the largest metropolitan areas) are primarily older male business owners who are more likely to work as home maintenance contractors, truck drivers, or house and office cleaners than as home-based clerical workers. Clearly, home-based workers in this study work in a variety of occupations.
Similarities between this data set and others previously cited are found, however. Like Becker (1984) and Heck (1987), this research observes that home-based workers are older than 35. Also confirmed is the finding that more business owners than wage earners are en- gaged in home-based employment (Becker, 1984; Horvath, 1986; Kraut & Grambsch, 1987). As noted by Becker (1984), fewer self-em- ployed persons in the United States work in agricultural than in non- agricultural types of businesses. Only 3.1% of the business owners in this study hold jobs in agricultural products and sales.
Differences are noted between this data set and others. First, un- like Heck (1987), who finds in her 1984 PSID sample that involve- ment in home-based work is associated with a high school education or less, the home-based workers in this study are more highly edu- cated. They have, on average, about 2 years of education beyond high school. This finding, however, may be explained by the fact that Heck's criteria for identifying home-based workers are less restrictive than those used in this research; thus, the samples are not compara- ble.
Second, compared to wage earners, more business owners work part-time rather than full-time. Horvath (1986), using 1985 CPS data, finds opposite results, that more owners work full-time. One possible explanation for the difference is that the largest proportion of business owners in this study work in jobs that may be part-time
Diane M. Masuo, Rosemary Walker and Marilyn M. Furry 261
because of inclement weather. The three most common occupations for the owners are contracting, mechanical and transportation, and services. These involve jobs such as road and construction work, housepainting, bus driving, and snow removal; at least some of these would be affected by severe weather.
A third difference is in the proportion of workers in the nine occu- pations. Horvath (1986) finds that most of his home-based workers have managerial and professional jobs, followed by jobs in the techni- cal, sales, and administrative support fields. On the other hand, the distribution of the 899 home-based workers in this study among the nine occupations is highest in marketing and sales, and next highest in contracting. A possible explanation for this discrepancy is that Horvath's (1986) study uses a more inclusive definition of home-based workers than does this research and therefore tends to include more workers in managerial and professional fields, such as teachers and managers, who take work home from a job usually located elsewhere. Another explanation for the discrepancy between Horvath's (1986) findings and these results is that the classifications of occupational categories used are not exactly comparable.
This research updates the current literature on home-based em- ployment and goes further by providing a profile of a carefully de- fined group of home-based workers and their work situations. By using a precise definition of home-based work, this study is able to focus on a group of workers who, more than others, are impacted by the interface of work and family responsibilities, an area for further study.
Recognizing that business owners and wage earners differ in the terms of their employment and the conditions of their work, the study also compares these groups on selected worker and employment vari- ables. These findings, in particular, will provide base-line data that can be useful to those interested in home-based workers and their work.
References
Ambry, M. (1988). At home in the office. American Demographics, 10(12), 31-33, 61. Becker, E. H. (1984). Self-employed workers: An update to 1983. Monthly Labor Re-
view, 107(7), 14-18. Christensen, K. E. (1985). Women and home-based work. Social Policy, 15(3), 54-57. Christensen, K. E. (1987). A hard day's work in the electronic cottage. Across the
Board, 24(4), 17-23. Christensen, K. E. (1988). Conclusion: Directions for the future. In K.E. Christensen
262 Journal of Family and Economic Issues
(Ed.), The new era of home-based work: Directions and policies (pp. 201-206). Boul- der, CO: Westview. �9
Christensen, K. E. (1989). Home-based clerical work: No simple truth, no single real- ity. In E. Boris & C.R. Daniels (Eds.), Homework: Historical and contemporary perspectives on paid labor at home (pp. 183-197). Urbana: University of Illinois Press.
Dangler, J. (1986). Industrial homework in the modern world-economy. Contemporary Crises, 10, 257-279.
Farmanfarmaian, R. (1989, November). Worksteading: The new lifestyle frontier. Psy- chology Today, 23, 37-38, 42-46.
Foegen, J. H. (1984). Telecommuting: New sweatshop at home computer terminals? Business and Society Review, 51, 52-55.
Gringeri, C. (1990). The nuts and bolts of subsidized development: Industrial home- workers in the heartland. In E. Castle & B. Baldwin (Eds.), Proceedings of the Third Annual Meeting of the National Rural Studies Committee sponsored by W. K. Kellogg Foundation (pp. 81-88). Oregon State University: Western Rural Develop- ment Center.
Heck, R. (1987). A profile of home-based workers. Human Ecology Forum, 16(4), 15-18. Horvath, F. W. (1986). Work at home: New findings from the current population sur-
vey. Monthly Labor Review, 109(11), 31-35. Hukill, C. (1990). Homework. Monthly Labor Review, 113(5), 53-54. Katz, N., & Kemnitzer, D. S. (1984). Women and work in Silicon Valley: Options and
futures. In K. B. Sacks & D. Remy (Eds.), My troubles are going to have trouble with me: Everyday trials and triumphs of women workers (pp. 209-218). New Brunswick, NJ: Rutgers University Press.
Kraut, R. E. (1988). Homework: What is it and who does it? In K.E. Christensen (Ed.), The new era of home-based work: Directions and policies (pp. 30-48). Boulder, CO: Westview.
Kraut, R. E., & Grambsch, P. (1987). Home-based white collar employment: Lessons from the 1980 Census. Social Forces, 66, 410-426.
Lozano, B. (1989). The invisible work force: Transforming American business with out- side and home-based workers. New York: Free.
Nilles, J. (1975). Telecommunications and organization decentralization. IEEE Trans- actions on Communications, Corn-23, 1142-1147.
Pratt, J. (1987). Methodological problems in surveying the homebased workforce. Tech- nological Forecasting and Social Change, 31, 49-60.
SAS Institute, Inc. (1989). SAS/Stat User's Guide (4th ed., Vol. 2). Carey, NC: Author. Silver, H. (1989). The demand for homework: Evidence from the U.S. Census. In E.
Boris & C.R. Daniels (Eds.), Homework: Historical and contemporary perspectives on paid labor at home (pp. 103-129). Urbana: University of Illinois Press.
Stafford, K., Winter, M., Duncan, K. A., & Genalo M. A. (1992). Studying at-home income generation: Issues and methods. Journal of Family and Economic Issues, 13, 139-158.
Toffier, A. (1980). The third wave. New York: Morrow. U.S. Bureau of the Census. (1991). Statistical abstract of the United States 1991 (1 l l th
ed.). Washington, DC: U.S. Government Printing Office. U.S. Department of Commerce., Office of Federal Statistical Policy and Standards
(1980). Standard Occupation Classification Manual. Washington, DC: U.S. Govern- ment Printing Office.
U.S. Department of Labor. (1988). Employment in perspective: Women in the labor force (Third Quarter, Report 75). Washington, DC: U.S. Government Printing Office.
U.S. Department of Labor. (1990). Employment and Earnings, 37(1), 14. U.S. Department of Labor. (1991). Employment in perspective: Women in the labor force
(Third Quarter, Report 816). Washington, DC: U.S. Government Office.


![WORKERS COMPENSATION APPEAL TRIBUNAL WORKER … · 2010-06-22 · WORKERS COMPENSATION APPEAL TRIBUNAL BETWEEN: WORKER CASE ID # [personal information] APPELLANT AND: WORKERS COMPENSATION](https://img.dokumen.tips/doc/110x75/5e685bd4f92e4630d604f412/workers-compensation-appeal-tribunal-worker-2010-06-22-workers-compensation-appeal.jpg)